
The Many Ages of Microbiome–Gut–Brain Axis
by
 , and
, and
Daniela Ratto
1, 
Elisa Roda
2,
Marcello Romeo
1,
Maria Teresa Venuti
1,
Anthea Desiderio
3,
Giuseppe Lupo
3,
Enrica Capelli
3,
Anna Sandionigi
4,5 and
Paola Rossi
1,* 1
Department of Biology and Biotechnology “L. Spallanzani”, University of Pavia, 27100 Pavia, Italy
2
Laboratory of Clinical & Experimental Toxicology, Pavia Poison Centre, National Toxicology Information Centre, Toxicology Unit, Istituti Clinici Scientifici Maugeri IRCCS, 27100 Pavia, Italy
3
Department of Earth and Environmental Sciences, University of Pavia, 27100 Pavia, Italy
4
Department of Biotechnology and Biosciences, University of Milano-Bicocca, 20126 Milan, Italy
5
Quantia Consulting S.r.l., Via Petrarca 20, 22066 Mariano Comense, Italy
*
Author to whom correspondence should be addressed.
Nutrients 2022, 14(14), 2937; https://doi.org/10.3390/nu14142937
Submission received: 8 June 2022
/
Revised: 8 July 2022
/
Accepted: 11 July 2022
/
Published: 18 July 2022
(This article belongs to the Section Geriatric Nutrition)
Abstract
:Frailty during aging is an increasing problem associated with locomotor and cognitive decline, implicated in poor quality of life and adverse health consequences. Considering the microbiome–gut–brain axis, we investigated, in a longitudinal study, whether and how physiological aging affects gut microbiome composition in wild-type male mice, and if and how cognitive frailty is related to gut microbiome composition. To assess these points, we monitored mice during aging at five selected experimental time points, from adulthood to senescence. At all selected experimental times, we monitored cognitive performance using novel object recognition and emergence tests and measured the corresponding Cognitive Frailty Index. Parallelly, murine fecal samples were collected and analyzed to determine the respective alpha and beta diversities, as well as the relative abundance of different bacterial taxa. We demonstrated that physiological aging significantly affected the overall gut microbiome composition, as well as the relative abundance of specific bacterial taxa, including Deferribacterota, Akkermansia, Muribaculaceae, Alistipes, and Clostridia VadinBB60. We also revealed that 218 amplicon sequence variants were significantly associated to the Cognitive Frailty Index. We speculated that some of them may guide the microbiome toward maladaptive and dysbiotic conditions, while others may compensate with changes toward adaptive and eubiotic conditions.

1. Introduction
Aging is a natural process affecting all living organisms, and it is characterized by a deterioration in physiological processes, leading to a higher probability to develop several disorders, i.e., cancer, metabolic, cardiovascular, and neurodegenerative diseases [1,2]. Indeed, aging is characterized by a decline in cognitive and locomotor functions [3]. Among different cognitive performances, the recognition memory has been described as a major component of mammalian and human personality [4,5,6], and it is early and heavily affected during aging.
In the elderly, frailty is defined as a clinical state with an increased vulnerability to stressors, thus exposing the organism to negative health-related outcomes, in the absence of recognized pathologies [7]. Frailty is a multisystem dysregulation leading to decreased physiological reserve [8,9]. Thus, frailty is related to aging, but it does not reflect chronologic age, showing big heterogeneity among subjects [10]. The age-related frailty is principally associated with phenotypic and/or locomotor impairment, both in humans and in animal models [8,11]. Currently, however, more and more attention is paid to the cognitive impairment that occurs during aging, which temporally follows the decline in physical functions in wild-type mice [3]. The development of a frailty score is crucial and necessary to monitor the decline in physiological functions during aging [11].
Further investigations are mandatory to develop strategies to prevent and/or reverse frailty, cognitive impairment, and disability in the elderly [12].
The main cause of aging is usually considered the time-dependent increase in cellular damages [1]. Among others, the most considered biomarkers of aging in mammalians are DNA damage accumulation, apoptosis resistance, genomic instability, telomere shortening, epigenetic alterations, deregulated nutrient sensing, mitochondrial dysfunction, stem cell exhaustion, and altered intercellular communication [1,13,14]. The hallmarks of aging lead to both tissue function decrease and inflammation, in particular in the gastrointestinal system, increasing the predisposition to gut-associated diseases by causing alterations in the gut microbiome composition in elderly people [15]. The aging-related changes in gut physiology contribute to microbiome change, with the disappearance, the persistence, or the outgrowth of several specific microbes. In particular, the aging microbiota appears to be suffering from reduced resilience that can be problematic, but it can also provide an opportunity [16]. Furthermore, changes in microbiota composition during aging could be due to both a maladaptive and dysbiotic or an adaptive and eubiotic condition of the gut microbiome in a delicate balance between inflammaging, immunosenescence, and ecological homeostasis over time. Specifically, an association between aging and frailty and a change in Akkermansiaceae, Lachnospiraceae, Rikenellaceae, and Ruminococcaceae, among others, has been described [16].
In particular, inflammaging, a low-grade chronic inflammation during aging, was recently considered a trigger of the leaky gut and of the gut microbiome dysbiosis which characterize the elderly. According to this, the relative abundance of several microbes in the gut is dependent on cytokine and chemokine levels [16].
In physiological conditions, the human gut is inhabited by mutualistic bacterial, fungal, archaeal, viral, and protozoal communities, which together form the gut microbiome [17,18]. A healthy gut microbiome that dynamically interacts to host contains two predominant phyla, Bacteroidetes and Firmicutes, followed by the Actinobacteria, Proteobacteria, and Verrucomicrobia phyla [19]. Even though the general gut microbial composition remains constant, the gut microbiota exhibits temporal and spatial differences in microorganism distribution during the lifespan [20]. Indeed, several factors, such as host diet, lifestyle, environmental exposure, genotype, and physio-pathological status influence gut microbiome composition which changes dynamically throughout the entire life of a host [21].
This symbiotic and mutualistic superorganism, composed by the microbiome and host, has important effects on host health [20,22,23]. Indeed, increasing interest is focused toward the gut microbiota: the dysbiosis has been associated with several human diseases, such as inflammatory bowel disease (IBD), irritable bowel syndrome (IBS), obesity, diabetes, allergic disorders, and neurodegenerative diseases [18,24,25]. Therefore, intervention on the gut microbiota composition is fundamental to prevent and treat different diseases, including cognitive frailty during aging. Impairment of the microbiota–gut–brain axis has been associated with several disorders, including neuropsychiatric diseases. Hence, mounting evidence supports the hypothesis that gut microbiome dysbiosis is implicated in the onset of cognitive impairment and frailty [10,24,26]. Furthermore, recent studies proposed inflammaging as a critical component in the onset and progression of frailty and demonstrated that the gut microbiota becomes pro-inflammatory over time during aging [10].
Herein, we investigated the intersection of age, the gut microbiome, and cognitive frailty with a longitudinal study in a mouse model of physiological aging. First, we addressed the differences in the gut microbiome in alpha and beta diversities during physiological aging, also describing the changes in the relative abundance of specific bacterial taxa. In parallel, we monitored the Cognitive Frailty Index during aging by using spontaneous behavioral tests for evaluating recognition memory. Finally, we recognized the specific changes in microbiome composition due to the cognitive frailty, and we tried to describe them from a functional point of view.
2. Materials and Methods
2.1. Mice and Behavioral Tests
Fourteen wild-type male mice (C57BL-6J) were obtained from Charles River, Italy. The mice were acclimated to their environmental conditions for one month before starting experiments, which were conducted in the Animal Care Facility at the University of Pavia. The mice were individually housed in plastic cages with an automatically controlled light-dark cycle: the dark period lasted from 07:00 to 19:00 and the light period was from 19:00 to 07:00. Water and food were furnished ad libitum. All experimental protocols and animal handling were carried out in strict conformity with European Council Directive 2010/63/EU and with the guidelines set by the Ethics Committee of Pavia University (Ministry of Health, License number 774/2016-PR).
The murine cognitive performance was studied accessing the knowledge component of recognition memory [6], tested through two spontaneous behavioral tests which consisted of (i) recognizing a new object (namely, novel object recognition (NOR) test) in an open arena or (ii) in exploring a new environment (namely, emergence test) in non-stressful conditions. Emergence and NOR tasks were carried out in accordance with Brandalise et al., 2017 [27]. Concerning the emergence test, the analyzed parameters were latency for the first exit(s), number of exits, and time of exploration(s). Regarding the NOR task, the parameters of interest were the discrimination capabilities (discrimination index, DI) for number and time of approaches. For all selected parameters, we obtained the corresponding Cognitive Frailty Index (FI), then the Cognitive FI related to the test (emergence or NOR), and finally the overall Cognitive FI, as previously reported [3].
In detail, spontaneous behavioral tests in mice were performed at five experimental time points: T0 = 11, T1 = 14, T2 = 17, T3 = 20, and T4 = 21.5 months of age. Notably, T0 and T1 belonged to adulthood, T2 to reproductive senescence, while T3 and T4 occurred during senescence. At the same experimental times, animals were weighed, and the fecal stool samples were collected and stored at −80 °C. The experimental design is summarized here below in Figure 1.
2.2. Bacterial DNA Extraction and 16s rRNA Sequencing
Total microbiota genomic DNA in the mice stools was extracted by using a QIAamp DNA stool mini kit (Qiagen, Dusseldorf, Germany) in accordance with the manufacturer’s instructions. DNA quantification was performed by using Qubit FluorometerTM (Invitrogen, Molecular Probes, USA). Libraries for 16S rDNA amplicons sequencing of the V3 and V4 regions were obtained by using PCR primers containing a barcode (V3 Forward: 5′-CCTACGGGNGGCWGCAG-3′; V4 Reverse: 5′-GACTACHVGGGTATCTAATCC-3′). Furthermore, for preparing the amplicons for the sequencing by MiSeq Illumina, we used the specific forward (V3 F: 5′-TCGTCGGCAGCGTCAGATGTGTATAAGAGACAG-3’) and reverse (V4 R: 5’-GTCTCGTGGGCTCGGAGATGTGTATAAGAGACAG-3’) adapters. Finally, we performed the PCR analysis by using Bio-Rad MJ Mini Personal Thermal Cycle, and PCR amplicons were sequenced by MiSeq Illumina, relying on the BMR Genomics SRL of Padova.
2.3. Illumina Data Processing and Microbiota Characterization
The raw paired-end FASTQ reads were imported into the Quantitative Insights Into Microbial Ecology 2 program (QIIME2, ver. 2020.2.01) [28] and demultiplexed using the native plugin. The Divisive Amplicon Denoising Algorithm 2 (DADA2) [29] was used to quality filter, denoise, and mergepair the data and remove chimeric sequences.
The resulting amplicon sequence variants (ASVs) with less than a 50× coverage were discarded from further analyses. The classification of the obtained ASVs was run using the feature-classifier plugin [30], implemented in QIIME2 against the SILVA SSU non-redundant database (138 release) [31], adopting a consensus confidence threshold of 0.7.
2.4. Data Analysis and Statistics
All data are expressed as mean ± SEM.
The analysis on the bacterial diversity, and the corresponding figures, was performed using the phyloseq R package [32]. Microbiota diversity was described in terms of within (alpha) and between (beta) sample diversities. The Shannon diversity index (SDI) and Faith’s phylogenetic distance (PD) [33] alpha diversity metrics were calculated to estimate the variation of bacterial diversity at the different time points. Values were compared using the pairwise Wilcoxon rank-sum test (WRST) [34] was used pairwise to determine whether the value of a specific metric (Shannon index and Faith’s PD) changed significantly between different time points.
Beta diversity was estimated with quantitative distance metrics using the diversity function in the phyloseq R package. We estimated the Bray-Curtis dissimilarity indices by sampling 10,000 reads per sample [32] based on estimated rarefaction curves (see Supplementary Figure S1).
Variance partitioning and significant Cognitive FI variation over time were determined by performing linear mixed effects (LME) models with the lme4 R package [34].
Variance partitioning and significance of bacterial communities’ diversity variation over time and with respect to the Cognitive FI were determined by performing PERMANOVA test using the Adonis function implemented in the vegan R package. To overcome repeated measures, the variable that describes the mice was defined as strata.
Canonical analysis of principal coordinates (CAP) was computed using the capscale function from the vegan R Package [35,36]. To highlight the relationship between changes in community tolerance and shifts in community composition, a constrained ordination was performed by distance-based redundancy analysis with time, with Cognitive FI as the constraint variable. In addition, we used the unconstrained ordination method (principal coordinate analysis) to visualize patterns in bacterial community compositions. The significance of constraint variables was tested with a permutation test (number of permutations = 10,000) using the ANOVA function implemented in the vegan R package.
The structure of microbial communities was explored by the non-multidimensional scaling (NMDS) ordination approach [37].
The DESeq2 R package [38] was used to identify the bacteria with the most significant changes in ASV differential abundance considering the Cognitive FI. Improvements to the stability and dispersion of the counts (variance) were required before it was possible to calculate the differential abundances for the different species present in the samples being compared. To this end, we used the estimated size factors function in DESeq2 to transform the stabilization of the variance. The differential abundances were measured with the log2foldchange value, and the different conditions were compared using the Wald test with the Benjamini–Hochberg correction (Q parameter = 0.1, FDR < 10%). The differential abundance measurements were statistically significant if the adjusted p-value was <0.05.
The metacoder R package was used to generate tree plots [39].
All the graphical plots were generated by the ggplot2 R package [40]. The method for calculating ellipses is implemented in the ggplot2 package in the stat ellipse function based on John Fox and Sanford Weisberg (2011) [41].
The sequences generated in this study were deposited into the EMBL-EBI database in the PRJEB54046 project.
3. Results
3.1. Sequencing Data Results
We performed a longitudinal study on fourteen mice sampled five times (from T0 to time T4). The gut microbiome of those 70 samples was examined by sequencing of the bacterial 16S rRNA gene. After quality control analysis, sequences of 70 libraries resulted in 1,748,748 million sequence reads, ranging from 564 to 43,360 reads, with a median of 25,801 for a sample (see Supplementary Figure S2). No reads were reported in negative controls. A total of 1458 ASVs were identified.
3.2. Aging Affects Overall Gut Microbiome Composition
Stool profiling revealed large microbiome composition differences over time during the mice lifespans. The alpha diversity (microbial diversity within the sample) changed significantly during physiological aging, but Shannon diversity index (SDI) and Faith’s phylogenetic distance (PD) exhibited opposite behavior (Figure 2).
There was a significant increase in terms of biodiversity observed with Shannon index between time T1 vs. T2 (Wilcoxon rank-sum test (WSRT), p = 0.007) and between T2 vs. T3 (WSRT, p = 0.011); on the contrary, any significant variation was determined between T0 and T1, as well as between T3 and T4 (Table 1 and Table S1). Supplementary Figure S3 reports the Simpson index variation during aging, which showed the same trend as the Shannon index.
Concerning Faith’s PD, which considers phylogenetic information, we observed a decreasing trend, even though a significant variation was perceived only between T3 and T4 (WSRT, p = 0.0002). As regards the other time points, any significant change was measured (Table 1 and Table S1).
To obtain a complete picture of the variation over time of the measured diversity, we estimated the magnitude of change among successive time points by considering the beta diversity, a measure of similarity or dissimilarity of different microbiome communities. As shown in Figure 3 (NMDS based on Bray-Curtis distance matrix; stress value = 0.13), the murine microbiomes were similar at each experimental time but changed over the mice lifespan. This fact determined the identification of five consequential clusters specific for each time (Figure 3). This longitudinal effect of beta diversity modification increased further and further over time, creating a large gap between the T0 and the T4 group (see results in Table 2 and Table S2).
3.3. Detailed Microbiome Composition and Aging Distribution
A total of 1458 ASVs were identified throughout the whole experimental time. Of these, 76% was assigned at least at the phylum level, and specifically, we found 13 phyla, 20 classes, 54 orders, 76, families, and 145 genera.
We recorded a continuum in the phyla taxonomic level during aging. During the entire aging process, the most represented phylum was Bacteroidota followed by Firmicutes (Figure 4A). The greatest changes during aging were the disappearance of the Verrucomicrobiota phylum from 13.84% at T0 to less than 0.01% at T4 and the decrease in Deferribacterota from 4.9% at T1 to 1.2% at T4.
At the family and genus taxonomic levels, the greatest variations in microbiome composition were observed during aging (Figure 4B,C). The most represented families during the entire physiological aging process were Tannerellaceae and Lachnospiraceae, of Bacteroidota and Firmicutes phyla, respectively. Some families underwent a strong variation during physiological aging. In particular, the Akkermansiaceae (Verrucomicrobiota phylum) decreased from 13.86% at T0 to 3.7% at T2 and almost disappeared at T3 and T4. On the contrary, the Muribaculaceae (Bacteroidota phylum) appeared at T3 at a percentage of 5.3% and increased even more to 14.4% at T4.
The most represented genera during the mice lifespan were Parabacteroides (Bacteroidota phylum; Tannerellaceae family) and Lachnospiraceae_NK4A136_group (Firmicutes phylum; Lachnospiraceae family) which did not undergo statistical fluctuations (Figure 4C). The genera Akkermansia (Verrucomicrobiota phylum; Akkermansiaceae family) disappeared between adulthood and senescence (Figure 4C and Figure 5A, respectively), mirroring the variation at the phylum and family level. During senescence (at T3), we witnessed a statistically significant increase in the genus Clostridia_vandinBB60 (Firmicutes phylum; Clostridia family) (from 0.043% at T0 to 4.2% at T4) (Figure 4C and Figure 5B, respectively), paralleled by a similar sized increase of the genus Alistipes (from 4.6% at T0 to 9.8% at T4) (Figure 4C and Figure 5C, respectively), representing the entire Rikenellaceae family (Bacteroidota phylum). Furthermore, Muribaculaceae genera (Bacteroidota phylum, Muribaculaceae family) appeared in senescence (at T3 5.17% and at T4 13.57%, Figure 4C and Figure 5D, respectively). Finally, we perceived a slight and continuing non-significant trend of growth during aging for Colidextribacter (Firmicutes phylum) and Clostridia UCG-014 genera (Firmicutes phylum, Clostridia family) (Figure 4C and Figure 5E,F, respectively).
To investigate in more detail the community structure, we displayed our data as a heat tree map, where it is possible to follow all the taxonomic levels from phyla to species. Furthermore, in the heat tree map, the proportions were subjected to statistical testing. Based on the Wilcoxon rank-sum test, Figure 6 shows the heat tree map describing the different taxa at each experimental time during aging. The size and color of nodes and edges correlate with the abundance of bacteria at each experimental time. The heat tree map describes both the relative changes in sequential time and the whole change between adulthood (T0) and senescence (T4) (Figure 6).
3.4. Aging and Cognitive Frailty Index on Microbiome Composition
We investigated the knowledge component of the recognition memory, which significantly worsened during aging, as previously reported [3]. In particular, by using specific spontaneous behavioral tests (emergence and NOR tasks), we evaluated the mice’s capabilities in distinguishing an environment (emergence task) or an object (NOR task) as familiar or novel, during the aging process. Altogether, the overall Cognitive FI (used for evaluating the cognitive impairment) values significantly increased during physiological aging in wild-type mice (Figure 7), indicating that physiological aging was accompanied by cognitive decline. Remarkably, there was a significant increasing effect of time on Cognitive FI (See Supplementary Table S3 for LME model details), confirming the direct correlation between the Cognitive FI and the aging process.
The next question to address was the possible identification of a frailty microbiome signature during aging. Therefore, we investigated the relationship between the Cognitive Frailty Index and the alpha diversity, evaluated by Shannon (see Supplementary Figure S4) and Faith’s PD indices (Figure 8). Faith’s PD index, but not Shannon index, showed a statistically significant relationship with the Cognitive FI in the performed linear models. In particular, in relation to an increase in the Cognitive FI value (coeff = 6.345, Figure 8, see Table S4 and Figure S4 in Supplementary Materials), a negative correlation in the estimated biodiversity occurred based on Faith’s PD index.
This result was also supported by partial canonical analysis of principal coordinates (CAP analysis, Figure 9). The CAP scale revealed that an advanced state of senescence and a higher Cognitive FI value explained the largest proportion (18.2%, p < 0.001) of the variation in beta diversity (Figure 9).
However, the estimated LME models did not report a significant effect (p value > 0.05) of the Cognitive FI variation on the beta diversity of the microbiomes (see Table S5 in Supplementary Material), probably due to the low sample number.
Furthermore, we applied the DESeq2 algorithm to test for differential abundance in bacterial groups that changed with respect to the Cognitive FI. We found 218 ASVs significantly linked to the variation in the Cognitive FI. Interestingly, the heat map returned different clusters (T0 and T1 versus T2, T3, and T4) in microbiome composition during the mice lifespan, confirming the beta diversity data (Figure 10).
These two identified clusters corresponding to microbiome composition in adulthood and senescence were specifically composed of some bacterial ASVs which were decreasing or that were increasing with physiological aging and frailty. In the discussion section, we address this point with specific comments about those ASVs specifically linked to the Cognitive FI change during the aging process.
4. Discussion
Declarative memory is one of the main features of the human personality, which is the capability to remember an object, a person, or a place previously encountered. The maintenance of the recognition memory capability of declarative memory has a great impact on the elderly social life. Animal and human studies have evidenced the so-called gut–brain axis, in which a crucial role is played by the gut microbiome through a dynamic, complex bidirectional relationship with the host, thus identifying the microbiota–gut–brain axis [15,42].
Elderly people display a different gut microbiome profile compared to healthy adults for multifactorial factors such as lifestyle, nutrition, lower motor capabilities, and reduced immune system functions [15]. Indeed, the gut microbiome is highly sensitive to environmental stimuli and its composition changes during the host lifespan. Animal models allow to minimize most of the differences in epigenetic factors such as, food, light, temperature, humidity, etc. A change in the gut microbiome composition during aging could be due both to a dysbiotic condition and/or to an adaptive mechanism trying to compensate for the dysbiosis. This longitudinal study aimed at investigating (i) the modifications in gut microbiome composition during aging; (ii) the relationship between gut microbiome composition and cognitive decline of recognition memory; and (iii) functional speculation about eubiotic and adaptive or dysbiotic and maladaptive changes during aging.
To achieve those goals, we monitored the gut microbiota composition and the Cognitive Frailty Index (FI) during aging [43]. Previously, we tuned an FI in mice for describing the aging decline of recognition memory by means of a battery of spontaneous behavioral tests that discriminate between the knowledge component and the recall component of the recognition memory [3,6].
The current longitudinal study demonstrated that the overall gut microbiome composition changed during the aging process. Nevertheless, as time went on, Cognitive FI increased, making it extremely difficult to isolate the effects of the two covariants (time and Cognitive FI) on overall gut microbiome composition (alpha and beta diversity levels). Despite this, we described a slight correlation between Cognitive FI and microbiomes (in terms of their taxonomic composition in the different mice examined), and this consideration was partly supported by the results of the CAP scale analysis. The not-significant effect of the LME model used for testing beta diversity in our experimental condition highlighted that it is not possible to use this variable as a predictor of total bacterial diversity. However, in a deeper taxonomic microbiome analysis, it was possible to identify some ASVs that specifically increased or decreased with Cognitive FI variation.
During aging, gut microbiome alpha diversity measures gave opposite results: the Shannon index increased, whereas Faith’s PD index decreased, in senescence. Shannon alpha diversity is sensitive to both the richness and the evenness (the total number of species and their relative abundance in the fecal sample). These data are in agreement with a recent paper [44], describing changes in human gut microbiome composition during aging also associated with healthy or unhealthy conditions.
Faith’s PD index represents the number of phylogenetic tree units and their distance within a sample. Therefore, our results suggest that during the aging process, we were witnessing an increase in the number of ASVs that were phylogenetically more similar in senescence compared to adulthood. We may speculate that, despite the high number of species in the aged mice, the similarity to the taxa level accounts for a lower flexibility from a functional point of view compared to young animals. Confirmation that aging significantly affected the overall microbiota composition also came from the inter-individual variation, estimated through the beta diversity, by a non-multidimensional scaling (NMDS) ordination approach. In fact, we identified five clusters, sequentially expressed and each one specific for each experimental time, thus creating a large gap between the adult and senescent mice microbiome.
The core phyla during aging were Bacteoroidota and Firmicutes: their relative abundance and ratio remained relatively stable throughout the lifespan. Regarding subcore phyla during aging, Verrucomicrobia disappeared between 20–21.5 months, matched by total disappearance of the Akkermansiaceae family and Akkermansia genus. A change in Akkermansia’s relative abundance was associated with metabolic diseases (i.e., diabetes, inflammatory bowel disease, and obesity) [45,46,47] but also with neurodegenerative diseases (i.e., Alzheimer’s and Parkinson’s diseases) [48,49,50]. At the gut level, Akkermansia, regulating the host immune response and reducing local inflammation, helps maintain the integrity of the gut barrier. Furthermore, Akkermansia influences the fat and sugar metabolism [47]. Recently, Ou et al. (2020) [51] and Higarza et al. (2021) [52] demonstrated that Akkermansia could improve cognitive performance in two different preclinical models. In particular, Ou et al. (2020) [51] found that the Akkermansia gavage, in addition to regulating the inflammation and sugar metabolism, significantly reduced the Aβ 40–42 levels in the cerebral cortex and improved the spatial and recognition memory of APP/PS1 mice, a model of Alzheimer’s disease (AD) [51]. Higarza et al. (2021) [52] demonstrated that Akkermansia gavage restored cognitive impairment related to nonalcoholic steatohepatitis in rats [52]. In parallel with the disappearance of Akkermansiaciae, we recorded the appearance of Muribaculaceae (previously known as S24-7). The Muribaculaceae family is one of the major utilizers of mucus-derived monosaccharides in the gut, contributing to SCFA production [53], in particular, propionate [54,55]. The SCFAs have a pivotal role in the host’s homeostasis and physiology, and SCFA concentrations are predictive of the host’s lifespan [54]. Indeed, the Muribaculaceae bacterial family was found as the dominant bacterial taxa in the gut of Spalax leucodon, an exceptional animal model of longevity [53]. Previous works have demonstrated a lower abundance of the Muribaculaceae family in aged mice compared to young animals, and the anti-aging intervention has been shown to partially reverse the gut microbiota composition of elderly mice, also increasing the relative abundance of the Muribaculacea [56,57]. We hypothesized that the increased Muribaculaceae relative abundance during physiological aging suggests a possible adaptive mechanism for the disappearance of the Akkermansia, trying to prevent a possible leaky gut. Next, we demonstrated a significant increase in the Rikenellaceae family during aging. Notably, in our samples, the Alistipes genus represented the entire Rikenellaceae family. Regarding this genus, conflicting data are reported [58], from a pathogenic role in cancer [59] to a preventative role in mental health, such as anxiety and depression [60].
Furthermore, we found a significant increase in Clostridia vadinBB60 between adulthood and senescence. Recently, Juckel and colleagues (2021) [61], in patients with schizophrenia, suggested that an increase in the Clostridia vadinBB60 group could be responsible for the neuroplasticity reduction in the central nervous system (CNS). Therefore, we supposed that the increase in Clostridia vadinBB60 could exert a detrimental effect on cognitive performance during aging.
The relative abundance of some ASVs was significantly associated with Cognitive FI changes. In particular, ASVs belonging to Parabacteroides, Clostridia UCG-014, Oscillibacter, Mucispirillum, Coprostanoligenes, Flavonifractor, Blautia, Monoglobus, Sedis, Lachnoclostridium, Oscillospiraceae_UCG_005, Marvinbryantia, Erysipelotrichaceae, Clostridium sensu stricto 1, Halomonas, Cutibacterium, Ruminococcaceae Candidatus Soleaferrea, Ruminococcaceae incertae sedis, Ruminococcaceae Paludicola, Ruminococcaceae Phocea, and Lachnospiraceae ASF356 significantly decreased in relation with the Cognitive FI increase. On the other hand, ASVs belonging to Ruminococcus, Colidextribacter, Anaerotruncus, Anaeroplasma, Peptococcaceae, Lactobacillus, and Ruminococcaceae incertae sedis increased in parallel to the Cognitive FI increment. We speculated that the increase in health-promoting or the decrease in pathobiont bacteria associated with the Cognitive FI increase could have an adaptive or compensatory role; on the contrary, the increase in unhealthy bacteria and a decrease in healthy bacteria with the FI increase could exert a dysbiotic role (Table 3).
Furthermore, about the other ASVs which decreased or increased, not yet presently described in the present study, any previous literature data are available, to the best of our knowledge, regarding their relationship with both aging and cognitive frailty.
In summary, our data demonstrated that aging significantly affected the overall gut microbiome composition in a complex way, increasing the number of ASVs and decreasing the phylogenetic distance among them. Beta diversity confirmed the presence of different clusters between adult and senescent mice. Cognitive frailty was associated with some specific changes in ASVs. We proposed that some of those ASV modifications could be a challenge in the eubiotic and adaptive direction and the opposite in the dysbiotic and maladaptive direction. The inverse correlation between Faith’s PD index and cognitive frailty suggests that cognitive decline is accompanied by a shrinkage of the gut microbiome functionality. Furthermore, this potential plasticity in the gut microbiome composition paves the way to the use of psychobiotics for prevention of cognitive frailty during aging [131].
Supplementary Materials
The following supporting information can be downloaded at: https://www.mdpi.com/article/10.3390/nu14142937/s1, Figure S1: Rarefaction curve; Figure S2: Number of reads; Figure S3: Simpson index; Figure S4: correlation between Shannon index and Cognitive FI. Table S1: Statistical analysis of the effect of aging on alpha diversity based on Shannon diversity index (on the top) and Faith’s phylogenetic distance (on the bottom), including the comparison among all time points; Table S2: Statistical analysis of the effect of aging on beta diversity based on Bray-Curtis distance matrix, including the comparison among all time points; Table S3: LME used to estimate the effect of time on Cognitive FI; Table S4: LME used to estimate the effect of time and Cognitive FI on Faith’s PD index; Table S5: LME used to estimate the effect of time and Cognitive FI on the beta diversity, based on Bray-Curtis index.
Author Contributions
Conceptualization, P.R., E.C. and E.R.; methodology, A.S., D.R., A.D. and G.L.; software, A.S. and M.T.V.; validation, E.R. and M.R.; formal analysis, A.S. and D.R.; investigation, D.R., A.S. and M.R.; resources, D.R. and A.D.; data curation, D.R. and P.R.; writing—original draft preparation, D.R., A.S. and P.R.; writing—review and editing, E.R.; supervision, E.R. and P.R.; funding acquisition, P.R. All authors have read and agreed to the published version of the manuscript.
Funding
This research was supported by the University of Pavia: Fondi Ricerca Giovani (FRG 2018). This research was also supported by Italian Ministry of Education, University and Research (MIUR): Dipartimenti di Eccellenza Program (2018–2022) Dept. of Biology and Biotechnology “L. Spallanzani”, University of Pavia.
Institutional Review Board Statement
The animal study protocol was approved by the Ethics Committee of the University of Pavia (Ministry of Health, license number 774/2016-PR, 4 August 2018).
Data Availability Statement
The sequences that were generated in this study have been deposited into the EMBL-EBI database in PRJEB54046 project.
Acknowledgments
The authors wish to thank (i) the animal facility “Centro di servizio per la gestione unificata delle attività di stabulazione e di radiobiologia”, University of Pavia, for hosting the animals; (ii) the OPBA of the University of Pavia for support in drawing up the animal protocol, and (iii) Bromatech for supporting the post-doc position of Daniela Ratto, PhD.
Conflicts of Interest
The authors declare no conflict of interest.
References
- López-Otín, C.; Blasco, M.A.; Partridge, L.; Serrano, M.; Kroemer, G. The Hallmarks of Aging. Cell 2013, 153, 1194–1217. [Google Scholar] [CrossRef] [PubMed] [Green Version]
- Bana, B.; Cabreiro, F. The Microbiome and Aging. Annu. Rev. Genet. 2019, 53, 239–261. [Google Scholar] [CrossRef] [PubMed]
- Ratto, D.; Corana, F.; Mannucci, B.; Priori, E.C.; Cobelli, F.; Roda, E.; Ferrari, B.; Occhinegro, A.; Di Iorio, C.; De Luca, F.; et al. Hericium Erinaceus Improves Recognition Memory and Induces Hippocampal and Cerebellar Neurogenesis in Frail Mice during Aging. Nutrients 2019, 11, 715. [Google Scholar] [CrossRef] [Green Version]
- Burke, S.N.; Ryan, L.; Barnes, C.A. Characterizing Cognitive Aging of Recognition Memory and Related Processes in Animal Models and in Humans. Front. Aging Neurosci. 2012, 4, 15. [Google Scholar] [CrossRef] [Green Version]
- Turriziani, P.; Serra, L.; Fadda, L.; Caltagirone, C.; Carlesimo, G.A. Recollection and Familiarity in Hippocampal Amnesia. Hippocampus 2008, 18, 469–480. [Google Scholar] [CrossRef] [PubMed]
- Rossi, P.; Cesaroni, V.; Brandalise, F.; Occhinegro, A.; Ratto, D.; Perrucci, F.; Lanaia, V.; Girometta, C.; Orrù, G.; Savino, E. Dietary Supplementation of Lion’s Mane Medicinal Mushroom, Hericium erinaceus (Agaricomycetes), and Spatial Memory in Wild-Type Mice. Int. J. Med. Mushrooms 2018, 20, 485–494. [Google Scholar] [CrossRef]
- Cesari, M.; Calvani, R.; Marzetti, E. Frailty in Older Persons. Clin. Geriatr. Med. 2017, 33, 293–303. [Google Scholar] [CrossRef] [PubMed]
- Fried, L.P.; Tangen, C.M.; Walston, J.; Newman, A.B.; Hirsch, C.; Gottdiener, J.; Seeman, T.; Tracy, R.; Kop, W.J.; Burke, G.; et al. Frailty in Older Adults: Evidence for a Phenotype. J. Gerontol. A Biol. Sci. Med. Sci. 2001, 56, M146–M156. [Google Scholar] [CrossRef]
- Bandeen-Roche, K.; Xue, Q.-L.; Ferrucci, L.; Walston, J.; Guralnik, J.M.; Chaves, P.; Zeger, S.L.; Fried, L.P. Phenotype of Frailty: Characterization in the Women’s Health and Aging Studies. J. Gerontol. A Biol. Sci. Med. Sci. 2006, 61, 262–266. [Google Scholar] [CrossRef] [Green Version]
- Piggott, D.A.; Tuddenham, S. The Gut Microbiome and Frailty. Transl. Res. 2020, 221, 23–43. [Google Scholar] [CrossRef] [PubMed]
- Gomez-Cabrera, M.C.; Garcia-Valles, R.; Rodriguez-Mañas, L.; Garcia-Garcia, F.J.; Olaso-Gonzalez, G.; Salvador-Pascual, A.; Tarazona-Santabalbina, F.J.; Viña, J. A New Frailty Score for Experimental Animals Based on the Clinical Phenotype: Inactivity as a Model of Frailty. J. Gerontol. A Biol. Sci. Med. Sci. 2017, 72, 885–891. [Google Scholar] [CrossRef] [PubMed] [Green Version]
- Arai, H.; Satake, S.; Kozaki, K. Cognitive Frailty in Geriatrics. Clin. Geriatr. Med. 2018, 34, 667–675. [Google Scholar] [CrossRef] [PubMed]
- Hernandez-Segura, A.; Nehme, J.; Demaria, M. Hallmarks of Cellular Senescence. Trends Cell. Biol. 2018, 28, 436–453. [Google Scholar] [CrossRef] [PubMed]
- Wen, J.; Wang, Y.; Yuan, M.; Huang, Z.; Zou, Q.; Pu, Y.; Zhao, B.; Cai, Z. Role of Mismatch Repair in Aging. Int. J. Biol. Sci. 2021, 17, 3923–3935. [Google Scholar] [CrossRef]
- Nagpal, R.; Mainali, R.; Ahmadi, S.; Wang, S.; Singh, R.; Kavanagh, K.; Kitzman, D.W.; Kushugulova, A.; Marotta, F.; Yadav, H. Gut Microbiome and Aging: Physiological and Mechanistic Insights. Nutr. Healthy Aging 2018, 4, 267–285. [Google Scholar] [CrossRef] [Green Version]
- DeJong, E.N.; Surette, M.G.; Bowdish, D.M.E. The Gut Microbiota and Unhealthy Aging: Disentangling Cause from Consequence. Cell Host Microbe 2020, 28, 180–189. [Google Scholar] [CrossRef]
- Guarner, F.; Malagelada, J.-R. Gut Flora in Health and Disease. Lancet 2003, 361, 512–519. [Google Scholar] [CrossRef]
- Jandhyala, S.M.; Talukdar, R.; Subramanyam, C.; Vuyyuru, H.; Sasikala, M.; Nageshwar Reddy, D. Role of the Normal Gut Microbiota. World J. Gastroenterol. 2015, 21, 8787–8803. [Google Scholar] [CrossRef]
- Shortt, C.; Hasselwander, O.; Meynier, A.; Nauta, A.; Fernández, E.N.; Putz, P.; Rowland, I.; Swann, J.; Türk, J.; Vermeiren, J.; et al. Systematic Review of the Effects of the Intestinal Microbiota on Selected Nutrients and Non-Nutrients. Eur. J. Nutr. 2018, 57, 25–49. [Google Scholar] [CrossRef] [Green Version]
- Bäckhed, F.; Ley, R.E.; Sonnenburg, J.L.; Peterson, D.A.; Gordon, J.I. Host-Bacterial Mutualism in the Human Intestine. Science 2005, 307, 1915–1920. [Google Scholar] [CrossRef] [Green Version]
- Turnbaugh, P.J.; Ley, R.E.; Hamady, M.; Fraser-Liggett, C.M.; Knight, R.; Gordon, J.I. The Human Microbiome Project. Nature 2007, 449, 804–810. [Google Scholar] [CrossRef] [PubMed]
- Quigley, E.M.M. Gut Bacteria in Health and Disease. Gastroenterol. Hepatol. 2013, 9, 560–569. [Google Scholar]
- Clemente, J.C.; Ursell, L.K.; Parfrey, L.W.; Knight, R. The Impact of the Gut Microbiota on Human Health: An Integrative View. Cell 2012, 148, 1258–1270. [Google Scholar] [CrossRef] [PubMed] [Green Version]
- La Rosa, F.; Clerici, M.; Ratto, D.; Occhinegro, A.; Licito, A.; Romeo, M.; Iorio, C.D.; Rossi, P. The Gut-Brain Axis in Alzheimer’s Disease and Omega-3. A Critical Overview of Clinical Trials. Nutrients 2018, 10, 1267. [Google Scholar] [CrossRef] [Green Version]
- Marizzoni, M.; Provasi, S.; Cattaneo, A.; Frisoni, G.B. Microbiota and Neurodegenerative Diseases. Curr. Opin. Neurol. 2017, 30, 630–638. [Google Scholar] [CrossRef]
- Ticinesi, A.; Tana, C.; Nouvenne, A.; Prati, B.; Lauretani, F.; Meschi, T. Gut Microbiota, Cognitive Frailty and Dementia in Older Individuals: A Systematic Review. Clin. Interv. Aging 2018, 13, 1497–1511. [Google Scholar] [CrossRef] [Green Version]
- Brandalise, F.; Cesaroni, V.; Gregori, A.; Repetti, M.; Romano, C.; Orrù, G.; Botta, L.; Girometta, C.; Guglielminetti, M.L.; Savino, E.; et al. Dietary Supplementation of Hericium Erinaceus Increases Mossy Fiber-CA3 Hippocampal Neurotransmission and Recognition Memory in Wild-Type Mice. Evid. Based Complement. Alternat. Med. 2017, 2017, 3864340. [Google Scholar] [CrossRef] [Green Version]
- Bolyen, E.; Rideout, J.R.; Dillon, M.R.; Bokulich, N.A.; Abnet, C.C.; Al-Ghalith, G.A.; Alexander, H.; Alm, E.J.; Arumugam, M.; Asnicar, F.; et al. Reproducible, Interactive, Scalable and Extensible Microbiome Data Science Using QIIME 2. Nat. Biotechnol. 2019, 37, 852–857. [Google Scholar] [CrossRef]
- Callahan, B.J.; McMurdie, P.J.; Rosen, M.J.; Han, A.W.; Johnson, A.J.A.; Holmes, S.P. DADA2: High-Resolution Sample Inference from Illumina Amplicon Data. Nat. Methods 2016, 13, 581–583. [Google Scholar] [CrossRef] [Green Version]
- Bokulich, N.A.; Kaehler, B.D.; Rideout, J.R.; Dillon, M.; Bolyen, E.; Knight, R.; Huttley, G.A.; Gregory Caporaso, J. Optimizing Taxonomic Classification of Marker-Gene Amplicon Sequences with QIIME 2’s Q2-Feature-Classifier Plugin. Microbiome 2018, 6, 90. [Google Scholar] [CrossRef]
- Quast, C.; Pruesse, E.; Yilmaz, P.; Gerken, J.; Schweer, T.; Yarza, P.; Peplies, J.; Glöckner, F.O. The SILVA Ribosomal RNA Gene Database Project: Improved Data Processing and Web-Based Tools. Nucleic Acids Res. 2013, 41, D590–D596. [Google Scholar] [CrossRef] [PubMed]
- McMurdie, P.J.; Holmes, S. Phyloseq: An R Package for Reproducible Interactive Analysis and Graphics of Microbiome Census Data. PLoS ONE 2013, 8, e61217. [Google Scholar] [CrossRef] [PubMed] [Green Version]
- Faith, D.P. Science and Philosophy for Molecular Systematics: Which Is the Cart and Which Is the Horse? Mol. Phylogenet. Evol. 2006, 38, 553–557. [Google Scholar] [CrossRef] [PubMed]
- Cuzick, J. A Wilcoxon-Type Test for Trend. Stat. Med. 1985, 4, 87–90. [Google Scholar] [CrossRef] [PubMed]
- Vegan: Community Ecology Package. R Package Vegan, Vers. 2.2-1. Available online: https://www.worldagroforestry.org/publication/vegan-community-ecology-package-r-package-vegan-vers-22-1 (accessed on 5 April 2022).
- Anderson, M.J.; Willis, T.J. Canonical Analysis of Principal Coordinates: A Useful Method of Constrained Ordination for Ecology. Ecology 2003, 84, 511–525. [Google Scholar] [CrossRef]
- Kruskal, J.B. Multidimensional Scaling by Optimizing Goodness of Fit to a Nonmetric Hypothesis. Psychometrika 1964, 29, 1–27. [Google Scholar] [CrossRef]
- Love, M.I.; Huber, W.; Anders, S. Moderated Estimation of Fold Change and Dispersion for RNA-Seq Data with DESeq2. Genome Biol. 2014, 15, 550. [Google Scholar] [CrossRef] [Green Version]
- Foster, Z.S.L.; Sharpton, T.J.; Grünwald, N.J. Metacoder: An R Package for Visualization and Manipulation of Community Taxonomic Diversity Data. PLoS Comput. Biol. 2017, 13, e1005404. [Google Scholar] [CrossRef] [Green Version]
- Ggplot2: Create Elegant Data Visualisations Using the Grammar of Graphics—Ggplot2-Package. Available online: https://ggplot2.tidyverse.org/reference/ggplot2-package.html (accessed on 7 July 2022).
- Fox, J.; Weisberg, S. An R Companion to Applied Regression; SAGE Publications: Thousand Oaks, CA, USA, 2011; ISBN 9781412975148. [Google Scholar]
- O’Toole, P.W.; Jeffery, I.B. Gut Microbiota and Aging. Science 2015, 350, 1214–1215. [Google Scholar] [CrossRef]
- Santoro, A.; Ostan, R.; Candela, M.; Biagi, E.; Brigidi, P.; Capri, M.; Franceschi, C. Gut Microbiota Changes in the Extreme Decades of Human Life: A Focus on Centenarians. Cell Mol. Life Sci. 2018, 75, 129–148. [Google Scholar] [CrossRef] [Green Version]
- Wilmanski, T.; Diener, C.; Rappaport, N.; Patwardhan, S.; Wiedrick, J.; Lapidus, J.; Earls, J.C.; Zimmer, A.; Glusman, G.; Robinson, M.; et al. Gut Microbiome Pattern Reflects Healthy Ageing and Predicts Survival in Humans. Nat. Metab. 2021, 3, 274–286. [Google Scholar] [CrossRef] [PubMed]
- Derrien, M.; Belzer, C.; de Vos, W.M. Akkermansia muciniphila and Its Role in Regulating Host Functions. Microb. Pathog. 2017, 106, 171–181. [Google Scholar] [CrossRef] [PubMed] [Green Version]
- Naito, Y.; Uchiyama, K.; Takagi, T. A Next-Generation Beneficial Microbe: Akkermansia muciniphila. J. Clin. Biochem. Nutr. 2018, 63, 33–35. [Google Scholar] [CrossRef] [PubMed] [Green Version]
- Macchione, I.G.; Lopetuso, L.R.; Ianiro, G.; Napoli, M.; Gibiino, G.; Rizzatti, G.; Petito, V.; Gasbarrini, A.; Scaldaferri, F. Akkermansia muciniphila: Key Player in Metabolic and Gastrointestinal Disorders. Eur. Rev. Med. Pharmacol. Sci. 2019, 23, 8075–8083. [Google Scholar] [CrossRef]
- Gerhardt, S.; Mohajeri, M.H. Changes of Colonic Bacterial Composition in Parkinson’s Disease and Other Neurodegenerative Diseases. Nutrients 2018, 10, 708. [Google Scholar] [CrossRef] [Green Version]
- Heintz-Buschart, A.; Pandey, U.; Wicke, T.; Sixel-Döring, F.; Janzen, A.; Sittig-Wiegand, E.; Trenkwalder, C.; Oertel, W.H.; Mollenhauer, B.; Wilmes, P. The Nasal and Gut Microbiome in Parkinson’s Disease and Idiopathic Rapid Eye Movement Sleep Behavior Disorder. Mov. Disord. 2018, 33, 88–98. [Google Scholar] [CrossRef] [Green Version]
- Nishiwaki, H.; Ito, M.; Ishida, T.; Hamaguchi, T.; Maeda, T.; Kashihara, K.; Tsuboi, Y.; Ueyama, J.; Shimamura, T.; Mori, H.; et al. Meta-Analysis of Gut Dysbiosis in Parkinson’s Disease. Mov. Disord. 2020, 35, 1626–1635. [Google Scholar] [CrossRef]
- Ou, Z.; Deng, L.; Lu, Z.; Wu, F.; Liu, W.; Huang, D.; Peng, Y. Protective Effects of Akkermansia muciniphila on Cognitive Deficits and Amyloid Pathology in a Mouse Model of Alzheimer’s Disease. Nutr. Diabetes 2020, 10, 12. [Google Scholar] [CrossRef] [Green Version]
- Higarza, S.G.; Arboleya, S.; Arias, J.L.; Gueimonde, M.; Arias, N. Akkermansia muciniphila and Environmental Enrichment Reverse Cognitive Impairment Associated with High-Fat High-Cholesterol Consumption in Rats. Gut Microbes 2021, 13, 1–20. [Google Scholar] [CrossRef]
- Sibai, M.; Altuntaş, E.; Yıldırım, B.; Öztürk, G.; Yıldırım, S.; Demircan, T. Microbiome and Longevity: High Abundance of Longevity-Linked Muribaculaceae in the Gut of the Long-Living Rodent Spalax Leucodon. OMICS 2020, 24, 592–601. [Google Scholar] [CrossRef]
- Smith, B.J.; Miller, R.A.; Ericsson, A.C.; Harrison, D.C.; Strong, R.; Schmidt, T.M. Changes in the Gut Microbiome and Fermentation Products Concurrent with Enhanced Longevity in Acarbose-Treated Mice. BMC Microbiol. 2019, 19, 130. [Google Scholar] [CrossRef] [PubMed] [Green Version]
- Pereira, F.C.; Wasmund, K.; Cobankovic, I.; Jehmlich, N.; Herbold, C.W.; Lee, K.S.; Sziranyi, B.; Vesely, C.; Decker, T.; Stocker, R.; et al. Rational Design of a Microbial Consortium of Mucosal Sugar Utilizers Reduces Clostridiodes Difficile Colonization. Nat. Commun. 2020, 11, 5104. [Google Scholar] [CrossRef] [PubMed]
- Han, D.; Li, Z.; Liu, T.; Yang, N.; Li, Y.; He, J.; Qian, M.; Kuang, Z.; Zhang, W.; Ni, C.; et al. Prebiotics Regulation of Intestinal Microbiota Attenuates Cognitive Dysfunction Induced by Surgery Stimulation in APP/PS1 Mice. Aging Dis. 2020, 11, 1029–1045. [Google Scholar] [CrossRef] [PubMed]
- Shenghua, P.; Ziqin, Z.; Shuyu, T.; Huixia, Z.; Xianglu, R.; Jiao, G. An Integrated Fecal Microbiome and Metabolome in the Aged Mice Reveal Anti-Aging Effects from the Intestines and Biochemical Mechanism of FuFang Zhenshu TiaoZhi(FTZ). Biomed. Pharmacother. 2020, 121, 109421. [Google Scholar] [CrossRef]
- Parker, B.J.; Wearsch, P.A.; Veloo, A.C.M.; Rodriguez-Palacios, A. The Genus Alistipes: Gut Bacteria With Emerging Implications to Inflammation, Cancer, and Mental Health. Front. Immunol. 2020, 11, 906. [Google Scholar] [CrossRef] [PubMed]
- Yang, Y.; Jobin, C. Novel Insights into Microbiome in Colitis and Colorectal Cancer. Curr. Opin. Gastroenterol. 2017, 33, 422–427. [Google Scholar] [CrossRef]
- Naseribafrouei, A.; Hestad, K.; Avershina, E.; Sekelja, M.; Linløkken, A.; Wilson, R.; Rudi, K. Correlation between the Human Fecal Microbiota and Depression. Neurogastroenterol. Motil. 2014, 26, 1155–1162. [Google Scholar] [CrossRef]
- Juckel, G.; Manitz, M.-P.; Freund, N.; Gatermann, S. Impact of Poly I:C Induced Maternal Immune Activation on Offspring’s Gut Microbiome Diversity—Implications for Schizophrenia. Prog. Neuropsychopharmacol. Biol. Psychiatry 2021, 110, 110306. [Google Scholar] [CrossRef]
- Ezeji, J.C.; Sarikonda, D.K.; Hopperton, A.; Erkkila, H.L.; Cohen, D.E.; Martinez, S.P.; Cominelli, F.; Kuwahara, T.; Dichosa, A.E.K.; Good, C.E.; et al. Parabacteroides Distasonis: Intriguing Aerotolerant Gut Anaerobe with Emerging Antimicrobial Resistance and Pathogenic and Probiotic Roles in Human Health. Gut Microbes 2021, 13, 1922241. [Google Scholar] [CrossRef]
- Wang, K.; Liao, M.; Zhou, N.; Bao, L.; Ma, K.; Zheng, Z.; Wang, Y.; Liu, C.; Wang, W.; Wang, J.; et al. Parabacteroides Distasonis Alleviates Obesity and Metabolic Dysfunctions via Production of Succinate and Secondary Bile Acids. Cell Rep. 2019, 26, 222–235.e5. [Google Scholar] [CrossRef] [Green Version]
- Chang, C.-J.; Lin, T.-L.; Tsai, Y.-L.; Wu, T.-R.; Lai, W.-F.; Lu, C.-C.; Lai, H.-C. Next Generation Probiotics in Disease Amelioration. J. Food Drug Anal. 2019, 27, 615–622. [Google Scholar] [CrossRef] [PubMed]
- Wang, Y.; Nan, X.; Zhao, Y.; Jiang, L.; Wang, H.; Zhang, F.; Hua, D.; Liu, J.; Yao, J.; Yang, L.; et al. Dietary Supplementation of Inulin Ameliorates Subclinical Mastitis via Regulation of Rumen Microbial Community and Metabolites in Dairy Cows. Microbiol. Spectr. 2021, 9, e0010521. [Google Scholar] [CrossRef] [PubMed]
- Liu, Y.; Zhou, M.; Yang, M.; Jin, C.; Song, Y.; Chen, J.; Gao, M.; Ai, Z.; Su, D. Pulsatilla Chinensis Saponins Ameliorate Inflammation and DSS-Induced Ulcerative Colitis in Rats by Regulating the Composition and Diversity of Intestinal Flora. Front. Cell Infect. Microbiol. 2021, 11, 728929. [Google Scholar] [CrossRef] [PubMed]
- Zhao, J.-D.; Li, Y.; Sun, M.; Yu, C.-J.; Li, J.-Y.; Wang, S.-H.; Yang, D.; Guo, C.-L.; Du, X.; Zhang, W.-J.; et al. Effect of Berberine on Hyperglycaemia and Gut Microbiota Composition in Type 2 Diabetic Goto-Kakizaki Rats. World J. Gastroenterol. 2021, 27, 708–724. [Google Scholar] [CrossRef]
- Lee, D.-Y.; Shin, Y.-J.; Kim, J.-K.; Jang, H.-M.; Joo, M.-K.; Kim, D.-H. Alleviation of Cognitive Impairment by Gut Microbiota Lipopolysaccharide Production-Suppressing Lactobacillus plantarum and Bifidobacterium longum in Mice. Food Funct. 2021, 12, 10750–10763. [Google Scholar] [CrossRef]
- Barandouzi, Z.A.; Starkweather, A.R.; Henderson, W.A.; Gyamfi, A.; Cong, X.S. Altered Composition of Gut Microbiota in Depression: A Systematic Review. Front. Psychiatry 2020, 11, 541. [Google Scholar] [CrossRef]
- Thingholm, L.B.; Rühlemann, M.C.; Koch, M.; Fuqua, B.; Laucke, G.; Boehm, R.; Bang, C.; Franzosa, E.A.; Hübenthal, M.; Rahnavard, A.; et al. Obese Individuals with and without Type 2 Diabetes Show Different Gut Microbial Functional Capacity and Composition. Cell Host Microbe 2019, 26, 252–264.e10. [Google Scholar] [CrossRef]
- Tran, T.T.T.; Cousin, F.J.; Lynch, D.B.; Menon, R.; Brulc, J.; Brown, J.R.-M.; O’Herlihy, E.; Butto, L.F.; Power, K.; Jeffery, I.B.; et al. Prebiotic Supplementation in Frail Older People Affects Specific Gut Microbiota Taxa but Not Global Diversity. Microbiome 2019, 7, 39. [Google Scholar] [CrossRef]
- Wei, J.; Zhao, Y.; Zhou, C.; Zhao, Q.; Zhong, H.; Zhu, X.; Fu, T.; Pan, L.; Shang, Q.; Yu, G. Dietary Polysaccharide from Enteromorpha Clathrata Attenuates Obesity and Increases the Intestinal Abundance of Butyrate-Producing Bacterium, Eubacterium xylanophilum, in Mice Fed a High-Fat Diet. Polymers 2021, 13, 3286. [Google Scholar] [CrossRef]
- Li, K.; Zhang, L.; Xue, J.; Yang, X.; Dong, X.; Sha, L.; Lei, H.; Zhang, X.; Zhu, L.; Wang, Z.; et al. Dietary Inulin Alleviates Diverse Stages of Type 2 Diabetes Mellitus via Anti-Inflammation and Modulating Gut Microbiota in Db/Db Mice. Food Funct. 2019, 10, 1915–1927. [Google Scholar] [CrossRef]
- Shintouo, C.M.; Mets, T.; Beckwee, D.; Bautmans, I.; Ghogomu, S.M.; Souopgui, J.; Leemans, L.; Meriki, H.D.; Njemini, R. Is Inflammageing Influenced by the Microbiota in the Aged Gut? A Systematic Review. Exp. Gerontol. 2020, 141, 111079. [Google Scholar] [CrossRef] [PubMed]
- Lyu, Z.; Ghoshdastidar, S.; Rekha, K.R.; Suresh, D.; Mao, J.; Bivens, N.; Kannan, R.; Joshi, T.; Rosenfeld, C.S.; Upendran, A. Developmental Exposure to Silver Nanoparticles Leads to Long Term Gut Dysbiosis and Neurobehavioral Alterations. Sci. Rep. 2021, 11, 6558. [Google Scholar] [CrossRef] [PubMed]
- Ren, D.; Li, L.; Schwabacher, A.W.; Young, J.W.; Beitz, D.C. Mechanism of Cholesterol Reduction to Coprostanol by Eubacterium Coprostanoligenes ATCC 51222. Steroids 1996, 61, 33–40. [Google Scholar] [CrossRef]
- Liu, R.T.; Rowan-Nash, A.D.; Sheehan, A.E.; Walsh, R.F.L.; Sanzari, C.M.; Korry, B.J.; Belenky, P. Reductions in Anti-Inflammatory Gut Bacteria Are Associated with Depression in a Sample of Young Adults. Brain Behav. Immun. 2020, 88, 308–324. [Google Scholar] [CrossRef]
- Bai, D.; Sun, T.; Zhao, J.; Du, J.; Bu, X.; Cao, W.; Zhao, Y.; Lu, N. Oroxylin A Maintains the Colonic Mucus Barrier to Reduce Disease Susceptibility by Reconstituting a Dietary Fiber-Deprived Gut Microbiota. Cancer Lett. 2021, 515, 73–85. [Google Scholar] [CrossRef] [PubMed]
- Arias-Jayo, N.; Abecia, L.; Alonso-Sáez, L.; Ramirez-Garcia, A.; Rodriguez, A.; Pardo, M.A. High-Fat Diet Consumption Induces Microbiota Dysbiosis and Intestinal Inflammation in Zebrafish. Microb. Ecol. 2018, 76, 1089–1101. [Google Scholar] [CrossRef]
- Jiang, H.; Ling, Z.; Zhang, Y.; Mao, H.; Ma, Z.; Yin, Y.; Wang, W.; Tang, W.; Tan, Z.; Shi, J.; et al. Altered Fecal Microbiota Composition in Patients with Major Depressive Disorder. Brain Behav. Immun. 2015, 48, 186–194. [Google Scholar] [CrossRef] [Green Version]
- Zhang, Q.; Yun, Y.; An, H.; Zhao, W.; Ma, T.; Wang, Z.; Yang, F. Gut Microbiome and Daytime Function in Chinese Patients with Major Depressive Disorder. J. Psychosom. Res. 2022, 157, 110787. [Google Scholar] [CrossRef]
- Mikami, A.; Ogita, T.; Namai, F.; Shigemori, S.; Sato, T.; Shimosato, T. Oral Administration of Flavonifractor Plautii, a Bacteria Increased With Green Tea Consumption, Promotes Recovery From Acute Colitis in Mice via Suppression of IL-17. Front. Nutr. 2020, 7, 610946. [Google Scholar] [CrossRef]
- Liu, X.; Mao, B.; Gu, J.; Wu, J.; Cui, S.; Wang, G.; Zhao, J.; Zhang, H.; Chen, W. Blautia-a New Functional Genus with Potential Probiotic Properties? Gut Microbes 2021, 13, 1–21. [Google Scholar] [CrossRef]
- Verhaar, B.J.H.; Hendriksen, H.M.A.; de Leeuw, F.A.; Doorduijn, A.S.; van Leeuwenstijn, M.; Teunissen, C.E.; Barkhof, F.; Scheltens, P.; Kraaij, R.; van Duijn, C.M.; et al. Gut Microbiota Composition Is Related to AD Pathology. Front. Immunol. 2021, 12, 794519. [Google Scholar] [CrossRef]
- Yutin, N.; Galperin, M.Y. A Genomic Update on Clostridial Phylogeny: Gram-Negative Spore Formers and Other Misplaced Clostridia. Environ. Microbiol. 2013, 15, 2631–2641. [Google Scholar] [CrossRef] [PubMed]
- Dandachi, I.; Anani, H.; Hadjadj, L.; Brahimi, S.; Lagier, J.-C.; Daoud, Z.; Rolain, J.-M. Genome Analysis of Lachnoclostridium Phocaeense Isolated from a Patient after Kidney Transplantation in Marseille. New Microbes New Infect. 2021, 41, 100863. [Google Scholar] [CrossRef] [PubMed]
- Chen, L.-H.; Wang, M.-F.; Chang, C.-C.; Huang, S.-Y.; Pan, C.-H.; Yeh, Y.-T.; Huang, C.-H.; Chan, C.-H.; Huang, H.-Y. Lacticaseibacillus Paracasei PS23 Effectively Modulates Gut Microbiota Composition and Improves Gastrointestinal Function in Aged SAMP8 Mice. Nutrients 2021, 13, 1116. [Google Scholar] [CrossRef] [PubMed]
- Jena, P.K.; Sheng, L.; Nguyen, M.; Di Lucente, J.; Hu, Y.; Li, Y.; Maezawa, I.; Jin, L.-W.; Wan, Y.-J.Y. Dysregulated Bile Acid Receptor-Mediated Signaling and IL-17A Induction Are Implicated in Diet-Associated Hepatic Health and Cognitive Function. Biomark Res. 2020, 8, 59. [Google Scholar] [CrossRef]
- Bäuerl, C.; Collado, M.C.; Diaz Cuevas, A.; Viña, J.; Pérez Martínez, G. Shifts in Gut Microbiota Composition in an APP/PSS1 Transgenic Mouse Model of Alzheimer’s Disease during Lifespan. Lett. Appl. Microbiol. 2018, 66, 464–471. [Google Scholar] [CrossRef]
- Lawson, P.A.; Citron, D.M.; Tyrrell, K.L.; Finegold, S.M. Reclassification of Clostridium Difficile as Clostridioides Difficile (Hall and O’Toole 1935) Prévot 1938. Anaerobe 2016, 40, 95–99. [Google Scholar] [CrossRef]
- Dürre, P. Physiology and Sporulation in Clostridium. Microbiol. Spectr. 2014, 2, TBS-0010-2012. [Google Scholar] [CrossRef] [Green Version]
- Zhao, Q.; Yang, W.-R.; Wang, X.-H.; Li, G.-Q.; Xu, L.-Q.; Cui, X.; Liu, Y.; Zuo, X.-L. Clostridium Butyricum Alleviates Intestinal Low-Grade Inflammation in TNBS-Induced Irritable Bowel Syndrome in Mice by Regulating Functional Status of Lamina Propria Dendritic Cells. World J. Gastroenterol. 2019, 25, 5469–5482. [Google Scholar] [CrossRef]
- Kashiwagi, I.; Morita, R.; Schichita, T.; Komai, K.; Saeki, K.; Matsumoto, M.; Takeda, K.; Nomura, M.; Hayashi, A.; Kanai, T.; et al. Smad2 and Smad3 Inversely Regulate TGF-β Autoinduction in Clostridium Butyricum-Activated Dendritic Cells. Immunity 2015, 43, 65–79. [Google Scholar] [CrossRef] [Green Version]
- Rom, O.; Liu, Y.; Liu, Z.; Zhao, Y.; Wu, J.; Ghrayeb, A.; Villacorta, L.; Fan, Y.; Chang, L.; Wang, L.; et al. Glycine-Based Treatment Ameliorates NAFLD by Modulating Fatty Acid Oxidation, Glutathione Synthesis, and the Gut Microbiome. Sci. Transl. Med. 2020, 12, eaaz2841. [Google Scholar] [CrossRef]
- Zeng, Q.; Li, D.; He, Y.; Li, Y.; Yang, Z.; Zhao, X.; Liu, Y.; Wang, Y.; Sun, J.; Feng, X.; et al. Discrepant Gut Microbiota Markers for the Classification of Obesity-Related Metabolic Abnormalities. Sci. Rep. 2019, 9, 13424. [Google Scholar] [CrossRef] [PubMed] [Green Version]
- Franco-de-Moraes, A.C.; de Almeida-Pititto, B.; da Rocha Fernandes, G.; Gomes, E.P.; da Costa Pereira, A.; Ferreira, S.R.G. Worse Inflammatory Profile in Omnivores than in Vegetarians Associates with the Gut Microbiota Composition. Diabetol. Metab. Syndr. 2017, 9, 62. [Google Scholar] [CrossRef] [PubMed] [Green Version]
- Ialenti, A.; Di Meglio, P.; Grassia, G.; Maffia, P.; Di Rosa, M.; Lanzetta, R.; Molinaro, A.; Silipo, A.; Grant, W.; Ianaro, A. A Novel Lipid A from Halomonas Magadiensis Inhibits Enteric LPS-Induced Human Monocyte Activation. Eur. J. Immunol. 2006, 36, 354–360. [Google Scholar] [CrossRef]
- Van Soest, A.P.M.; Hermes, G.D.A.; Berendsen, A.A.M.; van de Rest, O.; Zoetendal, E.G.; Fuentes, S.; Santoro, A.; Franceschi, C.; de Groot, L.C.P.G.M.; de Vos, W.M. Associations between Pro- and Anti-Inflammatory Gastro-Intestinal Microbiota, Diet, and Cognitive Functioning in Dutch Healthy Older Adults: The NU-AGE Study. Nutrients 2020, 12, 3471. [Google Scholar] [CrossRef]
- Henke, M.T.; Kenny, D.J.; Cassilly, C.D.; Vlamakis, H.; Xavier, R.J.; Clardy, J. Ruminococcus Gnavus, a Member of the Human Gut Microbiome Associated with Crohn’s Disease, Produces an Inflammatory Polysaccharide. Proc. Natl. Acad. Sci. USA 2019, 116, 12672–12677. [Google Scholar] [CrossRef] [PubMed] [Green Version]
- Beaud, D.; Tailliez, P.; Anba-Mondoloni, J. Genetic Characterization of the Beta-Glucuronidase Enzyme from a Human Intestinal Bacterium, Ruminococcus Gnavus. Microbiology 2005, 151, 2323–2330. [Google Scholar] [CrossRef]
- Chahwan, B.; Kwan, S.; Isik, A.; van Hemert, S.; Burke, C.; Roberts, L. Gut Feelings: A Randomised, Triple-Blind, Placebo-Controlled Trial of Probiotics for Depressive Symptoms. J. Affect. Disord. 2019, 253, 317–326. [Google Scholar] [CrossRef] [PubMed]
- Picca, A.; Ponziani, F.R.; Calvani, R.; Marini, F.; Biancolillo, A.; Coelho-Junior, H.J.; Gervasoni, J.; Primiano, A.; Putignani, L.; Del Chierico, F.; et al. Gut Microbial, Inflammatory and Metabolic Signatures in Older People with Physical Frailty and Sarcopenia: Results from the BIOSPHERE Study. Nutrients 2019, 12, 65. [Google Scholar] [CrossRef] [Green Version]
- Zhuang, Z.-Q.; Shen, L.-L.; Li, W.-W.; Fu, X.; Zeng, F.; Gui, L.; Lü, Y.; Cai, M.; Zhu, C.; Tan, Y.-L.; et al. Gut Microbiota Is Altered in Patients with Alzheimer’s Disease. J. Alzheimers Dis. 2018, 63, 1337–1346. [Google Scholar] [CrossRef] [Green Version]
- Ren, T.; Gao, Y.; Qiu, Y.; Jiang, S.; Zhang, Q.; Zhang, J.; Wang, L.; Zhang, Y.; Wang, L.; Nie, K. Gut Microbiota Altered in Mild Cognitive Impairment Compared With Normal Cognition in Sporadic Parkinson’s Disease. Front. Neurol. 2020, 11, 137. [Google Scholar] [CrossRef] [PubMed]
- Khine, W.W.T.; Voong, M.L.; Ng, T.K.S.; Feng, L.; Rane, G.A.; Kumar, A.P.; Kua, E.H.; Mahendran, R.; Mahendran, R.; Lee, Y.-K. Mental Awareness Improved Mild Cognitive Impairment and Modulated Gut Microbiome. Aging 2020, 12, 24371–24393. [Google Scholar] [CrossRef] [PubMed]
- Mudd, A.T.; Berding, K.; Wang, M.; Donovan, S.M.; Dilger, R.N. Serum Cortisol Mediates the Relationship between Fecal Ruminococcus and Brain N-Acetylaspartate in the Young Pig. Gut Microbes 2017, 8, 589–600. [Google Scholar] [CrossRef] [PubMed] [Green Version]
- Duan, R.; Guan, X.; Huang, K.; Zhang, Y.; Li, S.; Xia, J.; Shen, M. Flavonoids from Whole-Grain Oat Alleviated High-Fat Diet-Induced Hyperlipidemia via Regulating Bile Acid Metabolism and Gut Microbiota in Mice. J. Agric. Food Chem. 2021, 69, 7629–7640. [Google Scholar] [CrossRef] [PubMed]
- Kenna, J.E.; Chua, E.G.; Bakeberg, M.; Tay, A.; McGregor, S.; Gorecki, A.; Horne, M.; Marshall, B.; Mastaglia, F.L.; Anderton, R.S. Changes in the Gut Microbiome and Predicted Functional Metabolic Effects in an Australian Parkinson’s Disease Cohort. Front. Neurosci. 2021, 15, 756951. [Google Scholar] [CrossRef] [PubMed]
- Xu, M.; Mo, X.; Huang, H.; Chen, X.; Liu, H.; Peng, Z.; Chen, L.; Rong, S.; Yang, W.; Xu, S.; et al. Yeast β-Glucan Alleviates Cognitive Deficit by Regulating Gut Microbiota and Metabolites in Aβ1-42-Induced AD-like Mice. Int. J. Biol. Macromol. 2020, 161, 258–270. [Google Scholar] [CrossRef]
- Kong, C.; Gao, R.; Yan, X.; Huang, L.; Qin, H. Probiotics Improve Gut Microbiota Dysbiosis in Obese Mice Fed a High-Fat or High-Sucrose Diet. Nutrition 2019, 60, 175–184. [Google Scholar] [CrossRef]
- El Aidy, S.; Van den Abbeele, P.; Van de Wiele, T.; Louis, P.; Kleerebezem, M. Intestinal Colonization: How Key Microbial Players Become Established in This Dynamic Process: Microbial Metabolic Activities and the Interplay between the Host and Microbes. Bioessays 2013, 35, 913–923. [Google Scholar] [CrossRef]
- Wang, J.; Ji, H.; Wang, S.; Liu, H.; Zhang, W.; Zhang, D.; Wang, Y. Probiotic Lactobacillus plantarum Promotes Intestinal Barrier Function by Strengthening the Epithelium and Modulating Gut Microbiota. Front. Microbiol. 2018, 9, 1953. [Google Scholar] [CrossRef] [Green Version]
- Jeong, S.; Huang, L.-K.; Tsai, M.-J.; Liao, Y.-T.; Lin, Y.-S.; Hu, C.-J.; Hsu, Y.-H. Cognitive Function Associated with Gut Microbial Abundance in Sucrose and S-Adenosyl-L-Methionine (SAMe) Metabolic Pathways. J. Alzheimers Dis. 2022, 87, 1115–1130. [Google Scholar] [CrossRef]
- Qian, Y.; Yang, X.; Xu, S.; Wu, C.; Song, Y.; Qin, N.; Chen, S.-D.; Xiao, Q. Alteration of the Fecal Microbiota in Chinese Patients with Parkinson’s Disease. Brain Behav. Immun. 2018, 70, 194–202. [Google Scholar] [CrossRef] [PubMed]
- Terzo, S.; Mulè, F.; Caldara, G.F.; Baldassano, S.; Puleio, R.; Vitale, M.; Cassata, G.; Ferrantelli, V.; Amato, A. Pistachio Consumption Alleviates Inflammation and Improves Gut Microbiota Composition in Mice Fed a High-Fat Diet. Int. J. Mol. Sci. 2020, 21, 365. [Google Scholar] [CrossRef] [PubMed] [Green Version]
- Wang, M.; Amakye, W.K.; Gong, C.; Ren, Z.; Yuan, E.; Ren, J. Effect of Oral and Intraperitoneal Administration of Walnut-Derived Pentapeptide PW5 on Cognitive Impairments in APPSWE/PS1ΔE9 Mice. Free Radic. Biol. Med. 2022, 180, 191–197. [Google Scholar] [CrossRef] [PubMed]
- Liang, Y.; Zhang, Y.; Deng, Y.; Liang, S.; He, Y.; Chen, Y.; Liu, C.; Lin, C.; Han, L.; Tu, G.; et al. Chaihu-Shugan-San Decoction Modulates Intestinal Microbe Dysbiosis and Alleviates Chronic Metabolic Inflammation in NAFLD Rats via the NLRP3 Inflammasome Pathway. Evid. Based Complement. Alternat. Med. 2018, 2018, 9390786. [Google Scholar] [CrossRef] [Green Version]
- Monk, J.M.; Lepp, D.; Zhang, C.P.; Wu, W.; Zarepoor, L.; Lu, J.T.; Pauls, K.P.; Tsao, R.; Wood, G.A.; Robinson, L.E.; et al. Diets Enriched with Cranberry Beans Alter the Microbiota and Mitigate Colitis Severity and Associated Inflammation. J. Nutr. Biochem. 2016, 28, 129–139. [Google Scholar] [CrossRef]
- Kim, S.; Choi, S.; Dutta, M.; Asubonteng, J.O.; Polunas, M.; Goedken, M.; Gonzalez, F.J.; Cui, J.Y.; Gyamfi, M.A. Pregnane X Receptor Exacerbates Nonalcoholic Fatty Liver Disease Accompanied by Obesity- and Inflammation-Prone Gut Microbiome Signature. Biochem. Pharmacol. 2021, 193, 114698. [Google Scholar] [CrossRef]
- O’Callaghan, J.; O’Toole, P.W. Lactobacillus: Host-Microbe Relationships. Curr. Top Microbiol. Immunol. 2013, 358, 119–154. [Google Scholar] [CrossRef]
- Pessione, E. Lactic Acid Bacteria Contribution to Gut Microbiota Complexity: Lights and Shadows. Front. Cell Infect. Microbiol. 2012, 2, 86. [Google Scholar] [CrossRef] [Green Version]
- Lee, J.; d’Aigle, J.; Atadja, L.; Quaicoe, V.; Honarpisheh, P.; Ganesh, B.P.; Hassan, A.; Graf, J.; Petrosino, J.; Putluri, N.; et al. Gut Microbiota-Derived Short-Chain Fatty Acids Promote Poststroke Recovery in Aged Mice. Circ. Res. 2020, 127, 453–465. [Google Scholar] [CrossRef]
- Emge, J.R.; Huynh, K.; Miller, E.N.; Kaur, M.; Reardon, C.; Barrett, K.E.; Gareau, M.G. Modulation of the Microbiota-Gut-Brain Axis by Probiotics in a Murine Model of Inflammatory Bowel Disease. Am. J. Physiol. Gastrointest. Liver Physiol. 2016, 310, G989–G998. [Google Scholar] [CrossRef] [Green Version]
- Van Tongeren, S.P.; Slaets, J.P.J.; Harmsen, H.J.M.; Welling, G.W. Fecal Microbiota Composition and Frailty. Appl. Environ. Microbiol. 2005, 71, 6438–6442. [Google Scholar] [CrossRef] [PubMed] [Green Version]
- Aizawa, E.; Tsuji, H.; Asahara, T.; Takahashi, T.; Teraishi, T.; Yoshida, S.; Ota, M.; Koga, N.; Hattori, K.; Kunugi, H. Possible Association of Bifidobacterium and Lactobacillus in the Gut Microbiota of Patients with Major Depressive Disorder. J. Affect. Disord. 2016, 202, 254–257. [Google Scholar] [CrossRef] [PubMed]
- Wang, Q.-J.; Shen, Y.-E.; Wang, X.; Fu, S.; Zhang, X.; Zhang, Y.-N.; Wang, R.-T. Concomitant Memantine and Lactobacillus Plantarum Treatment Attenuates Cognitive Impairments in APP/PS1 Mice. Aging 2020, 12, 628–649. [Google Scholar] [CrossRef] [PubMed]
- Lew, L.-C.; Hor, Y.-Y.; Yusoff, N.A.A.; Choi, S.-B.; Yusoff, M.S.B.; Roslan, N.S.; Ahmad, A.; Mohammad, J.A.M.; Abdullah, M.F.I.L.; Zakaria, N.; et al. Probiotic Lactobacillus Plantarum P8 Alleviated Stress and Anxiety While Enhancing Memory and Cognition in Stressed Adults: A Randomised, Double-Blind, Placebo-Controlled Study. Clin. Nutr. 2019, 38, 2053–2064. [Google Scholar] [CrossRef]
- Smith, C.J.; Emge, J.R.; Berzins, K.; Lung, L.; Khamishon, R.; Shah, P.; Rodrigues, D.M.; Sousa, A.J.; Reardon, C.; Sherman, P.M.; et al. Probiotics Normalize the Gut-Brain-Microbiota Axis in Immunodeficient Mice. Am. J. Physiol. Gastrointest. Liver Physiol. 2014, 307, G793–G802. [Google Scholar] [CrossRef] [PubMed]
- Lee, K.; Kim, J.; Park, S.-D.; Shim, J.-J.; Lee, J.-L. Lactobacillus Plantarum HY7715 Ameliorates Sarcopenia by Improving Skeletal Muscle Mass and Function in Aged Balb/c Mice. Int. J. Mol. Sci. 2021, 22, 10023. [Google Scholar] [CrossRef]
- Valcheva, R.; Hotte, N.; Gillevet, P.; Sikaroodi, M.; Thiessen, A.; Madsen, K.L. Soluble Dextrin Fibers Alter the Intestinal Microbiota and Reduce Proinflammatory Cytokine Secretion in Male IL-10-Deficient Mice. J. Nutr. 2015, 145, 2060–2066. [Google Scholar] [CrossRef] [Green Version]
- Long-Smith, C.; O’Riordan, K.J.; Clarke, G.; Stanton, C.; Dinan, T.G.; Cryan, J.F. Microbiota-Gut-Brain Axis: New Therapeutic Opportunities. Annu. Rev. Pharmacol. Toxicol. 2020, 60, 477–502. [Google Scholar] [CrossRef] [PubMed] [Green Version]
Figure 1.
Flow diagram of experimental plan with the chosen time points: 11, 14, 17, 20, and 21.5 months of mice age, corresponding to T0, T1, T2, T3, and T4, respectively. It has to be noted that T0 and T1 belonged to adulthood, T2 to reproductive senescence, and T3 and T4 to senescence. At each time point, behavioral tests were performed and stool samples were collected).

Figure 2.
Alpha diversity distribution box plots. In (A): Shannon diversity index (SDI) estimated for each time point. In (B): Faith’s phylogenetic distance (PD) estimated for each time point. (Number of mice: T1 n = 14, T2 n = 12, T3 n =14, and T4 n =13).
Figure 2.
Alpha diversity distribution box plots. In (A): Shannon diversity index (SDI) estimated for each time point. In (B): Faith’s phylogenetic distance (PD) estimated for each time point. (Number of mice: T1 n = 14, T2 n = 12, T3 n =14, and T4 n =13).

Figure 3.
Non-metric multidimensional scaling (NMDS) at different time points (T0–T1–T2–T3–T4). Colors in the bidimensional NMDS plot are used according to the different sample origin as shown in the legend. The ordinate analysis is based on the Bray-Curtis distance matrix. The graphical plot and the ellipses were generated by ggplot2 R package implemented with stat ellipse function. (Number of animals: T1 n = 14, T2 n = 12, T3 n =14, and T4 n =13). Colors in the graphs are reported according to the different experimental times as shown in the figure labels.

Figure 4.
Bar chart regarding the distribution of the most abundant phyla (A), families (B), and genera (C). The proportion of stack in bar chart corresponds to the total amount of reads of the most abundant phyla, families and genera. (Number of animals: T1 n = 14, T2 n = 12, T3 n = 14, and T4 n = 13).
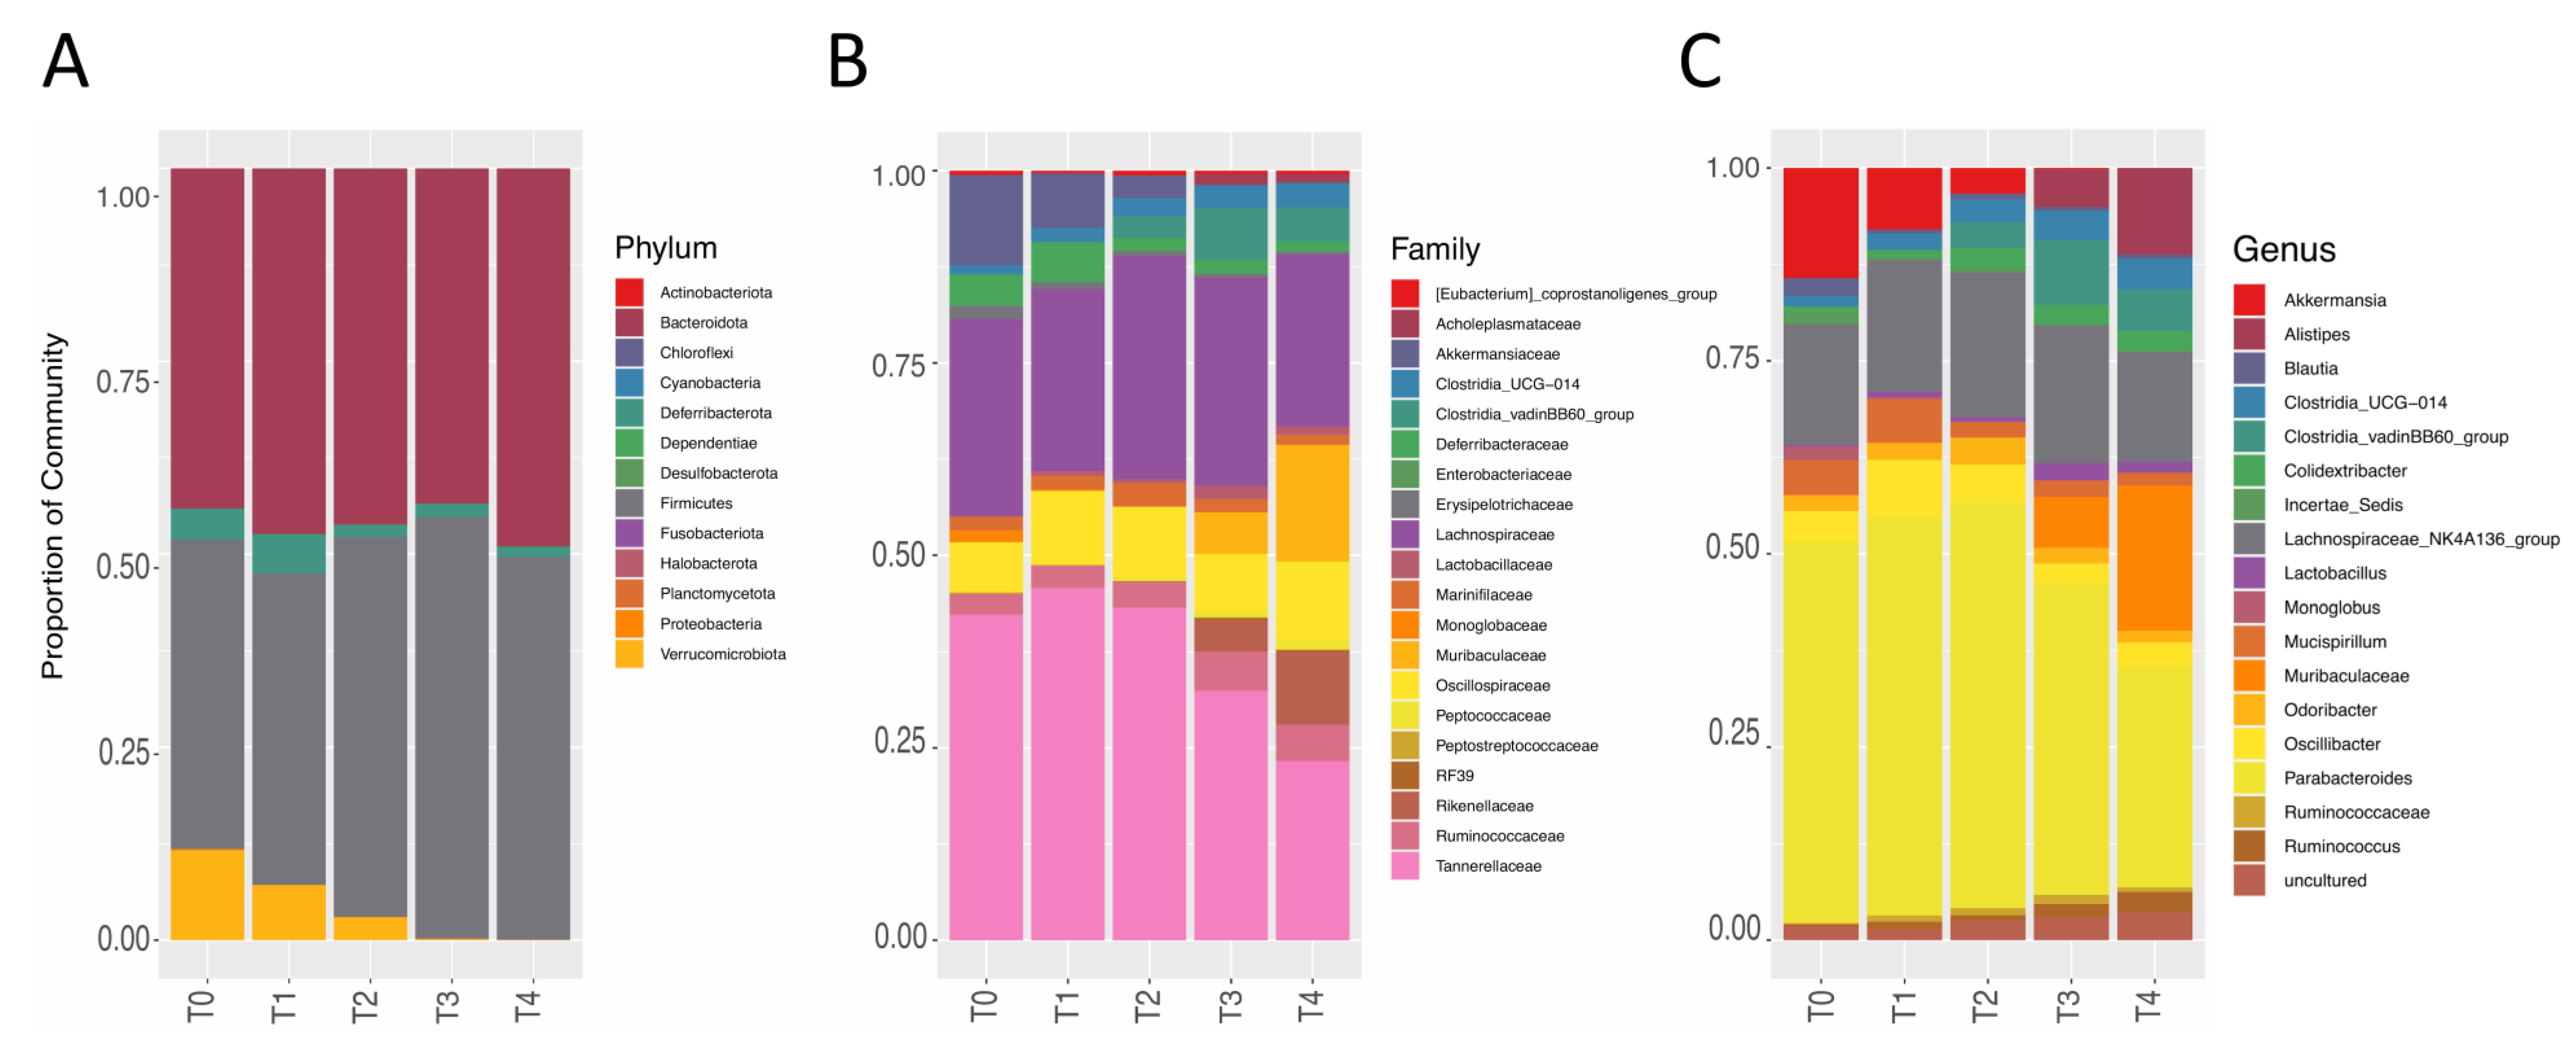
Figure 5.
Box plots representing the relative abundance of genera (A) Akkermansia, (B) Clostridia_vadinBB60_group, (C) Alistipes, (D) Muribaculaceae, (E) Colidextribacter, and (F) Clostridia UCG-014. (Number of mice: T1 n = 14, T2 n = 12, T3 n =14, and T4 n =13).
Figure 5.
Box plots representing the relative abundance of genera (A) Akkermansia, (B) Clostridia_vadinBB60_group, (C) Alistipes, (D) Muribaculaceae, (E) Colidextribacter, and (F) Clostridia UCG-014. (Number of mice: T1 n = 14, T2 n = 12, T3 n =14, and T4 n =13).
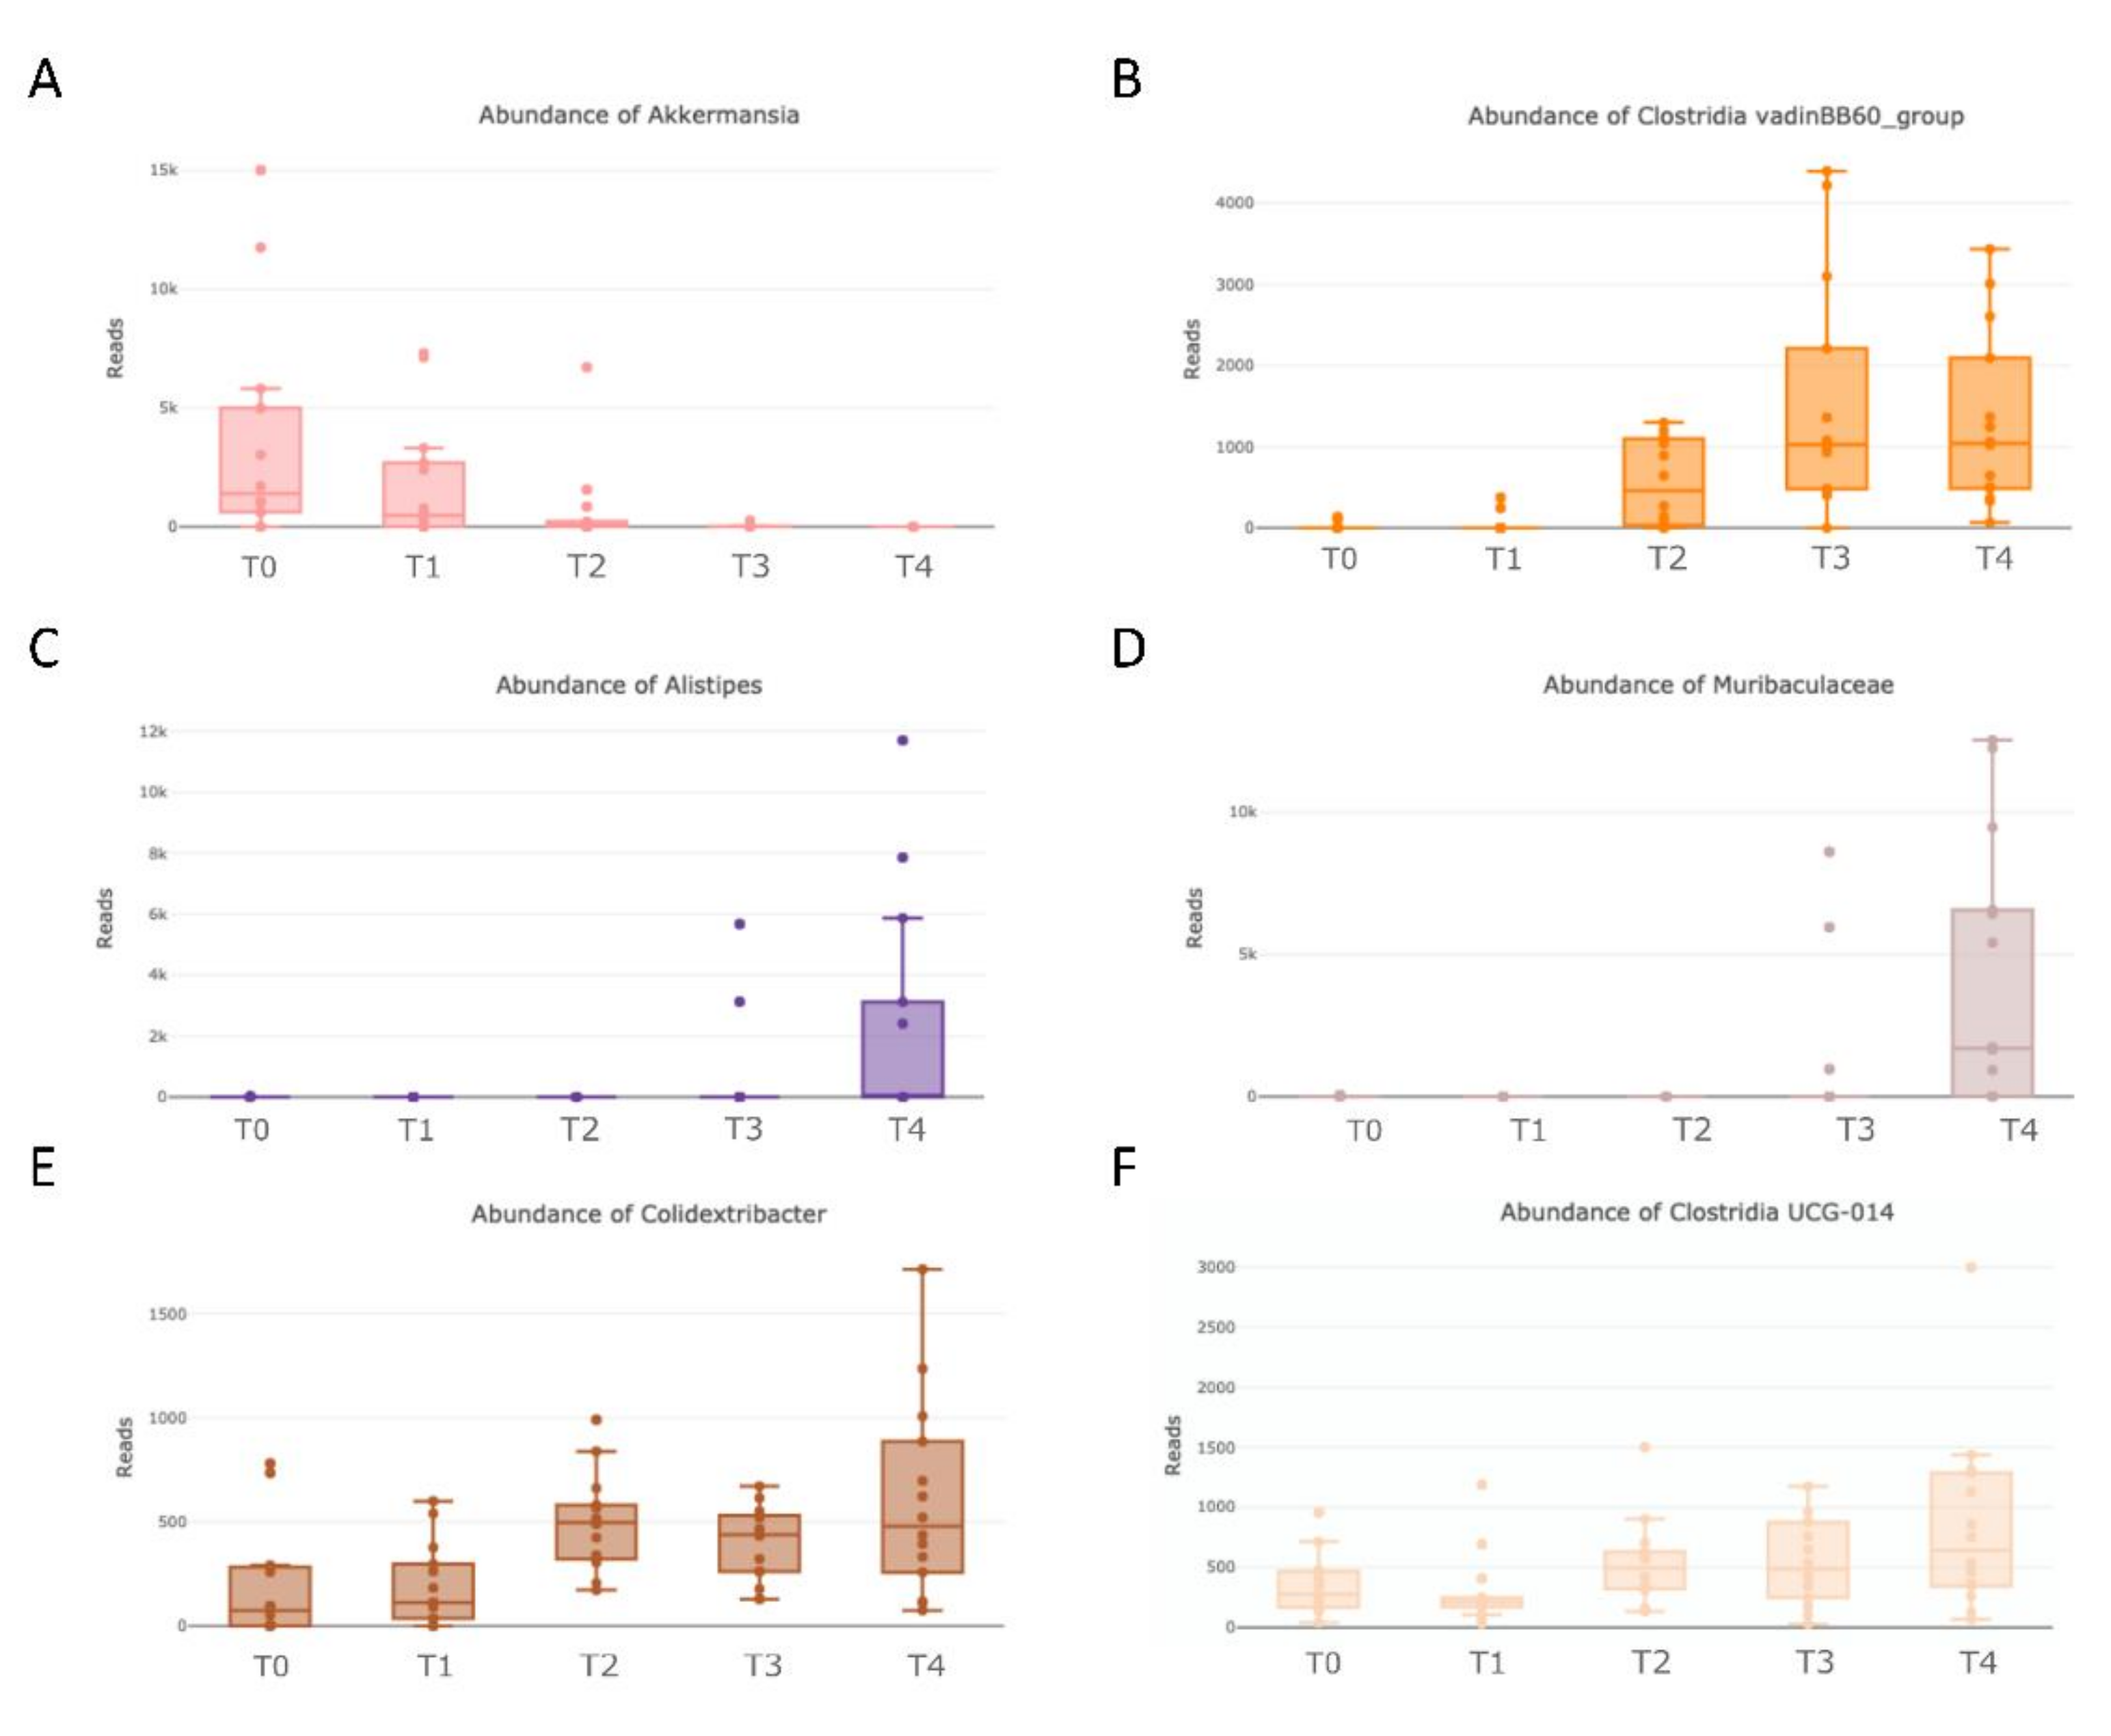
Figure 6.
A differential heat tree based on the Wilcoxon rank-sum test, indicating which taxa were more abundant in each experimental time. Phyla, classes, orders, families, and genera are represented. Node label is the taxon name, node size is the number of ASVs, and node color is the abundances of the indicated phylum, class, order, family, or genus. A taxon colored brown was more abundant in the time points colored in brown and a taxon colored in green was more abundant in the time points colored in green, as reported in the legend. The tree differential plots were generated using the metacoder R package. (Number of animals: T1 n = 14, T2 n = 12, T3 n =14, and T4 n =13).
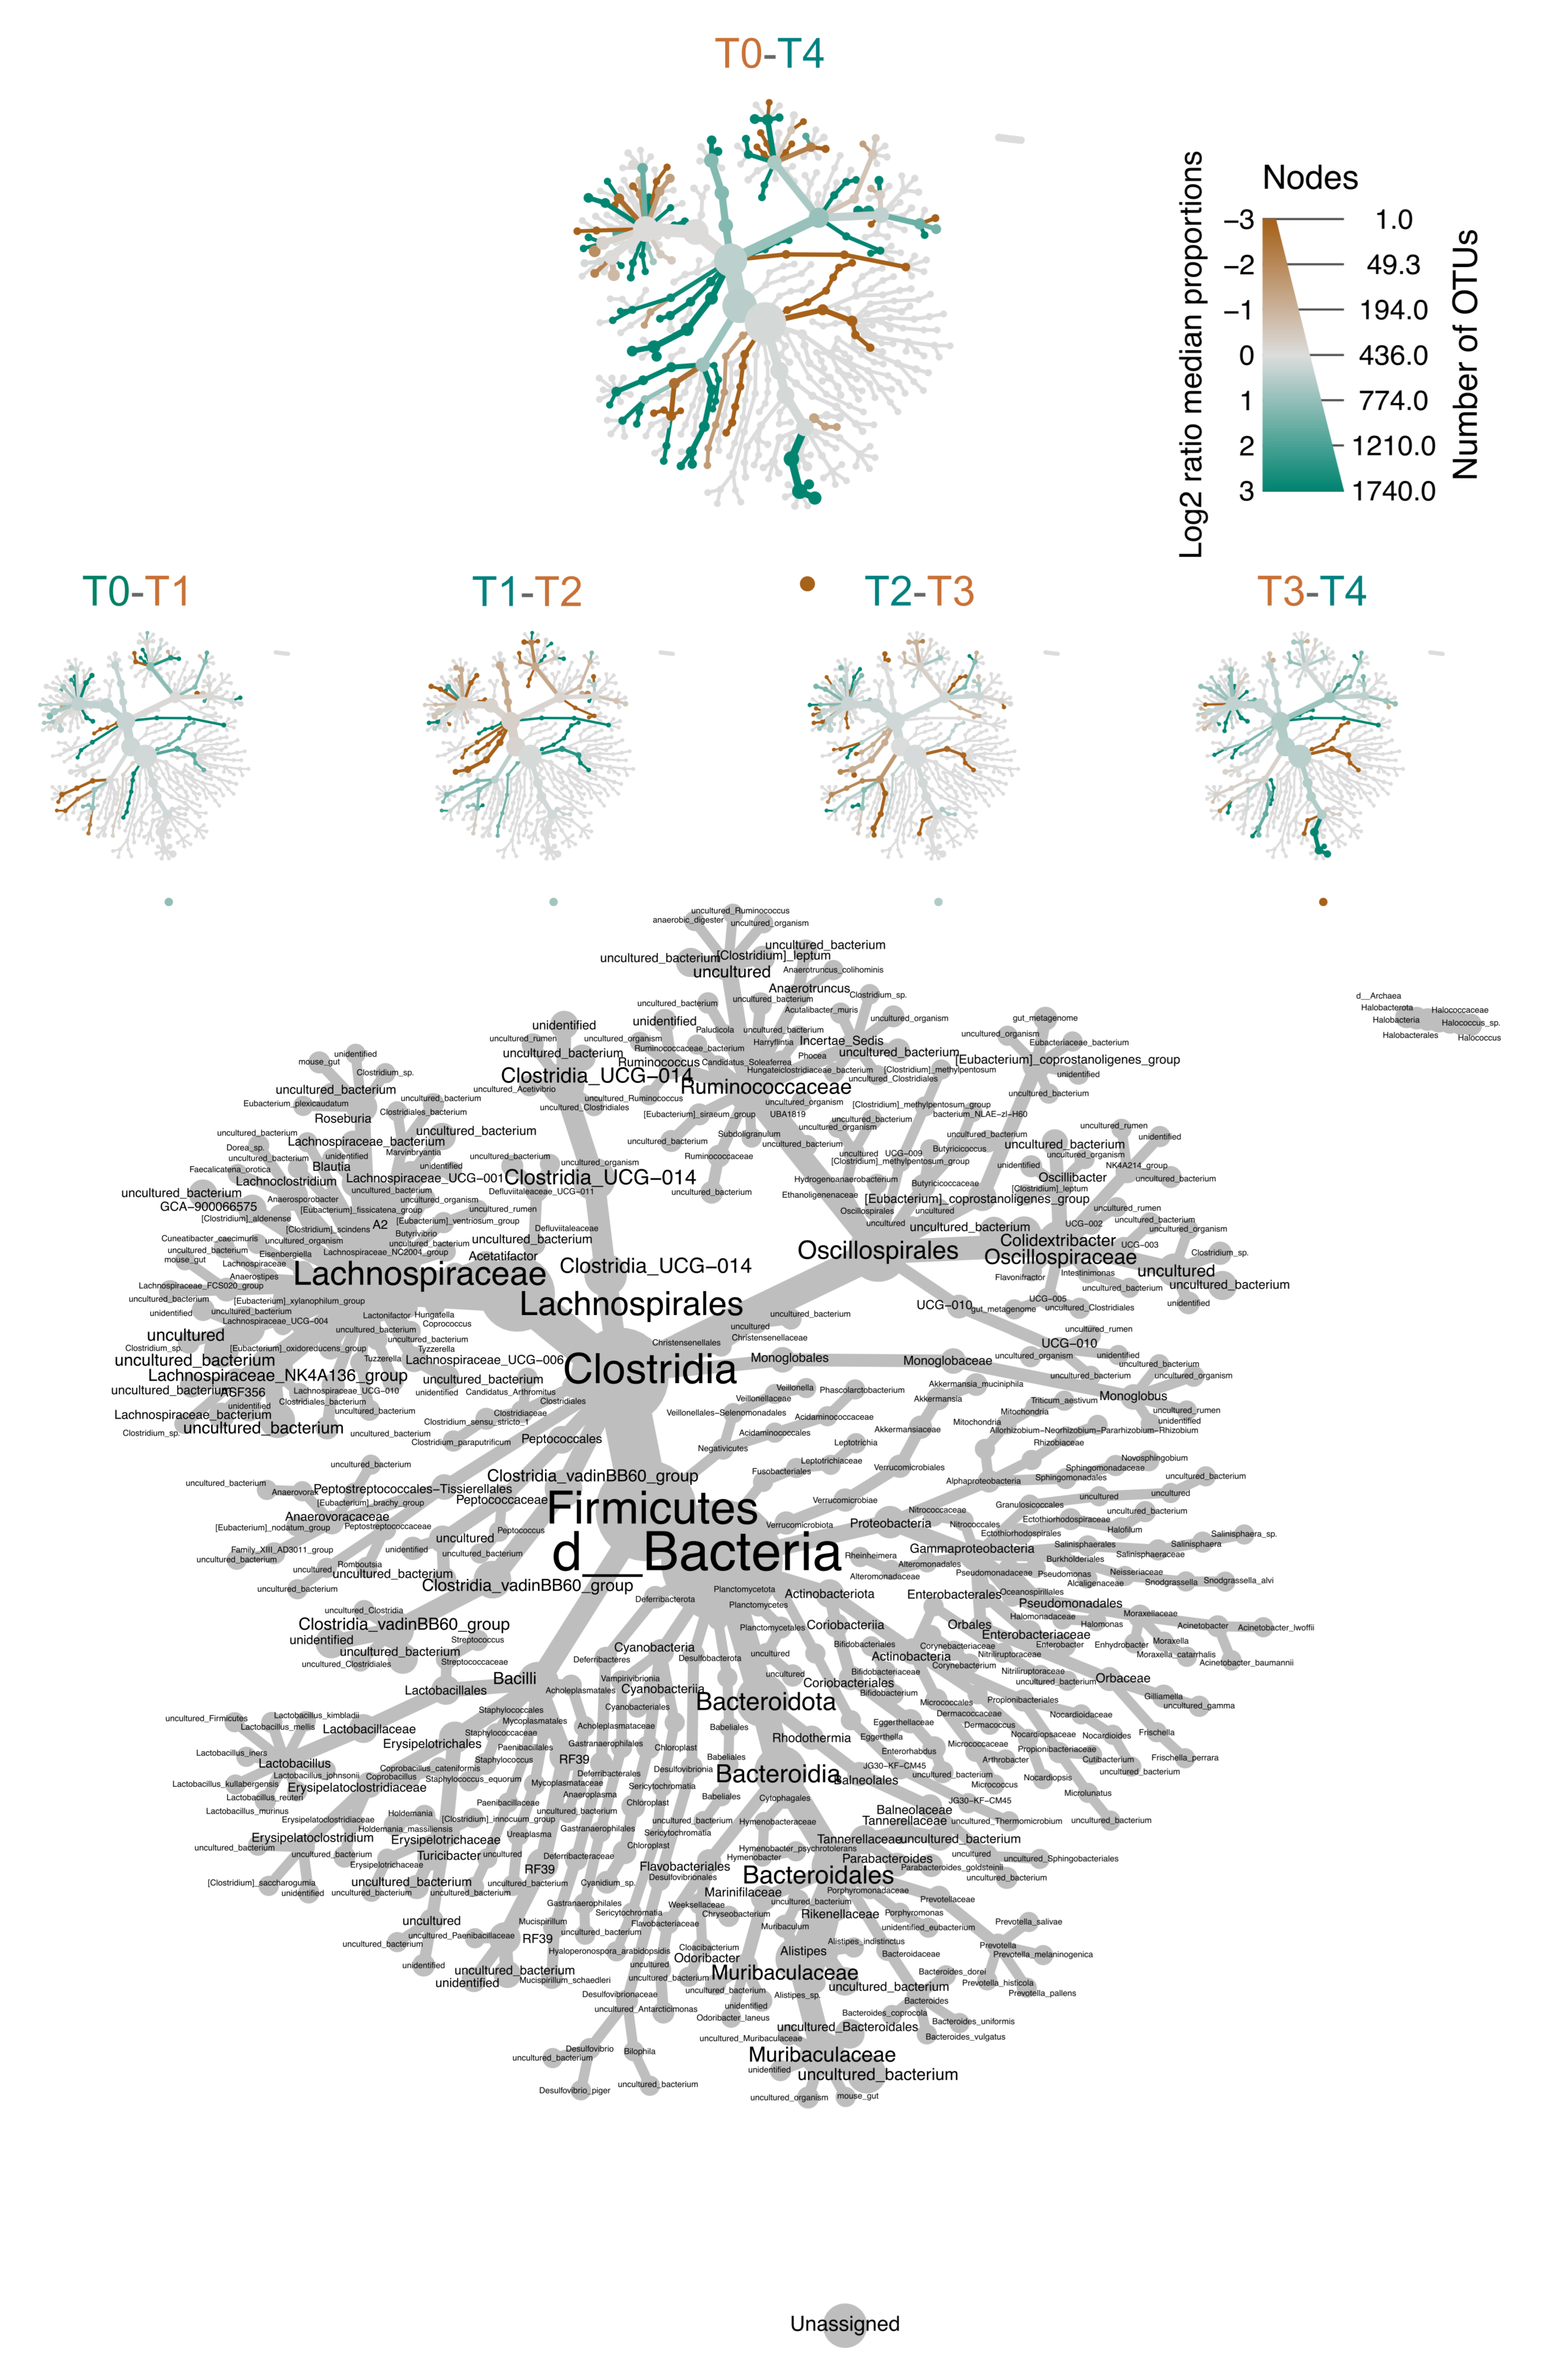
Figure 7.
Mean cognitive decline, reported as Cognitive Frailty Index (FI), during physiological aging (n = 14). (A): linear least-squares regression analysis of Cognitive FI during mice lifespan. (B): median value of Cognitive FI during mice lifespan.
Figure 7.
Mean cognitive decline, reported as Cognitive Frailty Index (FI), during physiological aging (n = 14). (A): linear least-squares regression analysis of Cognitive FI during mice lifespan. (B): median value of Cognitive FI during mice lifespan.
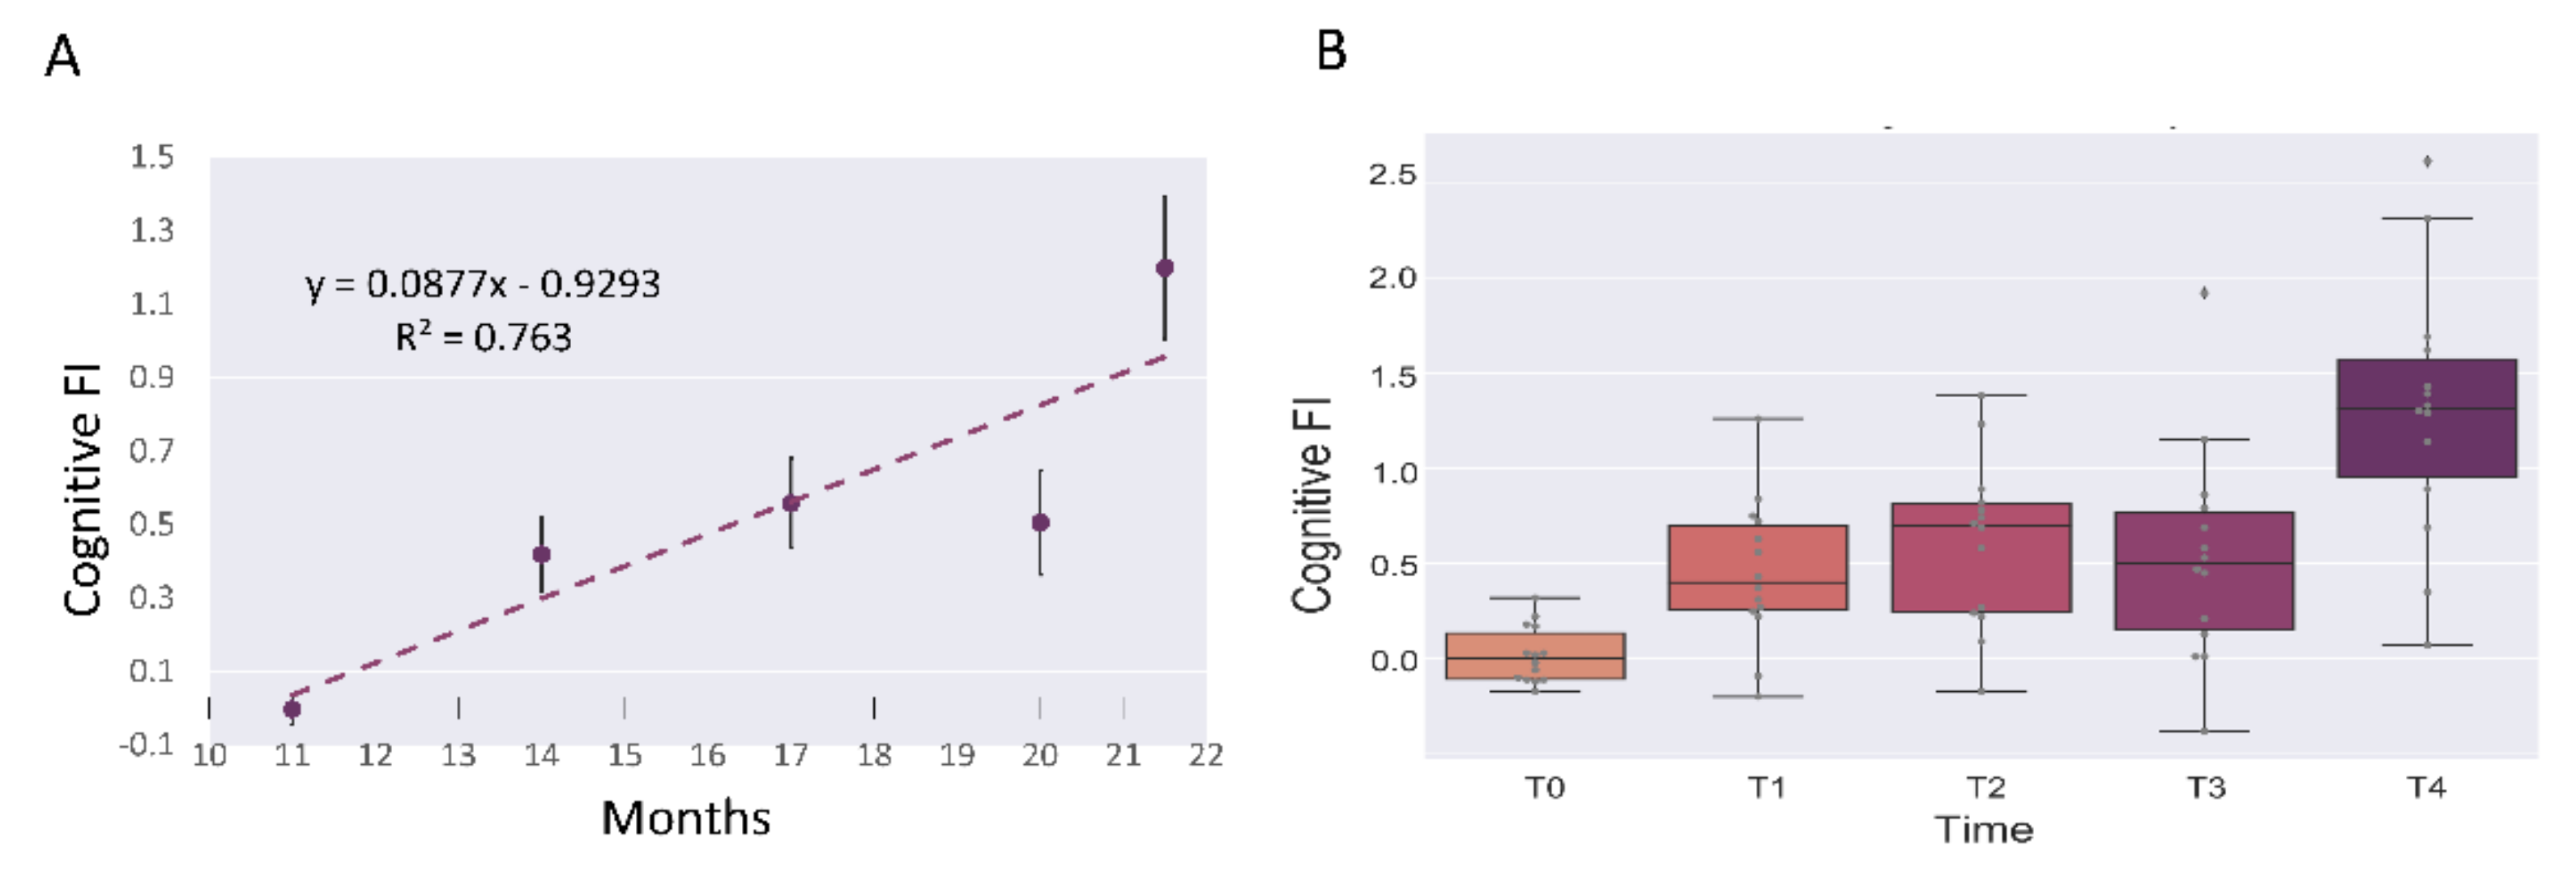
Figure 8.
Figure plotting the correlation between Faith’s phylogenetic distance (PD) index and Cognitive FI. Reported is the linear regression equation used to fit experimental data. Colors in the graphs are reported according to the different experimental times as shown in the figure labels.
Figure 8.
Figure plotting the correlation between Faith’s phylogenetic distance (PD) index and Cognitive FI. Reported is the linear regression equation used to fit experimental data. Colors in the graphs are reported according to the different experimental times as shown in the figure labels.
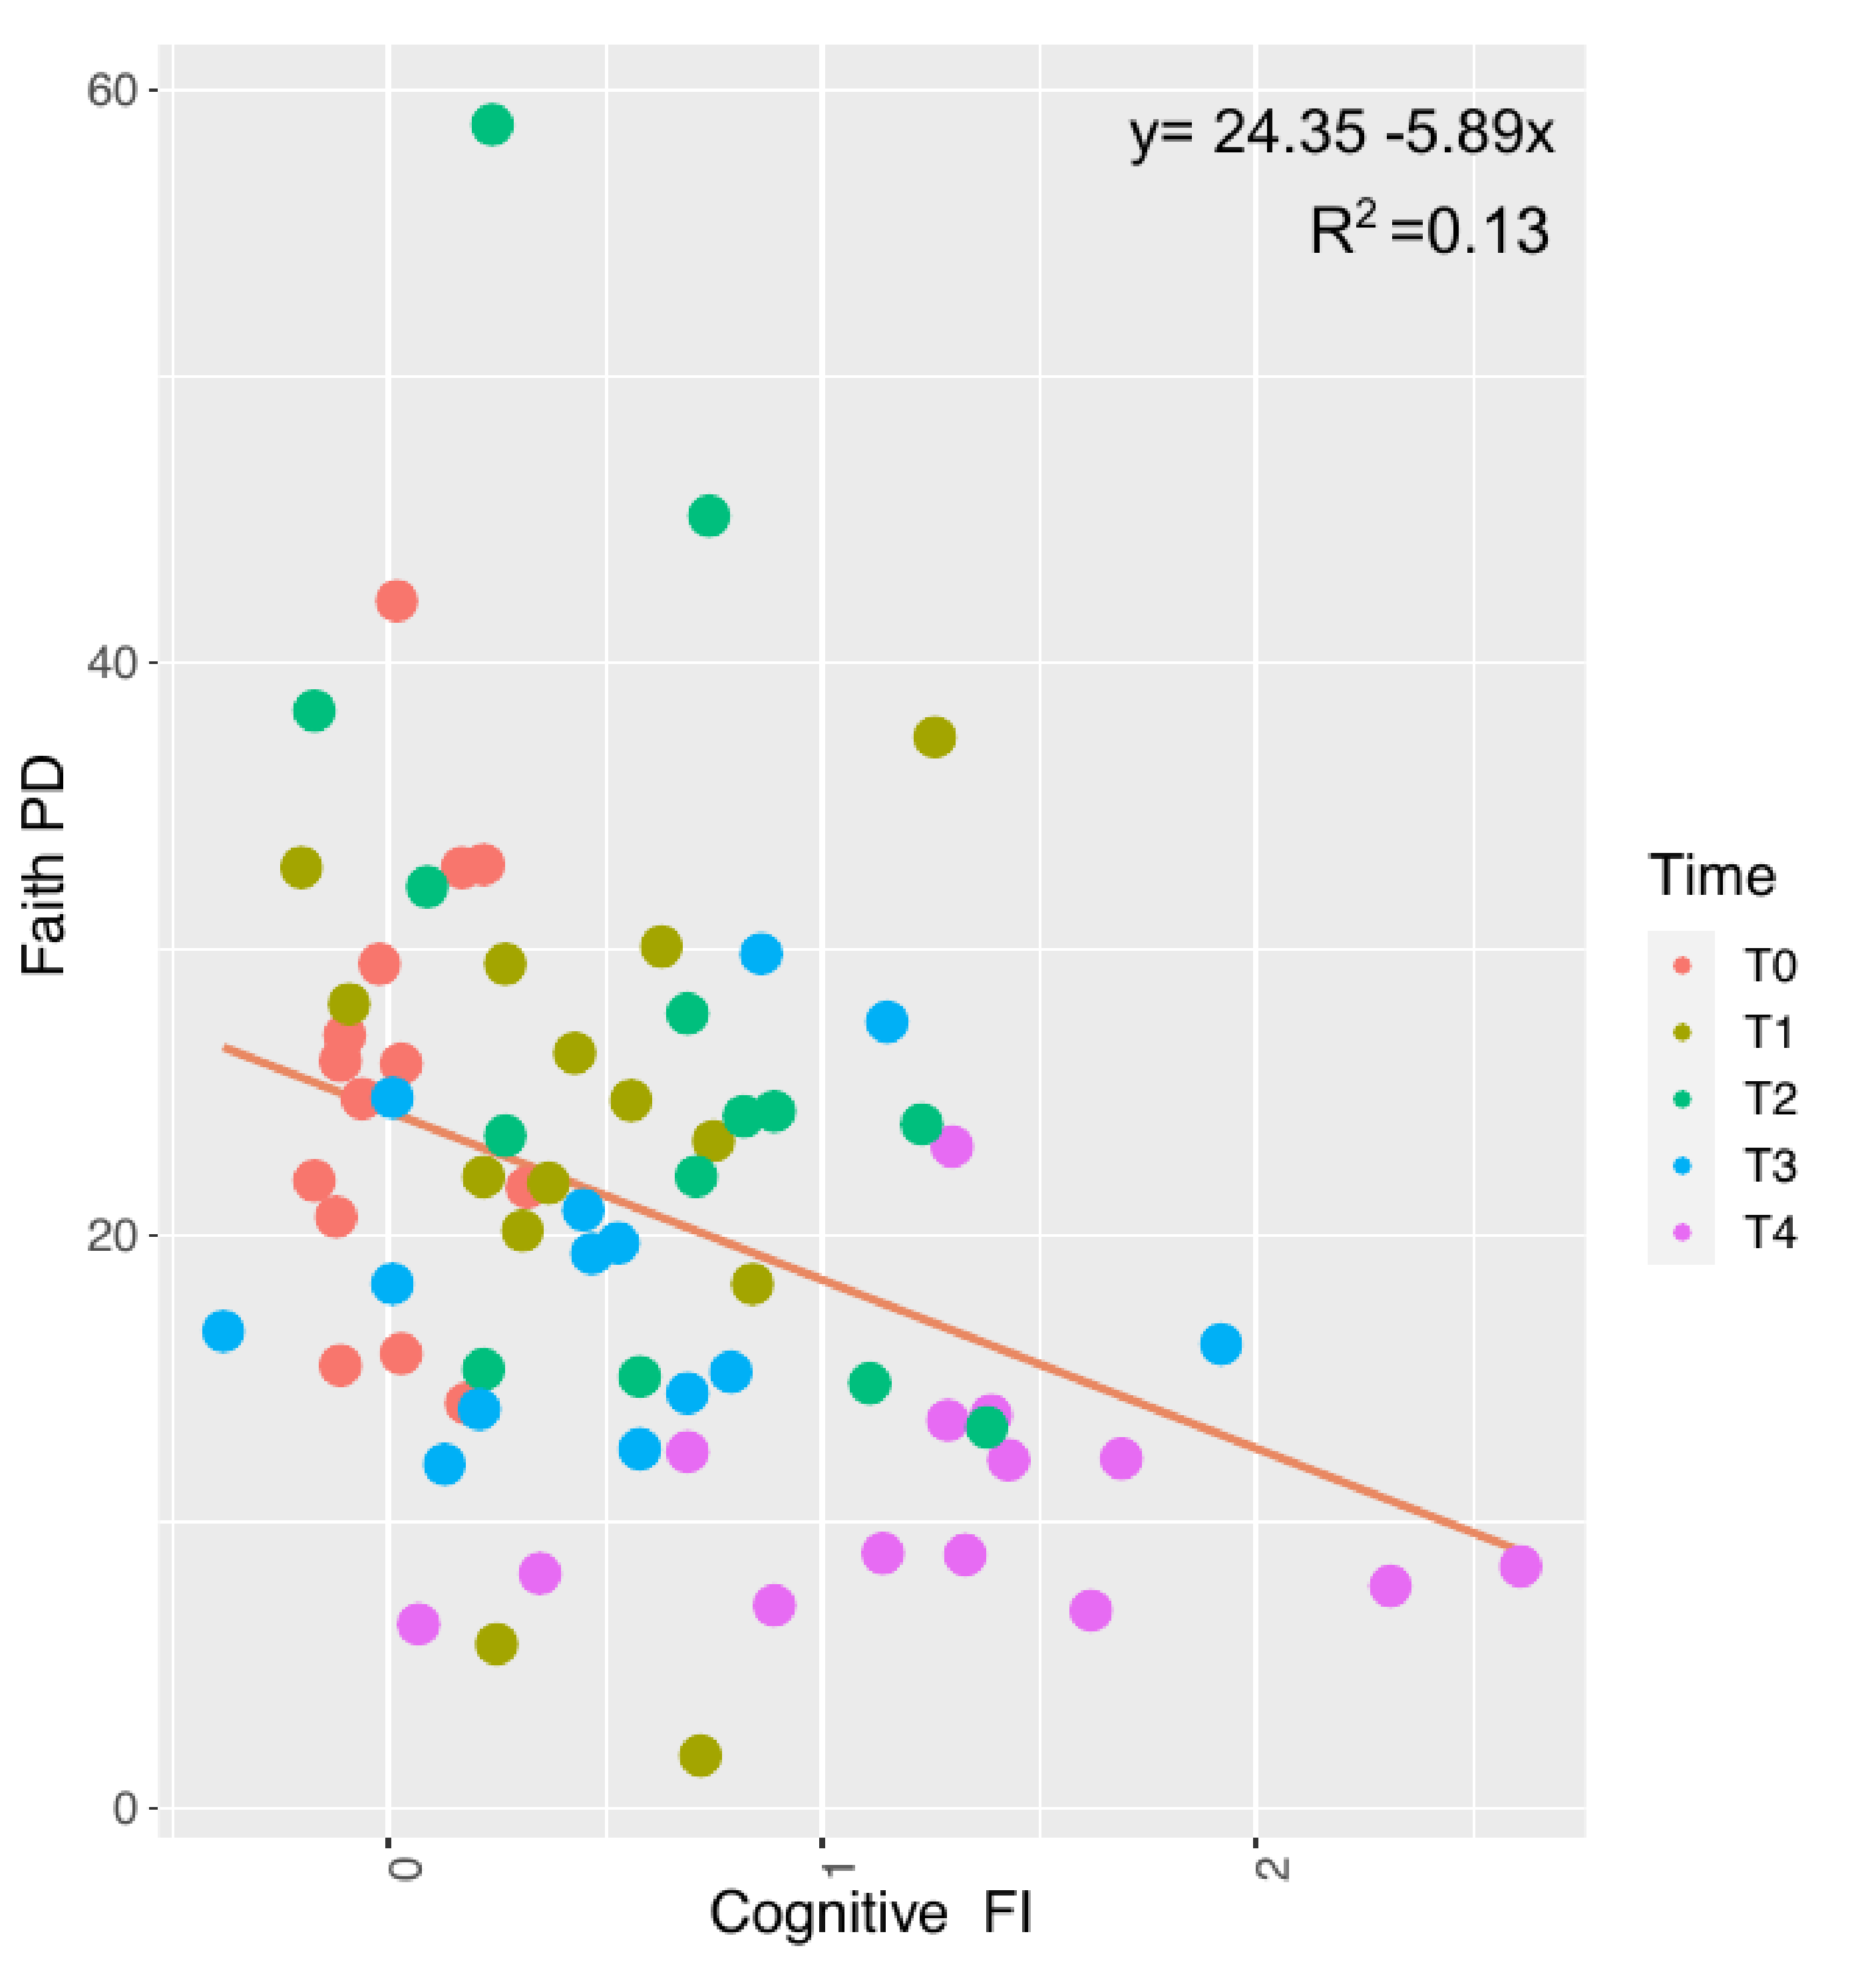
Figure 9.
CAP analysis revealed that microbiomes varied by time, but with a slight effect on the Cognitive Frailty Index. CAP analysis was performed using the beta diversity based on Bray-Curtis distance metric constrained to time point and Cognitive FI. Each dot represents each sample’s coordinate on constrained PCoA1. Different levels of Cognitive FI are reported as a gradient scale (lower values in dark blue and higher values light blue).
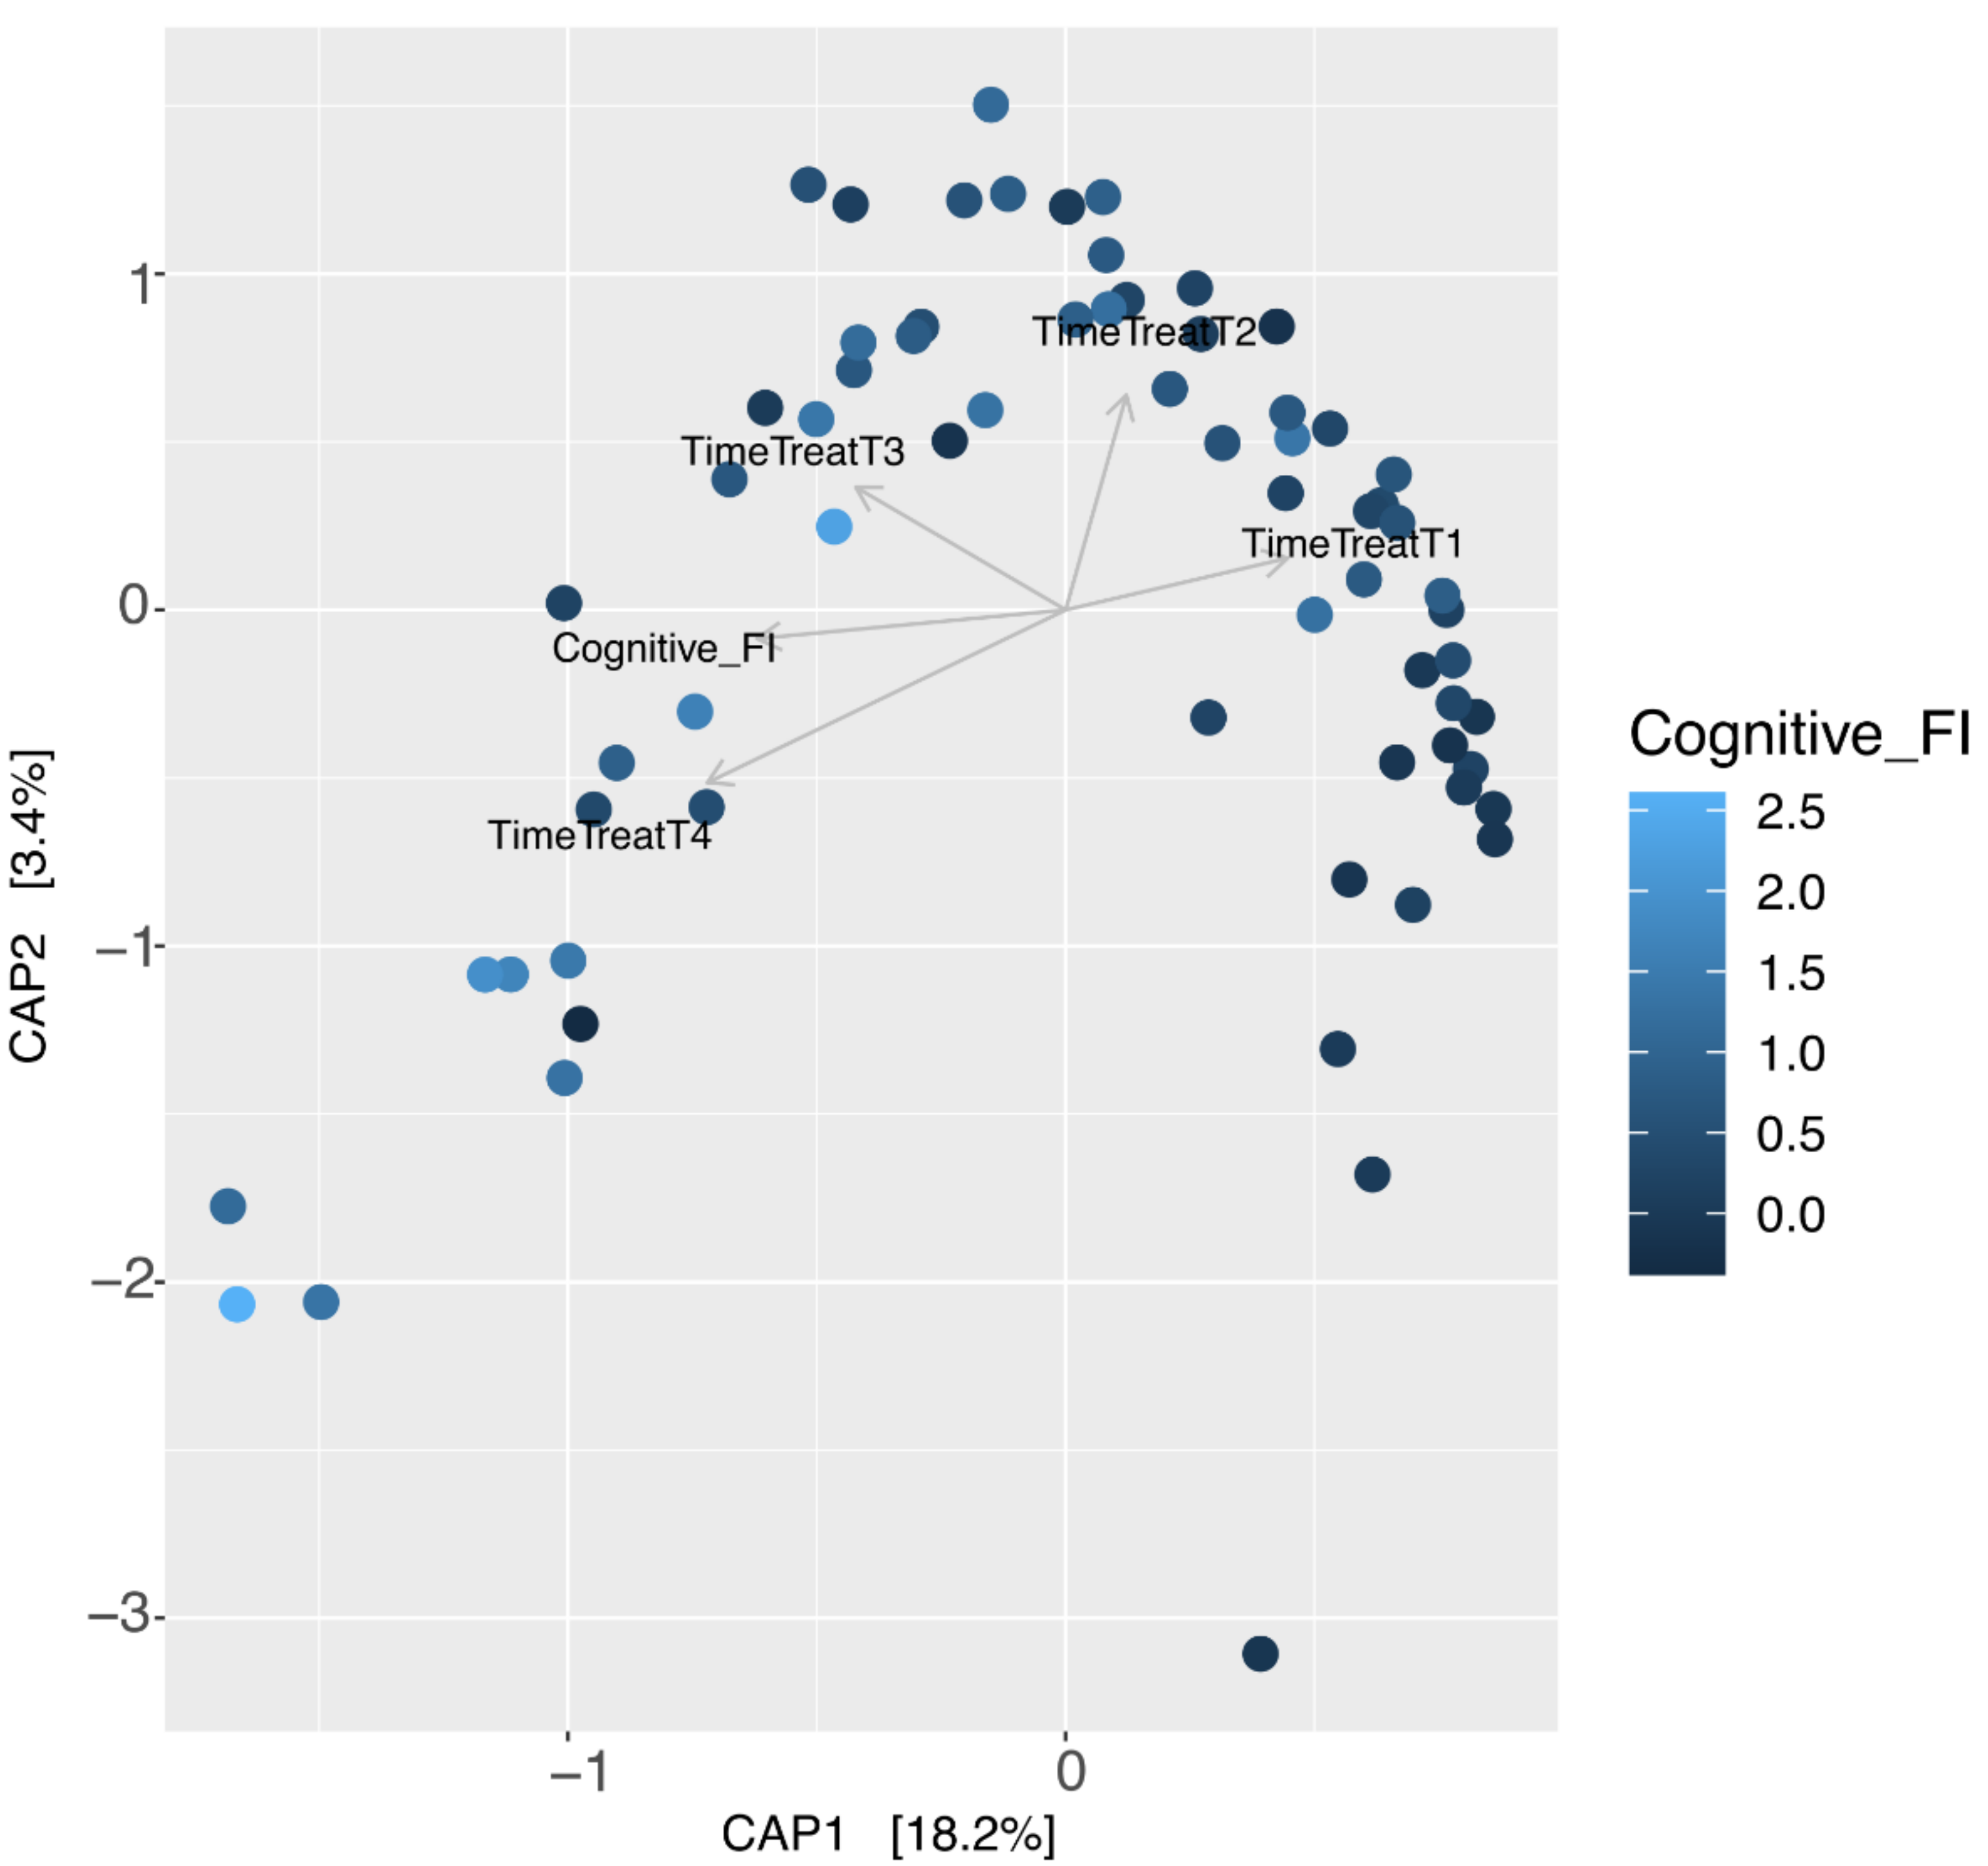
Figure 10.
The heat map shows the distribution of the abundances of 218 ASVs whose variation was statistically significant in relation to the variation of the Cognitive FI. The analysis was performed using Deseq2 R package and the heat map was generated using phetamap R package. The variations in terms of abundance are indicated using the coloring scale in the legend. A green-white color scale is used to indicate the variation of Cognitive FI.


Table 1.
Statistical analysis of the effect of aging on alpha diversity based on Shannon diversity index (on the top) and Faith’s phylogenetic distance (on the bottom).
Table 1.
Statistical analysis of the effect of aging on alpha diversity based on Shannon diversity index (on the top) and Faith’s phylogenetic distance (on the bottom).
| Shannon Index | ||
|---|---|---|
| Combination | WSRT | FDR p-Value |
| T0–T1 | 17 | 0.092 |
| T1–T2 | 6 | 0.007 |
| T2–T3 | 13 | 0.011 |
| T3–T4 | 41 | 0.787 |
| Faith’s PD Index | ||
| Combination | WSRT | FDR p-Value |
| T0–T1 | 36 | 0.850 |
| T1–T2 | 31 | 0.569 |
| T2–T3 | 24 | 0.0785 |
| T3–T4 | 0 | 0.0002 |
Table 2.
Statistical analysis of the effect of aging on beta diversity based on Bray-Curtis distance matrix.
Table 2.
Statistical analysis of the effect of aging on beta diversity based on Bray-Curtis distance matrix.
| Combination | SumsOfSqs | MeanSqs | F.Model | R2 | p-Value. Corrected |
| T0–T1 | 0.191 | 0.191 | 2.200 | 0.084 | 0.029 |
| T1–T2 | 0.205 | 0.205 | 2.317 | 0.088 | 0.004 |
| T1–T3 | 0.746 | 0.746 | 6.188 | 0.205 | 0.001 |
| T2–T3 | 0.351 | 0.351 | 2.516 | 0.088 | 0.001 |
| T3–T4 | 0.301 | 0.301 | 1.555 | 0.059 | 0.109 |
Table 3.
Proposed dysbiotic or adaptive roles of gut bacteria that significantly changed with Cognitive Frailty Index. We searched in the literature the involvement of selected bacteria on host health, and in particular, on CNS.
Table 3.
Proposed dysbiotic or adaptive roles of gut bacteria that significantly changed with Cognitive Frailty Index. We searched in the literature the involvement of selected bacteria on host health, and in particular, on CNS.
| Genera | Published Effects on Host Health | Changes with Cognitive Frailty Increase | Possible Role |
|---|---|---|---|
| Parabacteroides | Dichotomous role demonstrated also in CNS [62,63,64]. | Decrease | Dysbiotic/Adaptive |
| Clostridia UCG-014 | Pro-inflammatory [65,66,67]. | Decrease | Adaptive |
| Oscillibacter | Negatively related to cognitive performance [68]; related to depression [60,69], metabolic disease [70], and inflammation [71]. | Decrease | Adaptive |
| Mucispirillum | Opportunistic pathogens [72]; positively related to inflammation, LPS [72,73,74], and changes in different behavioral domains [75]. | Decrease | Dysbiotic |
| Coprostanoligenes | Negatively related to inflammation [76,77,78]. | Decrease | Dysbiotic |
| Flavonifractor | Dichotomous role, also demonstrated in CNS [79,80,81,82]. | Decrease | Dysbiotic/Adaptive |
| Blautia | Butyrate producer with probiotic potential [83]. | Decrease | Dysbiotic |
| Monoglobus | Negatively related to amyloid presence in the brain [84]. | Decrease | Dysbiotic |
| Lachnoclostridium | Butyrate producer [85,86]. | Decrease | Dysbiotic |
| Oscillospiraceae UCG_005 | Negatively related to inflammation [81]. | Decrease | Dysbiotic |
| Marvinbryantia | Negatively related to amyloid presence in the brain [84]. | Decrease | Dysbiotic |
| Erysipelotrichaceae | Pro-inflammatory [87,88,89]; enriched in mouse AD model and senescence-accelerated mice model [87,89]. | Decrease | Adaptive |
| Clostridium sensu stricto 1, known also as C. butyricum [90] | Dichotomous role [91,92,93,94,95]. | Decrease | Dysbiotic/Adaptive |
| Halomonas | Dichotomous role [96,97]. | Decrease | Dysbiotic/Adaptive |
| Ruminococcus | Pro-inflammatory [98,99,100]; dysregulated in patients with depression, physical frailty and sarcopenia, AD, and PD and MCI [80,101,102,103,104]; risk indicator of MCI [105]; negatively related to cognitive performance [103,104,105] and to marker of neuronal health [106]. | Increase | Dysbiotic |
| Colidextribacter | Positively related to inflammation [65,107]; decreased in PD patients [108]. | Increase | Dysbiotic |
| Anaerotruncus | Dichotomous role [109,110,111,112], also in CNS (AD, PD, and cognitive impairment) [109,113,114]. | Increase | Dysbiotic/Adaptive |
| Anaeroplasma | Healthy bacterium [115] decreased in AD mice model [116] and in obese rats [117]; negatively related to inflammation [118]. | Increase | Adaptive |
| Peptococcaceae | Pro-inflammatory [118,119]. | Increase | Dysbiotic |
| Lactobacillus | Anti-inflammatory, butyrate producer with probiotic effect [120,121,122], its beneficial effects are demonstrated also in CNS (altered behaviors, depression, anxiety, stress, cognitive impairment, andAD models) [123,124,125,126,127,128]; reduced sarcopenic process and physical frailty in mice [129]. | Increase | Adaptive |
| Ruminococcaceae incertae sedis | Anti-inflammatory, butyrate producer [130]. | Increase | Adaptive |
Publisher’s Note: MDPI stays neutral with regard to jurisdictional claims in published maps and institutional affiliations. |
© 2022 by the authors. Licensee MDPI, Basel, Switzerland. This article is an open access article distributed under the terms and conditions of the Creative Commons Attribution (CC BY) license (https://creativecommons.org/licenses/by/4.0/).
Share and Cite
MDPI and ACS Style
Ratto, D.; Roda, E.; Romeo, M.; Venuti, M.T.; Desiderio, A.; Lupo, G.; Capelli, E.; Sandionigi, A.; Rossi, P. The Many Ages of Microbiome–Gut–Brain Axis. Nutrients 2022, 14, 2937. https://doi.org/10.3390/nu14142937
AMA Style
Ratto D, Roda E, Romeo M, Venuti MT, Desiderio A, Lupo G, Capelli E, Sandionigi A, Rossi P. The Many Ages of Microbiome–Gut–Brain Axis. Nutrients. 2022; 14(14):2937. https://doi.org/10.3390/nu14142937
Chicago/Turabian StyleRatto, Daniela, Elisa Roda, Marcello Romeo, Maria Teresa Venuti, Anthea Desiderio, Giuseppe Lupo, Enrica Capelli, Anna Sandionigi, and Paola Rossi. 2022. "The Many Ages of Microbiome–Gut–Brain Axis" Nutrients 14, no. 14: 2937. https://doi.org/10.3390/nu14142937
Note that from the first issue of 2016, this journal uses article numbers instead of page numbers. See further details here.