
Association between Coronary Artery Plaque Progression and Liver Fibrosis Biomarkers in Population with Low Calcium Scores

 ,
,
Abstract
:1. Introduction
2. Methods
2.1. Study Population
2.2. Biochemical Markers and Liver Fibrosis Score Measurement
2.3. CAC Score and Plaque Burden Measurement
2.4. Statistical Analysis
3. Results
3.1. Baseline Characteristics of the Study Population
3.2. Factors Associated with Plaque Progression
4. Discussion
5. Study Limitations
6. Conclusions
Supplementary Materials
Author Contributions
Funding
Institutional Review Board Statement
Informed Consent Statement
Data Availability Statement
Conflicts of Interest
References
- Bauersachs, R.; Zeymer, U.; Brière, J.B.; Marre, C.; Bowrin, K.; Huelsebeck, M. Burden of Coronary Artery Disease and Peripheral Artery Disease: A Literature Review. Cardiovasc. Ther. 2019, 2019, 8295054. [Google Scholar] [CrossRef] [PubMed]
- Driessen, R.S.; Danad, I.; Stuijfzand, W.J.; Raijmakers, P.G.; Schumacher, S.P.; van Diemen, P.A.; Leipsic, J.A.; Knuuti, J.; Underwood, S.R.; van de Ven, P.M.; et al. Comparison of Coronary Computed Tomography Angiography, Fractional Flow Reserve, and Perfusion Imaging for Ischemia Diagnosis. J. Am. Coll. Cardiol. 2019, 73, 161–173. [Google Scholar] [CrossRef] [PubMed]
- Greenland, P.; Blaha, M.J.; Budoff, M.J.; Erbel, R.; Watson, K.E. Coronary Calcium Score and Cardiovascular Risk. J. Am. Coll. Cardiol. 2018, 72, 434–447. [Google Scholar] [CrossRef] [PubMed]
- Grundy, S.M.; Stone, N.J.; Bailey, A.L.; Beam, C.; Birtcher, K.K.; Blumenthal, R.S.; Braun, L.T.; De Ferranti, S.; Faiella-Tommasino, J.; Forman, D.E.; et al. 2018 AHA/ACC/AACVPR/AAPA/ABC/ACPM/ADA/AGS/APhA/ASPC/NLA/PCNA Guideline on the Management of Blood Cholesterol: A Report of the American College of Cardiology/American Heart Association Task Force on Clinical Practice Guidelines. Circulation 2019, 139, E1082–E1143. [Google Scholar] [PubMed]
- Corrigan, F.E. ST-Segment Elevation Myocardial Infarction 2 h after Zero Calcium Score. Cardiovasc. Interv. 2020, 13, e63–e65. [Google Scholar] [CrossRef] [PubMed]
- Mortensen, M.B.; Gaur, S.; Frimmer, A.; Bøtker, H.E.; Sørensen, H.T.; Kragholm, K.H.; Peter, S.R.N.; Steffensen, F.H.; Jensen, R.V.; Mæng, M.; et al. Association of Age with the Diagnostic Value of Coronary Artery Calcium Score for Ruling Out Coronary Stenosis in Symptomatic Patients. JAMA Cardiol. 2022, 7, 36–44. [Google Scholar] [CrossRef]
- Villines, T.C.; Hulten, E.A.; Shaw, L.J.; Goyal, M.; Dunning, A.; Achenbach, S.; Al-Mallah, M.; Berman, D.S.; Budoff, M.J.; Cademartiri, F.; et al. Prevalence and severity of coronary artery disease and adverse events among symptomatic patients with coronary artery calcification scores of zero undergoing coronary computed tomography angiography: Results from the CONFIRM (Coronary CT Angiography Evaluation for Clinical Outcomes: An International Multicenter) registry. J. Am. Coll. Cardiol. 2011, 58, 2533–2540. [Google Scholar]
- Dzaye, O.; Dardari, Z.A.; Cainzos-Achirica, M.; Blankstein, R.; Agatston, A.S.; Duebgen, M.; Yeboah, J.; Szklo, M.; Budoff, M.J.; Lima, J.A.; et al. Warranty Period of a Calcium Score of Zero: Comprehensive Analysis From MESA. JACC Cardiovasc. Imaging 2021, 14, 990–1002. [Google Scholar] [CrossRef]
- Lehmann, N.; Erbel, R.; Mahabadi, A.A.; Rauwolf, M.; Möhlenkamp, S.; Moebus, S.; Kälsch, H.; Budde, T.; Schmermund, A.; Stang, A.; et al. Value of progression of coronary artery calcification for risk prediction of coronary and cardiovascular events: Result of the hnr study (heinz nixdorf recall). Circulation 2018, 137, 665–679. [Google Scholar] [CrossRef]
- Gu, H.; Gao, Y.; Hou, Z.; Schoepf, U.J.; Snyder, A.N.; Duguay, T.M.; Wang, X.; Lu, B. Prognostic value of coronary atherosclerosis progression evaluated by coronary CT angiography in patients with stable angina. Eur. Radiol. 2018, 28, 1066–1076. [Google Scholar] [CrossRef]
- Kronmal, R.A.; McClelland, R.L.; Detrano, R.; Shea, S.; Lima, J.A.; Cushman, M.; Bild, D.E.; Burke, G.L. Risk factors for the progression of coronary artery calcification in asymptomatic subjects: Results from the Multi-Ethnic Study of Atherosclerosis (MESA). Circulation 2007, 115, 2722–2730. [Google Scholar] [CrossRef] [PubMed] [Green Version]
- Satoh, K.; Shimokawa, H. Recent Advances in the Development of Cardiovascular Biomarkers. Arterioscler. Thromb. Vasc. Biol. 2018, 38, e61–e70. [Google Scholar] [CrossRef] [PubMed] [Green Version]
- Schonmann, Y.; Yeshua, H.; Bentov, I.; Zelber-Sagi, S. Liver fibrosis marker is an independent predictor of cardiovascular morbidity and mortality in the general population. Dig. Liver Dis. 2021, 53, 79–85. [Google Scholar] [CrossRef]
- Li, B.; Zhang, C.; Zhan, Y.T. Nonalcoholic Fatty Liver Disease Cirrhosis: A Review of Its Epidemiology, Risk Factors, Clinical Presentation, Diagnosis, Management, and Prognosis. Can. J. Gastroenterol. Hepatol. 2018, 2018, 2784537. [Google Scholar] [CrossRef]
- Kasper, P.; Martin, A.; Lang, S.; Kütting, F.; Goeser, T.; Demir, M.; Steffen, H.-M. NAFLD and cardiovascular diseases: A clinical review. Clin. Res. Cardiol. 2021, 110, 921–937. [Google Scholar] [CrossRef] [PubMed]
- Bhatia, L.S.; Curzen, N.P.; Calder, P.C.; Byrne, C.D. Non-alcoholic fatty liver disease: A new and important cardiovascular risk factor? Eur. Heart J. 2012, 33, 1190–1200. [Google Scholar] [CrossRef] [Green Version]
- Tokushige, K.; Ikejima, K.; Ono, M.; Eguchi, Y.; Kamada, Y.; Itoh, Y.; Akuta, N.; Yoneda, M.; Iwasa, M.; Yoneda, M.; et al. Evidence-based clinical practice guidelines for nonalcoholic fatty liver disease/nonalcoholic steatohepatitis 2020. J. Gastroenterol. 2021, 56, 951. [Google Scholar] [CrossRef] [PubMed]
- Hsu, P.; Wang, Y.; Lin, C.; Wang, Y.; Ding, Y.; Liou, T.; Huang, S.; Lu, T.; Chan, W.; Lin, S.; et al. The association of the steatosis severity in fatty liver disease with coronary plaque pattern in general population. Liver Int. 2021, 41, 81–90. [Google Scholar] [CrossRef]
- Min, J.K.; Shaw, L.J.; Devereux, R.B.; Okin, P.M.; Weinsaft, J.W.; Russo, D.J.; Lippolis, N.J.; Berman, D.S.; Callister, T.Q. Prognostic Value of Multidetector Coronary Computed Tomographic Angiography for Prediction of All-Cause Mortality. J. Am. Coll. Cardiol. 2007, 50, 1161–1170. [Google Scholar] [CrossRef] [Green Version]
- Camargo, G.C.; Rothstein, T.; Derenne, M.E.; Sabioni, L.; Lima, J.A.C.; Lima, R.D.S.L.; Gottlieb, I. Factors Associated with Coronary Artery Disease Progression Assessed By Serial Coronary Computed Tomography Angiography. Arq. Bras. Cardiol. 2017, 108, 396–404. [Google Scholar] [CrossRef]
- Shi, R.; Shi, K.; Yang, Z.-G.; Guo, Y.-K.; Diao, K.-Y.; Gao, Y.; Zhang, Y.; Huang, S. Serial coronary computed tomography angiography-verified coronary plaque progression: Comparison of stented patients with or without diabetes. Cardiovasc. Diabetol. 2019, 18, 123. [Google Scholar] [CrossRef]
- Fernández-Friera, L.; Fuster, V.; López-Melgar, B.; Oliva, B.; García-Ruiz, J.M.; Mendiguren, J.; Bueno, H.; Pocock, S.; Ibáñez, B.; Fernández-Ortiz, A.; et al. Normal LDL-Cholesterol Levels Are Associated with Subclinical Atherosclerosis in the Absence of Risk Factors. J. Am. Coll. Cardiol. 2017, 70, 2979–2991. [Google Scholar] [CrossRef]
- Wang, W.T.; Hsu, P.F.; Lin, C.C.; Wang, Y.J.; Ding, Y.Z.; Liou, T.L.; Wang, Y.W.; Huang, S.S.; Lu, T.M.; Huang, P.H.; et al. Hemoglobin A1C Levels are Independently Associated with the Risk of Coronary Atherosclerotic Plaques in Patients without Diabetes: A Cross-Sectional Study. J. Atheroscler. Thromb. 2020, 27, 789–800. [Google Scholar] [CrossRef] [PubMed] [Green Version]
- Han, D.; Berman, D.S.; Miller, R.J.; Andreini, D.; Budoff, M.J.; Cademartiri, F.; Chinnaiyan, K.; Choi, J.H.; Conte, E.; Marques, H.; et al. Association of Cardiovascular Disease Risk Factor Burden with Progression of Coronary Atherosclerosis Assessed by Serial Coronary Computed Tomographic Angiography. JAMA Netw. Open 2020, 3, e2011444. [Google Scholar] [CrossRef] [PubMed]
- Browning, J.D.; Szczepaniak, L.S.; Dobbins, R.; Nuremberg, P.; Horton, J.D.; Cohen, J.C.; Grundy, S.M.; Hobbs, H.H. Prevalence of hepatic steatosis in an urban population in the United States: Impact of ethnicity. Hepatology 2004, 40, 1387–1395. [Google Scholar] [CrossRef] [PubMed]
- Song, D.S.; Im Chang, U.; Kang, S.G.; Song, S.W.; Yang, J.M. Noninvasive Serum Fibrosis Markers are Associated with Coronary Artery Calcification in Patients with Nonalcoholic Fatty Liver Disease. Gut Liver 2019, 13, 658. [Google Scholar] [CrossRef] [PubMed]
- Sinn, D.H.; Kang, D.; Chang, Y.; Ryu, S.; Gu, S.; Kim, H.; Seong, D.; Cho, S.J.; Yi, B.-K.; Park, H.-D.; et al. Non-alcoholic fatty liver disease and progression of coronary artery calcium score: A retrospective cohort study. Gut 2017, 66, 323–329. [Google Scholar] [CrossRef]
- Assy, N.; Djibre, A.; Farah, R.; Grosovski, M.; Marmor, A. Presence of coronary plaques in patients with nonalcoholic fatty liver disease. Radiology 2010, 254, 393–400. [Google Scholar] [CrossRef] [PubMed] [Green Version]
- Sinn, D.H.; Cho, S.J.; Gu, S.; Seong, D.; Kang, D.; Kim, H.; Yi, B.-K.; Paik, S.W.; Guallar, E.; Cho, J.; et al. Persistent Nonalcoholic Fatty Liver Disease Increases Risk for Carotid Atherosclerosis. Gastroenterology 2016, 151, 481–488.e1. [Google Scholar] [CrossRef]
- Puchner, S.B.; Lu, M.T.; Mayrhofer, T.; Liu, T.; Pursnani, A.; Ghoshhajra, B.B.; Truong, Q.A.; Wiviott, S.D.; Fleg, J.L.; Hoffmann, U.; et al. High-risk coronary plaque at coronary CT angiography is associated with nonalcoholic fatty liver disease, independent of coronary plaque and stenosis burden: Results from the ROMICAT II trial. Radiology 2015, 274, 693–701. [Google Scholar] [CrossRef] [Green Version]
- Ong, J.P.; Pitts, A.; Younossi, Z.M. Increased overall mortality and liver-related mortality in non-alcoholic fatty liver disease. J. Hepatol. 2008, 49, 608–612. [Google Scholar] [CrossRef] [PubMed]
- Ekstedt, M.; Hagström, H.; Nasr, P.; Fredrikson, M.; Stål, P.; Kechagias, S.; Hultcrantz, R. Fibrosis stage is the strongest predictor for disease-specific mortality in NAFLD after up to 33 years of follow-up. Hepatology 2015, 61, 1547–1554. [Google Scholar] [CrossRef] [PubMed] [Green Version]
- Turan, Y. The Nonalcoholic Fatty Liver Disease Fibrosis Score Is Related to Epicardial Fat Thickness and Complexity of Coronary Artery Disease. Angiology 2020, 71, 77–82. [Google Scholar] [CrossRef] [PubMed]
- Higashiura, Y.; Tanaka, M.; Mori, K.; Mikami, T.; Hosaka, I.; Ohnishi, H.; Hanawa, N.; Furuhashi, M. High fibrosis-4 (FIB-4) index predicts new onset of ischemic heart disease during a 10-year period in a general population. Eur. Heart J. Open 2022, 2, oeac030. [Google Scholar] [CrossRef]
- Jang, S.Y.; Tak, W.Y.; Park, S.Y.; Kweon, Y.O.; Lee, Y.R.; Kim, G.; Hur, K.; Han, M.H.; Lee, W.K. Diagnostic Efficacy of Serum Mac-2 Binding Protein Glycosylation Isomer and Other Markers for Liver Fibrosis in Non-Alcoholic Fatty Liver Diseases. Ann. Lab. Med. 2021, 41, 302–309. [Google Scholar] [CrossRef] [PubMed]
- Lee, J.; Vali, Y.; Boursier, J.; Spijker, R.; Anstee, Q.M.; Bossuyt, P.M.; Zafarmand, M.H. Prognostic accuracy of FIB-4, NAFLD fibrosis score and APRI for NAFLD-related events: A systematic review. Liver Int. 2021, 41, 261–270. [Google Scholar] [CrossRef]
- Önnerhag, K.; Hartman, H.; Nilsson, P.M.; Lindgren, S. Non-invasive fibrosis scoring systems can predict future metabolic complications and overall mortality in non-alcoholic fatty liver disease (NAFLD). Scand. J. Gastroenterol. 2019, 54, 328–334. [Google Scholar] [CrossRef] [PubMed] [Green Version]
- Lee, J.; Kim, H.S.; Cho, Y.K.; Kim, E.H.; Lee, M.J.; Bae, I.Y.; Jung, C.H.; Park, J.-Y.; Kim, H.-K.; Lee, W.J. Association between noninvasive assessment of liver fibrosis and coronary artery calcification progression in patients with nonalcoholic fatty liver disease. Sci. Rep. 2020, 10, 18323. [Google Scholar] [CrossRef]
- Miptah, H.N.; Ramli, A.S.; Mohamad, M.; Hashim, H.; Tharek, Z. Non-alcoholic fatty liver disease (NAFLD) and the cardiovascular disease (CVD) risk categories in primary care: Is there an association? BMC Fam. Pract. 2020, 21, 238. [Google Scholar] [CrossRef]
- Ismaiel, A.; Dumitraşcu, D.L. Cardiovascular Risk in Fatty Liver Disease: The Liver-Heart Axis—Literature Review. Front. Med. 2019, 6, 202. [Google Scholar] [CrossRef] [PubMed] [Green Version]
- Bild, D.E.; Folsom, A.R.; Lowe, L.P.; Sidney, S.; Kiefe, C.; Westfall, A.O.; Zheng, Z.-J.; Rumberger, J. Prevalence and Correlates of Coronary Calcification in Black and White Young Adults. Arterioscler. Thromb. Vasc. Biol. 2001, 21, 852–857. [Google Scholar] [CrossRef] [PubMed] [Green Version]
- Whelton, S.P.; McEvoy, J.W.; Shaw, L.; Psaty, B.M.; Lima, J.A.C.; Budoff, M.; Nasir, K.; Szklo, M.; Blumenthal, R.S.; Blaha, M.J. Association of Normal Systolic Blood Pressure Level with Cardiovascular Disease in the Absence of Risk Factors. JAMA Cardiol. 2020, 5, 1011–1018. [Google Scholar] [CrossRef] [PubMed]
- Bangalore, S.; Qin, J.; Sloan, S.; Murphy, S.A.; Cannon, C.P. What is the optimal blood pressure in patients after acute coronary syndromes?: Relationship of blood pressure and cardiovascular events in the pravastatin or atorvastatin evaluation and infection therapy-thrombolysis in myocardial infarction (PROVE IT-TIMI) 22 trial. Circulation 2010, 122, 2142–2151. [Google Scholar] [PubMed] [Green Version]
- Bergmark, B.A.; Scirica, B.M.; Steg, P.G.; Fanola, C.L.; Gurmu, Y.; Mosenzon, O.; Cahn, A.; Raz, I.; Bhatt, D.L. Blood pressure and cardiovascular outcomes in patients with diabetes and high cardiovascular risk. Eur. Heart J. 2018, 39, 2255. [Google Scholar] [CrossRef]
- Sipahi, I.; Tuzcu, E.M.; Schoenhagen, P.; Wolski, K.E.; Nicholls, S.; Balog, C.; Crowe, T.D.; Nissen, S.E. Effects of Normal, Pre-Hypertensive, and Hypertensive Blood Pressure Levels on Progression of Coronary Atherosclerosis. J. Am. Coll. Cardiol. 2006, 48, 833–838. [Google Scholar] [CrossRef] [Green Version]
- Vidal-Petiot, E.; Greenlaw, N.; Ford, I.; Ferrari, R.; Fox, K.M.; Tardif, J.-C.; Tendera, M.; Parkhomenko, A.; Bhatt, D.L.; Steg, P.G.; et al. Relationships between Components of Blood Pressure and Cardiovascular Events in Patients with Stable Coronary Artery Disease and Hypertension. Hypertension 2018, 71, 168–176. [Google Scholar] [CrossRef] [Green Version]
- Nissen, S.E.; Tuzcu, E.M.; Libby, P.; Thompson, P.D.; Ghali, M.; Garza, D.; Berman, L.; Shi, H.; Buebendorf, E.; Topol, E.J.; et al. Effect of antihypertensive agents on cardiovascular events in patients with coronary disease and normal blood pressure: The CAMELOT study: A randomized controlled trial. JAMA 2004, 292, 2217–2226. [Google Scholar] [CrossRef] [Green Version]


| Characteristics | Overall n = 165 | SSS Zero n = 74 | SSS Positive n = 91 | p-Value |
|---|---|---|---|---|
| Male Gender (n, %) | 121 (73.3%) | 59 (64.8%) | 62 (83.8%) | 0.008 |
| Age (y/o) | 58.5 ± 8.6 | 56.7 ± 8.8 | 60.8 ± 7.9 | 0.002 |
| BMI | 25.1 ± 3.1 | 24.8 ± 3.2 | 25.4 ± 2.9 | 0.197 |
| Hypertension (n, %) | 55 (34.8%) | 21 (23.9%) | 34 (48.6%) | 0.001 |
| Diabetes (n, %) | 16 (10.1%) | 4 (4.5%) | 12 (17.1%) | 0.015 |
| Dyslipidemia (n, %) | 46 (29.1%) | 22 (25.0%) | 24 (34.3%) | 0.221 |
| Smoking (n, %) | 51 (31.1%) | 29 (31.9%) | 22 (30.1%) | 0.866 |
| Drinking (n, %) | 71 (43.6%) | 40 (44.0%) | 31 (43.1%) | 1.000 |
| Cholesterol | 206.6 ± 38.3 | 209.8 ± 33.9 | 202.6 ± 42.9 | 0.226 |
| Triglyceride | 143.3 ± 80.5 | 143.9 ± 85.3 | 142.6 ± 74.9 | 0.914 |
| Uric acid | 6.5 ± 1.5 | 6.3 ± 1.4 | 6.8 ± 1.5 | 0.057 |
| HDL | 46.6 ± 13.4 | 48.0 ± 14.7 | 44.8 ± 11.5 | 0.128 |
| LDL | 129.9 ± 33.3 | 131.1 ± 31.3 | 128.4 ± 35.7 | 0.608 |
| Glucose | 98.8 ± 24.4 | 96.2 ± 20.7 | 101.9 ± 28.2 | 0.142 |
| AST | 25.9 ± 0.0 | 25.5 ± 0.0 | 26.4 ± 0.0 | 0.539 |
| ALT | 30.6 ± 0.0 | 31.3 ± 0.0 | 29.7 ± 0.0 | 0.569 |
| ALK-P | 64.0 ± 17.8 | 64.7 ± 16.6 | 63.2 ± 19.2 | 0.581 |
| Total bilirubin | 1.1 ± 0.5 | 1.1 ± 0.4 | 1.1 ± 0.5 | 0.931 |
| Direct bilirubin | 0.3 ± 0.1 | 0.3 ± 0.1 | 0.3 ± 0.1 | 0.857 |
| GGT | 33.0 ± 25.7 | 35.7 ± 29.2 | 29.5 ± 20.3 | 0.112 |
| LDH | 176.6 ± 51.1 | 173.2 ± 29.2 | 180.7 ± 69.1 | 0.350 |
| Albumin | 4.5 ± 0.2 | 4.5 ± 0.2 | 4.4 ± 0.3 | 0.342 |
| Total protein | 7.3 ± 0.5 | 7.3 ± 0.5 | 7.3 ± 0.5 | 0.673 |
| BUN | 12.9 ± 3.8 | 12.6 ± 3.6 | 13.3 ± 4.1 | 0.262 |
| Creatinine | 0.9 ± 0.2 | 0.9 ± 0.2 | 0.9 ± 0.2 | 0.111 |
| eGFR | 82.5 ± 12.1 | 82.9 ± 11.1 | 82.1 ± 13.3 | 0.675 |
| HsCRP | 0.2 ± 0.3 | 0.3 ± 0.4 | 0.2 ± 0.1 | 0.589 |
| CK | 95.7 ± 0.0 | 79.6 ± 0.0 | 115.3 ± 0.0 | 0.235 |
| Na | 141.3 ± 1.9 | 141.4 ± 2.0 | 141.1 ± 1.8 | 0.294 |
| K | 4.1 ± 0.3 | 4.1 ± 0.4 | 4.1 ± 0.3 | 0.389 |
| SBP | 122.8 ± 17.6 | 118.5 ± 17.7 | 128.0 ± 16.2 | 0.001 |
| DBP | 77.5 ± 10.4 | 75.6 ± 10.4 | 79.8 ± 9.9 | 0.010 |
| APRI | 0.3 ± 0.1 | 0.3 ± 0.1 | 0.3 ± 0.2 | 0.273 |
| Forns score | 4.9 ± 0.7 | 4.8 ± 0.6 | 5.0 ± 0.8 | 0.035 |
| FIB-4 | 1.3 ± 0.6 | 1.3 ± 0.5 | 1.4 ± 0.6 | 0.042 |
| NFS | −2.0 ± 1.1 | −2.2 ± 1.0 | −1.7 ± 1.1 | 0.003 |
| LVEF | 62.3 ± 7.0 | 61.1 ± 6.7 | 63.7 ± 7.0 | 0.033 |
| Baseline CAC | 12.9 ± 23.6 | 1.0 ± 5.0 | 27.5 ± 28.7 | <0.001 |
| Baseline SSS | 1.2 ± 2.0 | 0.0 ± 0.0 | 2.7 ± 2.2 | <0.001 |
| Characteristics | Overall n = 165 | No SSS Progression n = 105 | SSS Progression n = 60 | p-Value |
|---|---|---|---|---|
| Male Gender (n, %) | 121 (73.3%) | 69 (65.7%) | 52 (86.7%) | 0.003 |
| Age (y/o) | 58.5 ± 0.7 | 57.3 ± 8.8 | 60.6 ± 8.0 | 0.021 |
| BMI | 25.1 ± 0.2 | 24.9 ± 3.1 | 25.3 ± 3.1 | 0.489 |
| Hypertension (n, %) | 55 (34.8%) | 32 (31.4%) | 23 (41.1%) | 0.228 |
| Diabetes (n, %) | 16 (10.1%) | 6 (5.9%) | 10 (17.9%) | 0.026 |
| Dyslipidemia (n, %) | 46 (29.1%) | 30 (29.4%) | 16 (28.6%) | 1.000 |
| Smoking (n, %) | 51 (31.1%) | 29 (27.9%) | 22 (36.7%) | 0.294 |
| Drinking (n, %) | 71 (43.6%) | 43 (41.7%) | 28 (46.7%) | 0.624 |
| Cholesterol | 206.6 ± 3.0 | 208.7 ± 35.3 | 202.9 ± 43.0 | 0.352 |
| Triglyceride | 143.3 ± 6.3 | 144.3 ± 84.5 | 141.6 ± 73.8 | 0.832 |
| Uric acid | 6.5 ± 0.1 | 6.4 ± 1.5 | 6.7 ± 1.6 | 0.282 |
| HDL | 46.6 ± 1.0 | 47.9 ± 14.2 | 44.3 ± 11.8 | 0.096 |
| LDL | 129.9 ± 2.6 | 130.2 ± 31.3 | 129.4 ± 36.8 | 0.881 |
| Glucose | 98.8 ± 1.9 | 96.7 ± 20.1 | 102.3 ± 30.4 | 0.205 |
| AST | 25.9 ± 0.8 | 25.9 ± 0.0 | 26.0 ± 0.0 | 0.931 |
| ALT | 30.6 ± 1.3 | 30.5 ± 0.0 | 30.8 ± 0.0 | 0.930 |
| ALK-P | 64.0 ± 1.4 | 63.1 ± 15.2 | 65.5 ± 21.6 | 0.407 |
| Total bilirubin | 1.1 ± 0.0 | 1.0 ± 0.4 | 1.1 ± 0.6 | 0.260 |
| Direct bilirubin | 0.3 ± 0.0 | 0.3 ± 0.1 | 0.4 ± 0.1 | 0.420 |
| GGT | 33.0 ± 2.0 | 32.5 ± 25.4 | 33.8 ± 26.6 | 0.755 |
| LDH | 176.6 ± 4.0 | 171.9 ± 27.2 | 185.0 ± 76.8 | 0.114 |
| Albumin | 4.5 ± 0.0 | 4.5 ± 0.2 | 4.4 ± 0.2 | 0.246 |
| Total protein | 7.3 ± 0.0 | 7.3 ± 0.4 | 7.3 ± 0.5 | 0.730 |
| BUN | 12.9 ± 0.3 | 12.6 ± 3.8 | 13.5 ± 3.8 | 0.184 |
| Creatinine | 0.9 ± 0.0 | 0.9 ± 0.2 | 0.9 ± 0.1 | 0.440 |
| eGFR | 82.5 ± 0.9 | 82.0 ± 11.7 | 83.5 ± 12.7 | 0.431 |
| HsCRP | 0.2 ± 0.1 | 0.2 ± 0.4 | 0.2 ± 0.1 | 0.813 |
| CK | 95.7 ± 14.9 | 79.8 ± 0.0 | 124.0 ± 0.0 | 0.280 |
| Na | 141.3 ± 0.2 | 141.3 ± 1.9 | 141.1 ± 1.9 | 0.551 |
| K | 4.1 ± 0.0 | 4.1 ± 0.4 | 4.1 ± 0.3 | 0.970 |
| SBP | 122.8 ± 1.4 | 119.4 ± 16.1 | 128.7 ± 18.7 | 0.001 |
| DBP | 77.5 ± 0.8 | 75.4 ± 10.1 | 81.0 ± 9.9 | 0.001 |
| APRI | 0.3 ± 0.0 | 0.3 ± 0.1 | 0.3 ± 0.2 | 0.182 |
| Forns score | 4.9 ± 0.1 | 4.8 ± 0.6 | 5.1 ± 0.8 | 0.006 |
| FIB-4 | 1.3 ± 0.0 | 1.3 ± 0.5 | 1.5 ± 0.6 | 0.056 |
| NFS | −2.0 ± 0.1 | −2.2 ± 1.0 | −1.6 ± 1.0 | 0.001 |
| LVEF | 62.3 ± 0.6 | 62.1 ± 6.9 | 62.7 ± 7.1 | 0.669 |
| Baseline CAC | 12.9 ± 1.8 | 8.6 ± 19.2 | 20.4 ± 28.4 | 0.002 |
| Baseline SSS | 1.2 ± 0.2 | 1.0 ± 1.9 | 1.5 ± 2.0 | 0.059 |
| Unadjusted (Model 1) | Adjusted * (Model 2) | |||
|---|---|---|---|---|
| HR (95% CI) | p-Value | HR (95% CI) | p-Value | |
| Age | 1.05 (1.01–1.09) | 0.023 | ||
| Gender | 3.39 (1.45–7.91) | 0.005 | 3.055 (1.181–7.902) | 0.021 |
| Hypertension | 1.52 (0.77–3.00) | 0.222 | ||
| Diabetes | 3.48 (1.19–10.15) | 0.023 | ||
| Hyperlipidemia | 0.96 (0.47–1.97) | 0.911 | ||
| BMI | 1.04 (0.94–1.15) | 0.486 | ||
| SBP | 1.03 (1.01–1.05) | 0.001 | ||
| DBP | 1.06 (1.02–1.09) | 0.001 | 1.051 (1.011–1.093) | 0.013 |
| Smoking | 1.50 (0.76–2.95) | 0.243 | ||
| Drinking | 1.22 (0.64–2.32) | 0.541 | ||
| Cholesterol | 1.00 (0.99–1.00) | 0.350 | ||
| Triglyceride | 1.00 (1.00–1.00) | 0.830 | ||
| Uric acid | 1.12 (0.91–1.39) | 0.281 | ||
| HDL | 0.98 (0.95–1.00) | 0.099 | ||
| LDL | 1.00 (0.99–1.01) | 0.880 | ||
| GLU | 1.01 (1.00–1.02) | 0.170 | ||
| AST | 1.00 (0.97–1.03) | 0.930 | ||
| ALT | 1.00 (0.98–1.02) | 0.930 | ||
| ALK-P | 1.01 (0.99–1.03) | 0.406 | ||
| Total bilirubin | 1.47 (0.75–2.88) | 0.261 | ||
| Direct bilirubin | 2.92 (0.22–38.99) | 0.418 | ||
| GGT | 1.00 (0.99–1.01) | 0.753 | ||
| LDH | 1.01 (1.00–1.01) | 0.184 | ||
| Albumin | 0.46 (0.12–1.73) | 0.250 | ||
| Total protein | 0.88 (0.44–1.77) | 0.728 | ||
| BUN | 1.06 (0.97–1.15) | 0.185 | ||
| Creatinine | 2.04 (0.31–13.56) | 0.460 | ||
| HsCRP | 0.62 (0.01–27.93) | 0.803 | ||
| CK | 1.00 (1.00–1.01) | 0.379 | ||
| NA | 0.95 (0.81–1.12) | 0.549 | ||
| K | 1.02 (0.40–2.57) | 0.970 | ||
| LVEF | 1.01 (0.96–1.06) | 0.666 | ||
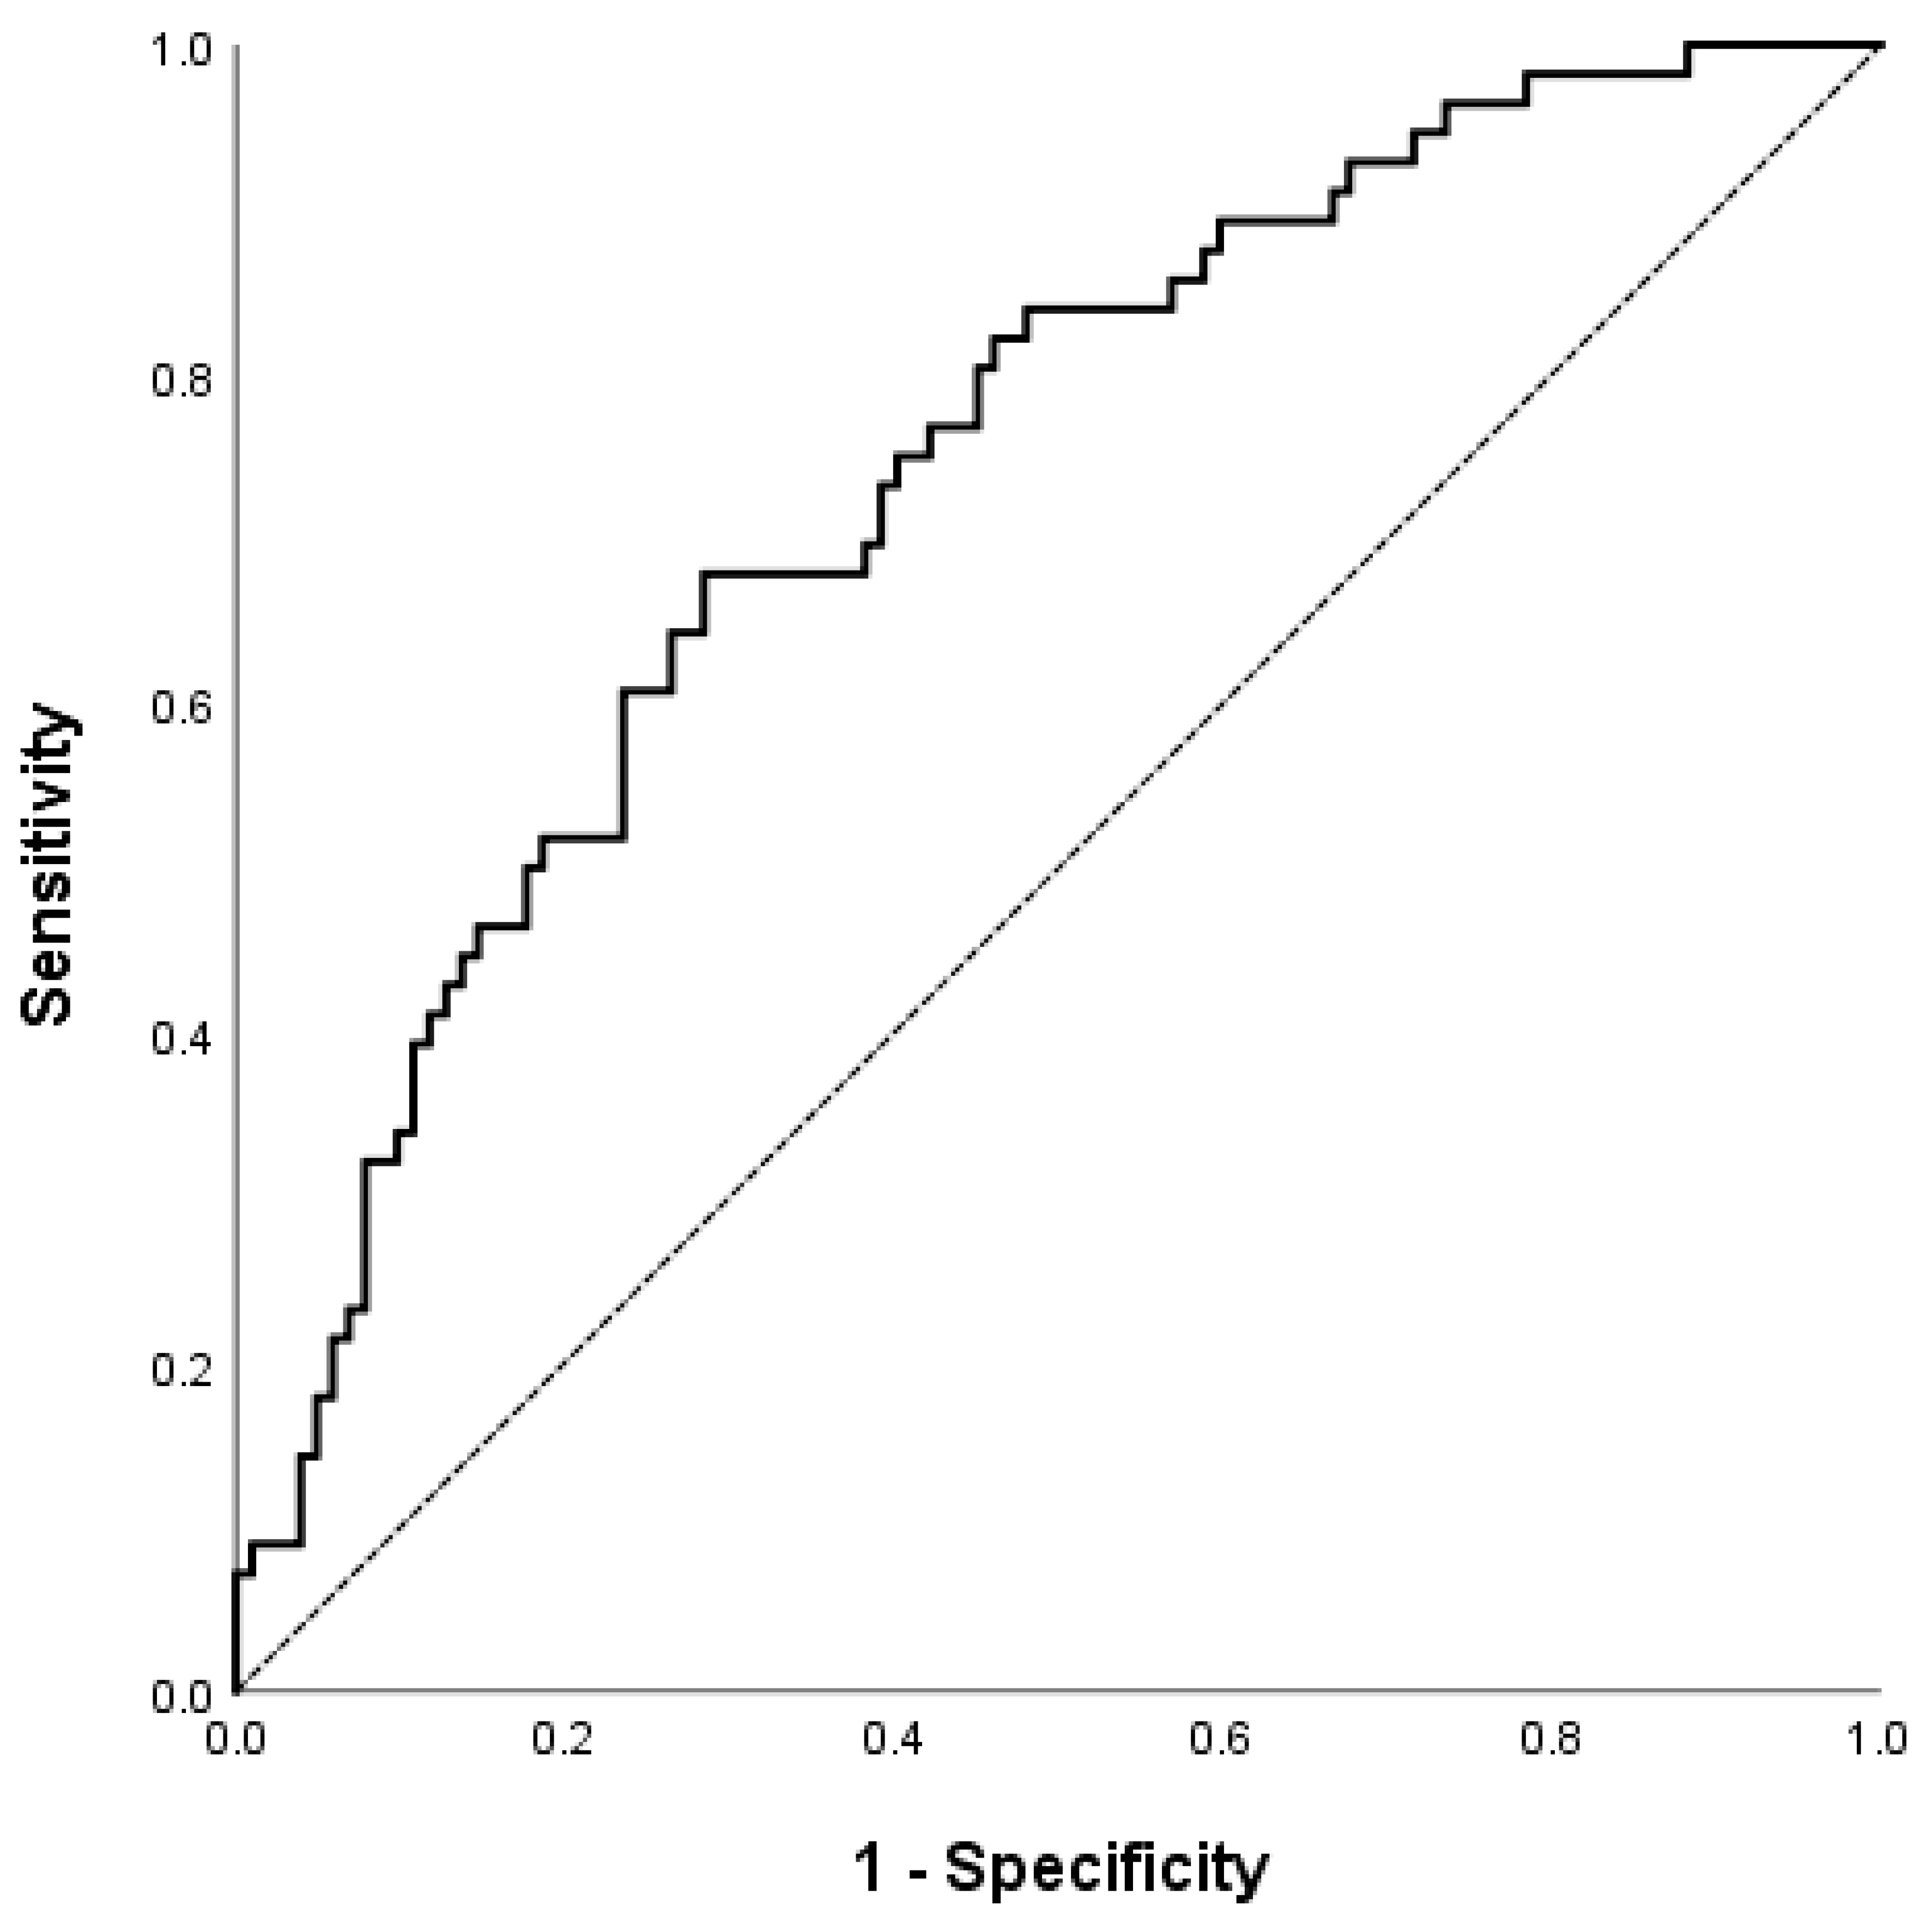
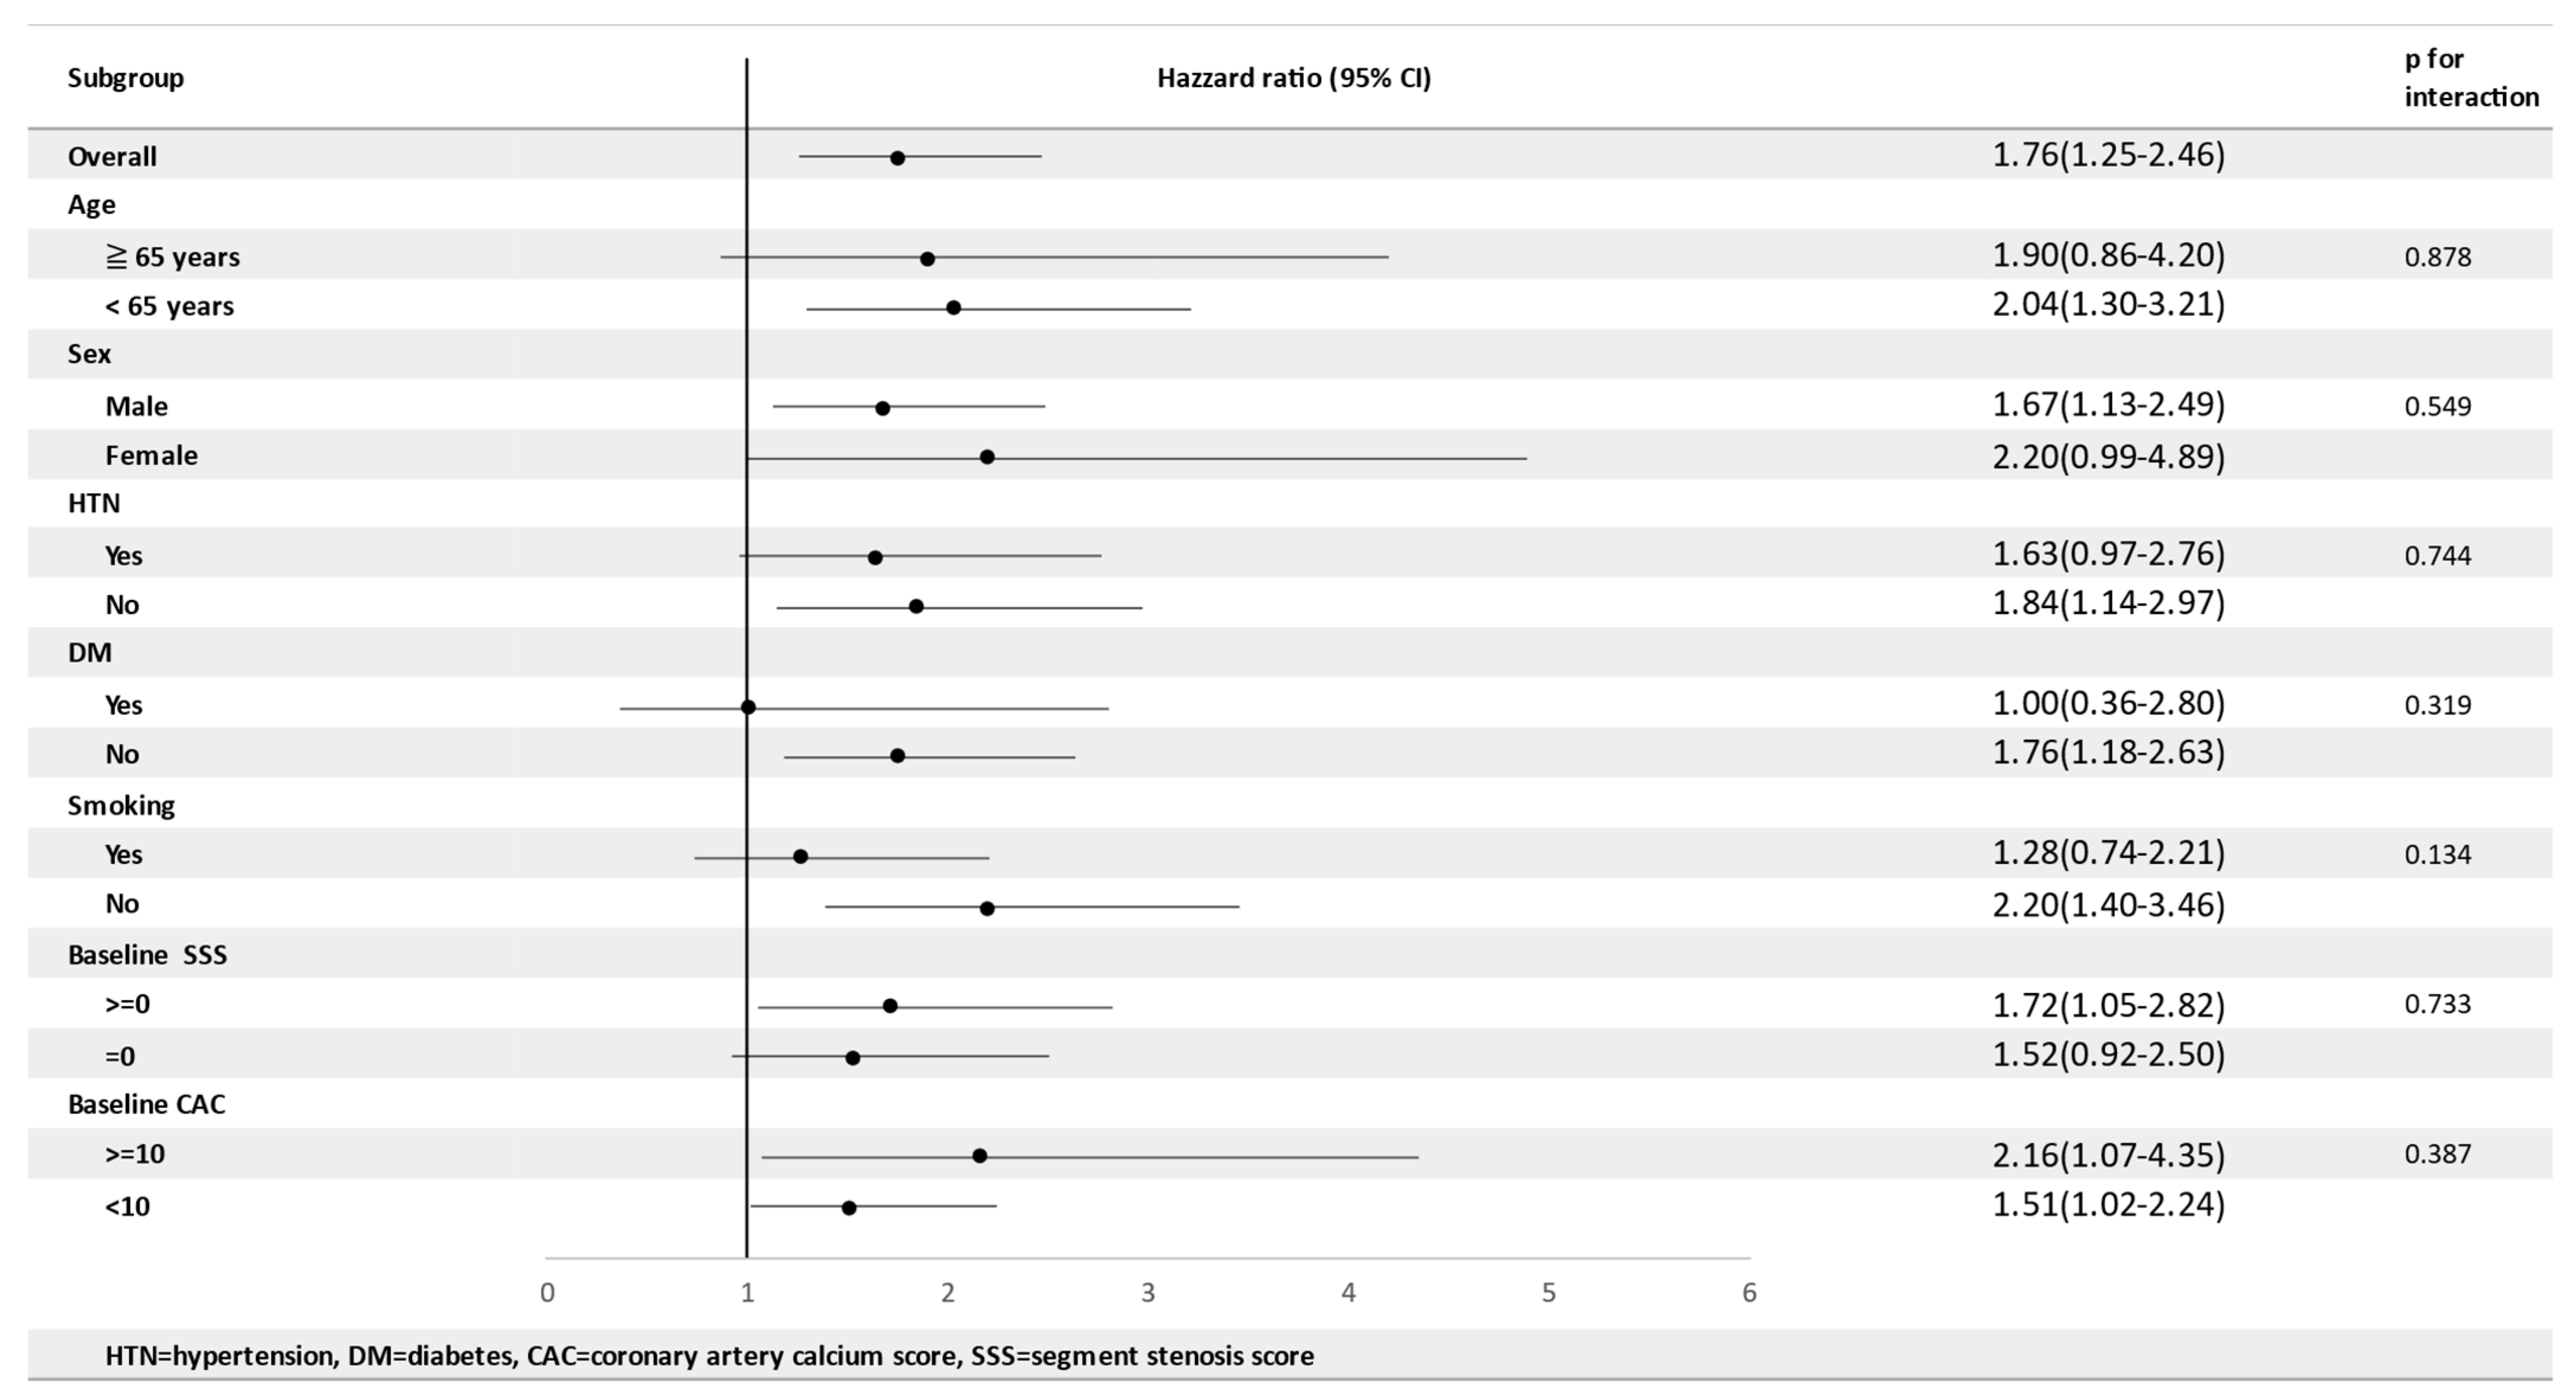
| NFS | 1.76 (1.25–2.46) | 0.001 | 1.674 (1.169–2.397) | 0.005 |
| FIB-4 | 1.70 (0.98–2.95) | 0.059 | ||
| APRI | 4.54 (0.47–43.40) | 0.189 | ||
| Forns score | 1.91 (1.19–3.06) | 0.007 | ||
| Baseline CAC | 1.02 (1.01–1.04) | 0.003 | ||
| Baseline SSS | 1.13 (0.96–1.32) | 0.147 | ||
Publisher’s Note: MDPI stays neutral with regard to jurisdictional claims in published maps and institutional affiliations. |
© 2022 by the authors. Licensee MDPI, Basel, Switzerland. This article is an open access article distributed under the terms and conditions of the Creative Commons Attribution (CC BY) license (https://creativecommons.org/licenses/by/4.0/).
Share and Cite
Tsai, T.-Y.; Hsu, P.-F.; Wu, C.-H.; Huang, S.-S.; Chan, W.-L.; Lin, S.-J.; Chen, J.-W.; Lu, T.-M.; Leu, H.-B. Association between Coronary Artery Plaque Progression and Liver Fibrosis Biomarkers in Population with Low Calcium Scores. Nutrients 2022, 14, 3163. https://doi.org/10.3390/nu14153163
Tsai T-Y, Hsu P-F, Wu C-H, Huang S-S, Chan W-L, Lin S-J, Chen J-W, Lu T-M, Leu H-B. Association between Coronary Artery Plaque Progression and Liver Fibrosis Biomarkers in Population with Low Calcium Scores. Nutrients. 2022; 14(15):3163. https://doi.org/10.3390/nu14153163
Chicago/Turabian StyleTsai, Tsung-Ying, Pai-Feng Hsu, Cheng-Hsueh Wu, Shao-Sung Huang, Wan-Leong Chan, Shing-Jong Lin, Jaw-Wen Chen, Tse-Min Lu, and Hsin-Bang Leu. 2022. "Association between Coronary Artery Plaque Progression and Liver Fibrosis Biomarkers in Population with Low Calcium Scores" Nutrients 14, no. 15: 3163. https://doi.org/10.3390/nu14153163