
Impact of DHA from Algal Oil on the Breast Milk DHA Levels of Lactating Women: A Randomized Controlled Trial in China

 and
and
Abstract
:
1. Introduction
2. Materials and Methods
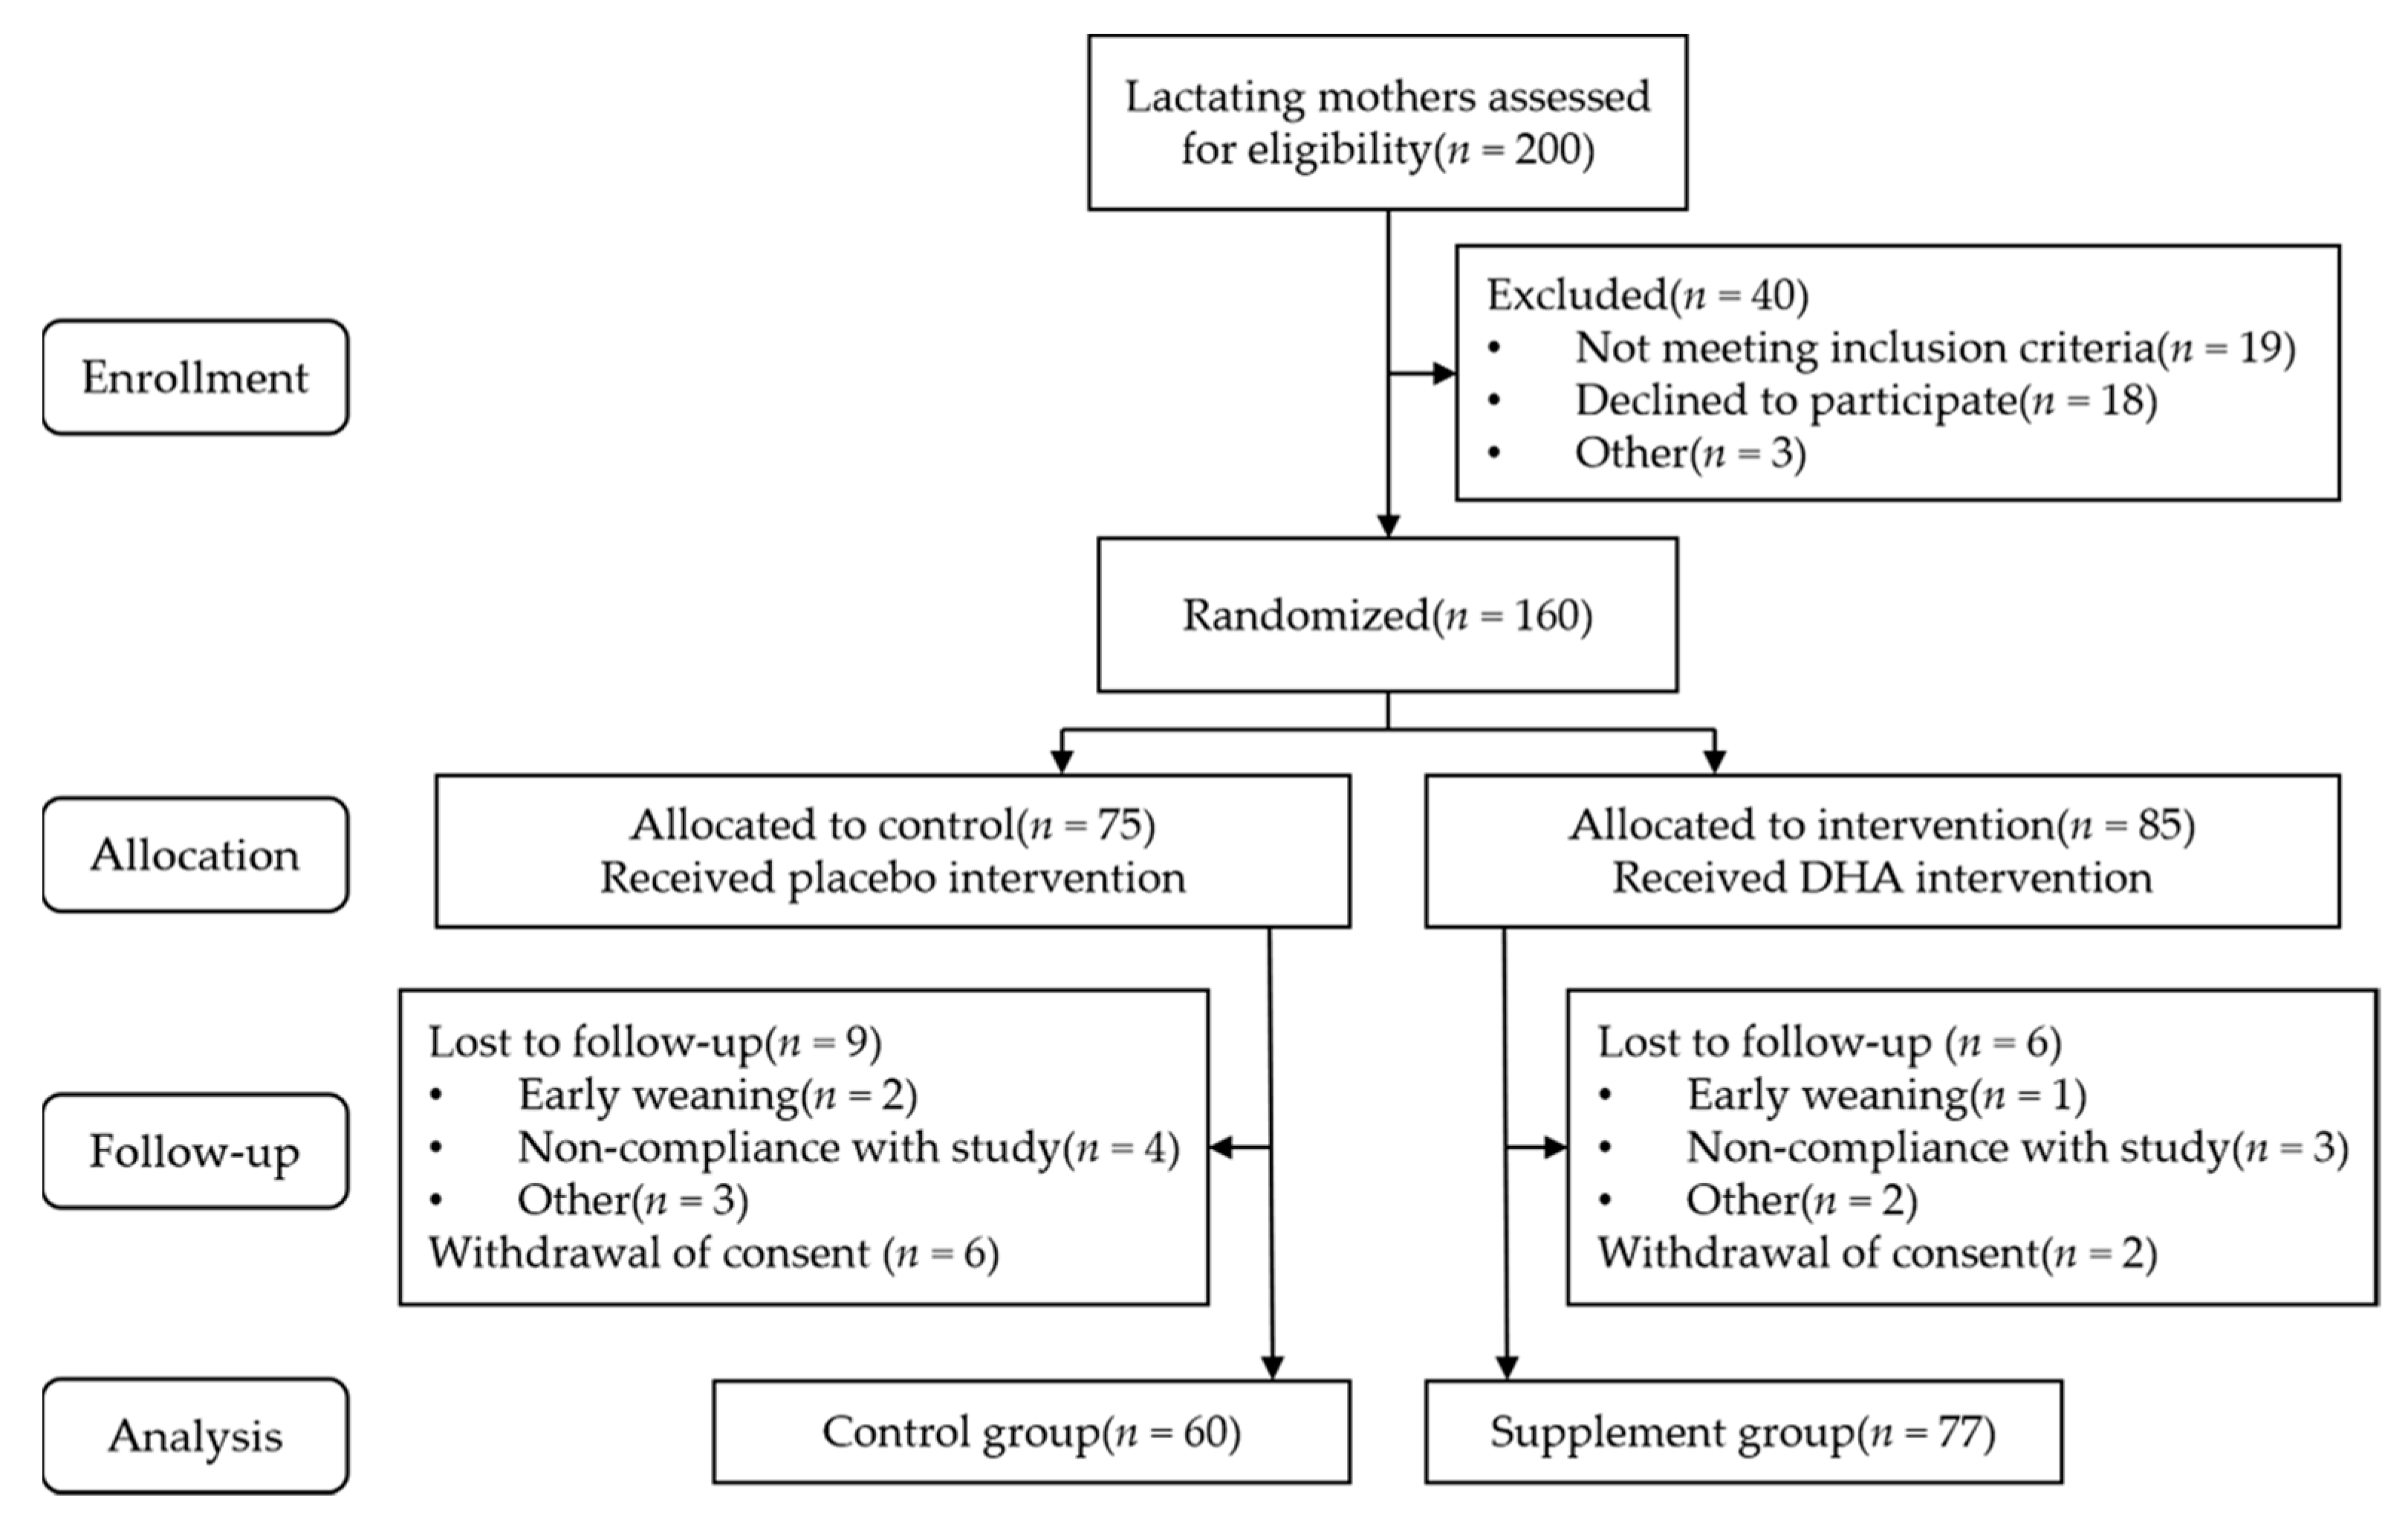
2.1. Subjects
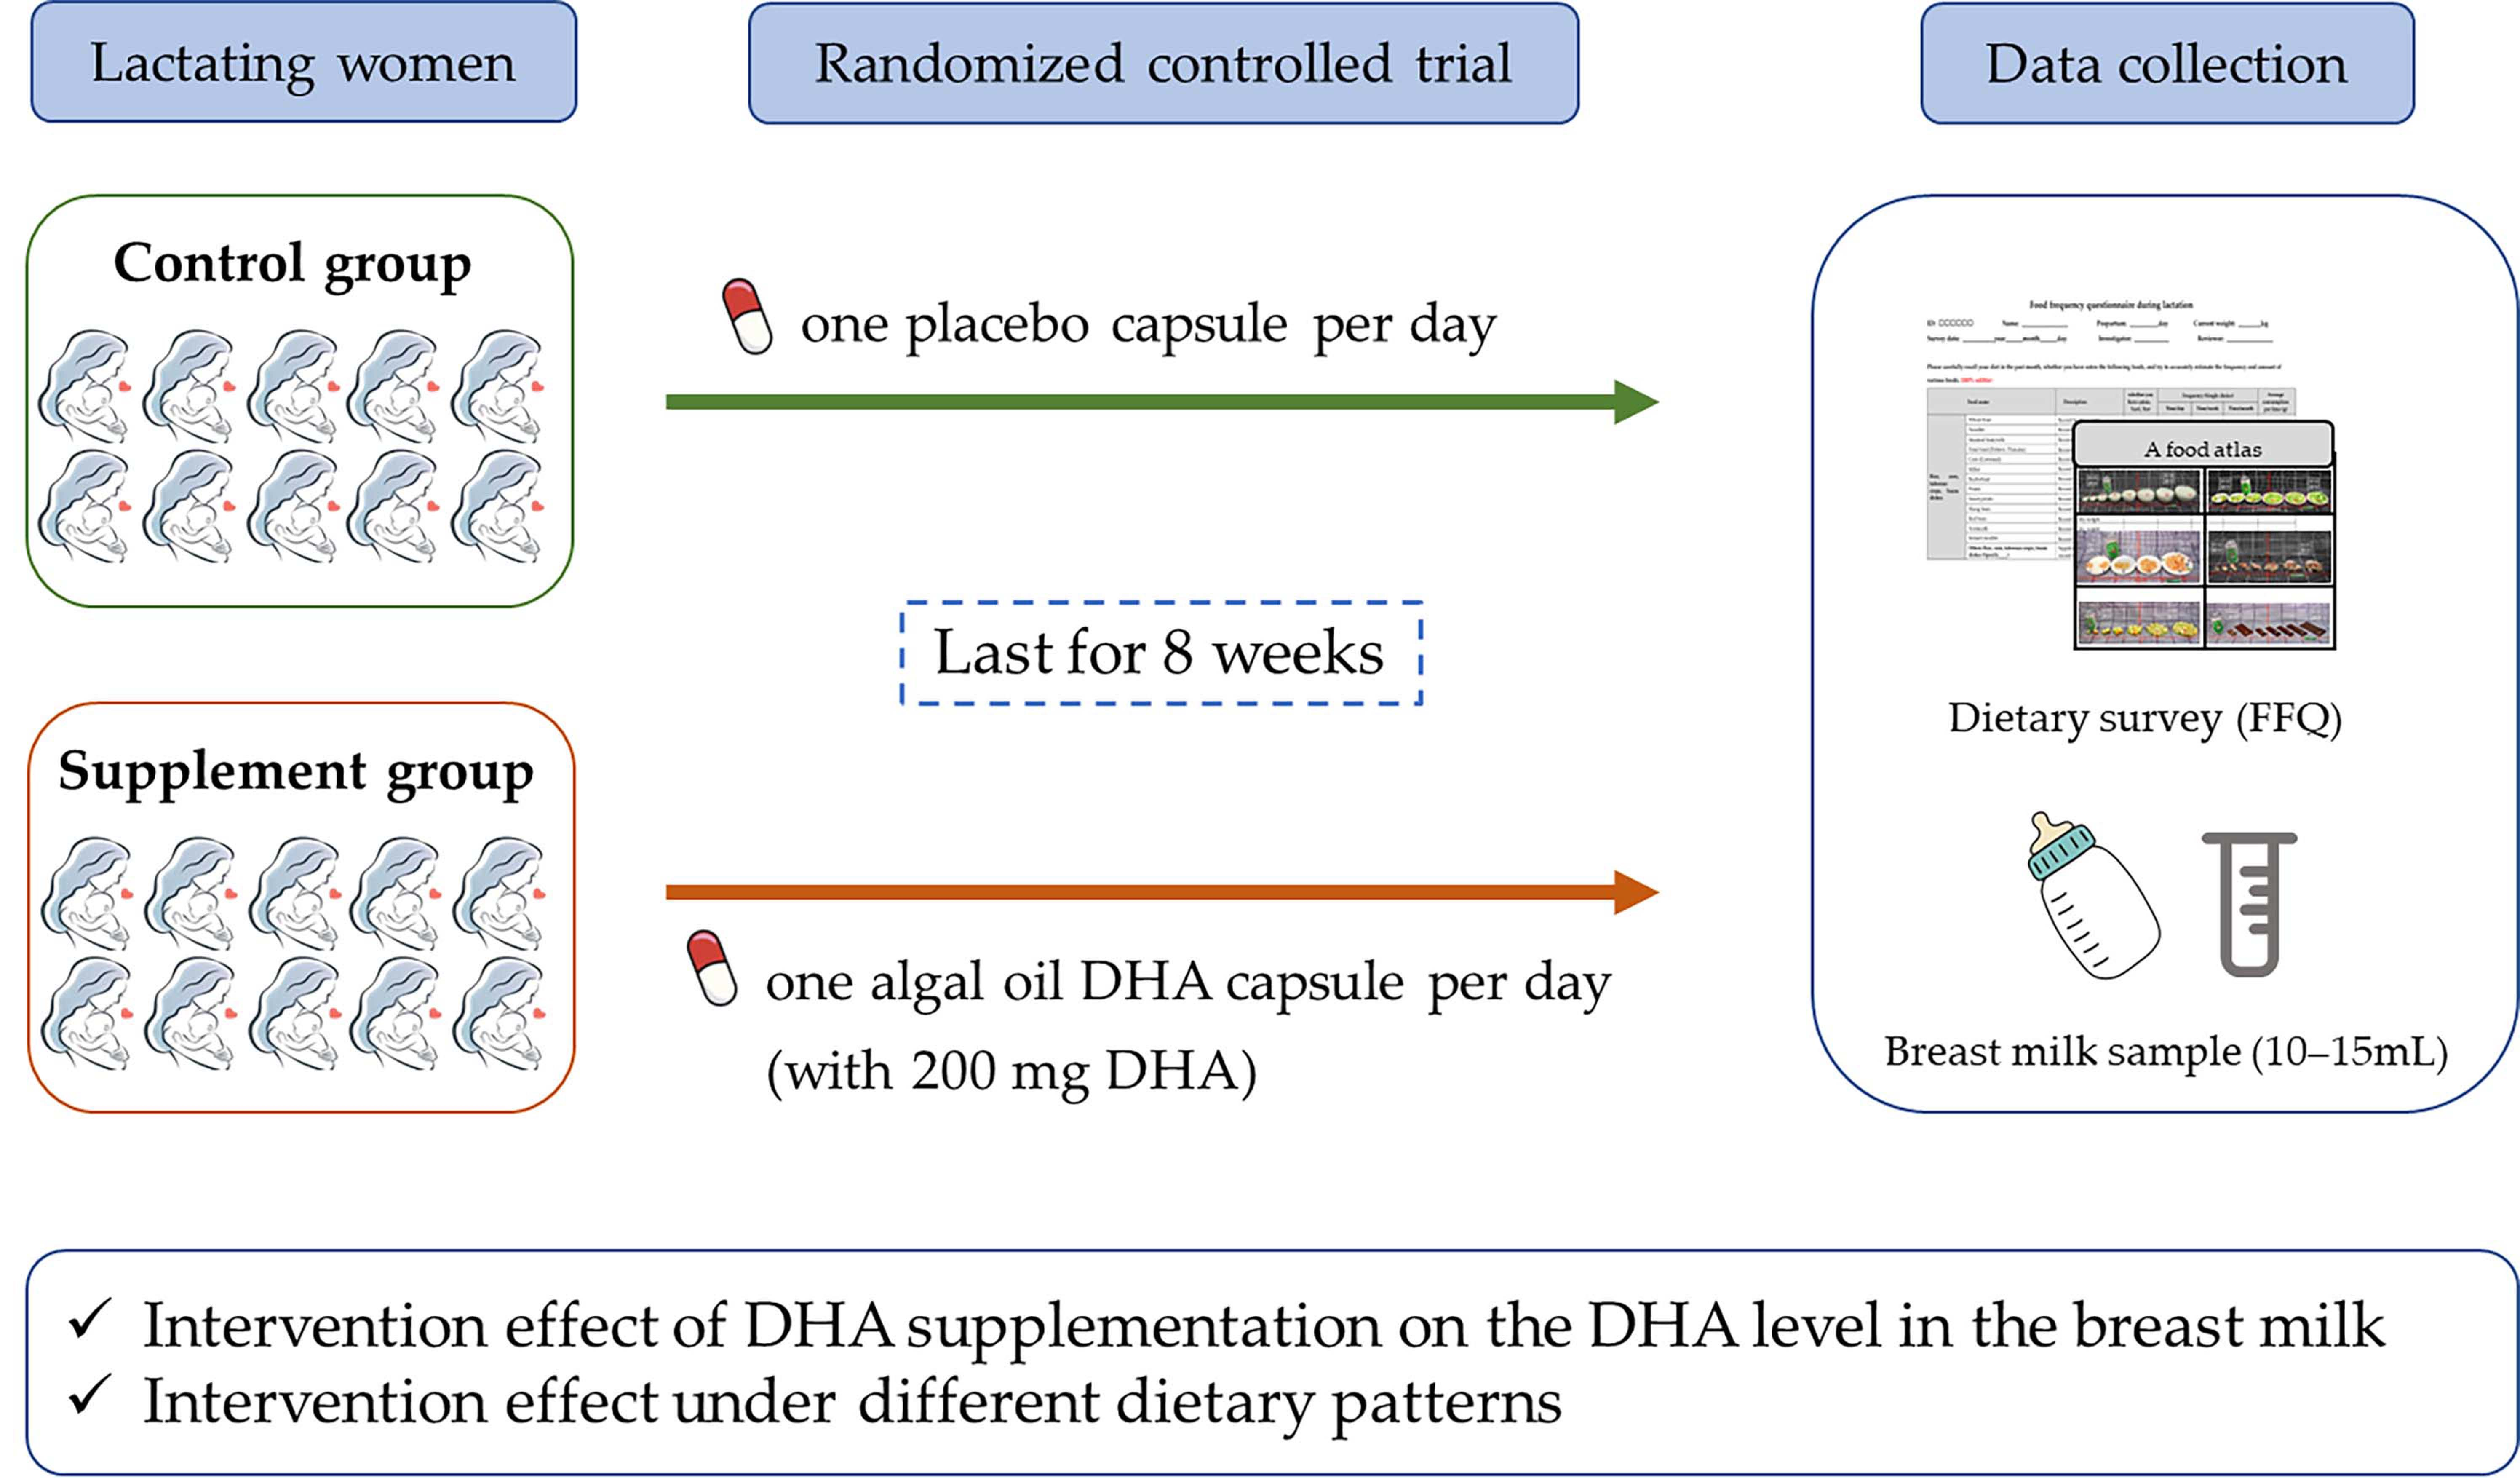
2.2. Study Design
2.2.1. Pattern and Content of the Intervention
2.2.2. Basic Information Collection
2.2.3. Collection and Assessment of Dietary Information
2.2.4. Breast Milk Collection and DHA Level Analysis
2.3. Statistical Analysis
2.3.1. Estimation of Sample Size
2.3.2. Development of Dietary Pattern
2.3.3. Data Analysis
3. Results
3.1. Baseline Information
3.2. Maternal Daily Dietary Energy and Nutrient Intakes between the Two Study Groups at Enrollment and the End of the Trial
3.3. Intervention Effect of DHA from Algal Oil on DHA Level in Breast Milk
3.4. Changes in DHA Levels of Breast Milk in the Supplement Group with Respect to Dietary Patterns
4. Discussion
Supplementary Materials
Author Contributions
Funding
Institutional Review Board Statement
Informed Consent Statement
Data Availability Statement
Acknowledgments
Conflicts of Interest
References
- Hookway, L.; Lewis, J.; Brown, A. The challenges of medically complex breastfed children and their families: A systematic review. Matern. Child Nutr. 2021, 17, e13182. [Google Scholar] [CrossRef] [PubMed]
- Yang, Y.; Ge, T. Encyclopedia of Nutrition Science, 2nd ed.; People’s Medical Publishing House Press: Beijing, China, 2019. [Google Scholar]
- Gould, J.F.; Roberts, R.M.; Makrides, M. The Influence of Omega-3 Long-Chain Polyunsaturated Fatty Acid, Docosahexaenoic Acid, on Child Behavioral Functioning: A Review of Randomized Controlled Trials of DHA Supplementation in Pregnancy, the Neonatal Period and Infancy. Nutrients 2021, 13, 415. [Google Scholar] [CrossRef] [PubMed]
- Bisgaard, H.; Stokholm, J.; Chawes, B.L.; Vissing, N.H.; Bjarnadottir, E.; Schoos, A.M.; Wolsk, H.M.; Pedersen, T.M.; Vinding, R.K.; Thorsteinsdottir, S.; et al. Fish Oil-Derived Fatty Acids in Pregnancy and Wheeze and Asthma in Offspring. N. Engl. J. Med. 2016, 375, 2530–2539. [Google Scholar] [CrossRef] [PubMed]
- Lauritzen, L.; Carlson, S.E. Maternal fatty acid status during pregnancy and lactation and relation to newborn and infant status. Matern. Child Nutr. 2011, 7 (Suppl. 2), 41–58. [Google Scholar] [CrossRef]
- Liu, M.J.; Li, H.T.; Yu, L.X.; Xu, G.S.; Ge, H.; Wang, L.L.; Zhang, Y.L.; Zhou, Y.B.; Li, Y.; Bai, M.X.; et al. A Correlation Study of DHA Dietary Intake and Plasma, Erythrocyte and Breast Milk DHA Concentrations in Lactating Women from Coastland, Lakeland, and Inland Areas of China. Nutrients 2016, 8, 312. [Google Scholar] [CrossRef] [PubMed]
- Sherry, C.L.; Oliver, J.S.; Marriage, B.J. Docosahexaenoic acid supplementation in lactating women increases breast milk and plasma docosahexaenoic acid concentrations and alters infant omega 6:3 fatty acid ratio. Prostaglandins Leukot. Essent. Fat. Acids 2015, 95, 63–69. [Google Scholar] [CrossRef] [PubMed]
- Schaefer, E.; Demmelmair, H.; Horak, J.; Holdt, L.; Grote, V.; Maar, K.; Neuhofer, C.; Teupser, D.; Thiel, N.; Goeckeler-Leopold, E.; et al. Multiple Micronutrients, Lutein, and Docosahexaenoic Acid Supplementation during Lactation: A Randomized Controlled Trial. Nutrients 2020, 12, 3849. [Google Scholar] [CrossRef]
- Li, P.; Shang, Y.; Liu, Y.; Chang, X.; Yao, H.; Liang, A.; Qi, K. Effect of docosahexenoic acid supplementation on infant’s growth and body mass index during maternal pregnancy. Zhonghua Liu Xing Bing Xue Za Zhi 2018, 39, 449–454. [Google Scholar] [CrossRef]
- Wu, Y.F.; Li, H.Q. Effect of docosahexenoic acid microalgae oil supplementation during pregnancy and lactation on levels of serum polyunsaturated fatty acid and tolerance to ovalbumin in suckling mice. Zhonghua Er Ke Za Zhi 2017, 55, 672–677. [Google Scholar] [CrossRef]
- Batis, C.; Sotres-Alvarez, D.; Gordon-Larsen, P.; Mendez, M.A.; Adair, L.; Popkin, B. Longitudinal analysis of dietary patterns in Chinese adults from 1991 to 2009. Br. J. Nutr. 2014, 111, 1441–1451. [Google Scholar] [CrossRef] [PubMed]
- Tucker, K.L. Dietary patterns, approaches, and multicultural perspective. Appl. Physiol. Nutr. Metab. 2010, 35, 211–218. [Google Scholar] [CrossRef] [PubMed]
- Abdollahi, S.; Soltani, S.; de Souza, R.J.; Forbes, S.C.; Toupchian, O.; Salehi-Abargouei, A. Associations between Maternal Dietary Patterns and Perinatal Outcomes: A Systematic Review and Meta-Analysis of Cohort Studies. Adv. Nutr. 2021, 12, 1332–1352. [Google Scholar] [CrossRef] [PubMed]
- Hwang, J.; Shin, D.; Kim, H.; Kwon, O. Association of maternal dietary patterns during pregnancy with small-for-gestational-age infants: Korean Mothers and Children’s Environmental Health (MOCEH) study. Am. J. Clin. Nutr. 2022, 115, 471–481. [Google Scholar] [CrossRef] [PubMed]
- Chen, C.; Lu, F.C.; Department of Disease Control Ministry of Health, P.R.C. The guidelines for prevention and control of overweight and obesity in Chinese adults. Biomed. Environ. Sci. 2004, 17, 1–36. [Google Scholar] [PubMed]
- Ding, Y.; Li, F.; Hu, P.; Ye, M.; Xu, F.; Jiang, W.; Yang, Y.; Fu, Y.; Zhu, Y.; Lu, X.; et al. Reproducibility and relative validity of a semi-quantitative food frequency questionnaire for the Chinese lactating mothers. Nutr. J. 2021, 20, 20. [Google Scholar] [CrossRef]
- Yang, Y. China Food Composition Tables, 6th ed.; Peking University Medical Press: Beijing, China, 2018. [Google Scholar]
- Ahuja, J.K.C.; Haytowitz, D.; Pehrsson, P.; Roseland, J.M.; Exler, J.; Khan, M.; Nickle, M.; Nguyen, Q.; Patterson, K.; Showell, B.; et al. USDA National Nutrient Database for Standard Reference, Release 26; USDA: Washington, DC, USA, 2013. [CrossRef]
- Jensen, R.G. The Lipids of Human Milk; CRC Press: Boca Raton, FL, USA, 1989. [Google Scholar]
- Ding, Y.; Yang, Y.; Xu, F.; Ye, M.; Hu, P.; Jiang, W.; Li, F.; Fu, Y.; Xie, Z.; Zhu, Y.; et al. Association between dietary fatty acid patterns based on principal component analysis and fatty acid compositions of serum and breast milk in lactating mothers in Nanjing, China. Food Funct. 2021, 12, 8704–8714. [Google Scholar] [CrossRef]
- Liu, G.; Ding, Z.; Li, X.; Chen, X.; Wu, Y.; Xie, L. Relationship between polyunsaturated fatty acid levels in maternal diets and human milk in the first month post-partum. J. Hum. Nutr. Diet 2016, 29, 405–410. [Google Scholar] [CrossRef]
- Chinese Nutrition Society. Chinese Dietary Reference Intakes; Science Press: Beijing, China, 2014. [Google Scholar]
- USDA. Nutrient Intakes from Food: Mean Amounts Consumed per Individual by Gender and Age; What We Eat in America; USDA: Washington, DC, USA, 2010.
- Sugano, M.; Hirahara, F. Polyunsaturated fatty acids in the food chain in Japan. Am. J. Clin. Nutr. 2000, 71, 189S–196S. [Google Scholar] [CrossRef]
- Wijendran, V.; Hayes, K.C. Dietary n-6 and n-3 fatty acid balance and cardiovascular health. Annu. Rev. Nutr. 2004, 24, 597–615. [Google Scholar] [CrossRef]
- Fang, H.; He, Y.; Yu, D. The status and changes of edible oil intake of Chinese Residents. Food Nutr. China 2017, 23, 56–58. [Google Scholar] [CrossRef]
- Juber, B.A.; Jackson, K.H.; Johnson, K.B.; Harris, W.S.; Baack, M.L. Breast milk DHA levels may increase after informing women: A community-based cohort study from South Dakota USA. Int. Breastfeed. J. 2016, 12, 7. [Google Scholar] [CrossRef]
- He, G.; Li, G.; Jiang, Y.; Hua, J.; Chu, X.; Xiong, L.; Gong, J.; Xiao, G.; Ye, X. Macronutrient content and fatty acid composition and their positional distribution in human breast milk from Zhejiang Province, China in different lactation periods. Food Sci. Nutr. 2021, 9, 6746–6761. [Google Scholar] [CrossRef] [PubMed]
- Wu, K.; Zhu, J.; Zhou, L.; Shen, L.; Mao, Y.; Zhao, Y.; Gao, R.; Lou, Z.; Cai, M.; Wang, B. Lactational changes of fatty acids and fat-soluble antioxidants in human milk from healthy Chinese mothers. Br. J. Nutr. 2020, 123, 841–848. [Google Scholar] [CrossRef] [PubMed]
- Forsyth, S.; Gautier, S.; Salem, N., Jr. Dietary Intakes of Arachidonic Acid and Docosahexaenoic Acid in Early Life—With a Special Focus on Complementary Feeding in Developing Countries. Ann. Nutr. Metab. 2017, 70, 217–227. [Google Scholar] [CrossRef] [PubMed]
- Forsyth, S.; Gautier, S.; Salem, N., Jr. Estimated Dietary Intakes of Arachidonic Acid and Docosahexaenoic Acid in Infants and Young Children Living in Developing Countries. Ann. Nutr. Metab. 2016, 69, 64–74. [Google Scholar] [CrossRef]
- Brenna, J.T.; Salem, N., Jr.; Sinclair, A.J.; Cunnane, S.C.; International Society for the Study of Fatty Acids and Lipids. α-Linolenic acid supplementation and conversion to n-3 long-chain polyunsaturated fatty acids in humans. Prostaglandins Leukot. Essent. Fatty Acids 2009, 80, 85–91. [Google Scholar] [CrossRef]
- Li, K.; Brennan, L.; McNulty, B.A.; Bloomfield, J.F.; Duff, D.J.; Devlin, N.F.; Gibney, M.J.; Flynn, A.; Walton, J.; Nugent, A.P. Plasma fatty acid patterns reflect dietary habits and metabolic health: A cross-sectional study. Mol. Nutr. Food Res. 2016, 60, 2043–2052. [Google Scholar] [CrossRef]
- Demmelmair, H.; Koletzko, B. Lipids in human milk. Best Pract. Res. Clin. Endocrinol. Metab. 2018, 32, 57–68. [Google Scholar] [CrossRef]
- Horner, D.; Hjelmso, M.H.; Thorsen, J.; Rasmussen, M.; Eliasen, A.; Vinding, R.K.; Schoos, A.M.; Brustad, N.; Sunde, R.B.; Bonnelykke, K.; et al. Supplementation with fish oil in pregnancy reduces gastroenteritis in early childhood. J. Infect. Dis. 2021, jiab607, Online ahead of print. [Google Scholar] [CrossRef]


| Characteristics | Control Group | Supplement Group | t/χ² | p Value |
|---|---|---|---|---|
| Age, year (mean ± SD) | 29.8 ± 3.2 | 29.7 ± 4.0 | 0.193 | 0.847 |
| Education, n (%) | 1.333 | 0.721 | ||
| High school education or lower | 10 (16.7) | 11 (14.3) | ||
| Vocational–technical school education | 12 (20.0) | 18 (23.4) | ||
| University education or higher | 38 (63.3) | 48 (62.3) | ||
| Gestational age, week | 39.0 ± 1.0 | 39.0 ± 1.4 | −0.053 | 0.958 |
| Parity, n (%) | 0.136 | 0.712 | ||
| 1 | 40 (66.7) | 49 (63.6) | ||
| ≥2 | 20 (33.3) | 28 (36.4) | ||
| Height, cm | 160.5 ± 7.0 | 162.0 ± 5.0 | −0.864 | 0.388 |
| Pre-pregnancy weight, kg | 54.0 ± 9.8 | 55.0 ± 8.0 | −1.273 | 0.203 |
| Weight at delivery, kg | 69.5 ± 12.0 | 70.0 ± 9.0 | −1.390 | 0.164 |
| Pre-pregnancy BMI, kg/m2 | 21.1 ± 2.5 | 21.3 ± 3.8 | −0.822 | 0.411 |
| Pre-pregnancy BMI category a, n (%) | 1.605 | 0.658 | ||
| Underweight | 6 (10.0) | 10 (13.0) | ||
| Normal weight | 46 (76.7) | 54 (70.1) | ||
| Overweight | 7 (11.7) | 9 (11.7) | ||
| Obesity | 1 (1.7) | 4 (5.2) | ||
| Weight gain during pregnancy, kg | 15.0 ± 5.4 | 15.0 ± 5.5 | −0.687 | 0.492 |
| Weight at enrollment, kg | 60.0 ± 10.0 | 61.0 ± 8.75 | −1.521 | 0.128 |
| BMI at enrollment, kg/m2 | 23.3 ± 2.4 | 23.8 ± 2.8 | −1.15 | 0.252 |
| BMI category at enrollment | 1.899 | 0.387 | ||
| Underweight | 0 | 0 | ||
| Normal weight | 36 (60.0) | 43 (55.8) | ||
| Overweight | 23 (38.3) | 29 (37.7) | ||
| Obesity | 1 (1.7) | 5 (6.5) |
| Intakes | At Enrollment | At the End of the Trial | ||||
|---|---|---|---|---|---|---|
| Control Group | Supplement Group | p Value | Control Group | Supplement Group | p Value | |
| Energy, kcal/d | 2335.41 ± 715.35 | 2294.49 ± 583.43 | 0.374 Δ | 2160.21 ± 824.95 | 2155.68 ± 579.99 | 0.484 Δ |
| Protein, g/d | 101.99 ± 35.56 | 96.18 ± 44.33 | 0.338 | 86.15 ± 41.01 | 87.48 ± 33.79 | 0.890 |
| Protein, %E | 17.23 ± 4.38 | 17.42 ± 4.84 | 0.632 Δ | 15.87 ± 3.53 | 16.71 ± 3.93 | 0.397 Δ |
| Fat, g/d | 89.11 ± 28.41 | 85.86 ± 26.69 | 0.314 | 78.66 ± 34.78 | 78.42 ± 21.77 | 0.549 |
| Fat, %E | 33.53 ± 8.86 | 33.75 ± 7.98 | 0.603 | 33.11 ± 10.08 | 33.09 ± 7.53 | 0.535 |
| Carbohydrates, g/d | 290.37 ± 110.80 | 282.82 ± 108.31 | 0.799 Δ | 273.86 ± 121.95 | 267.50 ± 112.06 | 0.652 |
| Carbohydrates, %E | 48.89 ± 11.50 | 49.52 ± 10.71 | 0.478 Δ | 50.90 ± 10.86 | 51.40 ± 9.88 | 0.709 Δ |
| Total fatty acids, g/d | 78.86 ± 19.96 | 74.49 ± 20.77 | 0.270 | 67.74 ± 30.97 | 68.71 ± 22.14 | 0.758 |
| SFA, g/d | 20.73 ± 7.07 | 20.76 ± 8.74 | 0.528 Δ | 17.25 ± 9.93 | 17.75 ± 8.74 | 0.972 |
| SFA, %E | 8.06 ± 3.08 | 8.03 ± 2.69 | 0.986 | 7.71 ± 3.00 | 7.83 ± 2.87 | 0.853 Δ |
| MUFA, g/d | 33.84 ± 12.19 | 32.39 ± 11.25 | 0.304 | 30.45 ± 14.37 | 30.62 ± 9.81 | 0.330 Δ |
| PUFA, g/d | 23.26 ± 6.95 | 22.02 ± 7.12 | 0.223 | 20.77 ± 7.95 | 20.87 ± 9.80 | 0.591 |
| PA, g/d | 11.59 ± 7.42 | 10.42 ± 7.22 | 0.265 | 9.43 ± 9.16 | 8.43 ± 7.54 | 0.549 |
| SA, g/d | 4.89 ± 3.14 | 4.37 ± 3.32 | 0.524 | 3.57 ± 3.62 | 3.70 ± 2.95 | 0.938 |
| POA, g/d | 1.25 ± 1.03 | 1.15 ± 1.08 | 0.410 | 0.91 ± 0.92 | 0.88 ± 0.86 | 0.818 |
| OA, g/d | 22.47 ± 14.01 | 18.64 ± 12.96 | 0.187 | 17.04 ± 19.48 | 15.76 ± 14.10 | 0.541 |
| LA, g/d | 17.61 ± 10.81 | 14.98 ± 9.60 | 0.072 | 13.24 ± 9.65 | 13.44 ± 9.83 | 0.448 |
| ALA, g/d | 2.43 ± 3.66 | 2.13 ± 1.37 | 0.087 | 2.05 ± 2.25 | 1.84 ± 1.48 | 0.371 |
| ARA, g/d | 0.23 ± 0.36 | 0.22 ± 0.26 | 0.410 | 0.17 ± 0.21 | 0.17 ± 0.23 | 0.835 |
| EPA, g/d | 36.19 ± 59.28 | 32.04 ± 72.04 | 0.371 | 17.93 ± 46.02 | 18.92 ± 59.34 | 0.619 |
| DHA, g/d | 48.92 ± 51.73 | 40.5 ± 50.69 | 0.211 | 31.95 ± 30.65 | 33.85 ± 43.37 | 0.607 |
| n-3 PUFA, g/d | 2.57 ± 3.78 | 2.20 ± 1.37 | 0.077 | 2.14 ± 2.30 | 1.88 ± 1.59 | 0.367 |
| n-3 PUFA, %E | 0.94 ± 1.07 | 0.85 ± 0.52 | 0.077 | 0.96 ± 0.87 | 0.88 ± 0.52 | 0.333 |
| n-6 PUFA, g/d | 17.74 ± 10.87 | 15.18 ± 9.83 | 0.072 | 13.56 ± 9.93 | 13.51 ± 10.00 | 0.415 |
| n-6 PUFA, %E | 6.75 ± 3.46 | 6.26 ± 3.37 | 0.066 | 5.64 ± 4.83 | 5.68 ± 3.58 | 0.344 |
| n-6/n-3 PUFA | 6.66 ± 5.67 | 6.88 ± 5.00 | 0.349 | 6.45 ± 4.81 | 6.80 ± 5.19 | 0.872 |
| Fatty Acid, mg/100 mL | Control Group | Supplement Group | p Value a | p Value b | p Value c | p Value d | ||
|---|---|---|---|---|---|---|---|---|
| At Enrollment | At the End of the Trial | At Enrollment | At the End of the Trial | |||||
| Milk fat, g/100 mL | 3.86 ± 1.61 | 3.14 ± 2.03 | 3.70 ± 2.15 | 3.47 ± 2.30 | 0.483 | 0.716 | 0.128 | 0.688 |
| Total fatty acids | 3350.65 ± 1368.64 | 2766.48 ± 1581.62 | 3139.61 ± 1813.13 | 3018.65 ± 2039.50 | 0.306 | 0.712 | 0.122 | 0.895 |
| SFA | 1118.94 ± 396.45 | 962.79 ± 606.38 | 1039.70 ± 631.60 | 980.27 ± 617.43 | 0.140 | 0.661 | 0.116 | 0.810 |
| MUFA | 1212.41 ± 599.12 | 1100.84 ± 741.44 | 1243.36 ± 755.57 | 1134.22 ± 819.33 | 0.828 | 0.535 | 0.080 | 0.626 |
| PUFA | 884.47 ± 343.77 | 746.51 ± 503.29 | 813.39 ± 373.08 | 786.61 ± 520.33 | 0.288 | 0.938 | 0.327 | 0.920 |
| n-6 PUFA | 807.80 ± 319.15 | 705.87 ± 463.12 | 733.88 ± 321.12 | 678.83 ± 474.72 | 0.241 | 0.805 | 0.430 | 0.895 |
| n-3 PUFA | 64.22 ± 44.33 | 60.48 ± 41.55 | 69.08 ± 48.19 | 69.73 ± 53.42 | 0.398 | 0.146 | 0.430 | 0.806 |
| n-6/n-3 | 11.92 ± 6.67 | 11.79 ± 8.04 | 10.72 ± 5.40 | 9.92 ± 6.01 | 0.136 | 0.005 | 0.534 | 0.059 |
| LA | 731.60 ± 290.04 | 657.96 ± 400.72 | 664.96 ± 278.77 | 634.92 ± 445.66 | 0.247 | 0.768 | 0.467 | 0.937 |
| GLA | 6.16 ± 3.81 | 3.87 ± 2.91 | 5.10 ± 4.24 | 3.92 ± 2.80 | 0.243 | 0.811 | <0.001 | 0.093 |
| ALA | 46.71 ± 37.85 | 46.81 ± 42.16 | 50.32 ± 39.27 | 51.31 ± 47.02 | 0.443 | 0.233 | 0.697 | 0.788 |
| ARA | 21.68 ± 9.59 | 15.54 ± 9.97 | 21.54 ± 15.15 | 16.61 ± 12.74 | 0.771 | 0.671 | 0.001 | 0.031 |
| EPA | 1.33 ± 1.30 | 1.26 ± 1.30 | 1.46 ± 1.87 | 1.53 ± 2.05 | 0.828 | 0.335 | 0.928 | 0.244 |
| DHA | 10.55 ± 5.84 | 7.57 ± 6.30 | 11.88 ± 9.59 | 10.07 ± 13.16 | 0.531 | 0.012 | 0.037 | 0.873 |
| ARA/DHA | 2.01 ± 0.85 | 2.06 ± 1.30 | 2.00 ± 0.90 | 1.47 ± 1.06 | 0.742 | <0.001 | 0.328 | 0.003 |
| Fatty Acid, % | Control Group | Supplement Group | p Value a | p Value b | p Value c | p Value d | ||
|---|---|---|---|---|---|---|---|---|
| At Enrollment | At the End of the Trial | At Enrollment | At the End of the Trial | |||||
| SFA | 34.99 ± 5.62 | 34.88 ± 4.52 | 33.85 ± 4.45 | 34.76 ± 5.56 | 0.063 Δ | 0.910 | 0.647 | 0.013 |
| MUFA | 38.25 ± 5.40 | 37.79 ± 6.77 | 39.58 ± 5.00 | 38.43 ± 5.15 | 0.072 Δ | 0.328 Δ | 0.630 | 0.062 |
| PUFA | 26.44 ± 6.82 | 26.84 ± 5.06 | 26.72 ± 5.37 | 25.74 ± 5.84 | 0.973 Δ | 0.124 Δ | 0.442 | 0.290 |
| n-6 PUFA | 24.49 ± 6.36 | 24.67 ± 5.25 | 24.47 ± 5.22 | 23.08 ± 5.07 | 0.976 | 0.044 Δ | 0.558 | 0.142 |
| n-3 PUFA | 1.87 ± 0.93 | 2.12 ± 1.23 | 2.15 ± 0.98 | 2.41 ± 1.13 | 0.062 | 0.036 | 0.285 | 0.152 |
| LA | 22.41 ± 6.00 | 23.30 ± 5.42 | 22.10 ± 4.84 | 21.16 ± 5.13 | 0.879 | 0.043 Δ | 0.285 | 0.476 |
| GLA | 0.18 ± 0.11 | 0.14 ± 0.08 | 0.16 ± 0.08 | 0.13 ± 0.07 | 0.286 Δ | 0.499 | <0.001 | <0.001 |
| ALA | 1.5 ± 0.78 | 1.63 ± 1.05 | 1.64 ± 0.75 | 1.83 ± 1.18 | 0.151 | 0.101 | 0.166 | 0.144 |
| ARA | 0.65 ± 0.23 | 0.56 ± 0.17 | 0.70 ± 0.23 | 0.59 ± 0.20 | 0.119 Δ | 0.642 | <0.001 | <0.001 |
| EPA | 0.04 ± 0.03 | 0.05 ± 0.04 | 0.04 ± 0.03 | 0.06 ± 0.04 | 0.706 | 0.422 | 0.316 | 0.284 |
| DHA | 0.32 ± 0.18 | 0.28 ± 0.15 | 0.34 ± 0.23 | 0.40 ± 0.29 | 0.248 | 0.001 | 0.277 | 0.858 |
| DHA | Pattern 1 (n = 21) | Pattern 2 (n = 16) | Pattern 3 (n = 23) | Pattern 4 (n = 17) | p Value |
|---|---|---|---|---|---|
| Absolute concentration, mg/100 mL | −0.23 ± 8.22 | 1.52 ± 12.25 | −5.61 ± 10.91 | 2.29 ± 11.46 | 0.013 |
| Relative concentration, % | 0.05 ± 0.20 | 0 ± 0.39 | −0.08 ± 0.24 | 0.07 ± 0.20 | 0.267 Δ |
Publisher’s Note: MDPI stays neutral with regard to jurisdictional claims in published maps and institutional affiliations. |
© 2022 by the authors. Licensee MDPI, Basel, Switzerland. This article is an open access article distributed under the terms and conditions of the Creative Commons Attribution (CC BY) license (https://creativecommons.org/licenses/by/4.0/).
Share and Cite
Yang, Y.; Li, G.; Li, F.; Xu, F.; Hu, P.; Xie, Z.; Lu, X.; Ding, Y.; Wang, Z. Impact of DHA from Algal Oil on the Breast Milk DHA Levels of Lactating Women: A Randomized Controlled Trial in China. Nutrients 2022, 14, 3410. https://doi.org/10.3390/nu14163410
Yang Y, Li G, Li F, Xu F, Hu P, Xie Z, Lu X, Ding Y, Wang Z. Impact of DHA from Algal Oil on the Breast Milk DHA Levels of Lactating Women: A Randomized Controlled Trial in China. Nutrients. 2022; 14(16):3410. https://doi.org/10.3390/nu14163410
Chicago/Turabian StyleYang, Yue, Genyuan Li, Fang Li, Fangping Xu, Ping Hu, Zhencheng Xie, Xiaolong Lu, Ye Ding, and Zhixu Wang. 2022. "Impact of DHA from Algal Oil on the Breast Milk DHA Levels of Lactating Women: A Randomized Controlled Trial in China" Nutrients 14, no. 16: 3410. https://doi.org/10.3390/nu14163410