

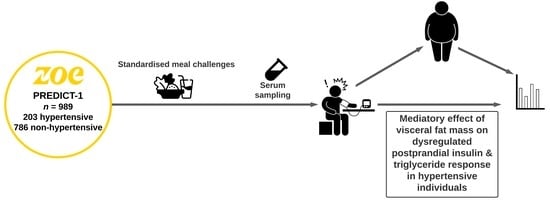
Postprandial Responses to a Standardised Meal in Hypertension: The Mediatory Role of Visceral Fat Mass
 , ,
, ,
Abstract
:
1. Introduction
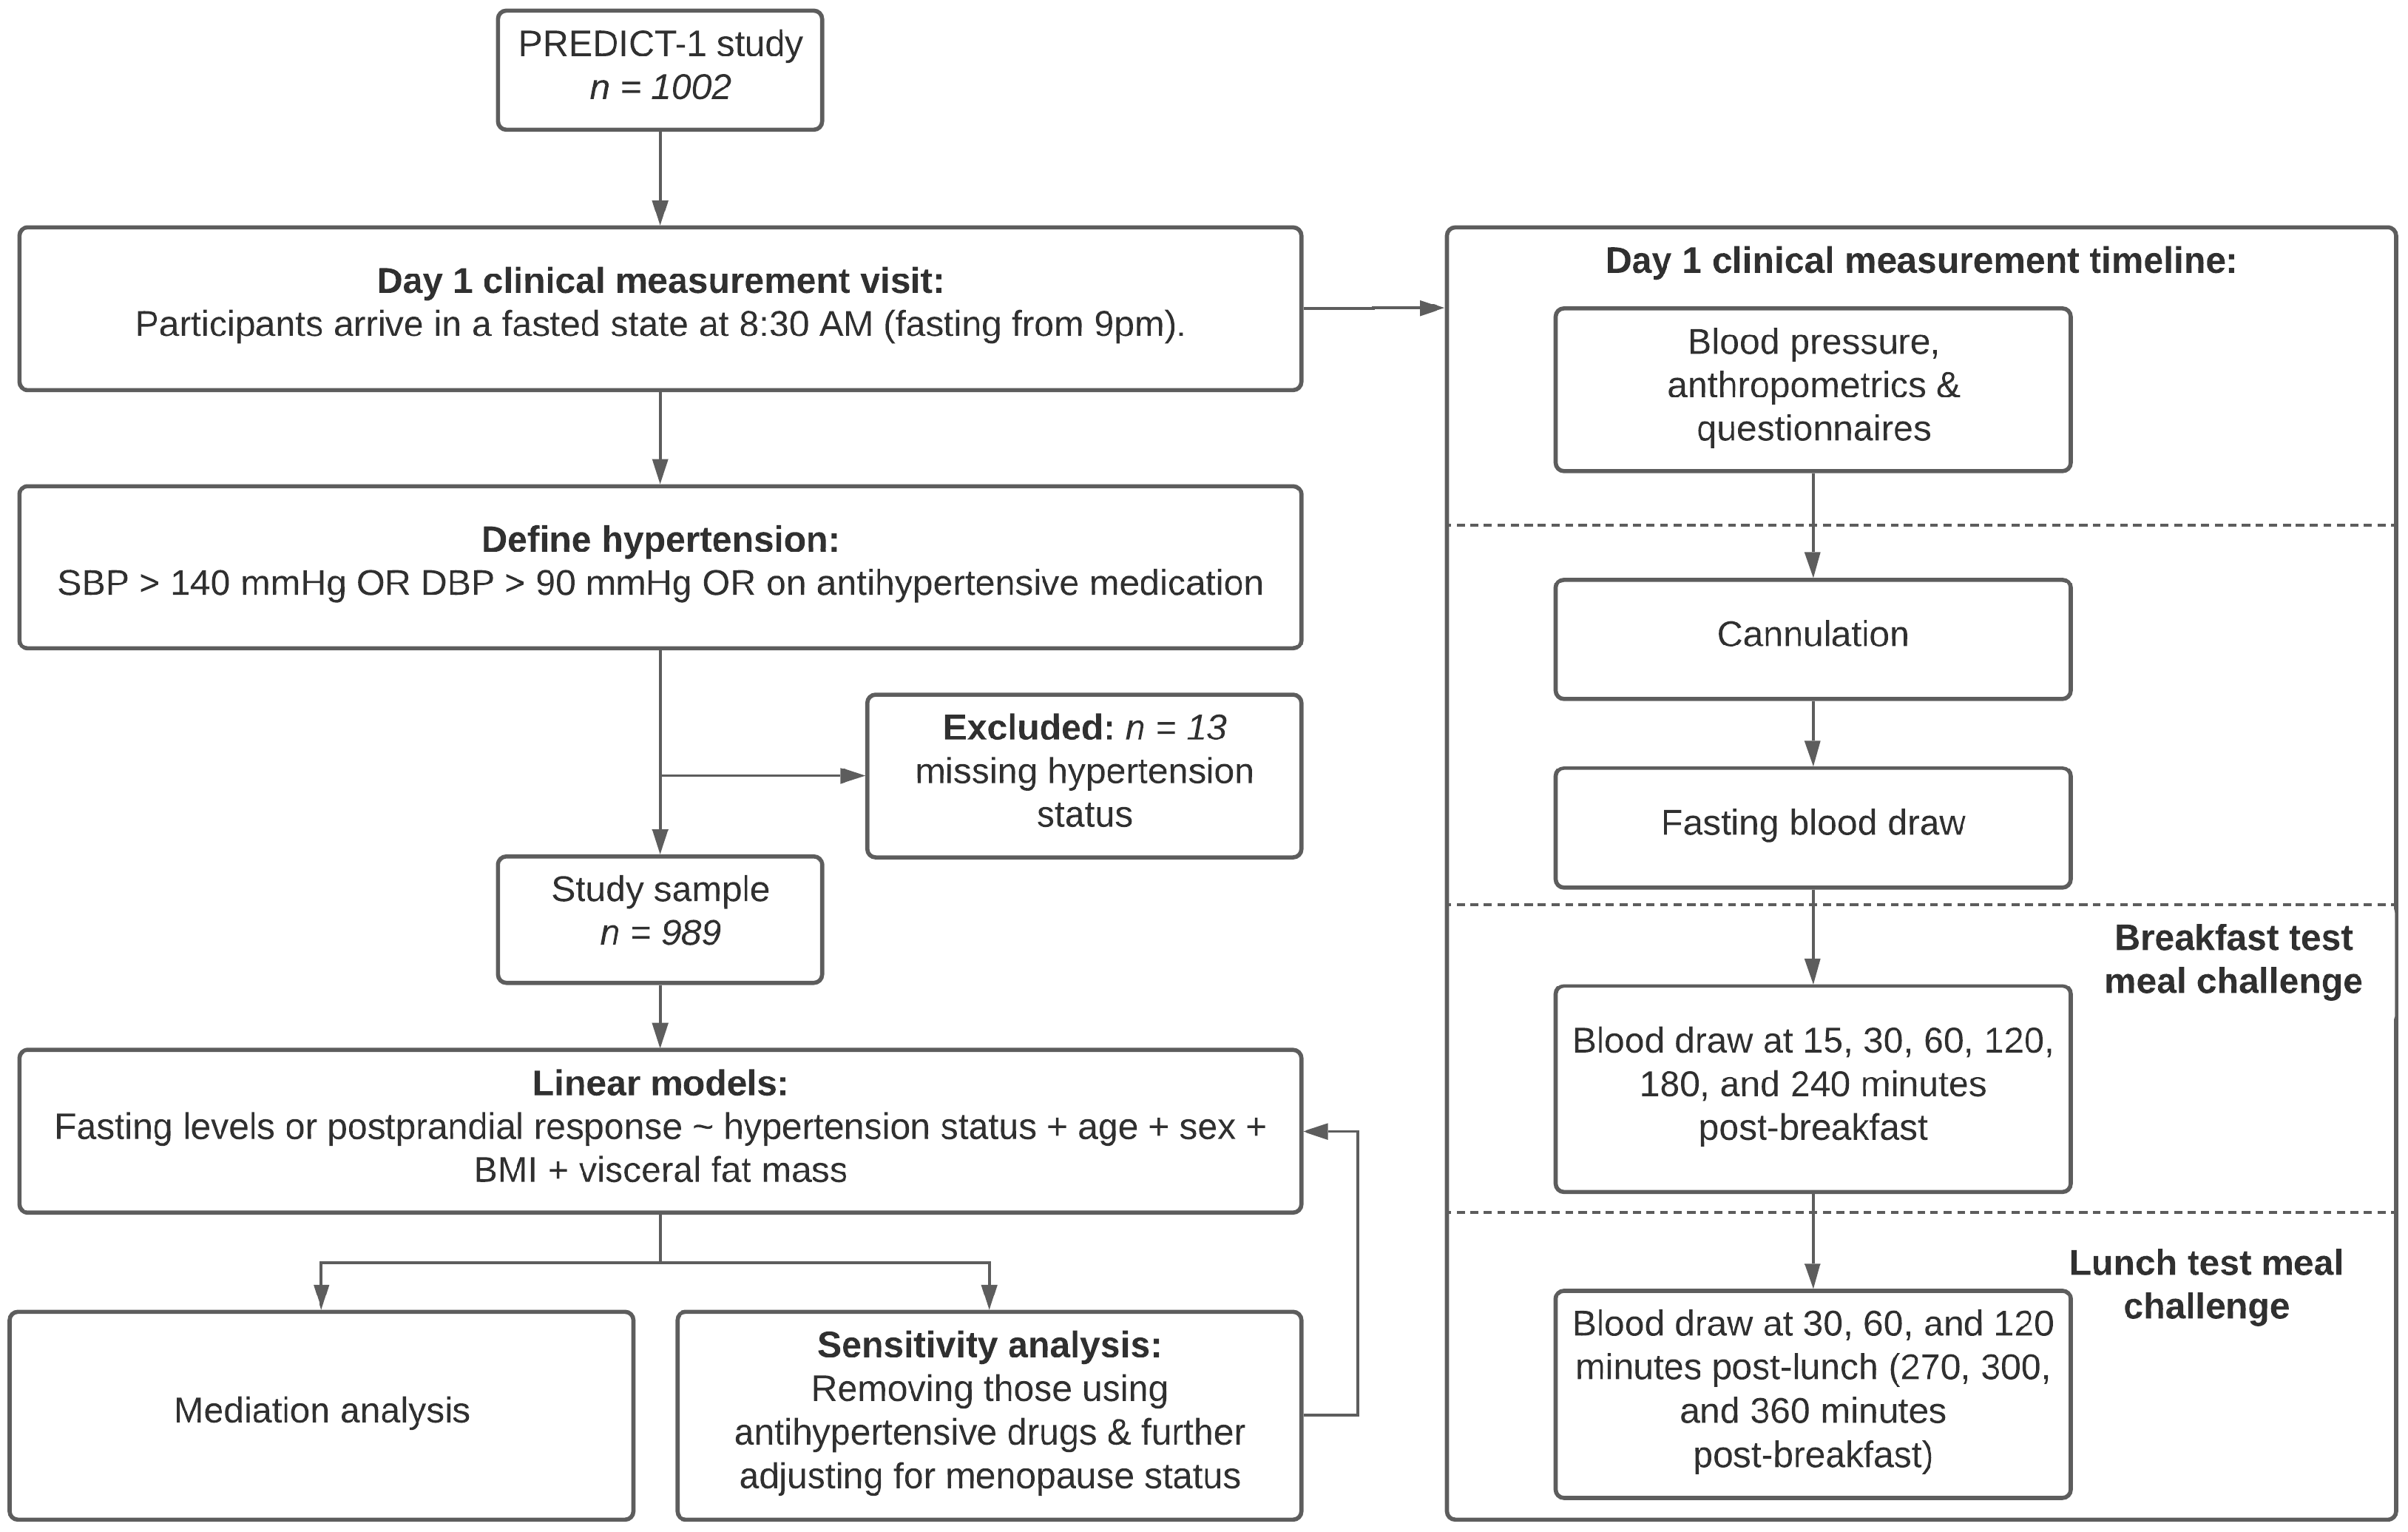
2. Materials and Methods
2.1. Blood Pressure
2.2. Adiposity
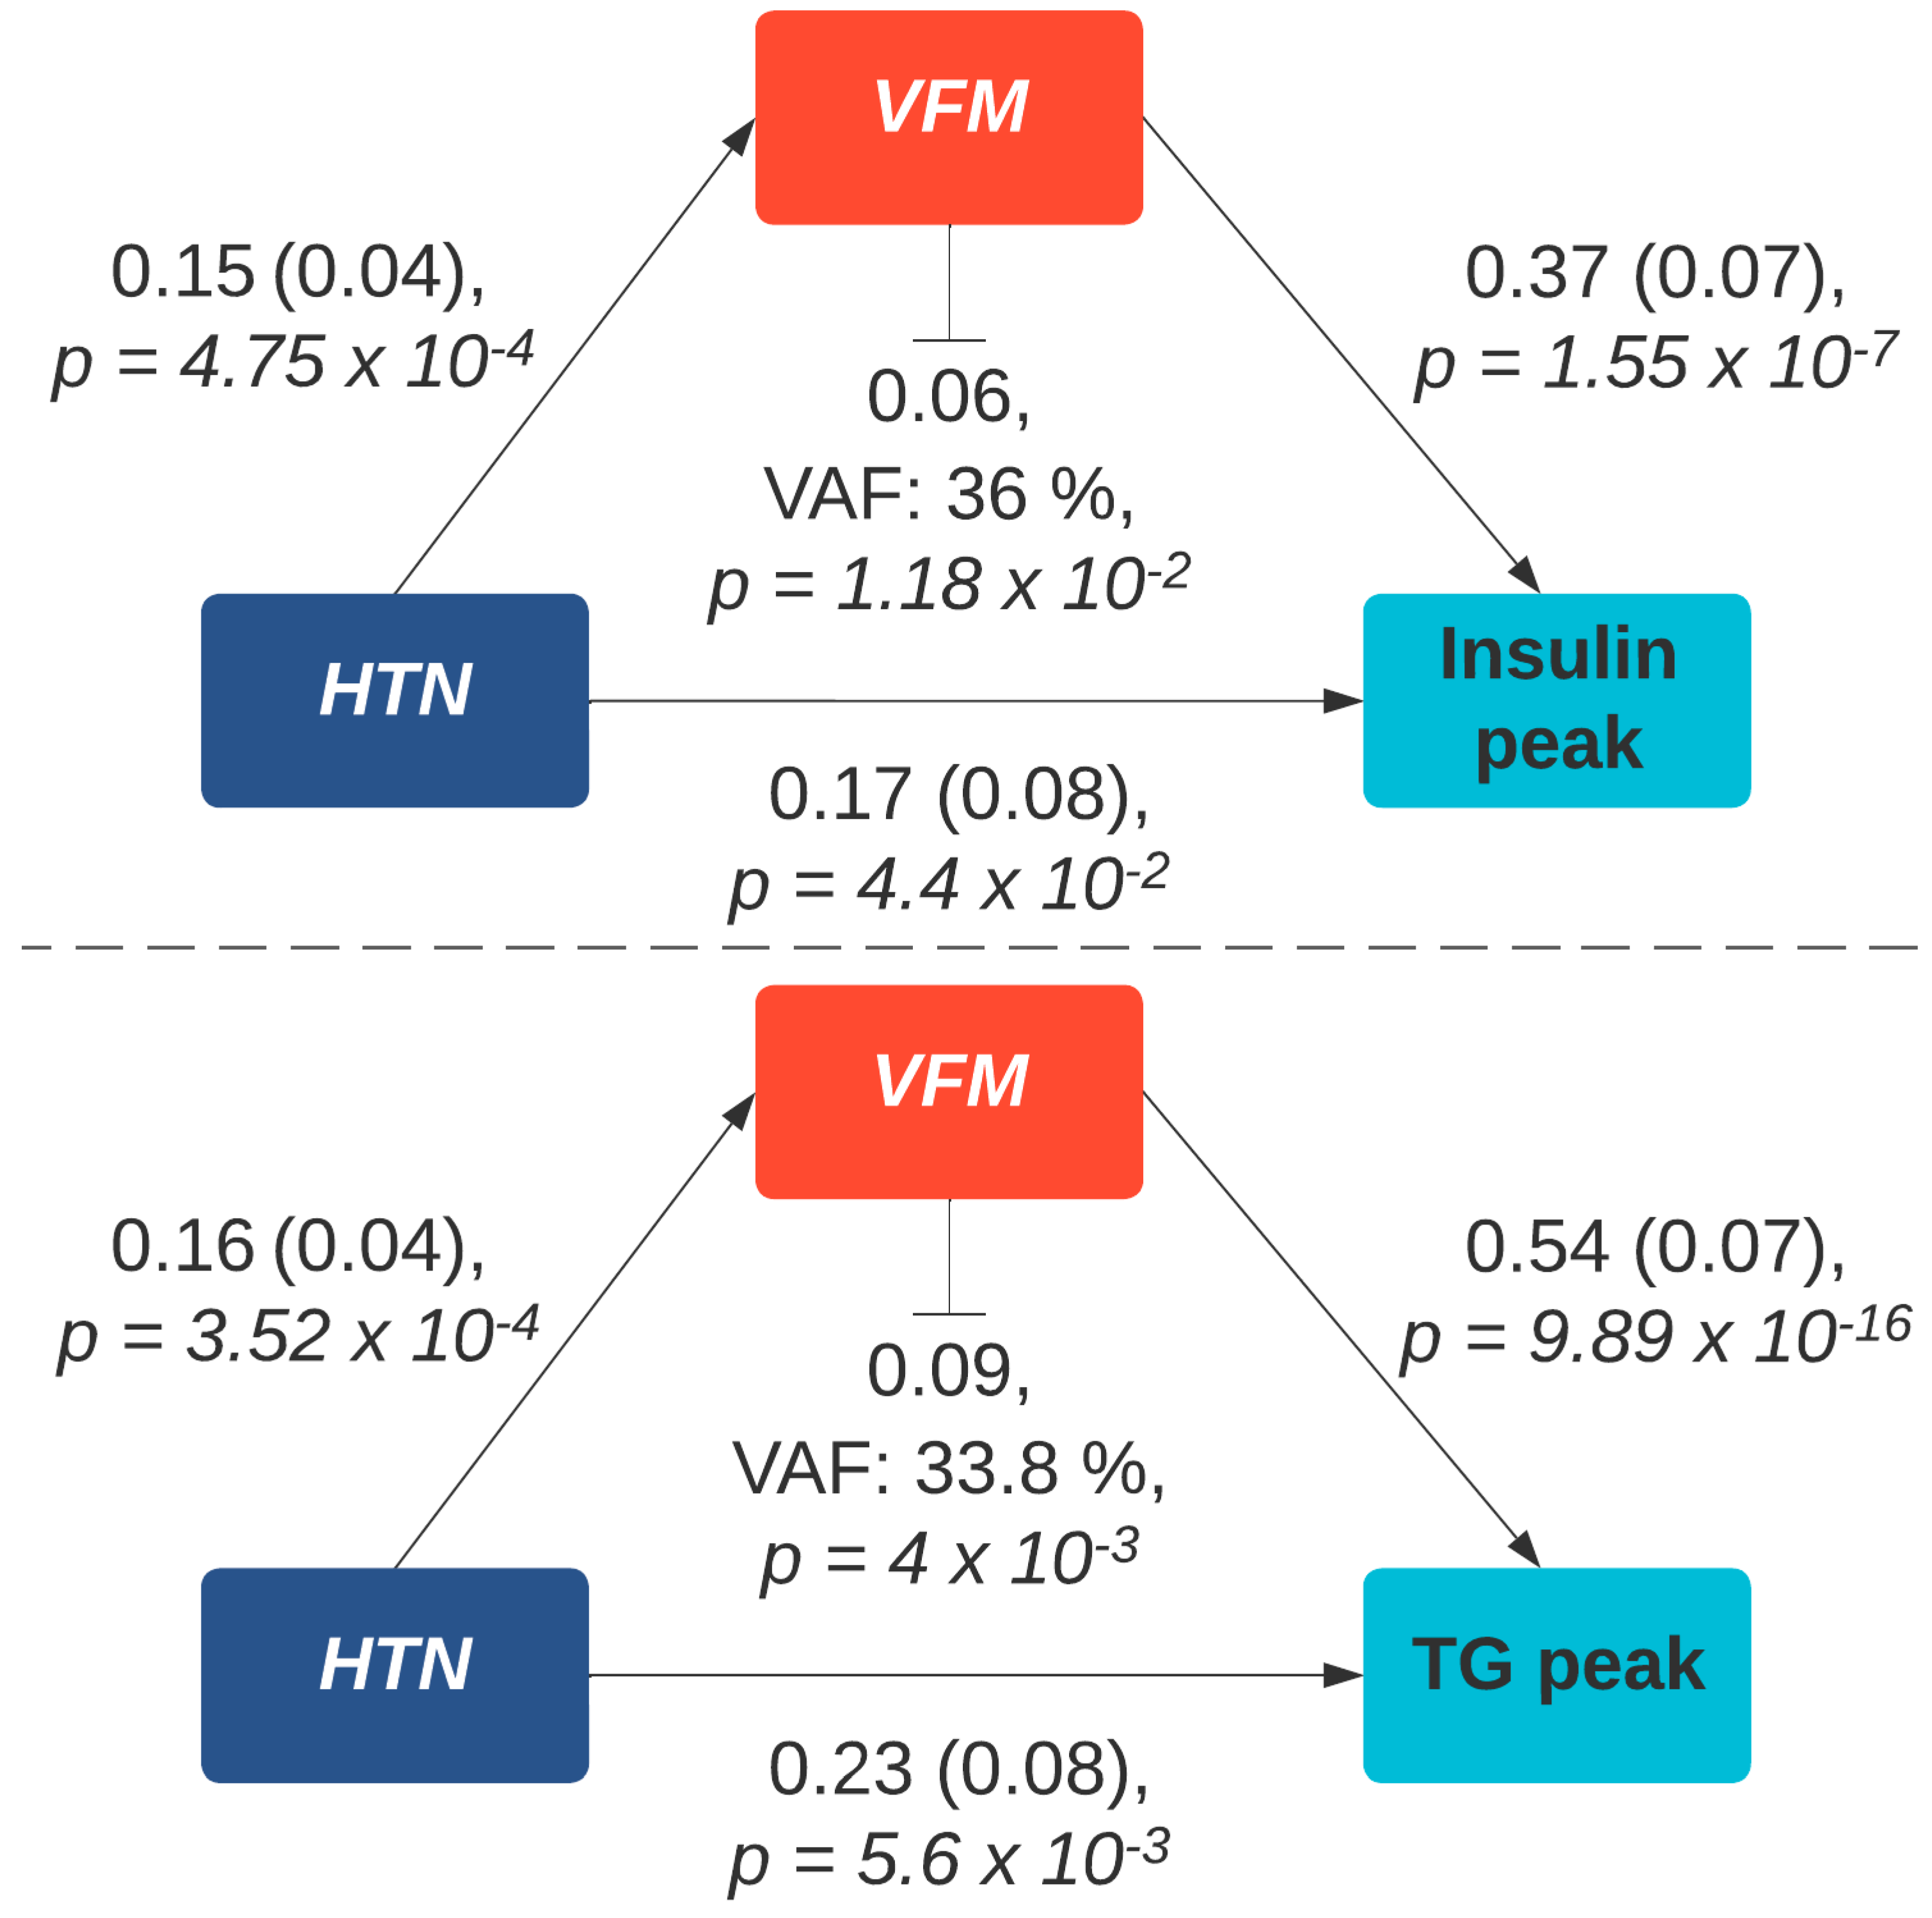
2.3. Statistical Analysis
3. Results
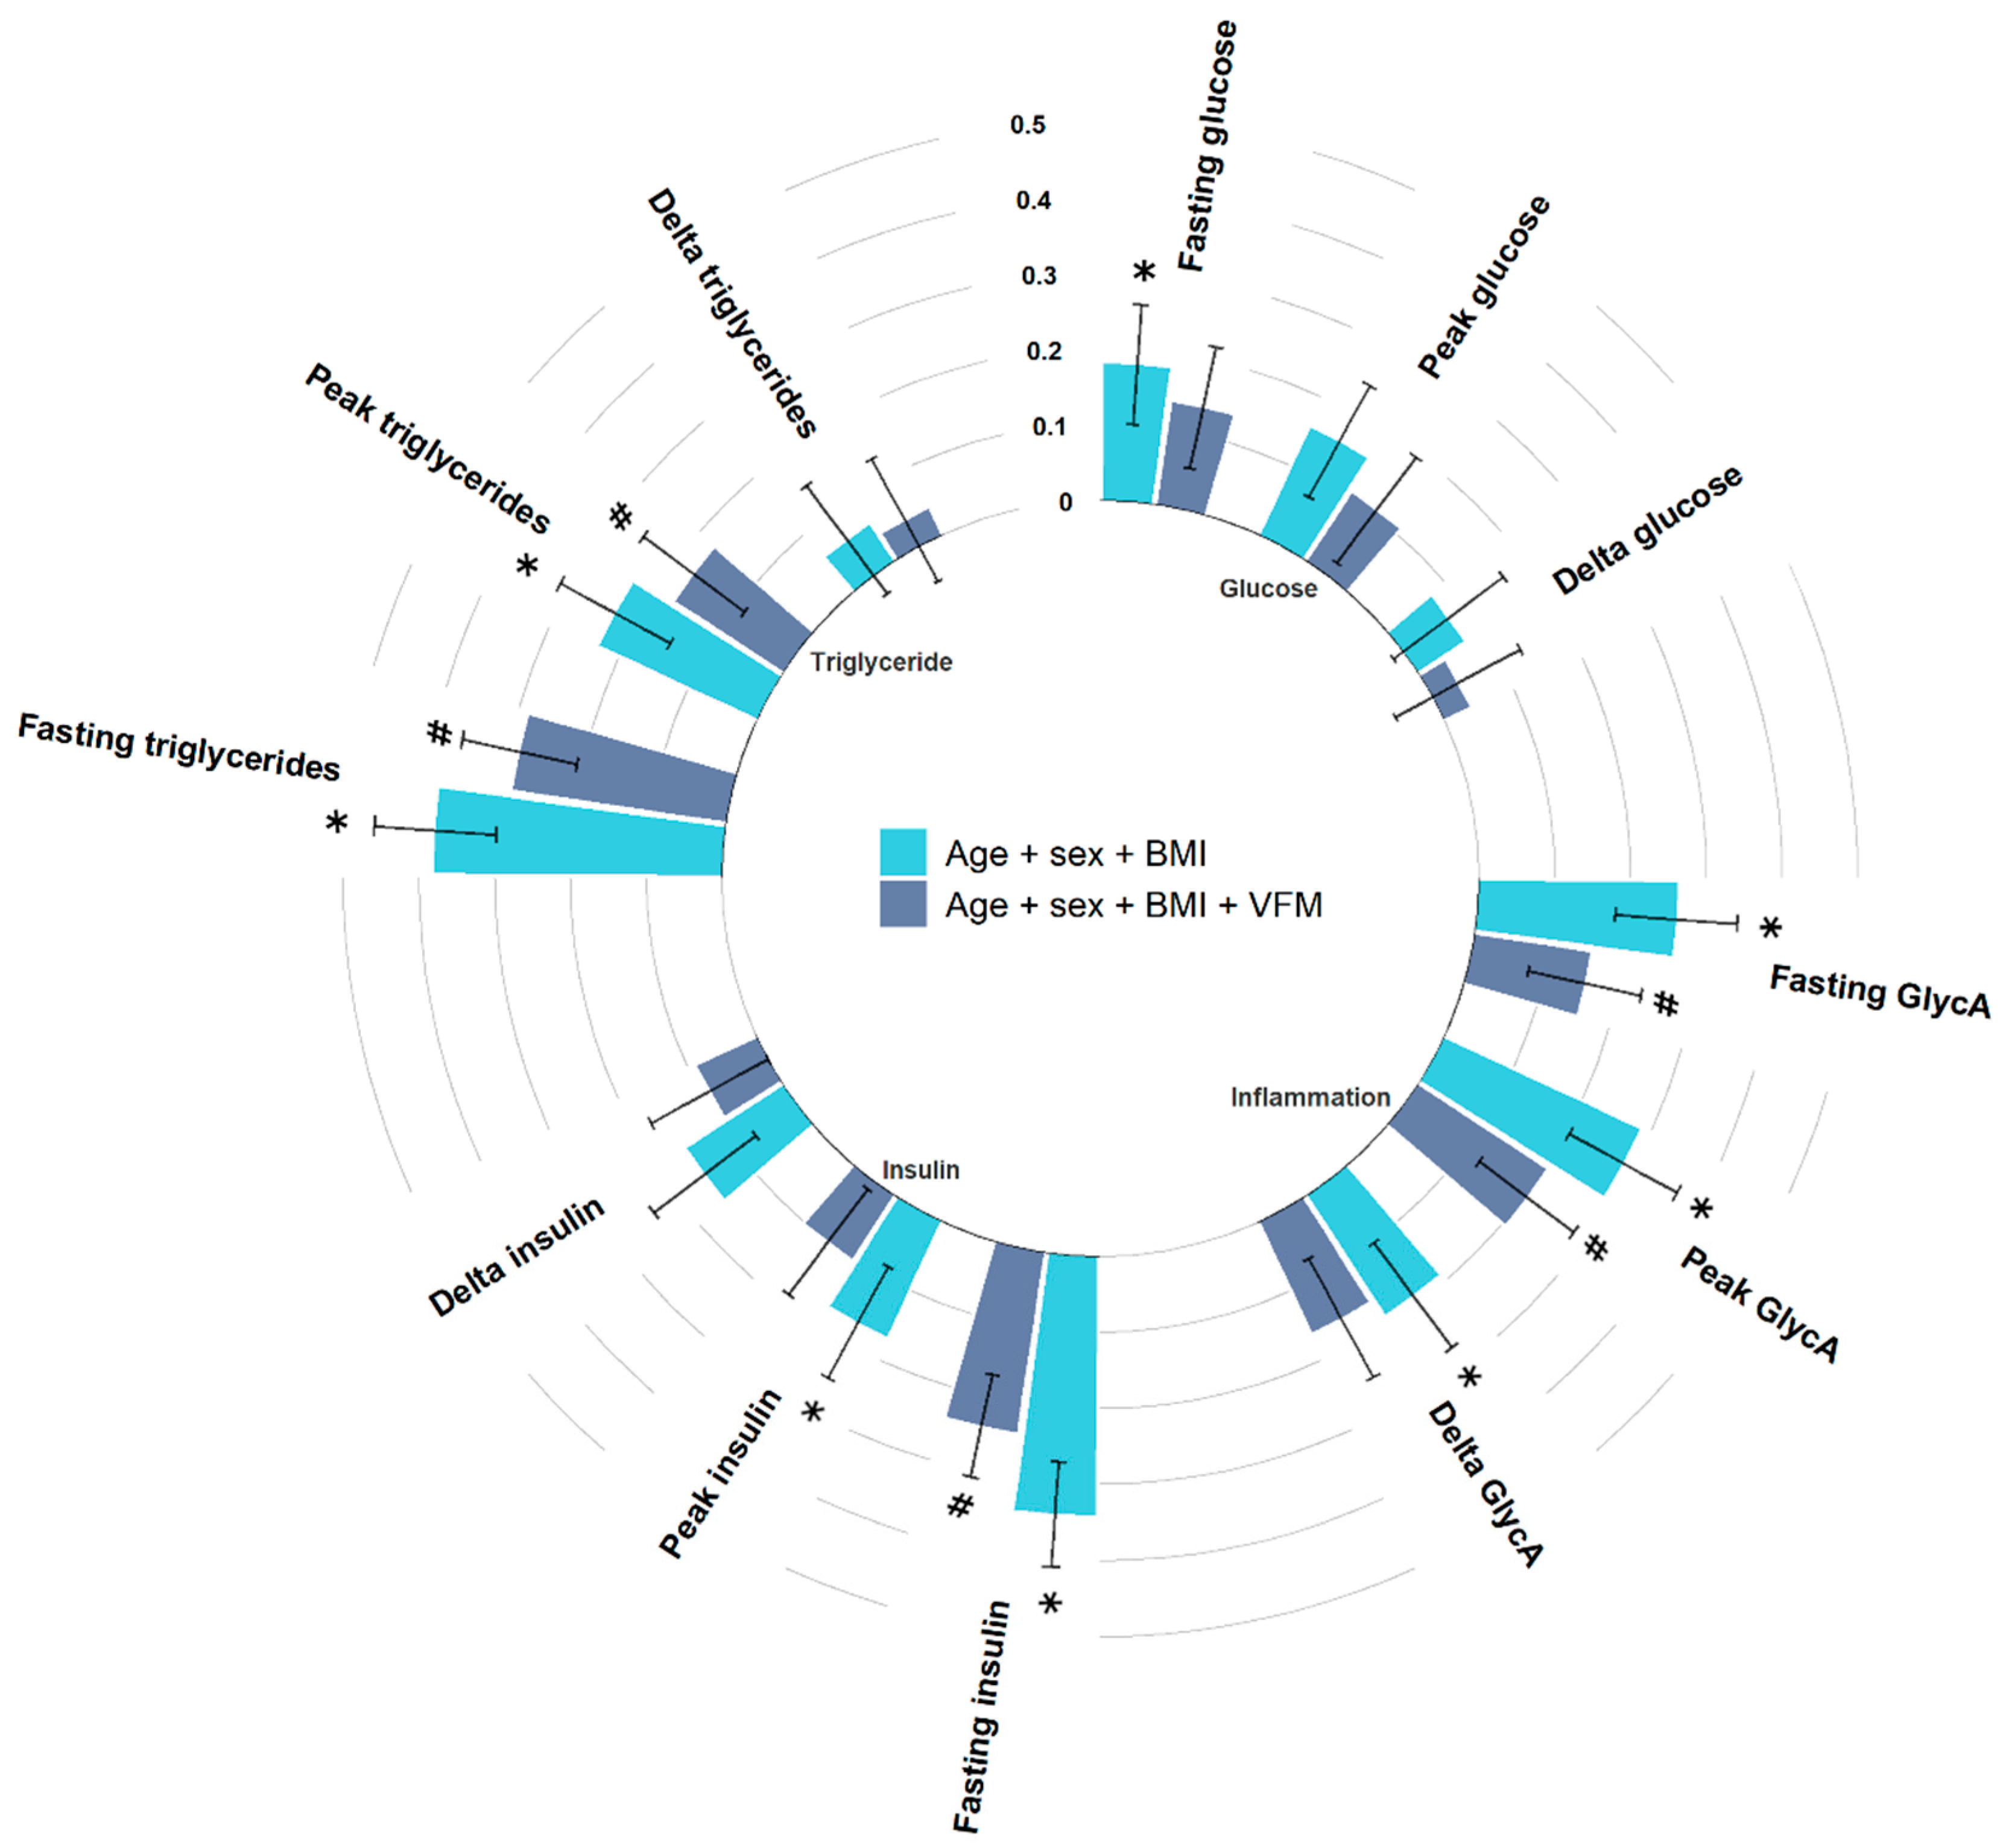
3.1. Fasting Levels
3.2. Peak Levels
3.3. Change from Fasting Levels
3.4. Sensitivity Analysis
4. Discussion
5. Conclusions
Supplementary Materials
Author Contributions
Funding
Institutional Review Board Statement
Informed Consent Statement
Data Availability Statement
Acknowledgments
Conflicts of Interest
References
- Mills, K.T.; Stefanescu, A.; He, J. The Global Epidemiology of Hypertension. Nat. Rev. Nephrol. 2020, 16, 223–237. [Google Scholar] [CrossRef] [PubMed]
- Mulè, G.; Calcaterra, I.; Nardi, E.; Cerasola, G.; Cottone, S. Metabolic Syndrome in Hypertensive Patients: An Unholy Alliance. World J. Cardiol. 2014, 6, 890–907. [Google Scholar] [CrossRef]
- Katsimardou, A.; Imprialos, K.; Stavropoulos, K.; Sachinidis, A.; Doumas, M.; Athyros, V. Hypertension in Metabolic Syndrome: Novel Insights. Curr. Hypertens. Rev. 2020, 16, 12–18. [Google Scholar] [CrossRef] [PubMed]
- Mancia, G.; Bombelli, M.; Corrao, G.; Facchetti, R.; Madotto, F.; Giannattasio, C.; Trevano, F.Q.; Grassi, G.; Zanchetti, A.; Sega, R. Metabolic Syndrome in the Pressioni Arteriose Monitorate E Loro Associazioni (PAMELA) Study. Hypertension 2007, 49, 40–47. [Google Scholar] [CrossRef] [PubMed] [Green Version]
- Schillaci, G.; Pirro, M.; Vaudo, G.; Gemelli, F.; Marchesi, S.; Porcellati, C.; Mannarino, E. Prognostic Value of the Metabolic Syndrome in Essential Hypertension. J. Am. Coll. Cardiol. 2004, 43, 1817–1822. [Google Scholar] [CrossRef] [Green Version]
- Cuspidi, C.; Facchetti, R.; Bombelli, M.; Sala, C.; Tadic, M.; Grassi, G.; Mancia, G. Risk of New-Onset Metabolic Syndrome Associated with White-Coat and Masked Hypertension: Data from a General Population. J. Hypertens. 2018, 36, 1833–1839. [Google Scholar] [CrossRef]
- Ferrannini, E.; Natali, A.; Capaldo, B.; Lehtovirta, M.; Jacob, S.; H. Yki-Järvinen for the European Group for the Study of Insulin Resistance. Insulin Resistance, Hyperinsulinemia, and Blood Pressure. Hypertension 1997, 30, 1144–1149. [Google Scholar] [CrossRef]
- Horita, S.; Seki, G.; Yamada, H.; Suzuki, M.; Koike, K.; Fujita, T. Insulin Resistance, Obesity, Hypertension, and Renal Sodium Transport. Int. J. Hypertens. 2011, 2011, 391762. [Google Scholar] [CrossRef] [Green Version]
- Berry, S.E.; Valdes, A.M.; Drew, D.A.; Asnicar, F.; Mazidi, M.; Wolf, J.; Capdevila, J.; Hadjigeorgiou, G.; Davies, R.; Al Khatib, H.; et al. Human Postprandial Responses to Food and Potential for Precision Nutrition. Nat. Med. 2020, 26, 964–973. [Google Scholar] [CrossRef]
- Lopez-Miranda, J.; Marin, C. Frontiers in neuroscience dietary, physiological, and genetic impacts on postprandial lipid metabolism. In Fat Detection: Taste, Texture, and Post Ingestive Effects; Montmayeur, J.P., le Coutre, J., Eds.; Taylor and Francis: Abingdon, UK, 2010. [Google Scholar]
- Bansal, S.; Buring, J.E.; Rifai, N.; Mora, S.; Sacks, F.M.; Ridker, P.M. Fasting Compared with Nonfasting Triglycerides and Risk of Cardiovascular Events in Women. JAMA 2007, 298, 309–316. [Google Scholar] [CrossRef]
- Hwu, C.M.; Kwok, C.F.; Kuo, C.S.; Hsiao, L.C.; Lee, Y.S.; Wei, M.J.; Kao, W.Y.; Lee, S.H.; Ho, L.T. Exacerbation of Insulin Resistance and Postprandial Triglyceride Response in Newly Diagnosed Hypertensive Patients with Hypertriglyceridaemia. J. Hum. Hypertens. 2002, 16, 487–493. [Google Scholar] [CrossRef] [PubMed] [Green Version]
- Elffers, T.W.; de Mutsert, R.; Lamb, H.J.; de Roos, A.; Willems van Dijk, K.; Rosendaal, F.R.; Jukema, J.W.; Trompet, S. Body Fat Distribution, in Particular Visceral Fat, is Associated with Cardiometabolic Risk Factors in Obese Women. PLoS ONE 2017, 12, e0185403. [Google Scholar] [CrossRef] [PubMed] [Green Version]
- Franczyk, M.P.; He, M.; Yoshino, J. Removal of Epididymal Visceral Adipose Tissue Prevents Obesity-Induced Multi-Organ Insulin Resistance in Male Mice. J. Endocr. Soc. 2021, 5, bvab024. [Google Scholar] [CrossRef] [PubMed]
- Gabriely, I.; Ma, X.H.; Yang, X.M.; Atzmon, G.; Rajala, M.W.; Berg, A.H.; Scherer, P.; Rossetti, L.; Barzilai, N. Removal of Visceral Fat Prevents Insulin Resistance and Glucose Intolerance of Aging: An Adipokine-Mediated Process? Diabetes 2002, 51, 2951–2958. [Google Scholar] [CrossRef] [Green Version]
- Verdi, S.; Abbasian, G.; Bowyer, R.C.E.; Lachance, G.; Yarand, D.; Christofidou, P.; Mangino, M.; Menni, C.; Bell, J.T.; Falchi, M.; et al. TwinsUK: The UK Adult Twin Registry Update. Twin Res. Hum. Genet. 2019, 22, 523–529. [Google Scholar] [CrossRef] [Green Version]
- Ballout, R.A.; Remaley, A.T. GlycA: A New Biomarker for Systemic Inflammation and Cardiovascular Disease (CVD) Risk Assessment. J. Lab. Precis. Med. 2020, 5, 17. [Google Scholar] [CrossRef]
- Otvos, J.D.; Shalaurova, I.; Wolak-Dinsmore, J.; Connelly, M.A.; Mackey, R.H.; Stein, J.H.; Tracy, R.P. GlycA: A Composite Nuclear Magnetic Resonance Biomarker of Systemic Inflammation. Clin. Chem. 2015, 61, 714–723. [Google Scholar] [CrossRef] [Green Version]
- Akinkuolie, A.O.; Buring, J.E.; Ridker, P.M.; Mora, S. A Novel Protein Glycan Biomarker and Future Cardiovascular Disease Events. J. Am. Heart Assoc. 2014, 3, e001221. [Google Scholar] [CrossRef] [Green Version]
- Connelly, M.A.; Otvos, J.D.; Shalaurova, I.; Playford, M.P.; Mehta, N.N. GlycA, a Novel Biomarker of Systemic Inflammation and Cardiovascular Disease Risk. J. Transl. Med. 2017, 15, 219. [Google Scholar] [CrossRef] [Green Version]
- Direk, K.; Cecelja, M.; Astle, W.; Chowienczyk, P.; Spector, T.D.; Falchi, M.; Andrew, T. The Relationship between DXA-Based and Anthropometric Measures of Visceral Fat and Morbidity in Women. BMC Cardiovasc. Disord. 2013, 13, 25. [Google Scholar] [CrossRef]
- Bertin, E.; Marcus, C.; Ruiz, J.C.; Eschard, J.P.; Leutenegger, M. Measurement of Visceral Adipose Tissue by DXA Combined with Anthropometry in Obese Humans. Int. J. Obes. 2000, 24, 263–270. [Google Scholar] [CrossRef] [PubMed] [Green Version]
- Tingley, D.; Yamamoto, T.; Hirose, K.; Keele, L.; Imai, K. Mediation: R Package for Causal Mediation Analysis. J. Stat. Softw. 2014, 59, 38. [Google Scholar] [CrossRef] [Green Version]
- Qu, H.-Q.; Li, Q.; Rentfro, A.R.; Fisher-Hoch, S.P.; McCormick, J.B. The Definition of Insulin Resistance Using HOMA-IR for Americans of Mexican Descent Using Machine Learning. PLoS ONE 2011, 6, e21041. [Google Scholar] [CrossRef] [PubMed] [Green Version]
- Saxton, S.N.; Clark, B.J.; Withers, S.B.; Eringa, E.C.; Heagerty, A.M. Mechanistic Links between Obesity, Diabetes, and Blood Pressure: Role of Perivascular Adipose Tissue. Physiol. Rev. 2019, 99, 1701–1763. [Google Scholar] [CrossRef]
- Kolb, H.; Kempf, K.; Röhling, M.; Martin, S. Insulin: Too Much of a Good Thing is Bad. BMC Med. 2020, 18, 224. [Google Scholar] [CrossRef]
- Jackson, K.G.; Poppitt, S.D.; Minihane, A.M. Postprandial Lipemia and Cardiovascular Disease Risk: Interrelationships Between Dietary, Physiological and Genetic Determinants. Atherosclerosis 2012, 220, 22–33. [Google Scholar] [CrossRef]
- Kolovou, G.D.; Daskalova, D.; Iraklianou, S.A.; Adamopoulou, E.N.; Pilatis, N.D.; Hatzigeorgiou, G.C.; Cokkinos, D.V. Postprandial Lipemia in Hypertension. J. Am. Coll. Nutr. 2003, 22, 80–87. [Google Scholar] [CrossRef]
- Mancusi, C.; Izzo, R.; di Gioia, G.; Losi, M.A.; Barbato, E.; Morisco, C. Insulin Resistance the Hinge Between Hypertension and Type 2 Diabetes. High Blood Press Cardiovasc. Prev. 2020, 27, 515–526. [Google Scholar] [CrossRef]
- Chaudhary, K.; Buddineni, J.P.; Nistala, R.; Whaley-Connell, A. Resistant Hypertension in the High-Risk Metabolic Patient. Curr. Diab. Rep. 2011, 11, 41–46. [Google Scholar] [CrossRef] [PubMed]
- Nickenig, G.; Röling, J.; Strehlow, K.; Schnabel, P.; Böhm, M. Insulin Induces Upregulation of Vascular AT1 Receptor Gene Expression by Posttranscriptional Mechanisms. Circulation 1998, 98, 2453–2460. [Google Scholar] [CrossRef]
- Najjar, S.M.; Perdomo, G. Hepatic Insulin Clearance: Mechanism and Physiology. Physiology 2019, 34, 198–215. [Google Scholar] [CrossRef] [PubMed]
- Si, Y.; Wang, A.; Yang, Y.; Liu, H.; Gu, S.; Mu, Y.; Lyu, Z. Fasting Blood Glucose and 2-h Postprandial Blood Glucose Predict Hypertension: A Report from the Reaction Study. Diabetes 2021, 12, 1117–1128. [Google Scholar] [CrossRef] [PubMed]
- Zhao, Y.; Liu, L.; Yang, S.; Liu, G.; Pan, L.; Gu, C.; Wang, Y.; Li, D.; Zhao, R.; Wu, M. Mechanisms of Atherosclerosis Induced by Postprandial Lipemia. Front. Cardiovasc. Med. 2021, 8, 636947. [Google Scholar] [CrossRef] [PubMed]
- Bouchard, C. BMI, Fat Mass, Abdominal Adiposity and Visceral Fat: Where is the ‘Beef’? Int. J. Obes. 2007, 31, 1552–1553. [Google Scholar] [CrossRef] [PubMed]
- Schiavon, C.A.; Bersch-Ferreira, A.C.; Santucci, E.V.; Oliveira, J.D.; Torreglosa, C.R.; Bueno, P.T.; Frayha, J.C.; Santos, R.N.; Damiani, L.P.; Noujaim, P.M.; et al. Effects of Bariatric Surgery in Obese Patients with Hypertension: The Gateway Randomized Trial (Gastric Bypass to Treat Obese Patients with Steady Hypertension). Circulation 2018, 137, 1132–1142. [Google Scholar] [CrossRef]
- Pickering, T.G. Measurement of Blood Pressure in and Out of the Office. J. Clin. Hypertens. 2005, 7, 123–129. [Google Scholar] [CrossRef]

| Overall (n = 989) | Hypertensive Cases (n = 203) | Normotensive Controls (n = 786) | ||||
|---|---|---|---|---|---|---|
| n | % | n | % | n | % | |
| Antihypertensive drug use | 56 | 5.7 | 56 | 27.6 | 0 | 0 |
| Females | 719 | 72.7 | 135 | 66.5 | 584 | 74.3 |
| Peri-menopausal | 54 | 8.8 | 15 | 12.5 | 39 | 7.9 |
| Post-menopausal | 201 | 32.7 | 72 | 60 | 129 | 26.1 |
| Mean | Sd | Mean | Sd | Mean | Sd | |
| Age (years) | 45.6 | 11.9 | 52 | 10.2 | 43.9 | 11.8 |
| BMI (kg/m2) | 25.6 | 5.1 | 27.4 | 5.6 | 25.2 | 4.8 |
| Waist to hip ratio | 0.85 | 0.08 | 0.88 | 0.09 | 0.84 | 0.08 |
| VFM (g) | 527.2 | 311.6 | 689.8 | 358.8 | 485.1 | 283.7 |
| HOMA-IR | 1.4 | 1.1 | 1.9 | 1.8 | 1.3 | 0.9 |
Publisher’s Note: MDPI stays neutral with regard to jurisdictional claims in published maps and institutional affiliations. |
© 2022 by the authors. Licensee MDPI, Basel, Switzerland. This article is an open access article distributed under the terms and conditions of the Creative Commons Attribution (CC BY) license (https://creativecommons.org/licenses/by/4.0/).
Share and Cite
Louca, P.; Berry, S.E.; Bermingham, K.; Franks, P.W.; Wolf, J.; Spector, T.D.; Valdes, A.M.; Chowienczyk, P.; Menni, C. Postprandial Responses to a Standardised Meal in Hypertension: The Mediatory Role of Visceral Fat Mass. Nutrients 2022, 14, 4499. https://doi.org/10.3390/nu14214499
Louca P, Berry SE, Bermingham K, Franks PW, Wolf J, Spector TD, Valdes AM, Chowienczyk P, Menni C. Postprandial Responses to a Standardised Meal in Hypertension: The Mediatory Role of Visceral Fat Mass. Nutrients. 2022; 14(21):4499. https://doi.org/10.3390/nu14214499
Chicago/Turabian StyleLouca, Panayiotis, Sarah E. Berry, Kate Bermingham, Paul W. Franks, Jonathan Wolf, Tim D. Spector, Ana M. Valdes, Phil Chowienczyk, and Cristina Menni. 2022. "Postprandial Responses to a Standardised Meal in Hypertension: The Mediatory Role of Visceral Fat Mass" Nutrients 14, no. 21: 4499. https://doi.org/10.3390/nu14214499