
The Effects of Walnuts and Academic Stress on Mental Health, General Well-Being and the Gut Microbiota in a Sample of University Students: A Randomised Clinical Trial

 , , , and
Abstract
1. Introduction
2. Materials and Methods
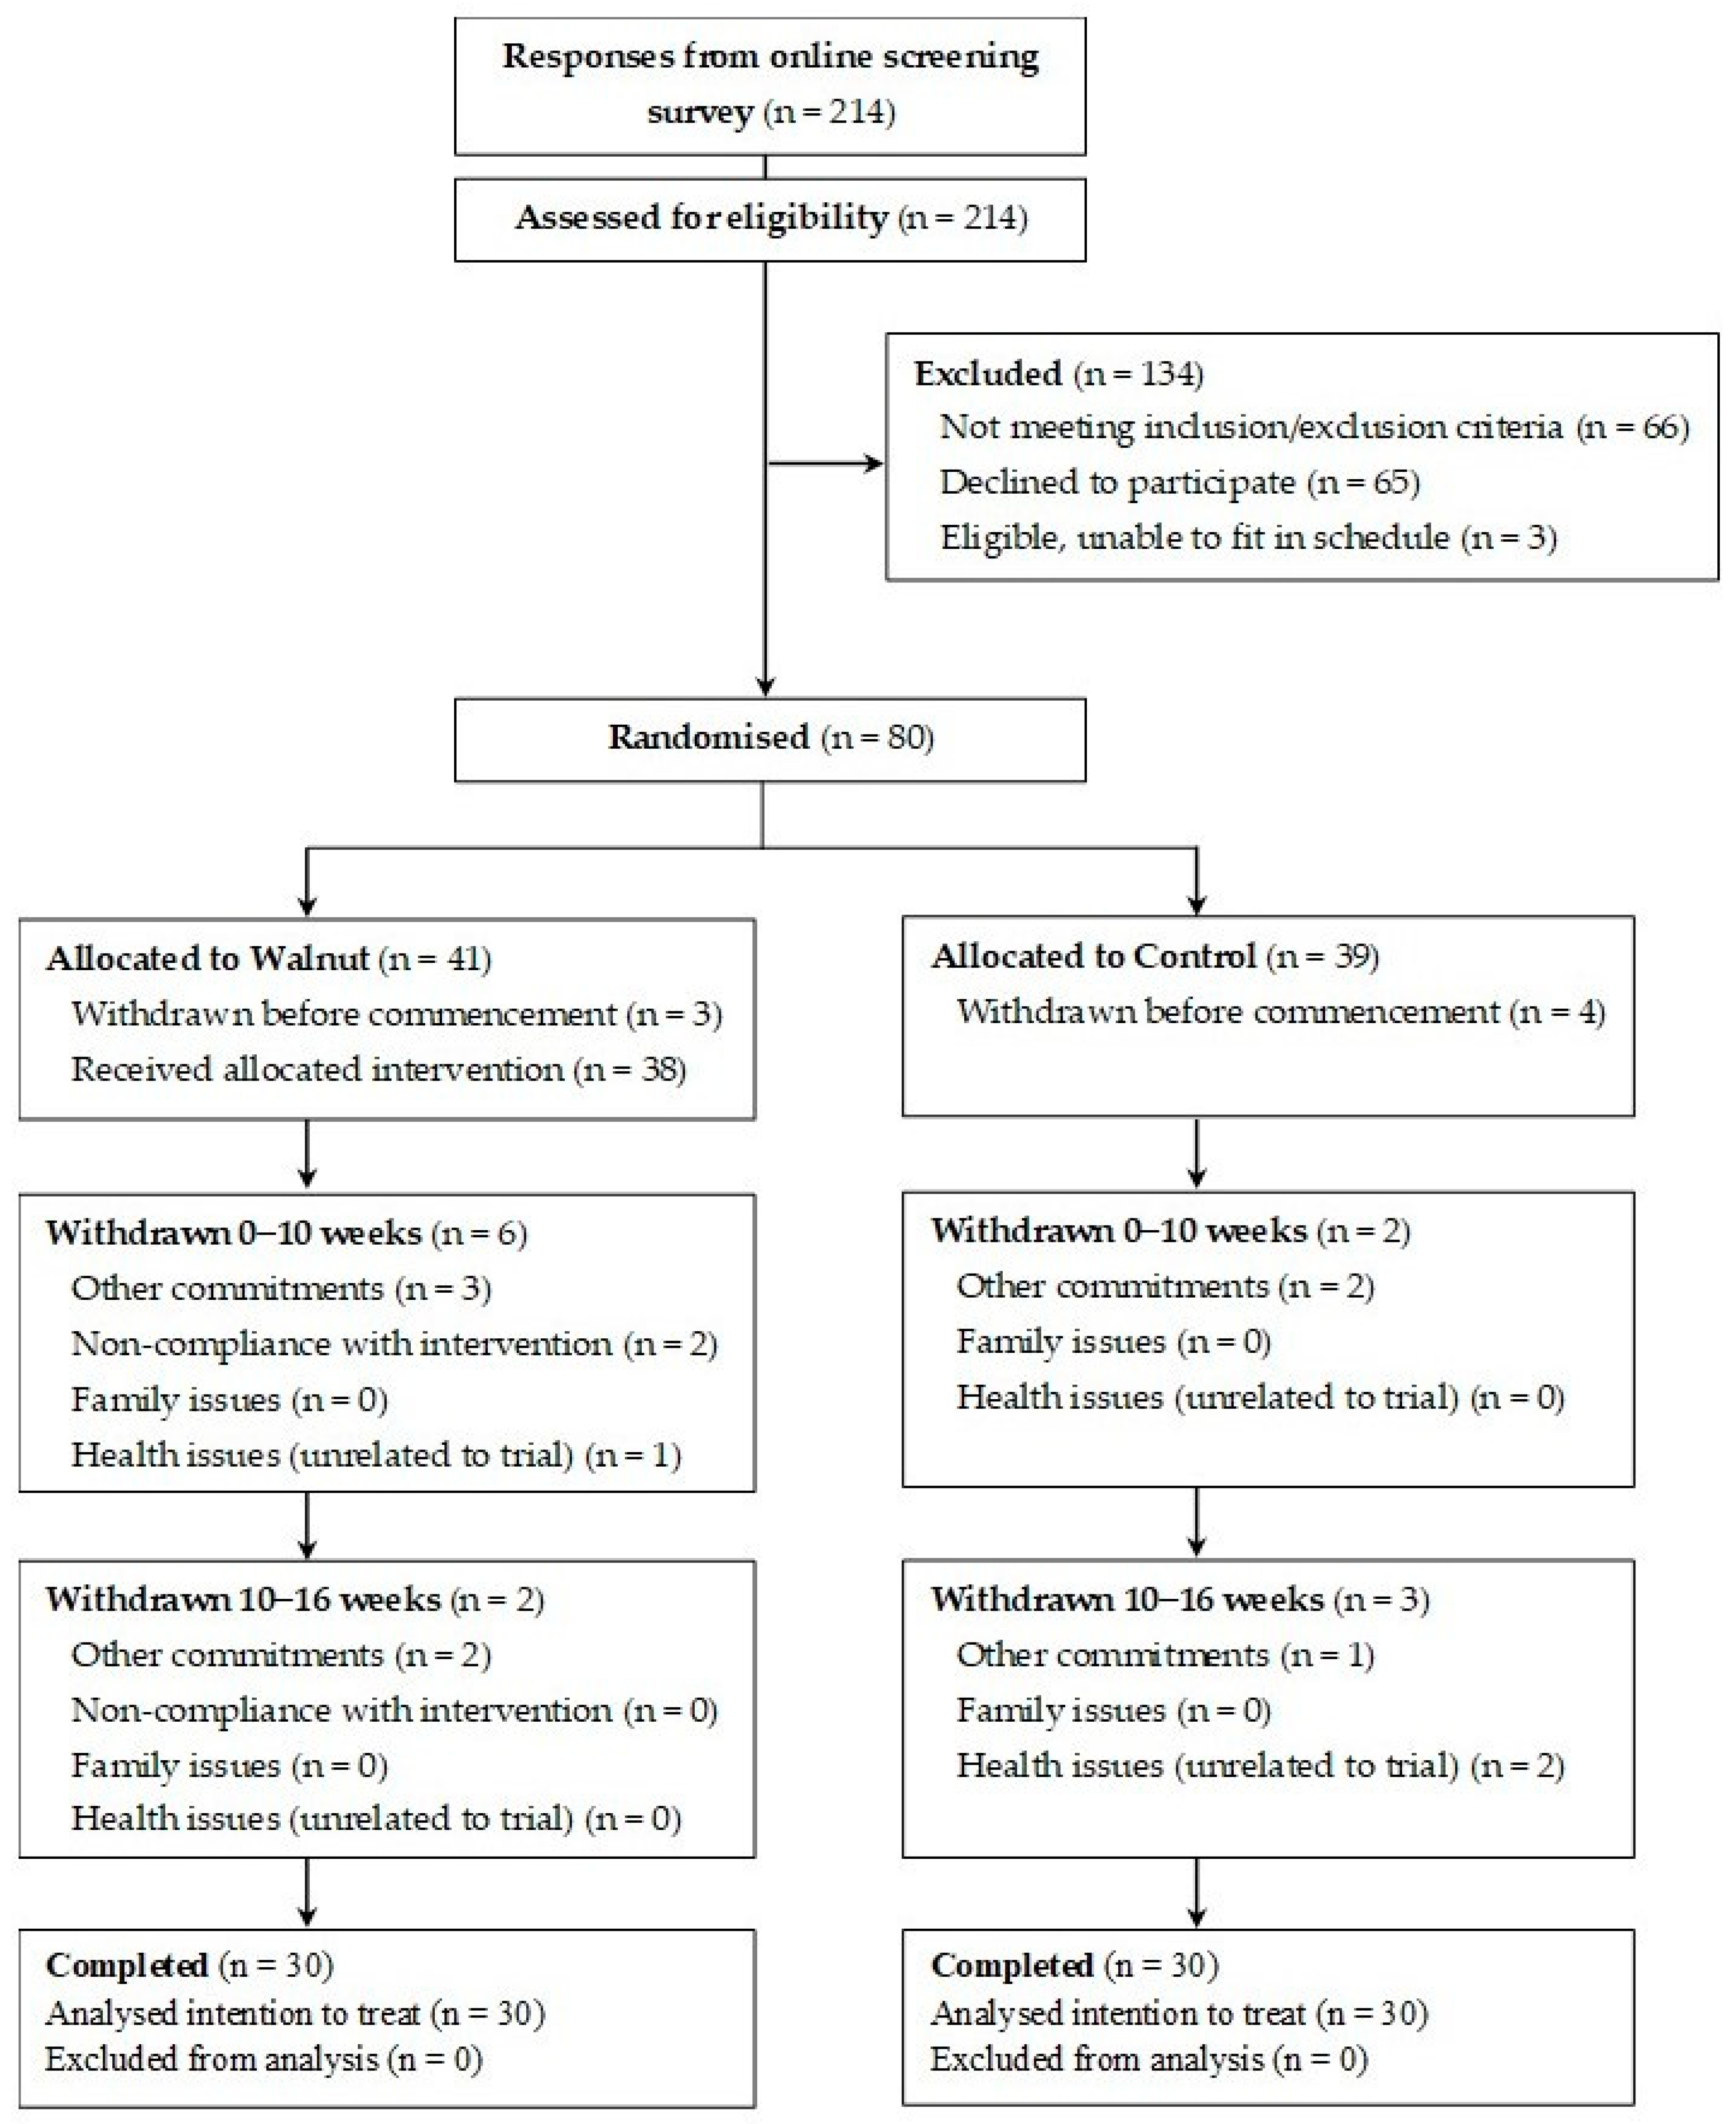
2.1. Participants
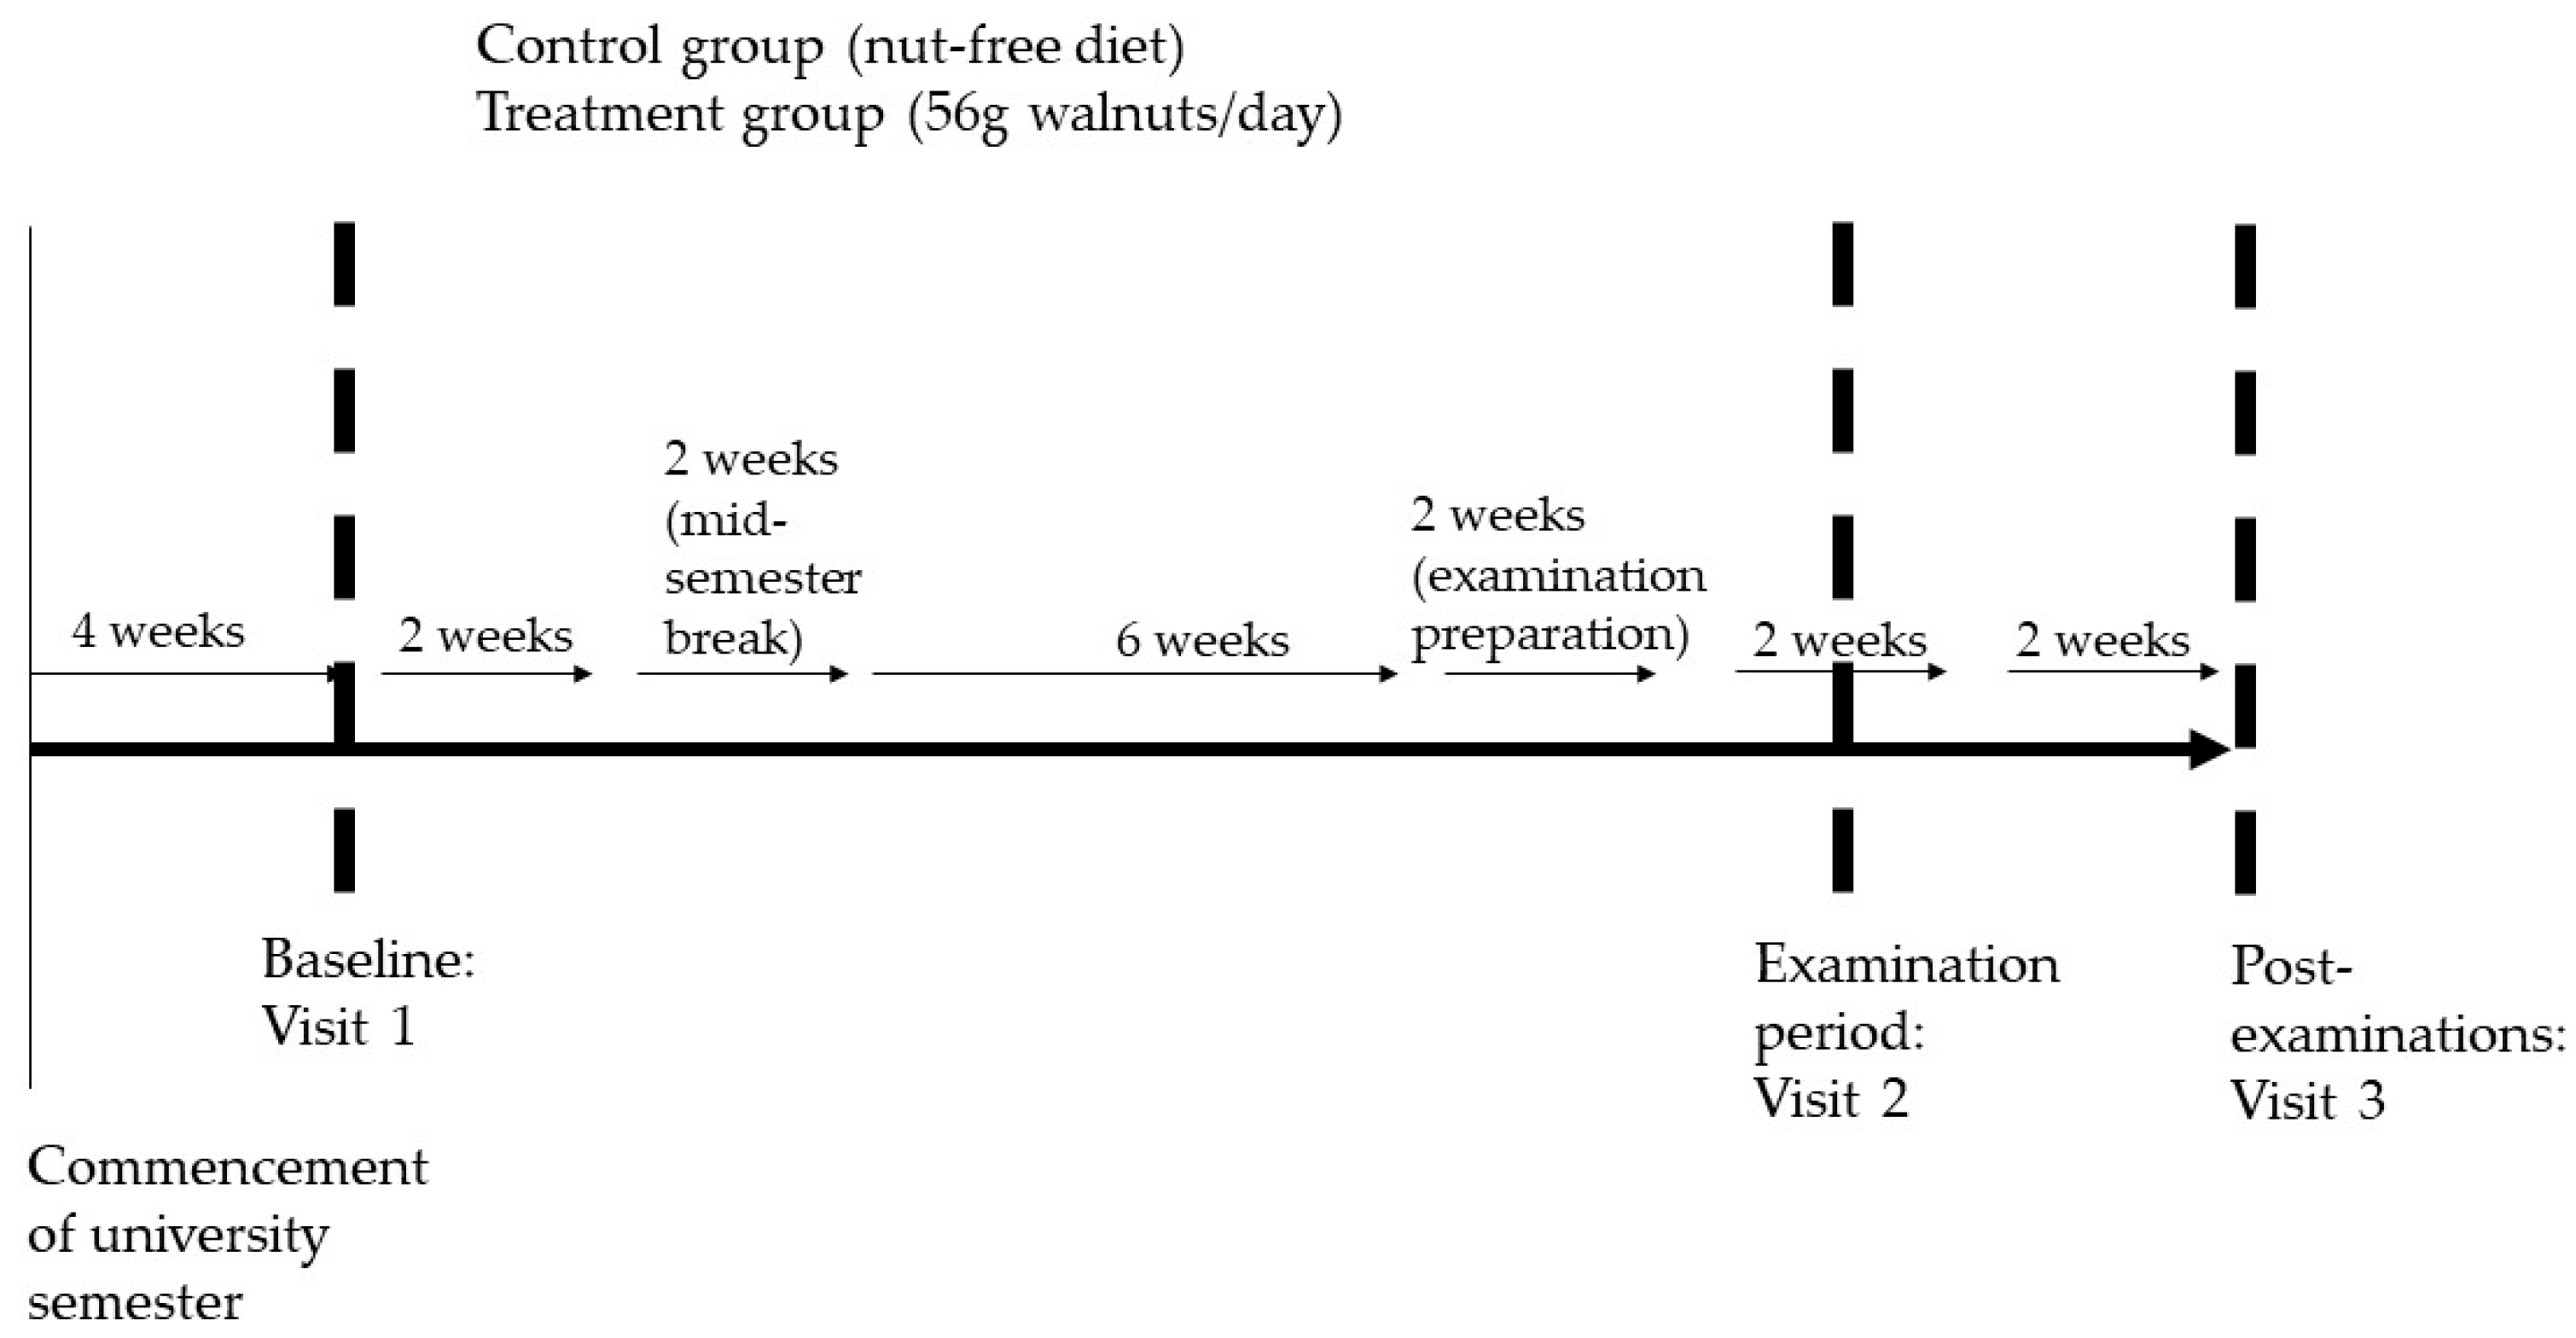
2.2. Study Design
2.3. Blood Sample Collection and Analyses
2.4. Saliva Sample Collection and Analyses
2.5. Faecal Sample Collection 16S rRNA Gene Sequencing
2.6. Microbiota Analysis
2.7. Statistical Analyses
3. Results
3.1. Baseline Characteristics
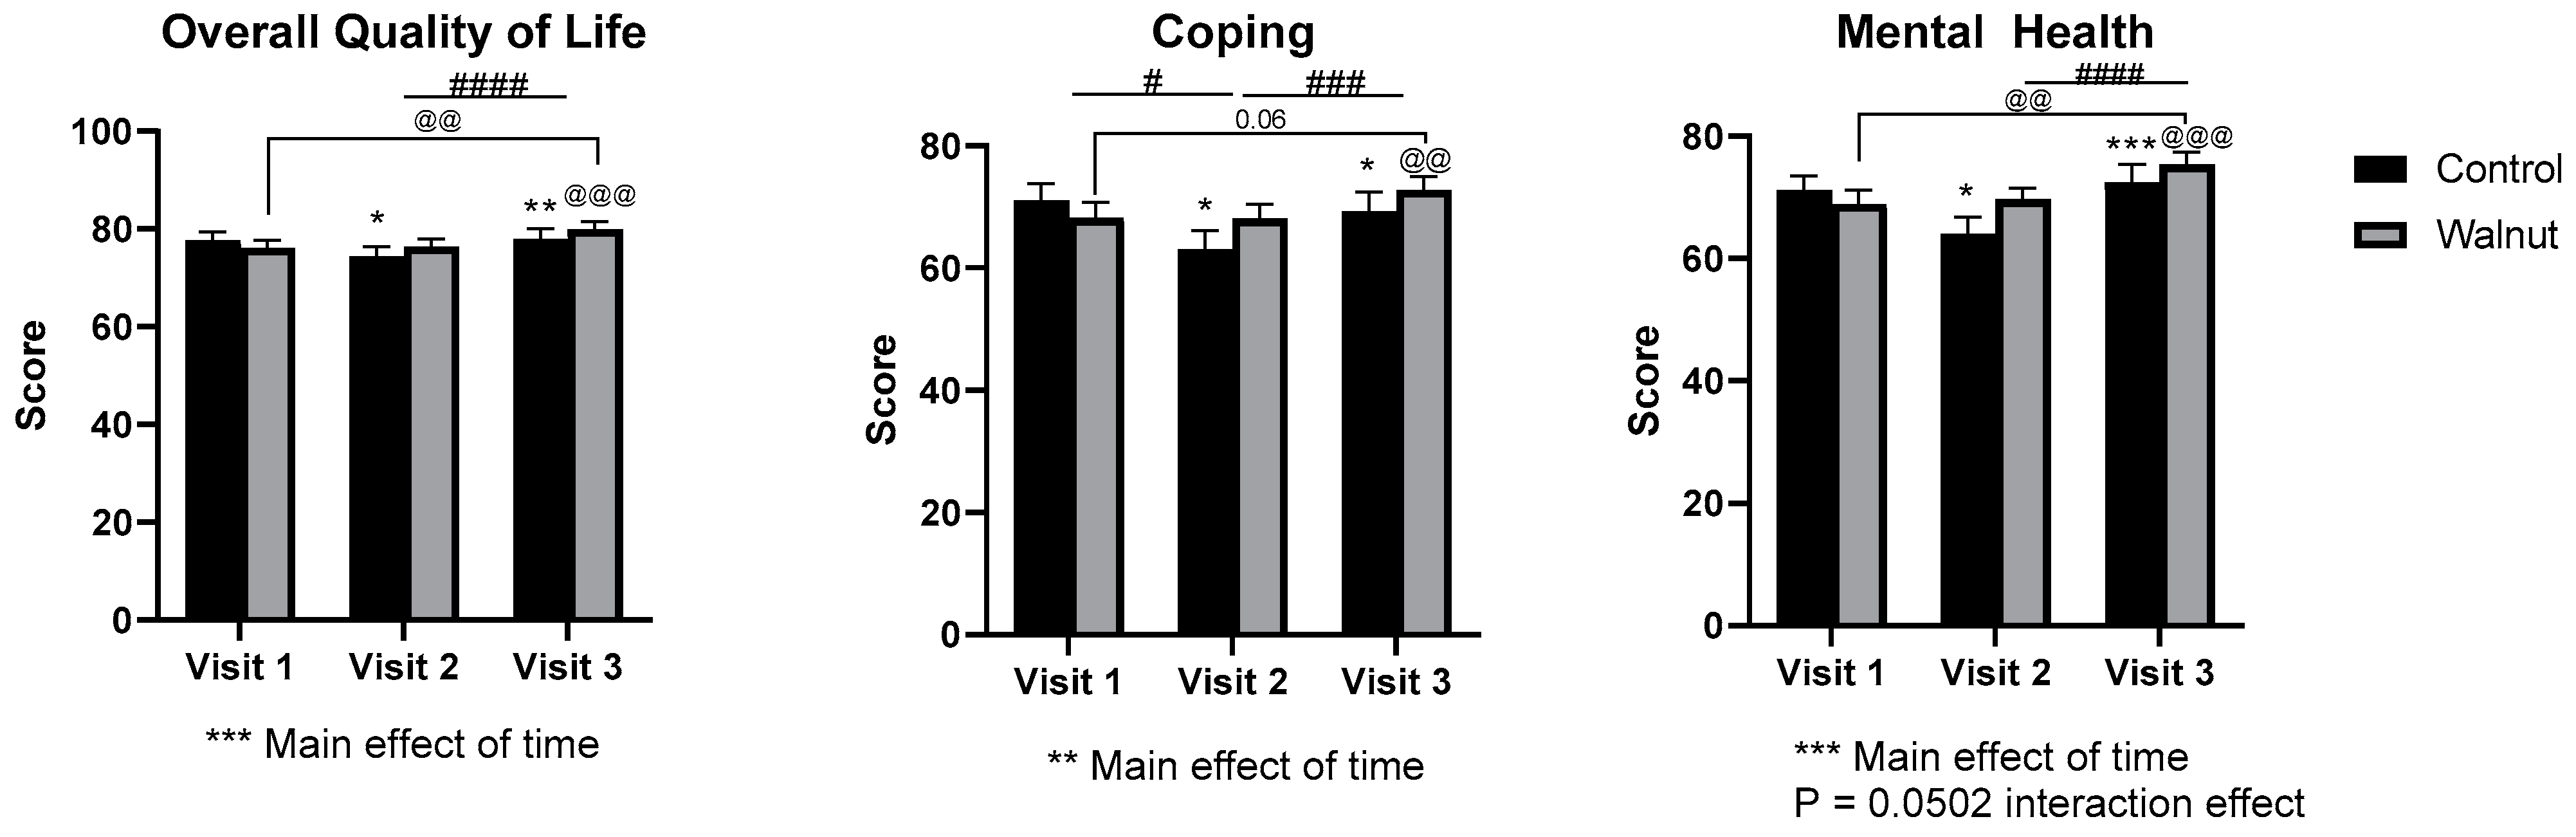
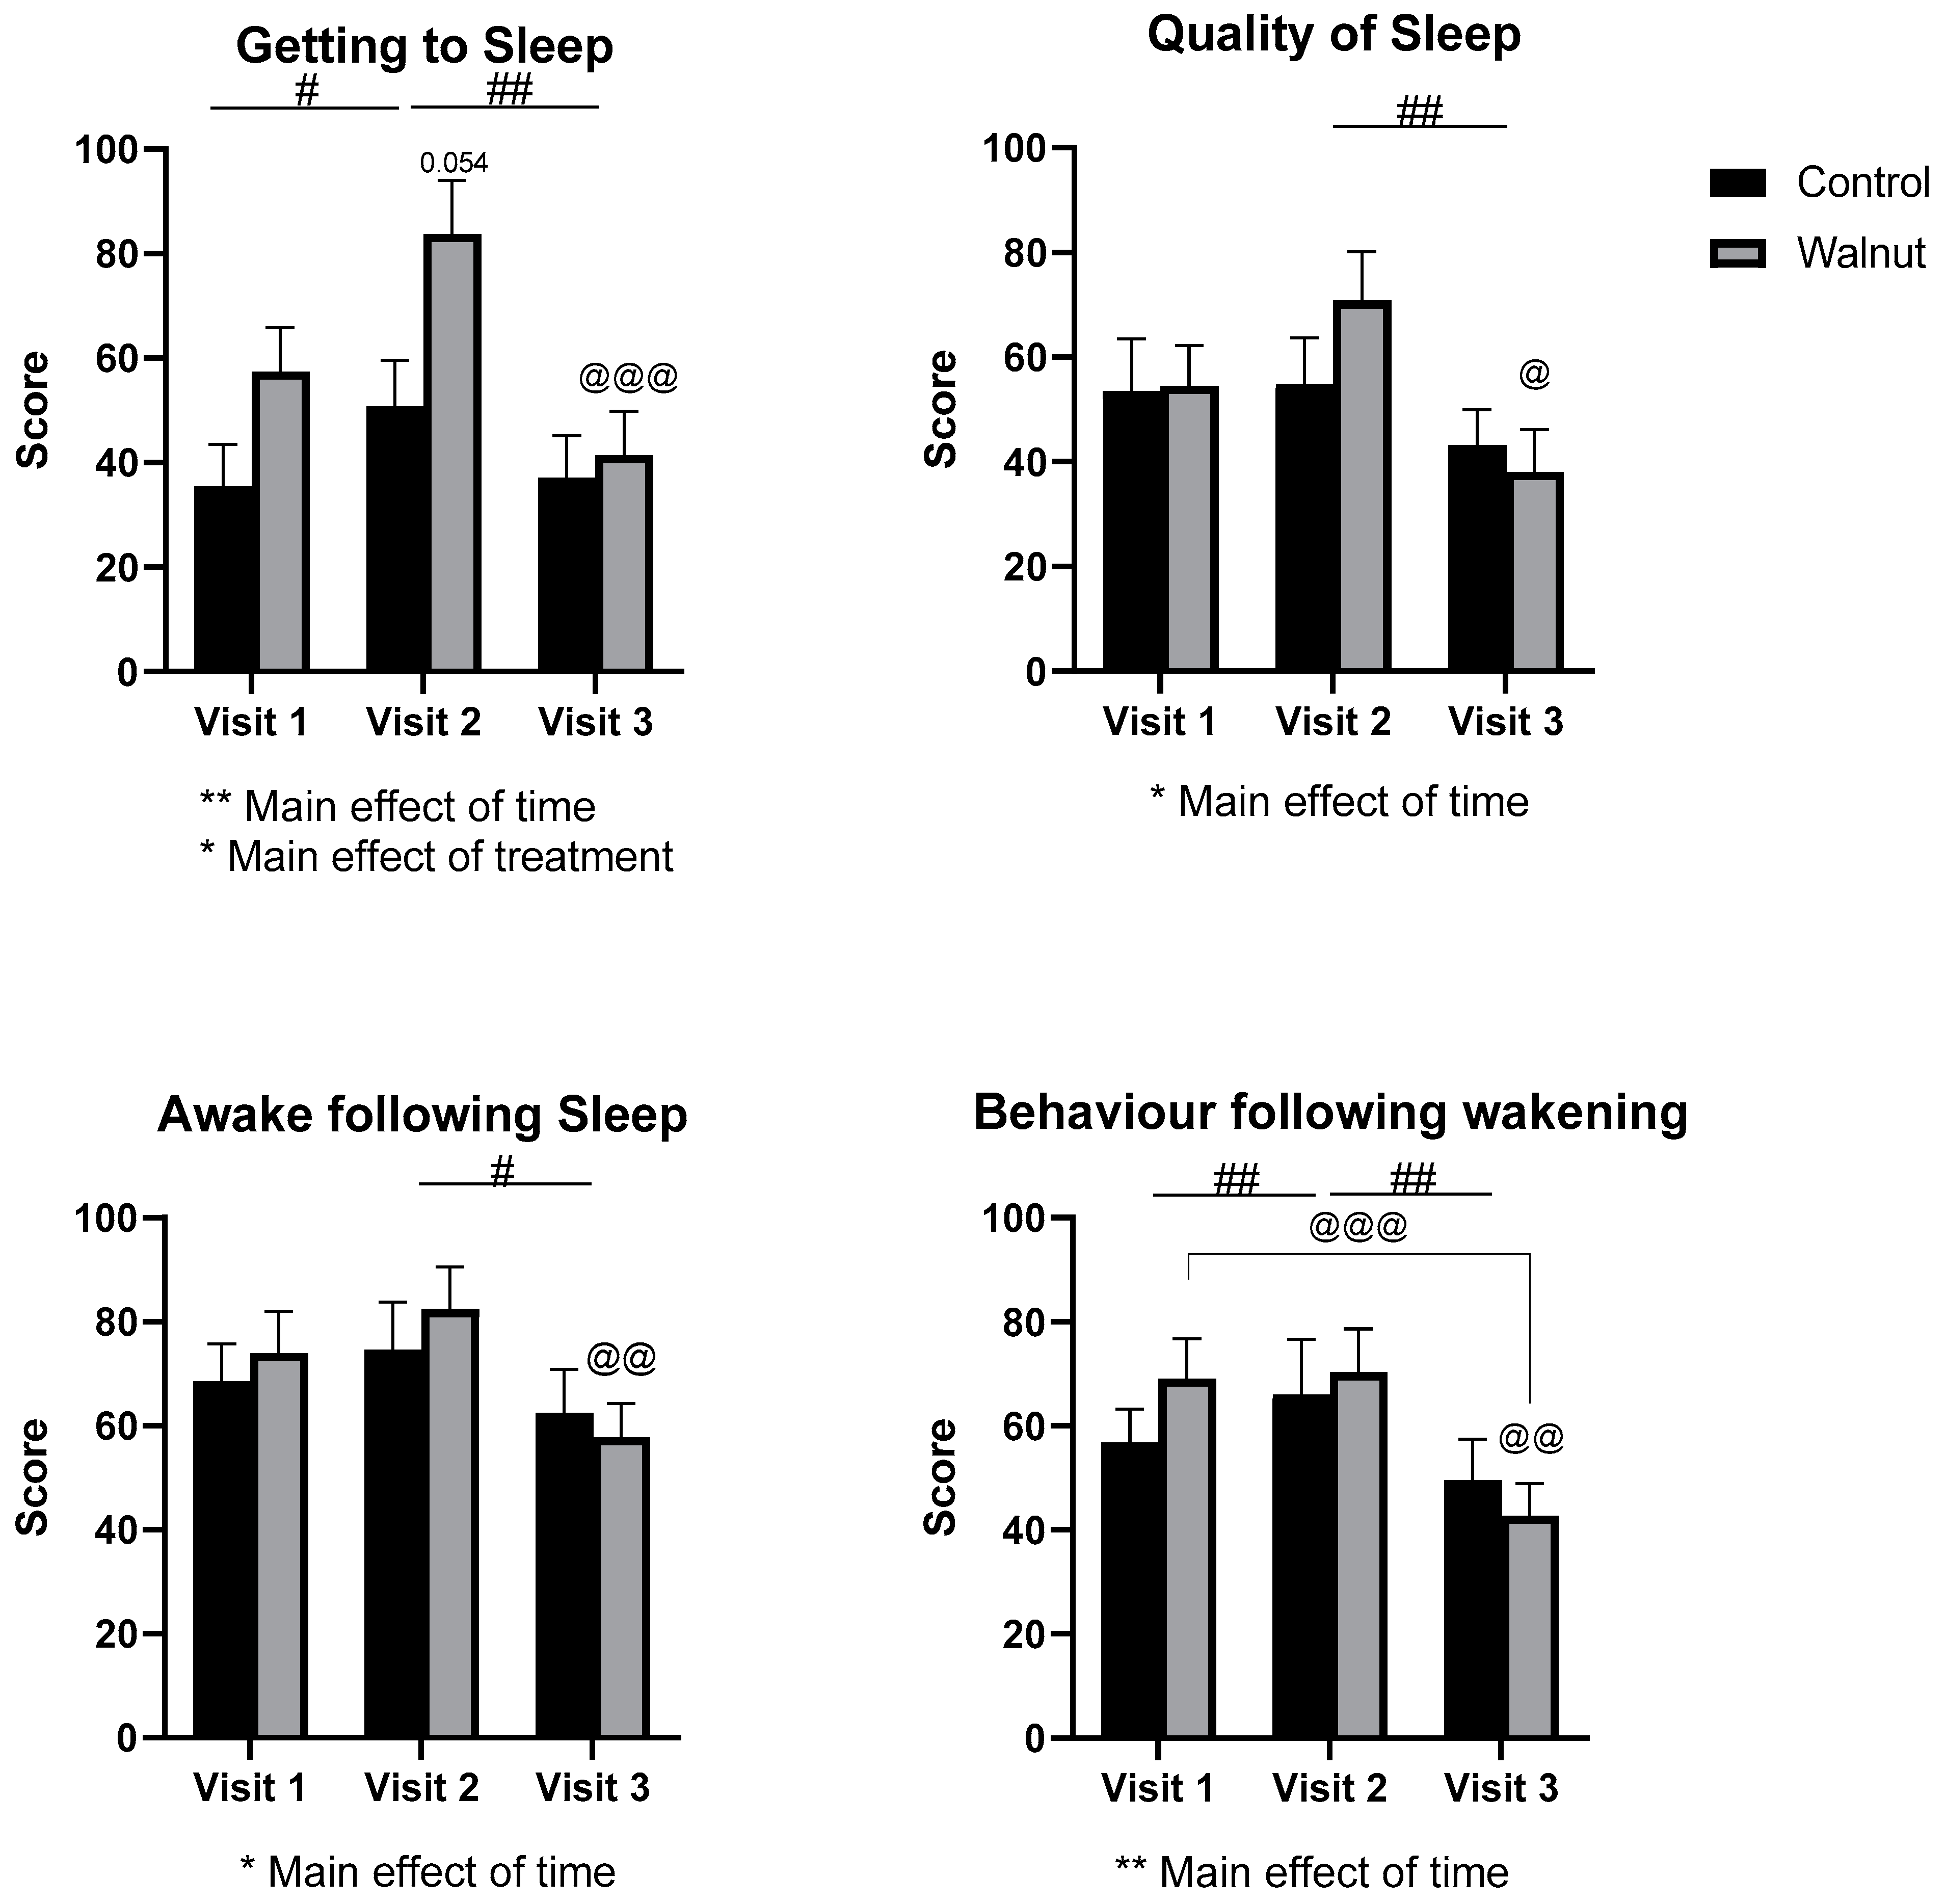
3.2. Questionnaires
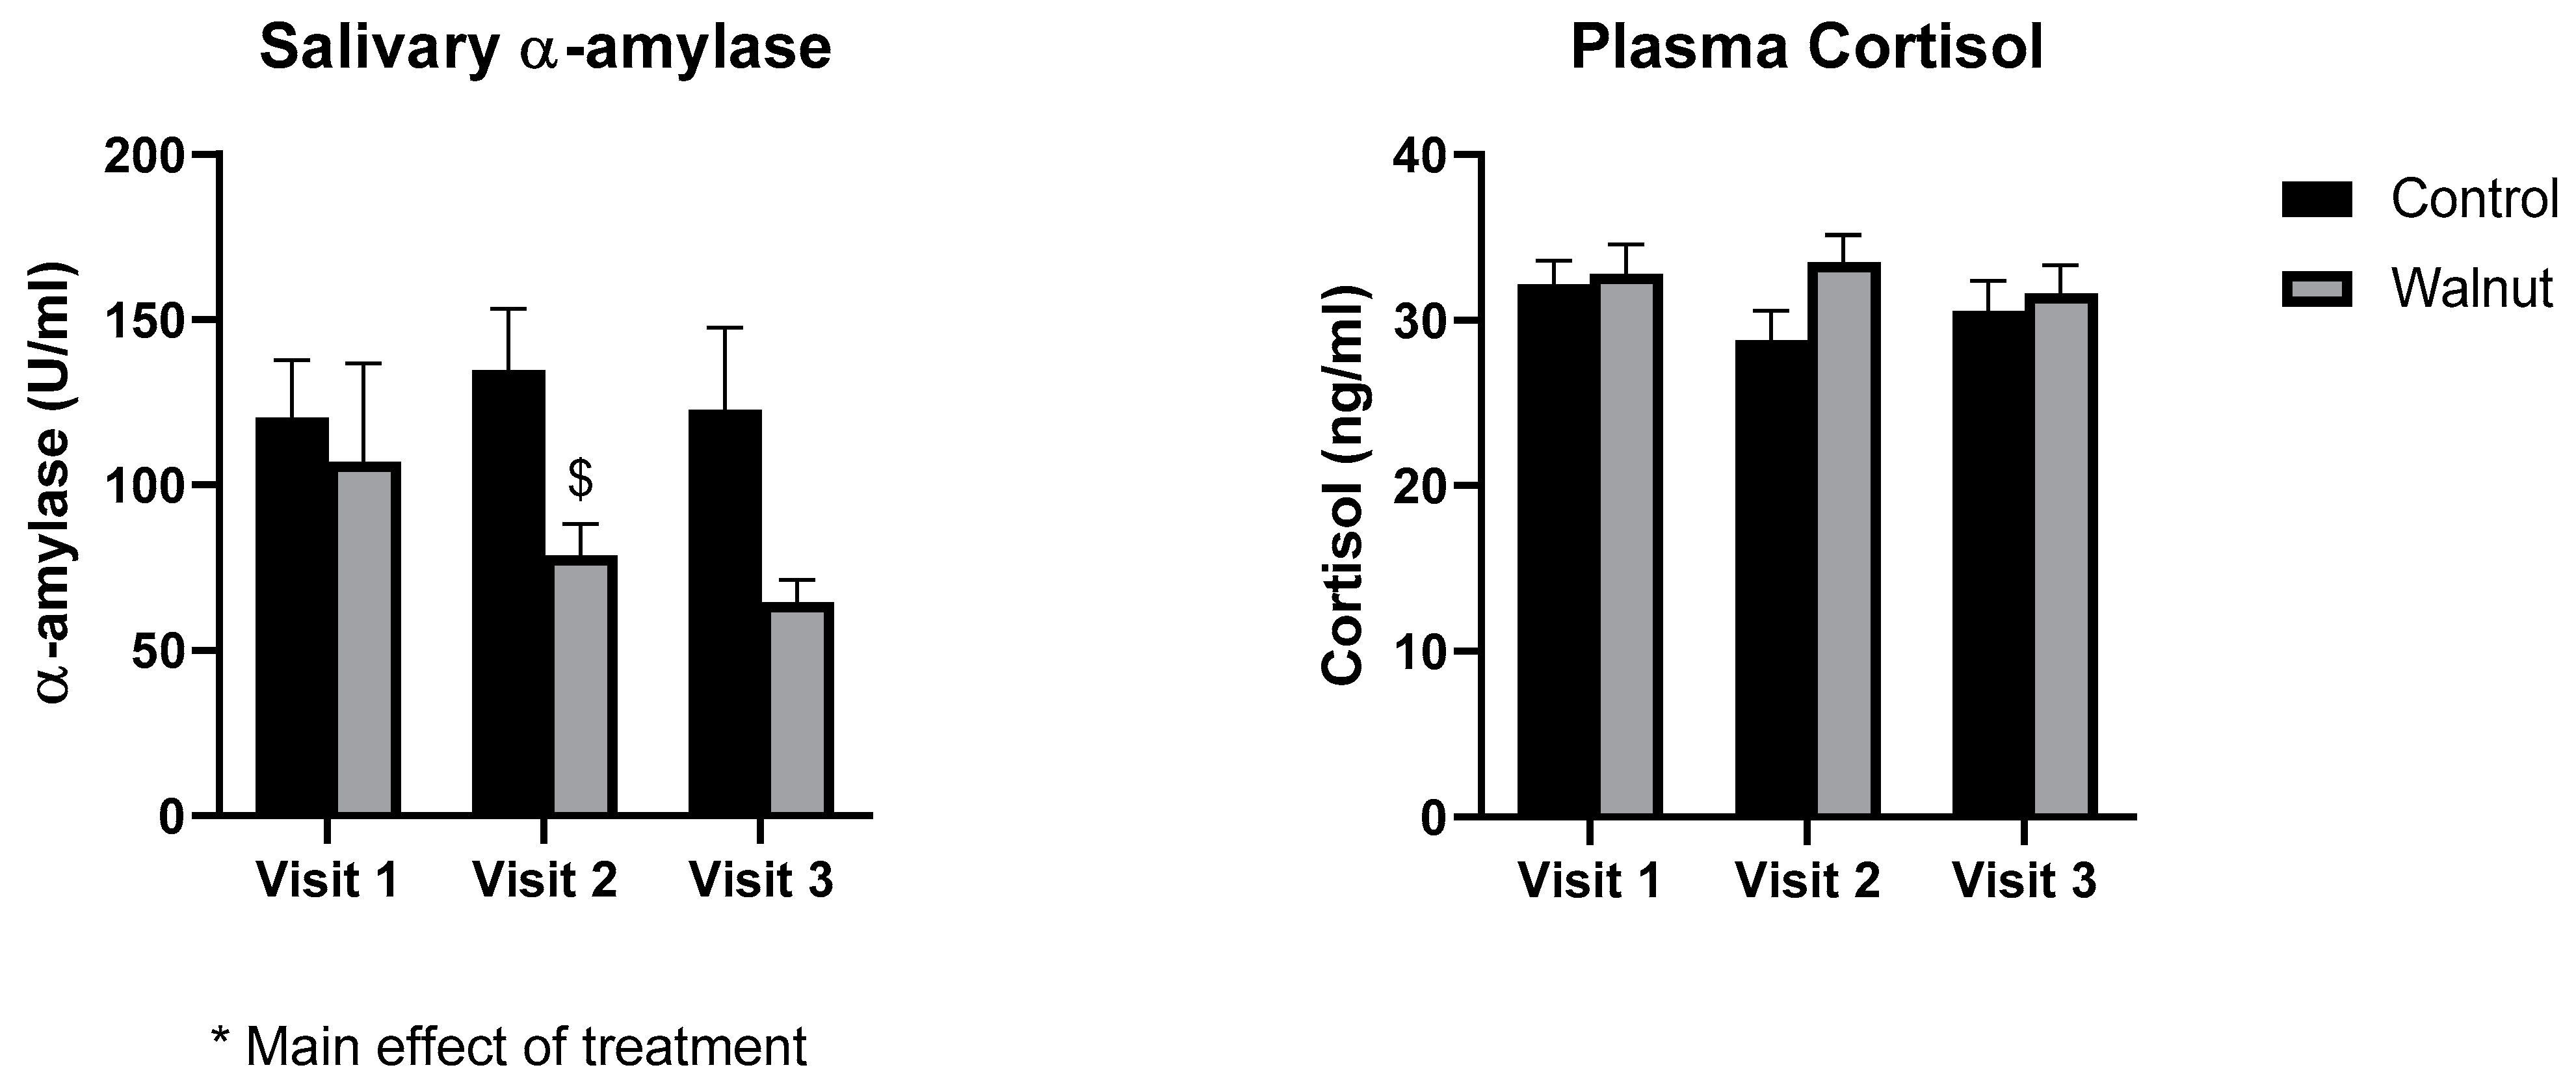
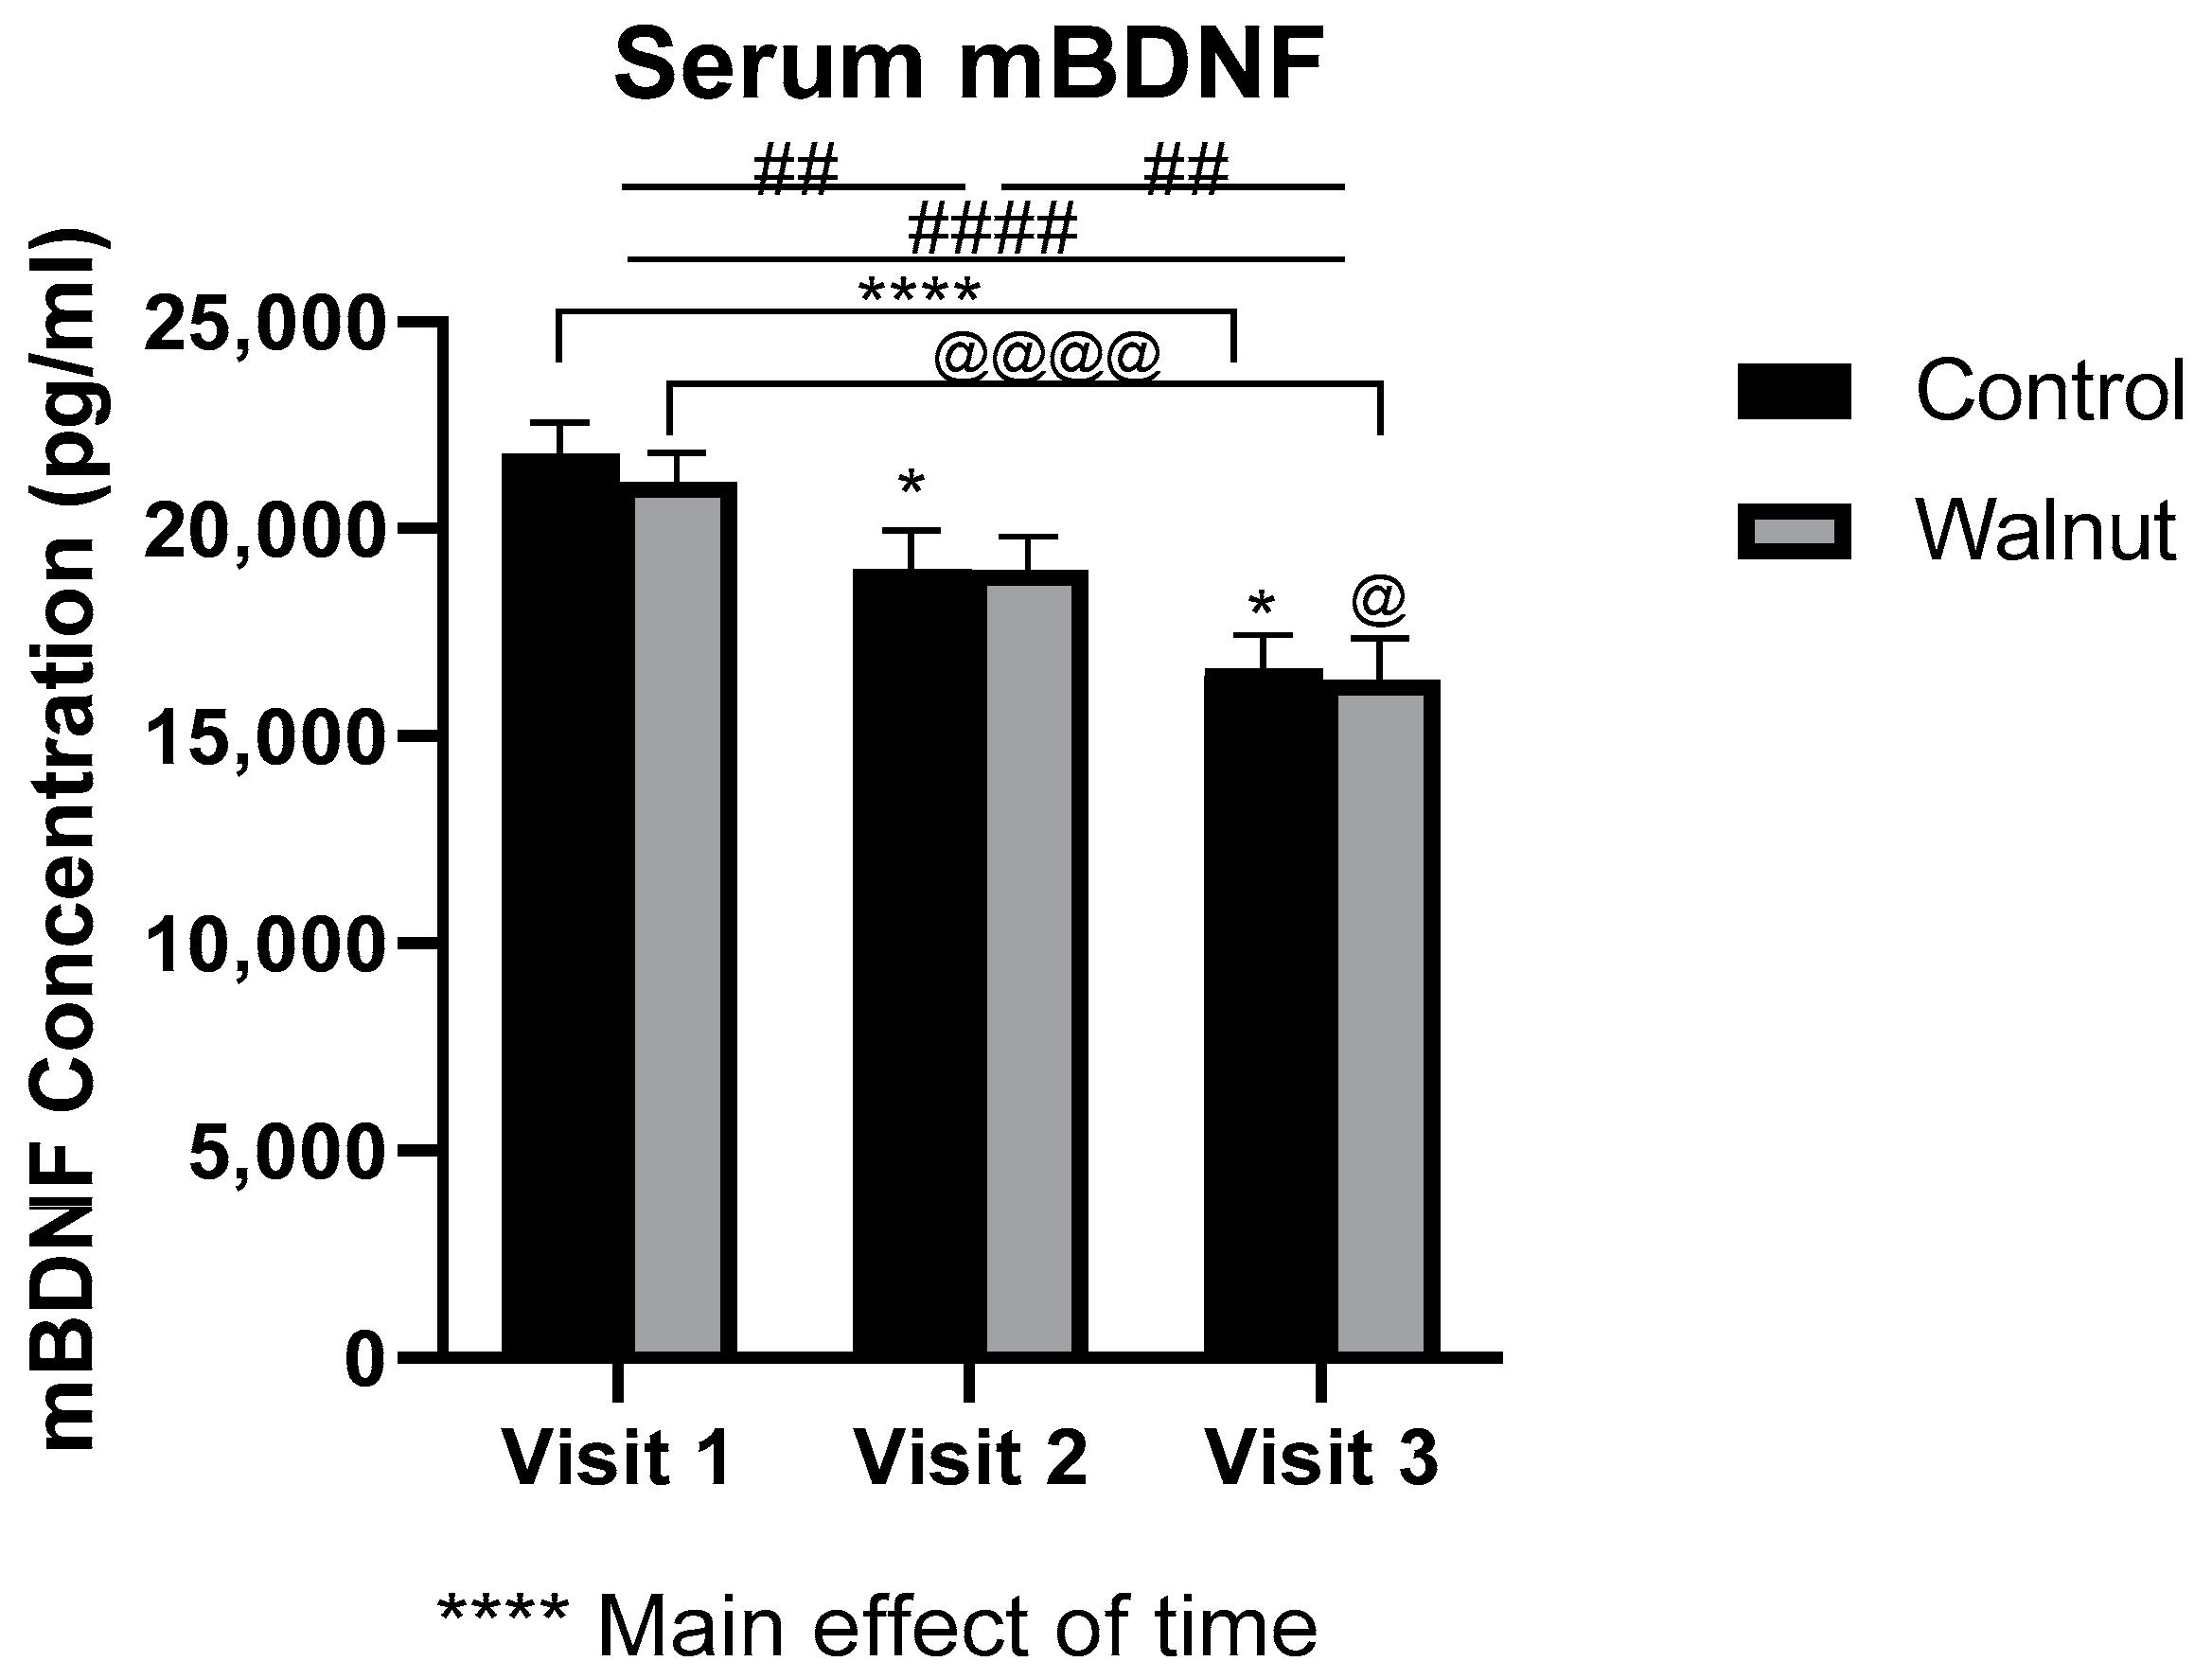
3.3. Biomarkers of General Health
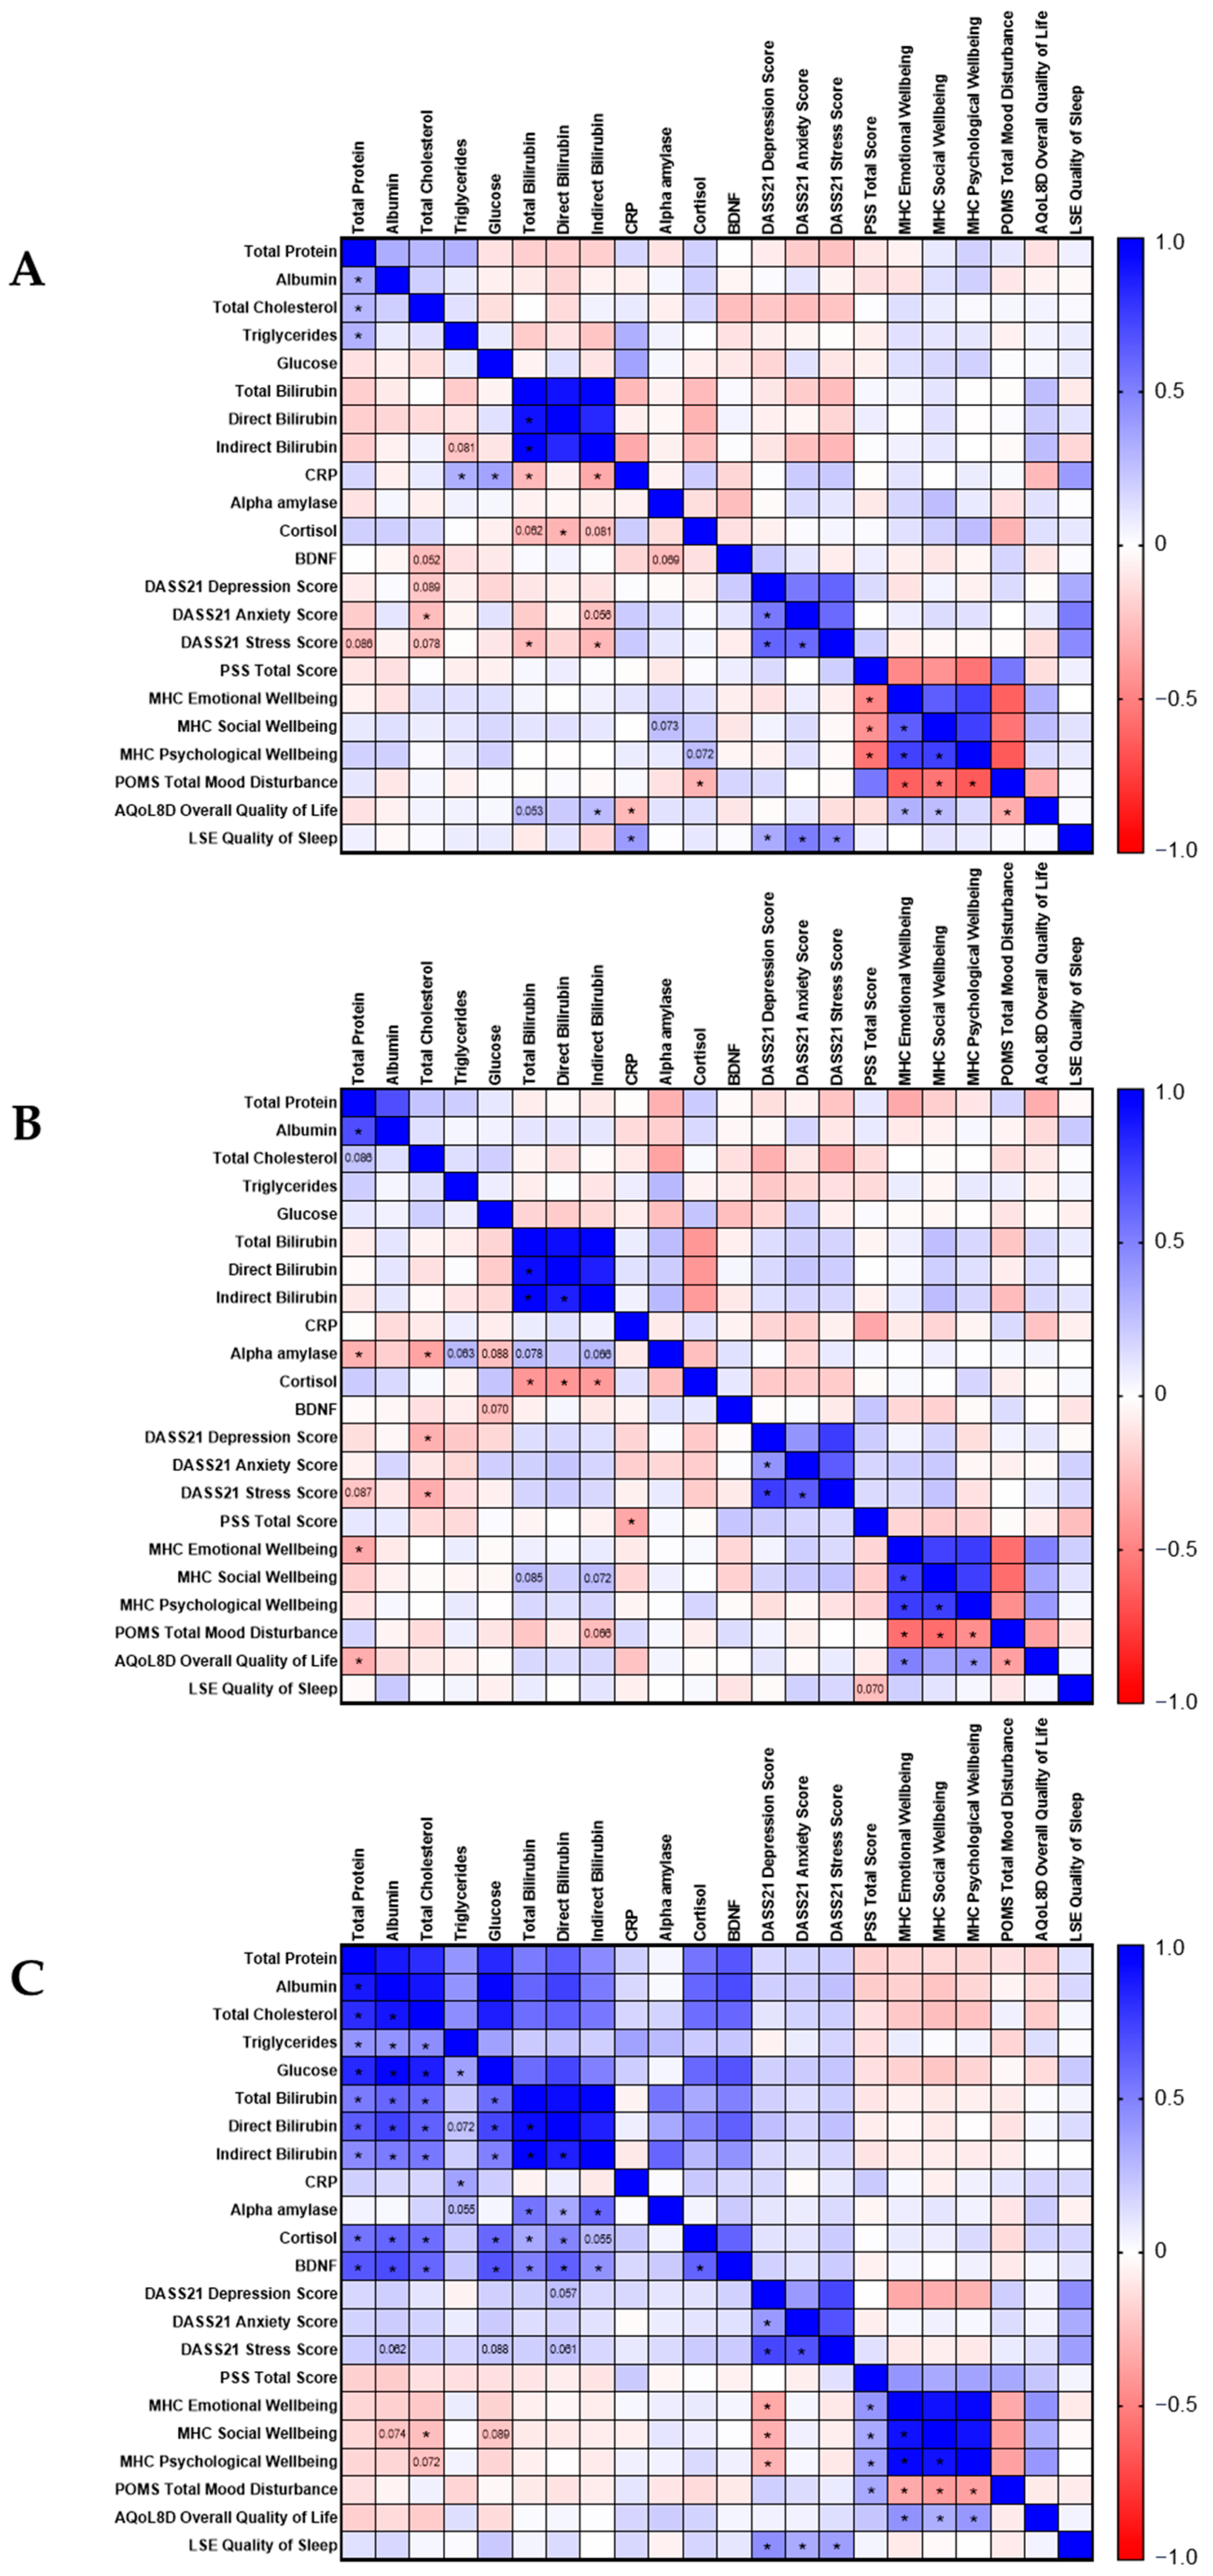
3.4. Correlation Analyses
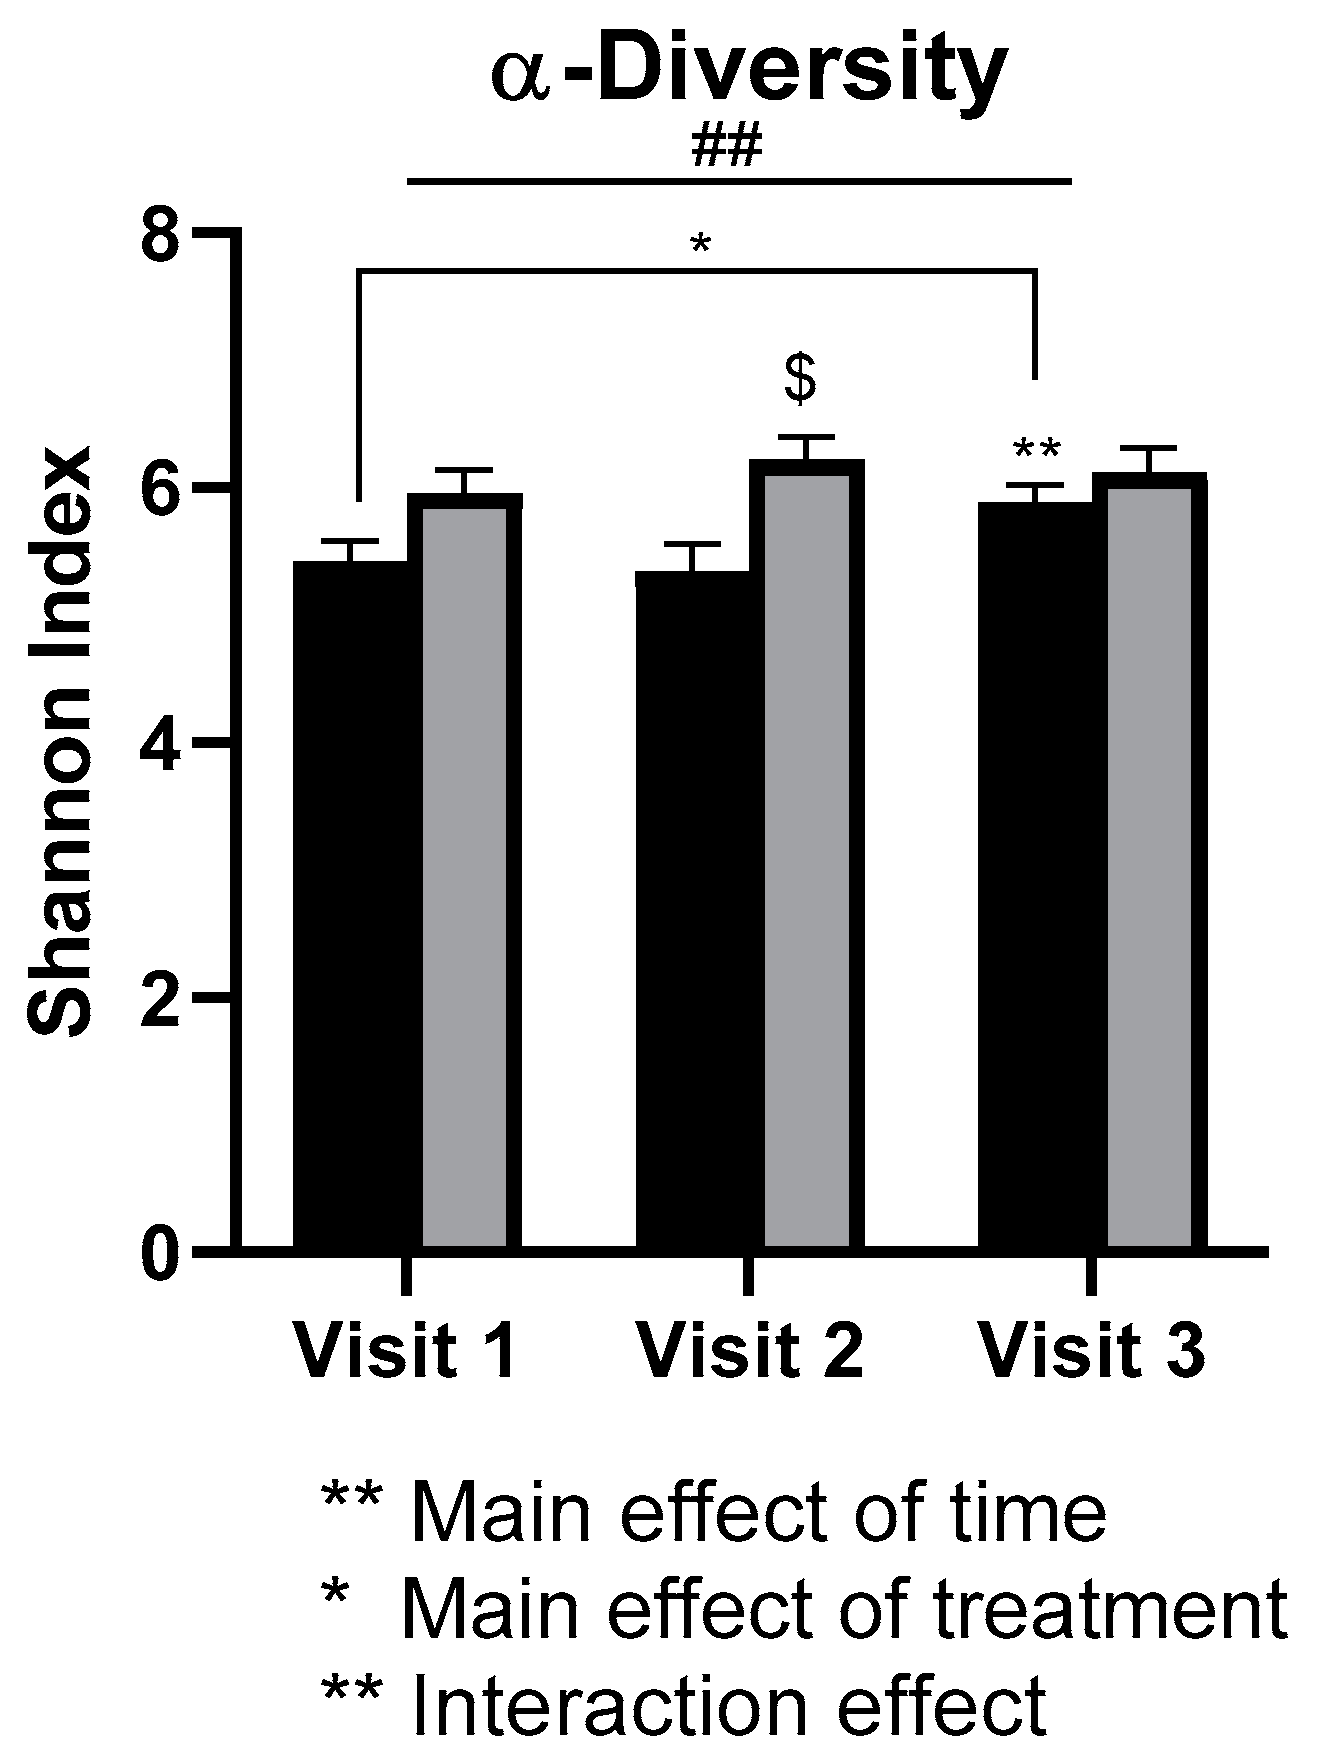
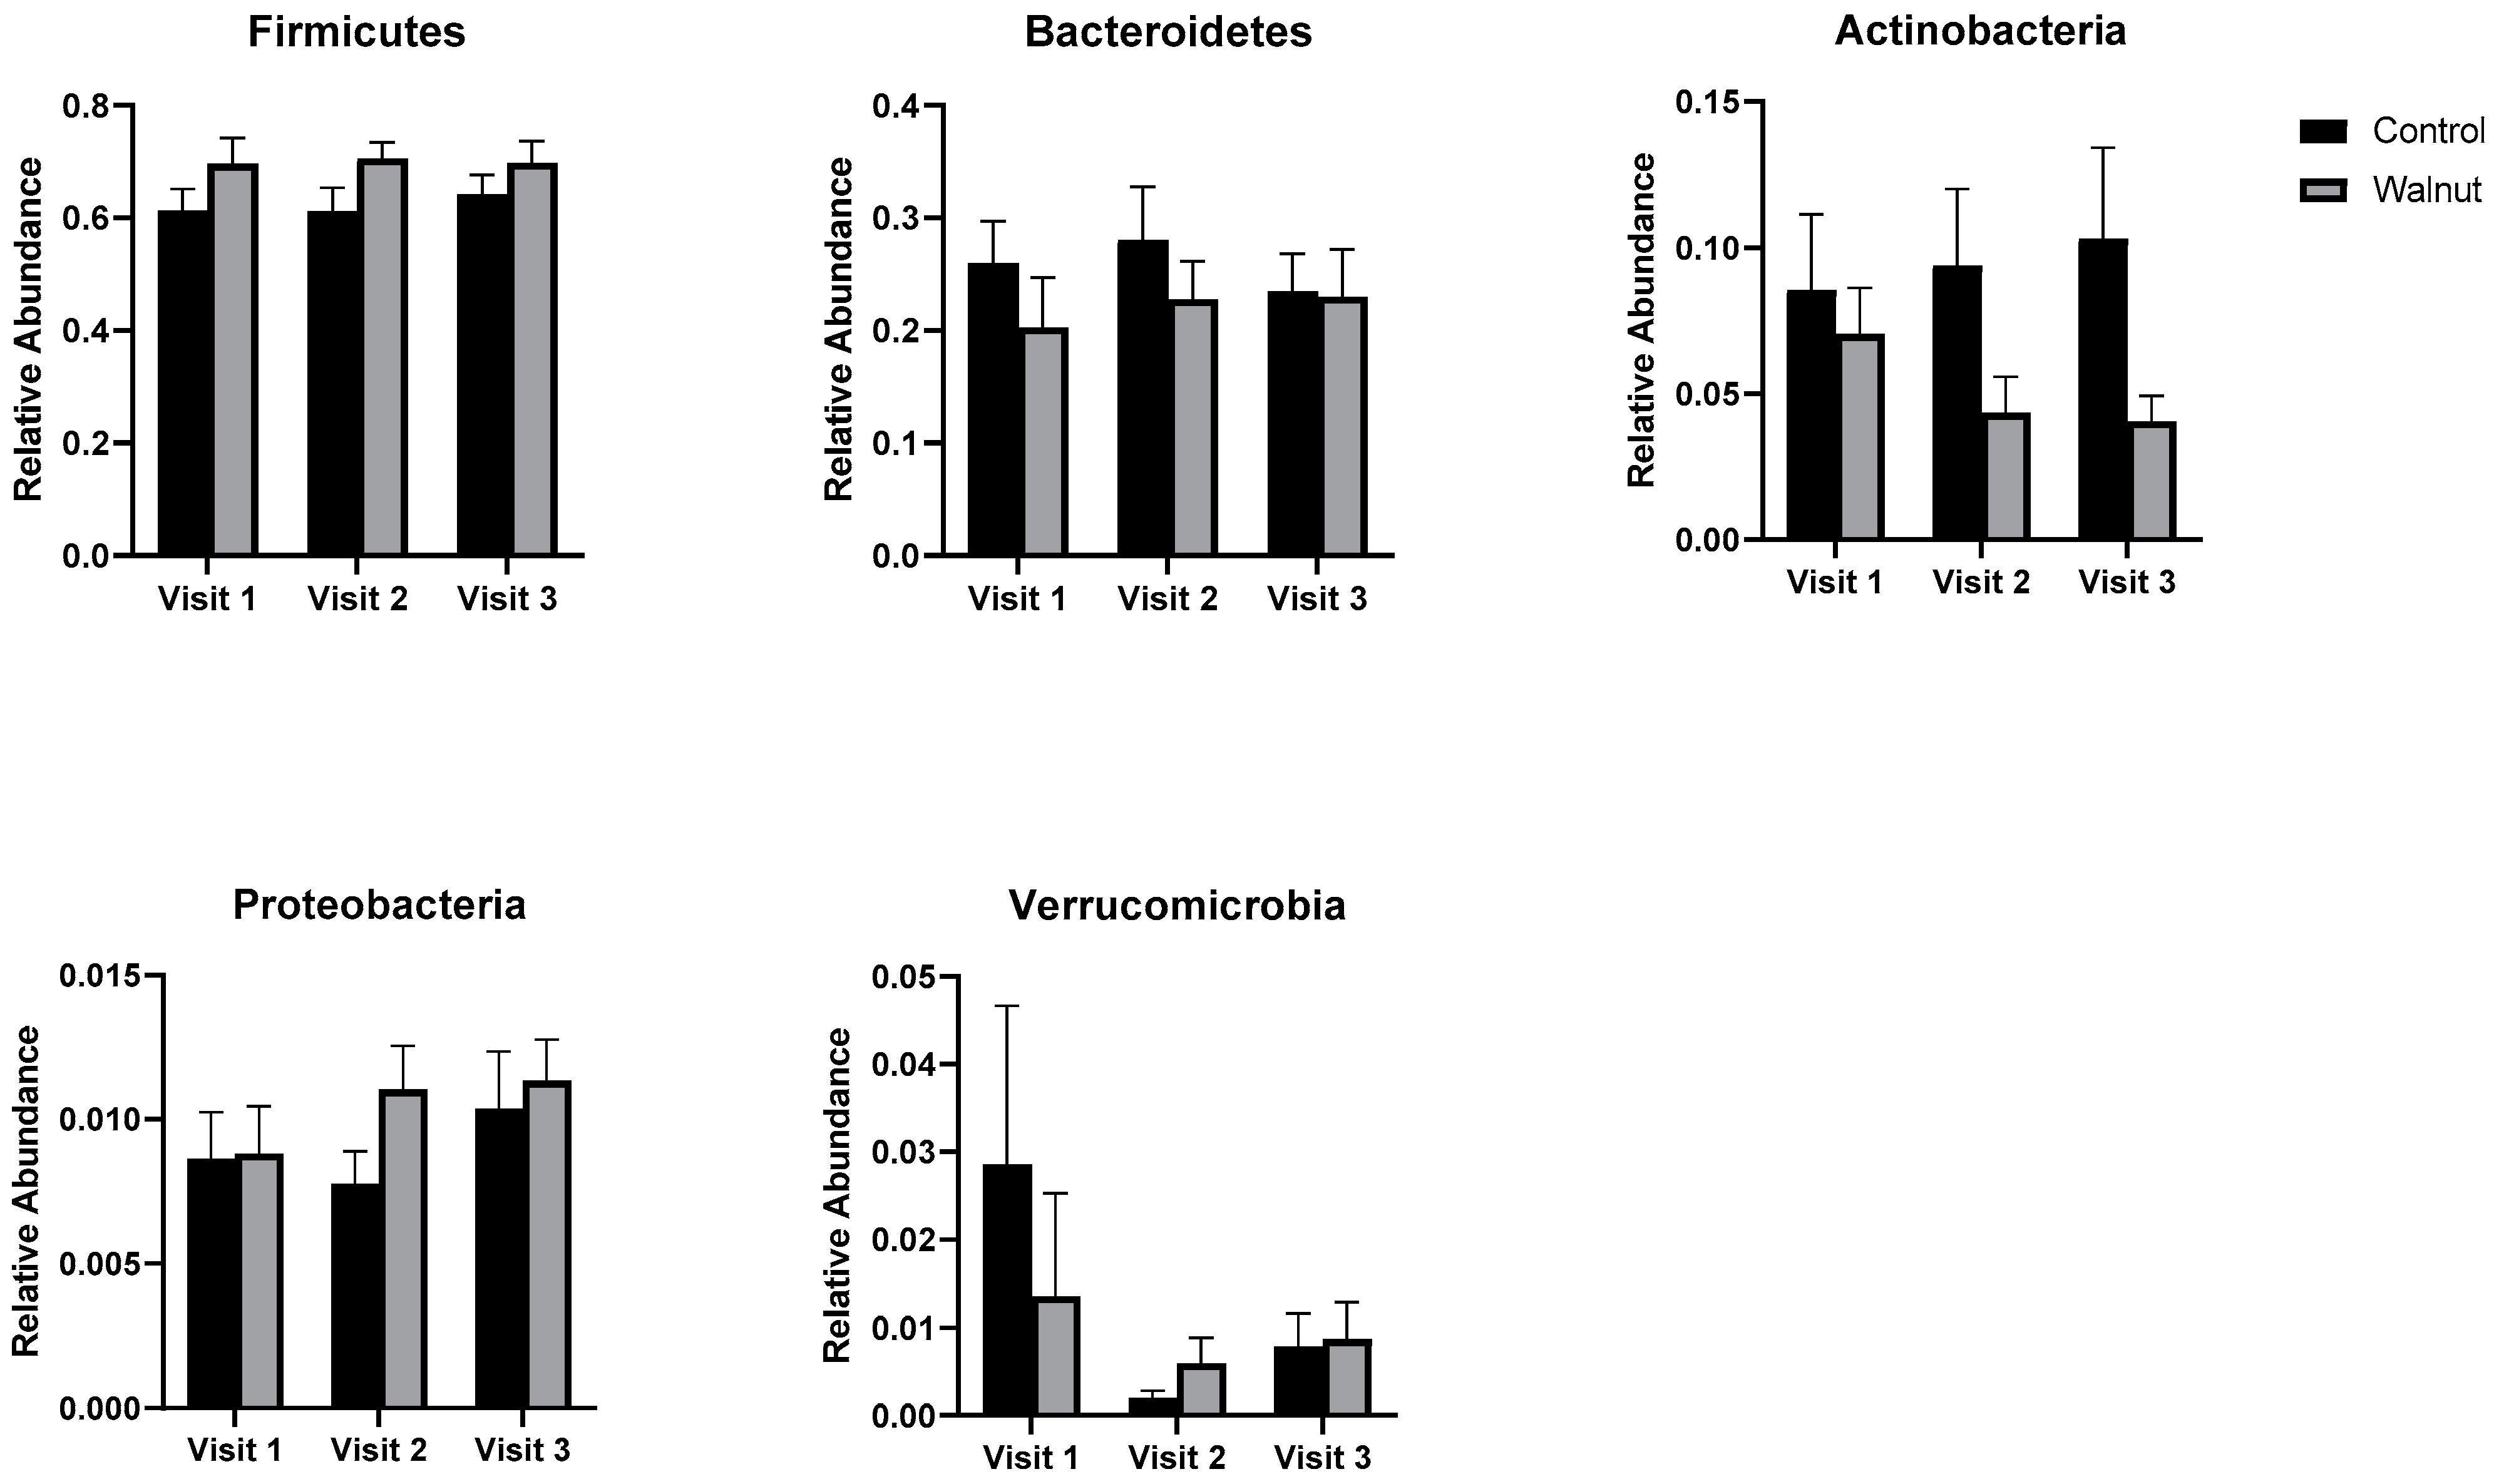
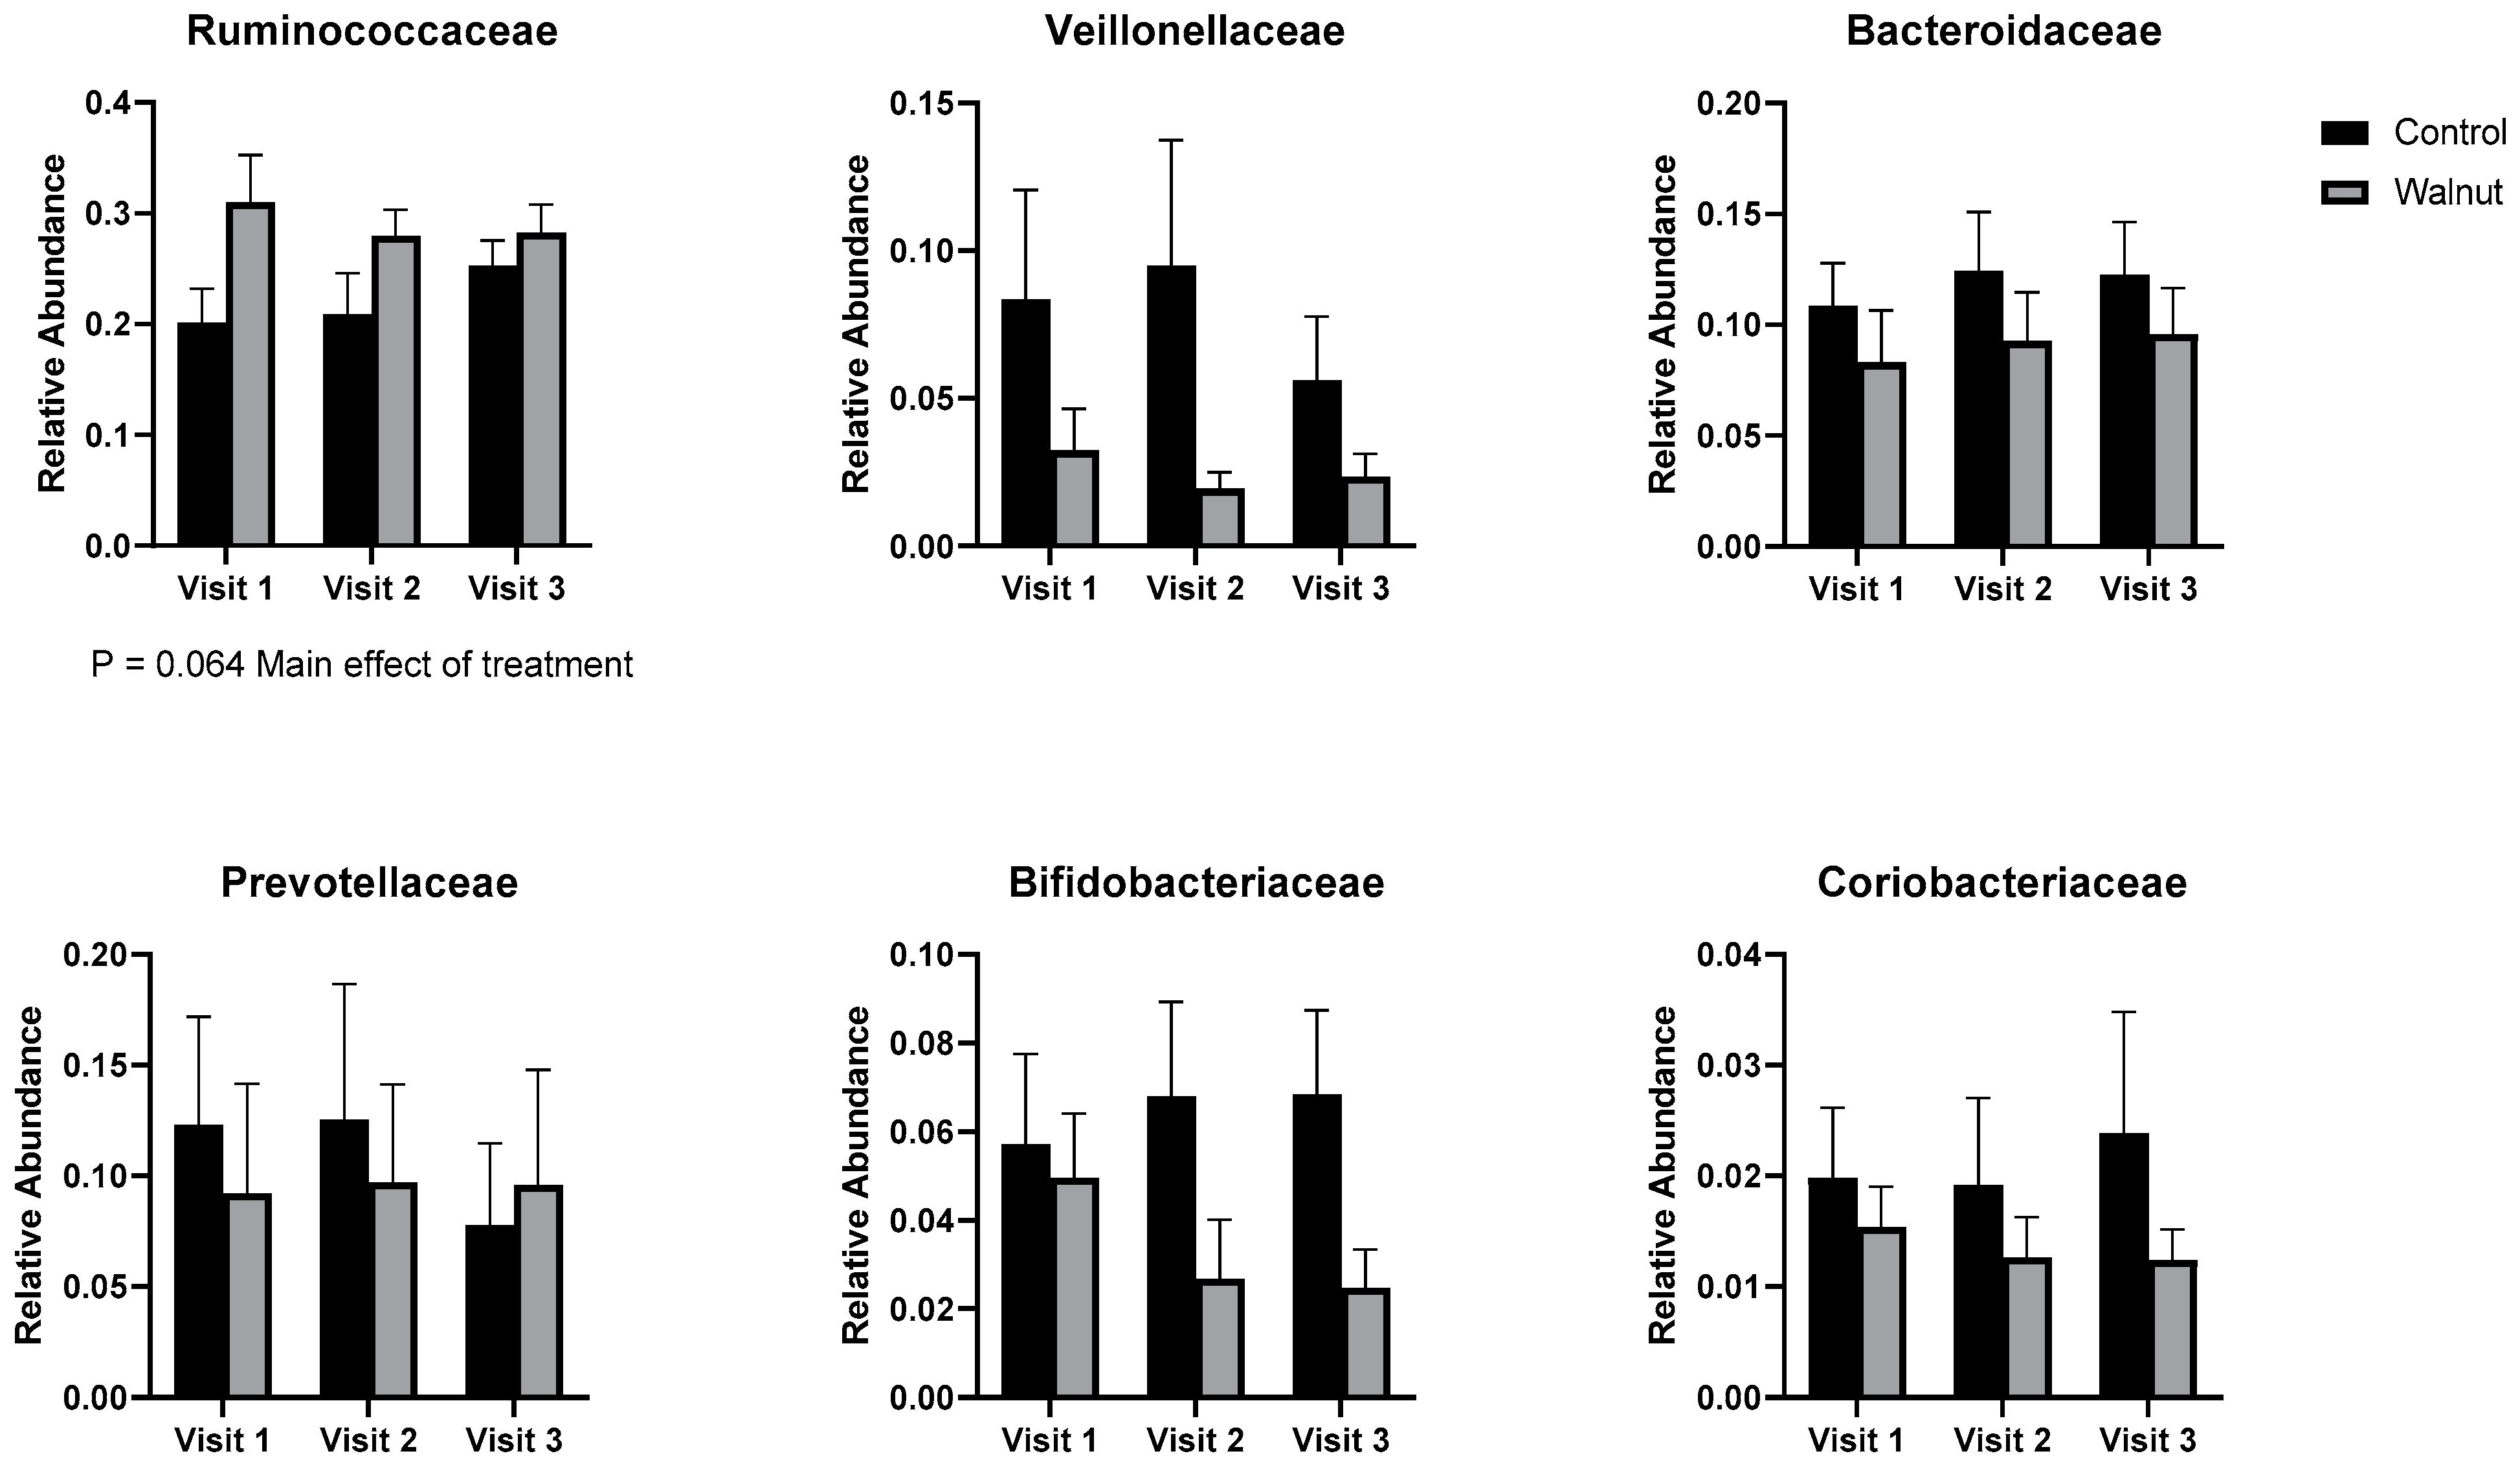
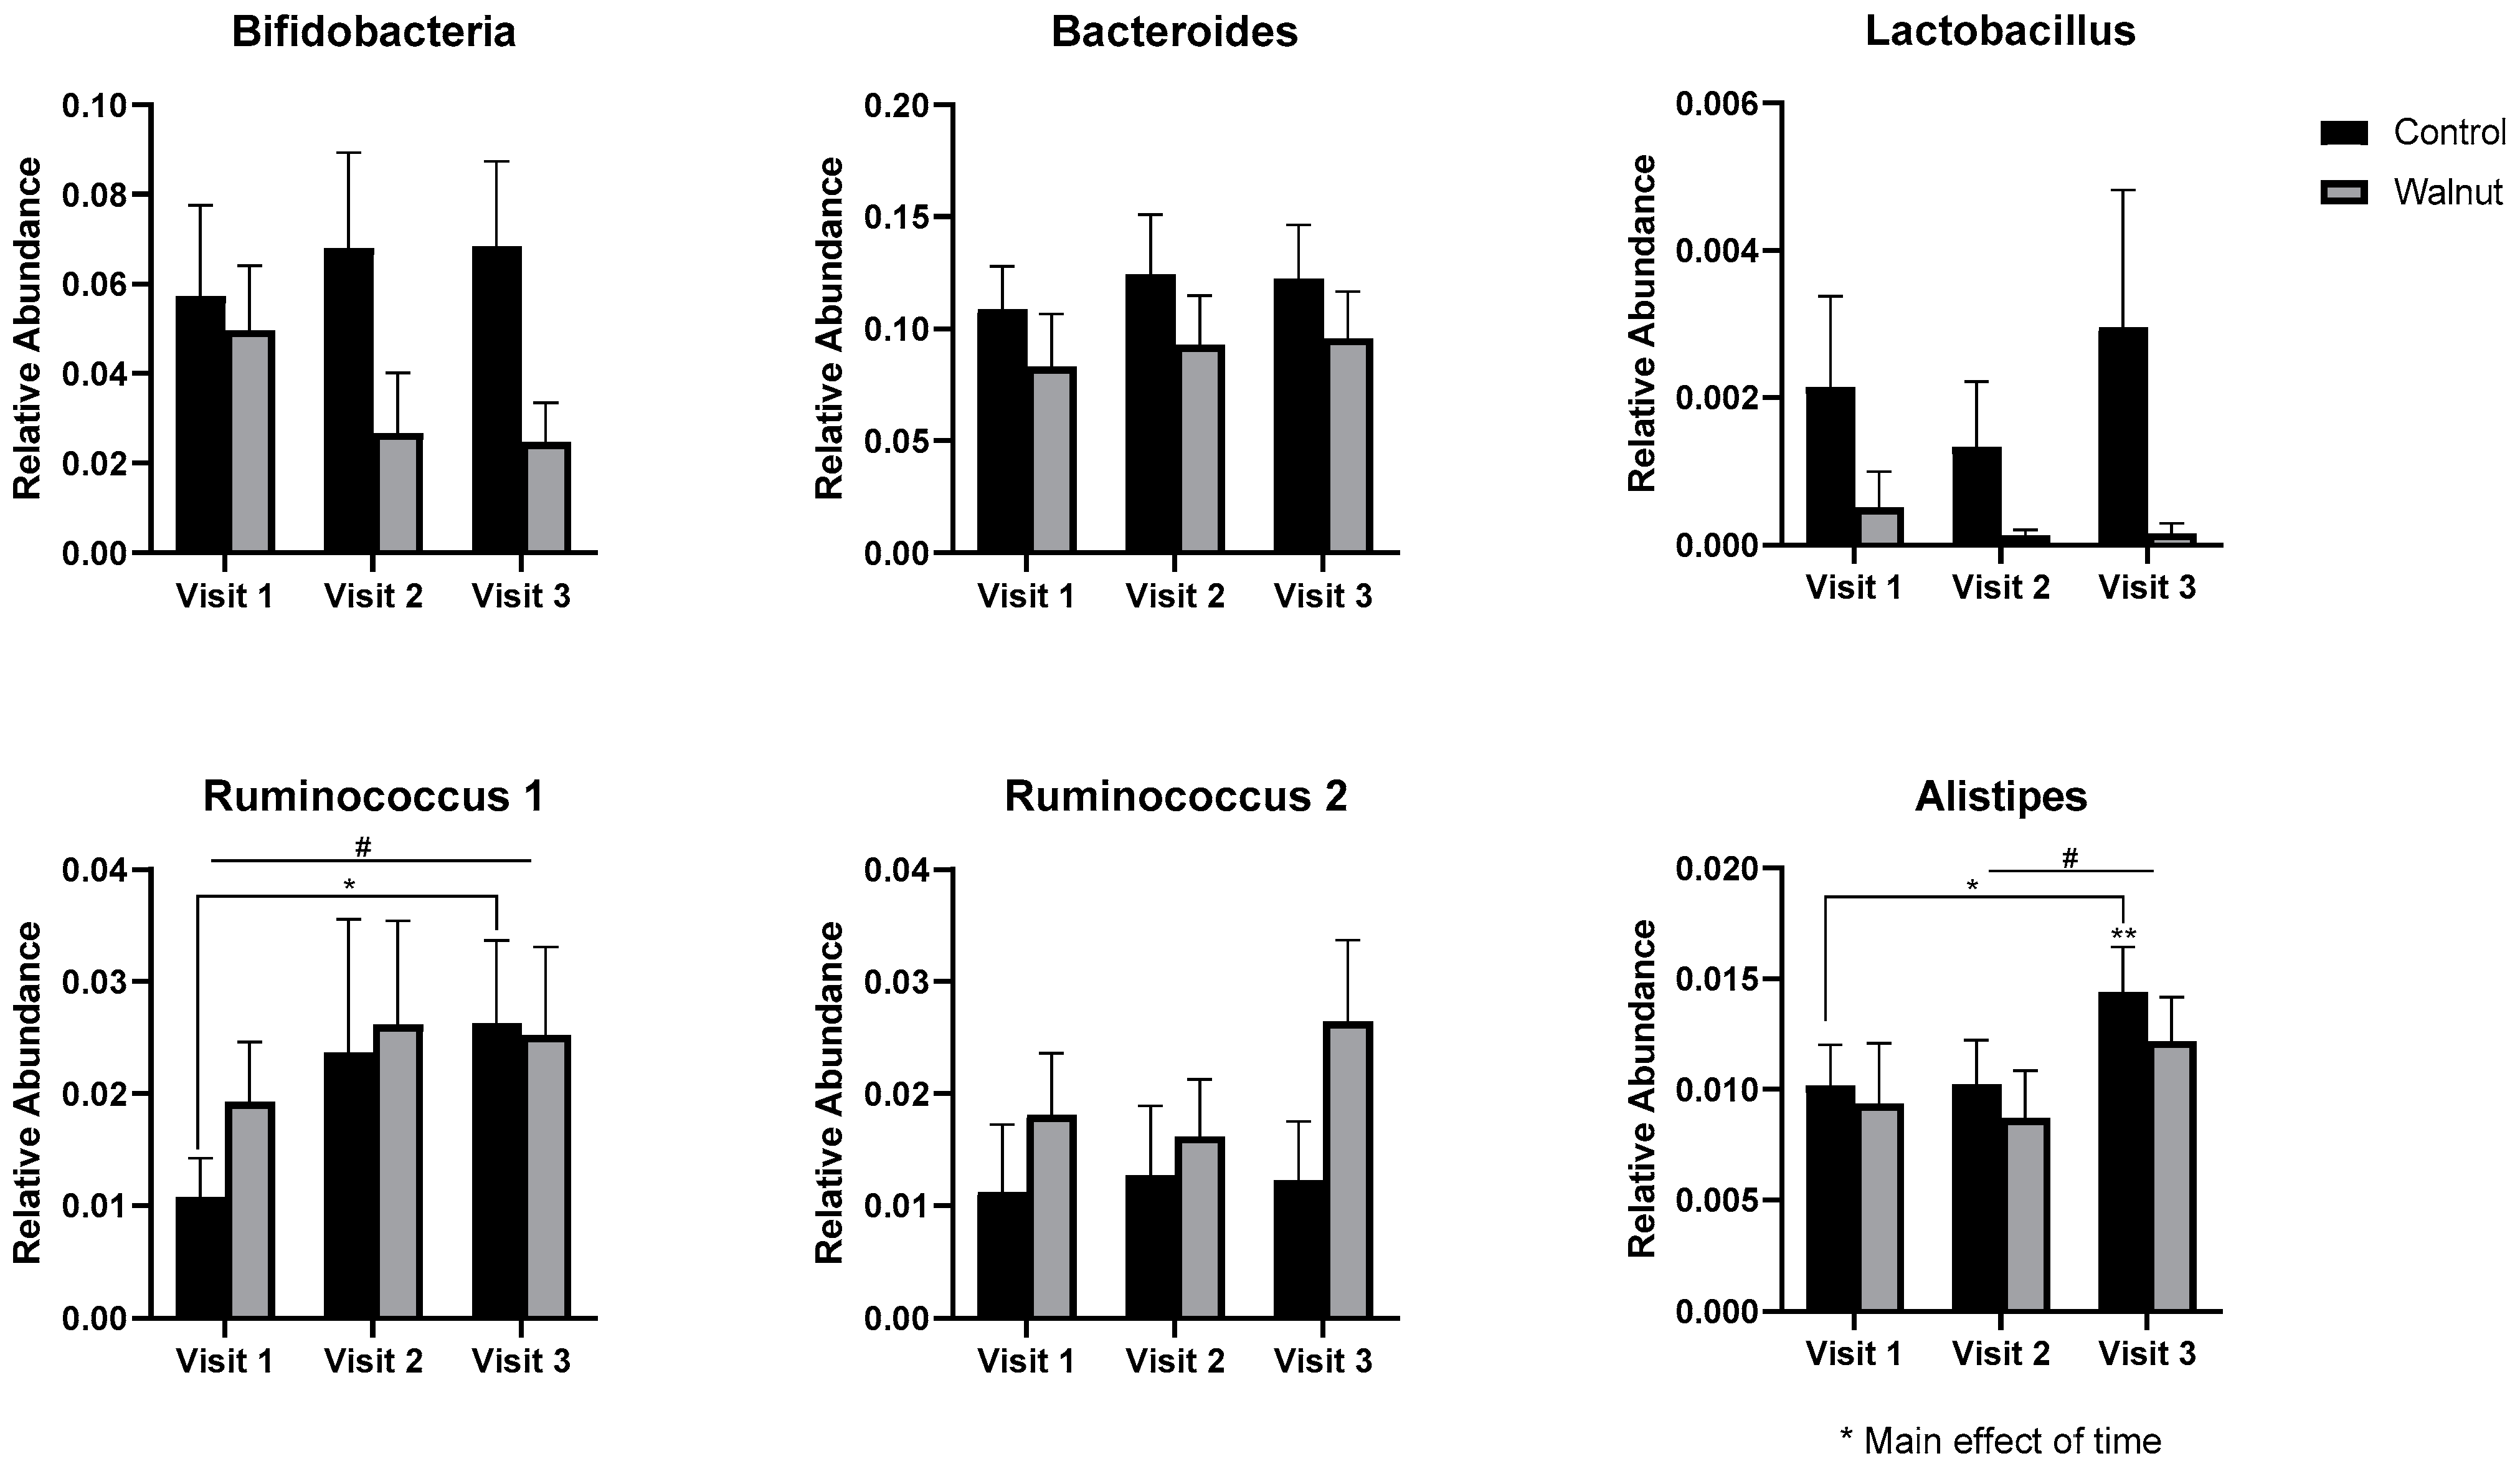
3.5. Gut Microbiota
4. Discussion
4.1. Questionnaires
4.2. Biomarkers of General Health and Well-Being
4.3. Gut Microbiota
4.4. Limitations of the Study
5. Conclusions
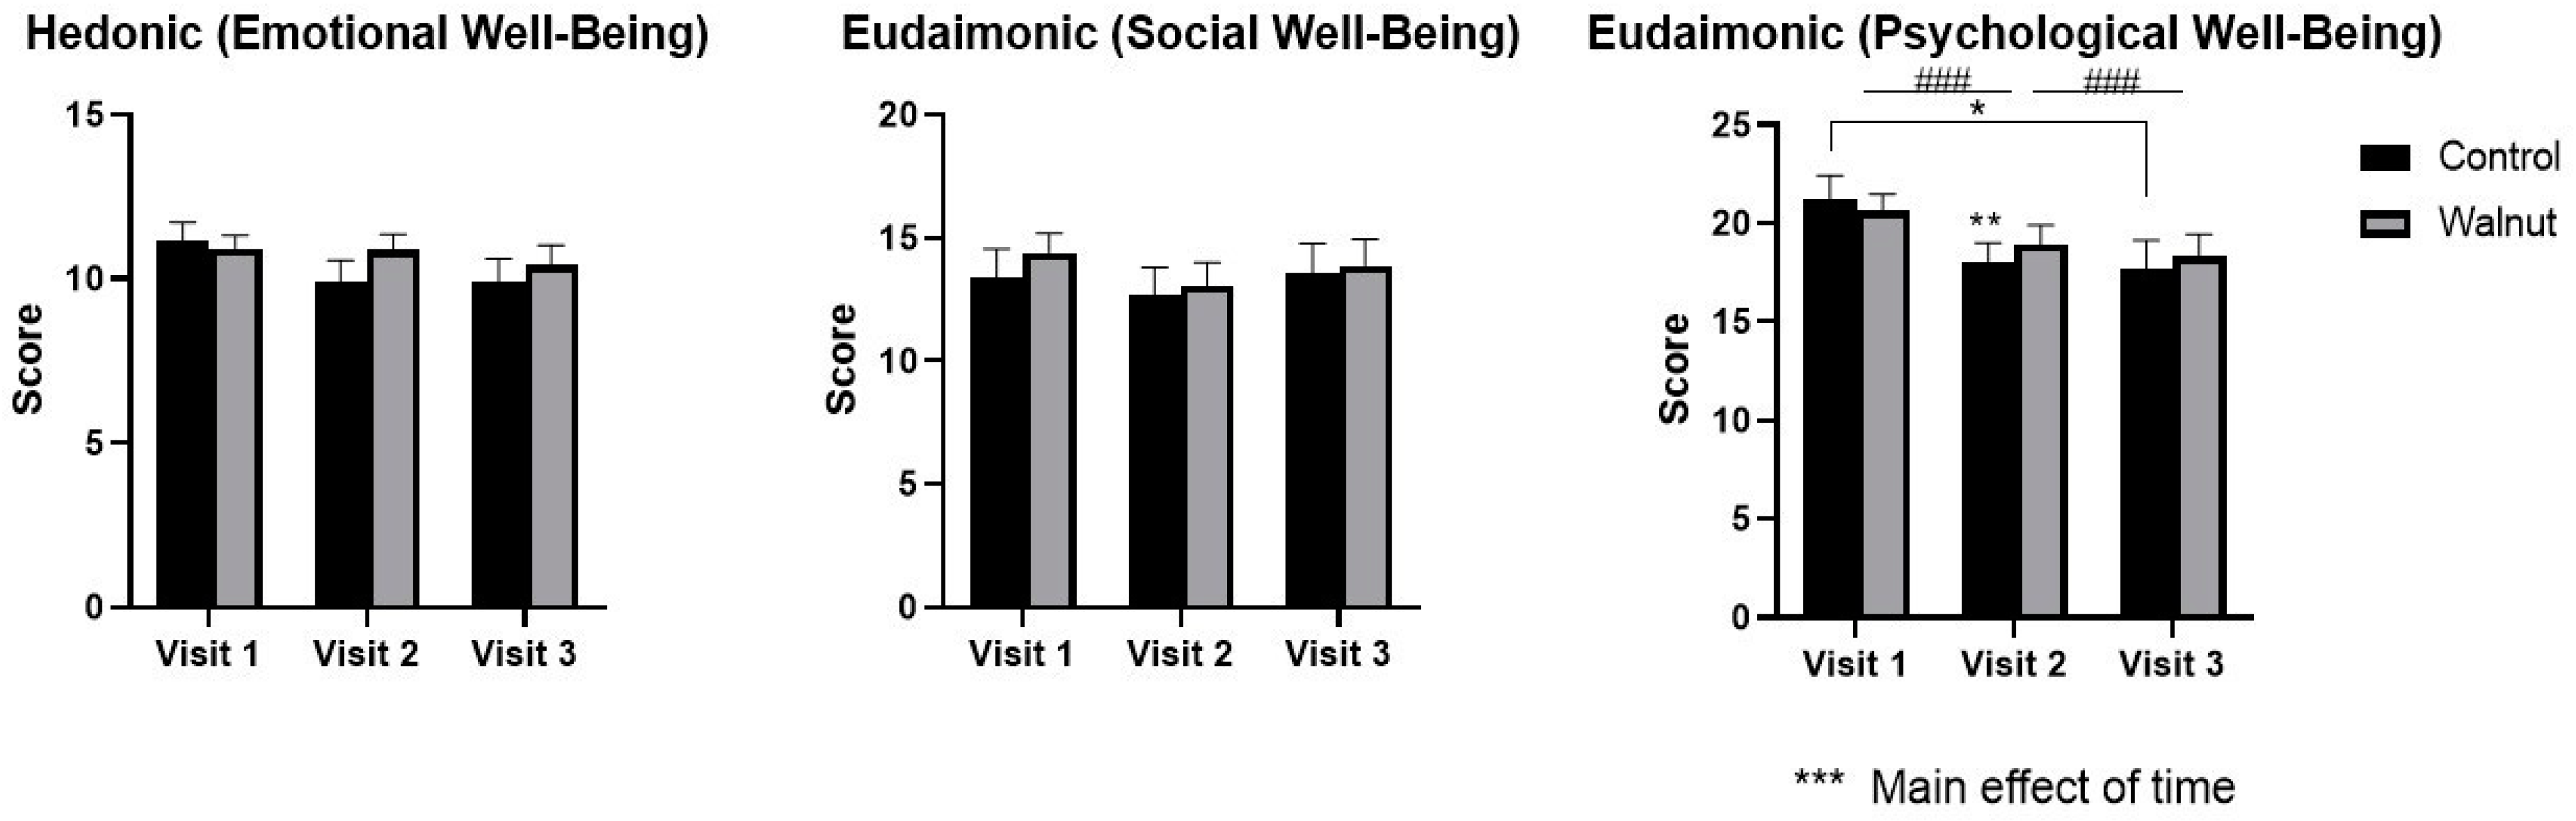
- Academic stress had a negative impact on mental health as evidenced by decreased scores for Mental Health and Psychological Well-being in the AQoL-8D and MHC, respectively.
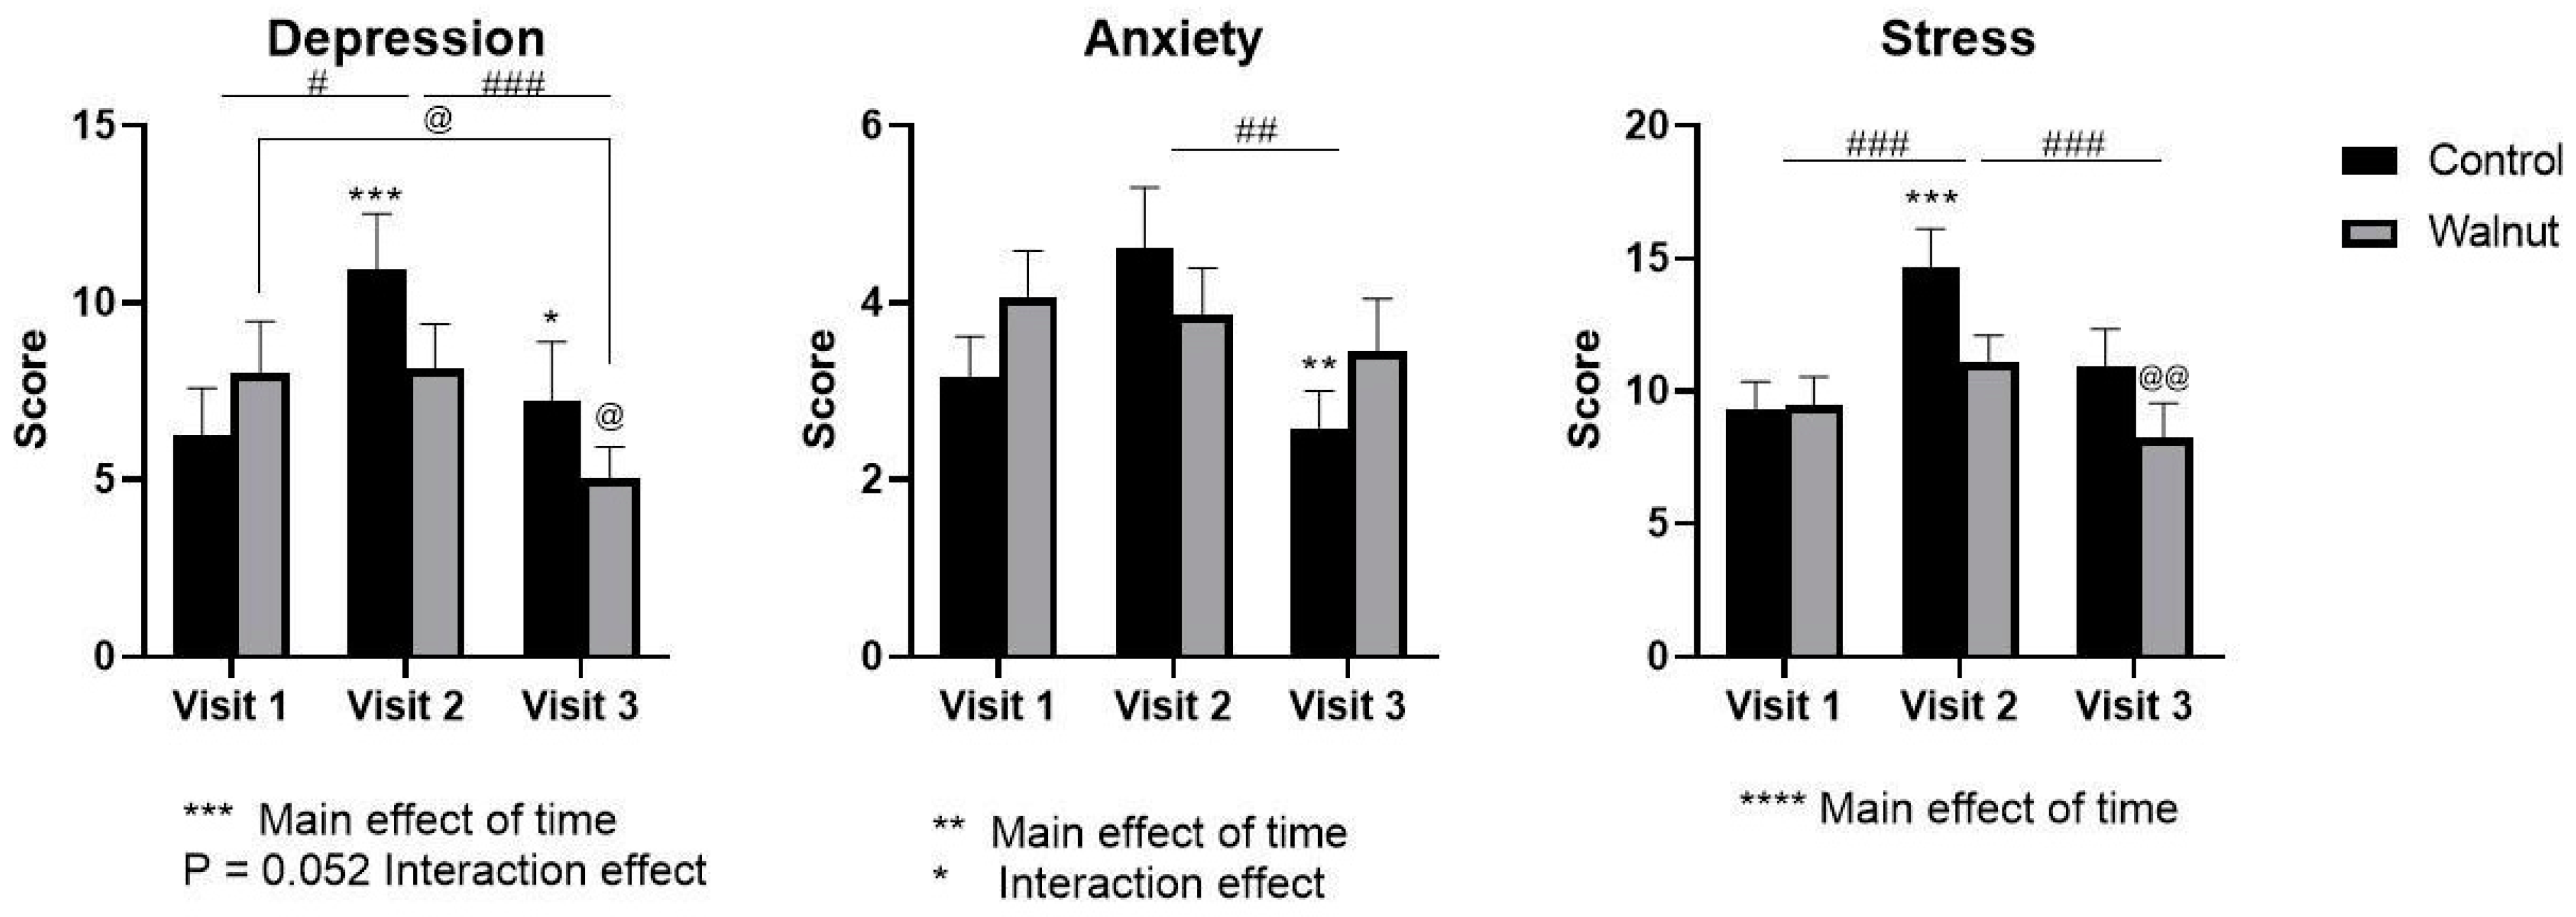
- Academic stress increased self-reported levels of stress and depression (DASS21) during the university examination period.
- Daily consumption of walnuts prevented the significant changes in mental health-related scores (AQoL-8D & MHC) and scores of stress and depression (DASS21), thus walnuts may alleviate the negative effects of academic stress on mental health in university students.
- Academic stress had a negative effect on metabolic biomarkers such as total protein and albumin since these were decreased during the university examination period.
- Daily consumption of walnuts increased total protein and albumin levels, thus may protect against the negative effects of academic stress on metabolic biomarkers.
- While academic stress did not change stress biomarkers such as cortisol and α-amylase, daily walnut consumption decreased α-amylase levels, further suggesting that walnuts may protect against the effects of stress.
- Academic stress was associated with lower gut microbial diversity in females.
- Daily walnut consumption may alleviate the negative effects of academic stress on the diversity of the gut microbiota in females.
- Walnut consumption may improve sleep in the longer term.
Supplementary Materials
Author Contributions
Funding
Institutional Review Board Statement
Informed Consent Statement
Data Availability Statement
Acknowledgments
Conflicts of Interest
References
- Venkataraman, R.; Madempudi, R.S.; Neelamraju, J.; Ahire, J.J.; Vinay, H.R.; Lal, A.; Thomas, G.; Stephen, S. Effect of Multi-strain Probiotic Formulation on Students Facing Examination Stress: A Double-Blind, Placebo-Controlled Study. Probiotics Antimicrob. Proteins 2021, 13, 12–18. [Google Scholar] [CrossRef] [PubMed]
- da Silva, M.P.F.N.; da Silva Cardoso, G.M.; Priolo Filho, S.R.; Weber, S.A.T.; de Castro Corrêa, C. Technologies and Mental Health in University Students: An Unhealthy Combination. Int. Arch. Otorhinolaryngol. 2022. [Google Scholar] [CrossRef]
- Dessauvagie, A.S.; Dang, H.M.; Nguyen, T.A.T.; Groen, G. Mental Health of University Students in Southeastern Asia: A Systematic Review. Asia-Pac. J. Public Health 2022, 34, 172–181. [Google Scholar] [CrossRef] [PubMed]
- Ruiz-Hernández, J.A.; Guillén, Á.; Pina, D.; Puente-López, E. Mental Health and Healthy Habits in University Students: A Comparative Associative Study. Eur. J. Investig. Health Psychol. Educ. 2022, 12, 114–126. [Google Scholar] [CrossRef] [PubMed]
- WHO. Cross-national comparisons of the prevalences and correlates of mental disorders. WHO International Consortium in Psychiatric Epidemiology. Bull. World Health Organ. 2000, 78, 413–426. [Google Scholar]
- Bauduin, S.; Van Noorden, M.; Van der Werff, S.; Van Hemert, B.; Van der Wee, N.; Giltay, E.P. 3.014—Diurnal salivary alpha-amylase and not cortisol differentiates major depressive disorder in out-patients. Eur. Neuropsychopharmacol. 2018, 28, S71–S72. [Google Scholar] [CrossRef]
- Dean, J.; Keshavan, M. The neurobiology of depression: An integrated view. Asian J. Psychiatry 2017, 27, 101–111. [Google Scholar] [CrossRef]
- Ferrari, F.; Villa, R. The neurobiology of depression: An integrated overview from biological theories to clinical evidence. Mol. Neurobiol. 2017, 54, 4847–4865. [Google Scholar] [CrossRef]
- Baik, J.-H. Stress and the dopaminergic reward system. Exp. Mol. Med. 2020, 52, 1879–1890. [Google Scholar] [CrossRef]
- Ditzen, B.; Ehlert, U.; Nater, U.M. Associations between salivary alpha-amylase and catecholamines—A multilevel modeling approach. Biol. Psychol. 2014, 103, 15–18. [Google Scholar] [CrossRef] [PubMed]
- Madison, A.; Kiecolt-Glaser, J.K. Stress, depression, diet, and the gut microbiota: Human–bacteria interactions at the core of psychoneuroimmunology and nutrition. Curr. Opin. Behav. Sci. 2019, 28, 105–110. [Google Scholar] [CrossRef] [PubMed]
- Kris-Etherton, P.M.; Petersen, K.S.; Hibbeln, J.R.; Hurley, D.; Kolick, V.; Peoples, S.; Rodriguez, N.; Woodward-Lopez, G. Nutrition and behavioral health disorders: Depression and anxiety. Nutr. Rev. 2020, 79, 247–260. [Google Scholar] [CrossRef] [PubMed]
- Fernández-Rodríguez, R.; Jiménez-López, E.; Garrido-Miguel, M.; Martínez-Ortega, I.A.; Martínez-Vizcaíno, V.; Mesas, A.E. Does the evidence support a relationship between higher levels of nut consumption, lower risk of depression, and better mood state in the general population? A systematic review. Nutr. Rev. 2022, 80, 2076–2088. [Google Scholar] [CrossRef] [PubMed]
- Herselman, M.F.; Bailey, S.; Bobrovskaya, L. The Effects of Stress and Diet on the “Brain–Gut” and “Gut–Brain” Pathways in Animal Models of Stress and Depression. Int. J. Mol. Sci. 2022, 23, 2013. [Google Scholar] [CrossRef]
- Arab, L.; Guo, R.; Elashoff, D. Lower Depression Scores among Walnut Consumers in NHANES. Nutrients 2019, 11, 275. [Google Scholar] [CrossRef] [PubMed]
- Julvez, J.; Gignac, F.; Fernández-Barrés, S.; Romaguera, D.; Sala-Vila, A.; Ranzani, O.T.; Persavento, C.; Delgado, A.; Carol, A.; Torrent, J.; et al. Walnuts, Long-Chain Polyunsaturated Fatty Acids, and Adolescent Brain Development: Protocol for the Walnuts Smart Snack Dietary Intervention Trial. Front. Pediatr. 2021, 9, 425. [Google Scholar] [CrossRef]
- Pribis, P. Effects of Walnut Consumption on Mood in Young Adults—A Randomized Controlled Trial. Nutrients 2016, 8, 668. [Google Scholar] [CrossRef] [PubMed]
- Pribis, P.; Bailey, R.N.; Russell, A.A.; Kilsby, M.A.; Hernandez, M.; Craig, W.J.; Grajales, T.; Shavlik, D.J.; Sabatè, J. Effects of walnut consumption on cognitive performance in young adults. Br. J. Nutr. 2012, 107, 1393–1401. [Google Scholar] [CrossRef]
- Fitzgerald, E.; Lambert, K.; Stanford, J.; Neale, E.P. The effect of nut consumption (tree nuts and peanuts) on the gut microbiota of humans: A systematic review. Br. J. Nutr. 2021, 125, 508–520. [Google Scholar] [CrossRef] [PubMed]
- Robbins, W.A.; Xun, L.; FitzGerald, L.Z.; Esguerra, S.; Henning, S.M.; Carpenter, C.L. Walnuts Improve Semen Quality in Men Consuming a Western-Style Diet: Randomized Control Dietary Intervention Trial1. Biol. Reprod. 2012, 87, 101–108. [Google Scholar] [CrossRef]
- Wu, H.; Pan, A.; Yu, Z.; Qi, Q.; Lu, L.; Zhang, G.; Yu, D.; Zong, G.; Zhou, Y.; Chen, X.; et al. Lifestyle counseling and supplementation with flaxseed or walnuts influence the management of metabolic syndrome. J. Nutr. 2010, 140, 1937–1942. [Google Scholar] [CrossRef] [PubMed]
- National Health and Medical Research Council. Australian Dietary Guidelines; National Health and Medical Research Council: Canberra, Australia, 2013.
- Draper, J.T.; Deo, P.; Weinstein, P.; Simpson, B.S. Not-so-forbidden fruit: The potential conservation role of toxic Pimelea microcephala subsp. microcephala fruits for native arid zone birds. Emu-Austral Ornithol. 2022, 122, 131–143. [Google Scholar] [CrossRef]
- Lim, Y.; Zhong, J.H.; Zhou, X.F. Development of mature BDNF-specific sandwich ELISA. J. Neurochem. 2015, 134, 75–85. [Google Scholar] [CrossRef]
- Bolyen, E.; Rideout, J.R.; Dillon, M.R.; Bokulich, N.A.; Abnet, C.C.; Al-Ghalith, G.A.; Alexander, H.; Alm, E.J.; Arumugam, M.; Asnicar, F.; et al. Author Correction: Reproducible, interactive, scalable and extensible microbiome data science using QIIME 2. Nat. Biotechnol. 2019, 37, 1091. [Google Scholar] [CrossRef] [PubMed]
- Callahan, B.J.; McMurdie, P.J.; Rosen, M.J.; Han, A.W.; Johnson, A.J.A.; Holmes, S.P. DADA2: High-resolution sample inference from Illumina amplicon data. Nat. Methods 2016, 13, 581–583. [Google Scholar] [CrossRef]
- Quast, C.; Pruesse, E.; Yilmaz, P.; Gerken, J.; Schweer, T.; Yarza, P.; Peplies, J.; Glöckner, F.O. The SILVA ribosomal RNA gene database project: Improved data processing and web-based tools. Nucleic Acids Res. 2013, 41, D590–D596. [Google Scholar] [CrossRef]
- Yilmaz, P.; Parfrey, L.W.; Yarza, P.; Gerken, J.; Pruesse, E.; Quast, C.; Schweer, T.; Peplies, J.; Ludwig, W.; Glöckner, F.O. The SILVA and “All-species Living Tree Project (LTP)” taxonomic frameworks. Nucleic Acids Res. 2014, 42, D643–D648. [Google Scholar] [CrossRef]
- Lovibond, S.H.; Lovibond, P.F. Manual for the Depression Anxiety Stress Scales, 2nd ed.; Psychology Foundation of, A., Ed.; Psychology Foundation of Australia: Sydney, Australia, 1995. [Google Scholar]
- Cohen, S.; Kamarck, T.; Mermelstein, R. A Global Measure of Perceived Stress. J. Health Soc. Behav. 1983, 24, 385–396. [Google Scholar] [CrossRef]
- Lamers, S.M.; Westerhof, G.J.; Bohlmeijer, E.T.; ten Klooster, P.M.; Keyes, C.L. Evaluating the psychometric properties of the mental health continuum-short form (MHC-SF). J. Clin. Psychol. 2011, 67, 99–110. [Google Scholar] [CrossRef]
- Grove, J.R.; Prapavessis, H. Preliminary evidence for the reliability and validity of an abbreviated profile of mood states. Int. J. Sport Psychol. 1992, 23, 93–109. [Google Scholar]
- Maxwell, A.; Özmen, M.; Iezzi, A.; Richardson, J. Deriving population norms for the AQoL-6D and AQoL-8D multi-attribute utility instruments from web-based data. Qual. Life Res. 2016, 25, 3209–3219. [Google Scholar] [CrossRef]
- Parrott, A.C.; Hindmarch, I. The leeds sleep evaluation questionnaire in psychopharmacological investigations—A review. Psychopharmacol. 1980, 71, 173–179. [Google Scholar] [CrossRef]
- Örücü, M.Ç.; Demir, A. Psychometric evaluation of perceived stress scale for Turkish university students. Stress Health J. Int. Soc. Investig. Stress 2009, 25, 103–109. [Google Scholar] [CrossRef]
- Pollock, V.; Cho, D.W.; Reker, D.; Volavka, J. Profile of Mood States: The factors and their physiological correlates. J. Nerv. Ment. Dis. 1979, 167, 612–614. [Google Scholar] [CrossRef]
- Richardson, J.; Iezzi, A.; Khan, M.A.; Maxwell, A. Validity and reliability of the Assessment of Quality of Life (AQoL)-8D multi-attribute utility instrument. Patient-Patient-Cent. Outcomes Res. 2014, 7, 85–96. [Google Scholar] [CrossRef]
- Shahid, A.; Wilkinson, K.; Marcu, S.; Shapiro, C.M. Leeds sleep evaluation questionnaire (LSEQ). In STOP, THAT and One Hundred Other Sleep Scales; Springer: Berlin/Heidelberg, Germany, 2011; pp. 211–213. [Google Scholar] [CrossRef]
- Su, K.P.; Matsuoka, Y.; Pae, C.U. Omega-3 Polyunsaturated Fatty Acids in Prevention of Mood and Anxiety Disorders. Clin. Psychopharmacol. Neurosci. Off. Sci. J. Korean Coll. Neuropsychopharmacol. 2015, 13, 129–137. [Google Scholar] [CrossRef]
- Wilson, P.B.; Madrigal, L.A. Associations among Omega-3 Fatty Acid Status, Anxiety, and Mental Toughness in Female Collegiate Athletes. J. Am. Coll. Nutr. 2017, 36, 602–607. [Google Scholar] [CrossRef]
- Reily, N.M.; Tang, S.; Negrone, A.; Gan, D.Z.Q.; Sheanoda, V.; Christensen, H. Omega-3 supplements in the prevention and treatment of youth depression and anxiety: A scoping review. medRxiv 2022. [Google Scholar] [CrossRef]
- Parilli-Moser, I.; Domínguez-López, I.; Trius-Soler, M.; Castellví, M.; Bosch, B.; Castro-Barquero, S.; Estruch, R.; Hurtado-Barroso, S.; Lamuela-Raventós, R.M. Consumption of peanut products improves memory and stress response in healthy adults from the ARISTOTLE study: A 6-month randomized controlled trial. Clin. Nutr. 2021, 40, 5556–5567. [Google Scholar] [CrossRef]
- Scott, A.J.; Webb, T.L.; Martyn-St James, M.; Rowse, G.; Weich, S. Improving sleep quality leads to better mental health: A meta-analysis of randomised controlled trials. Sleep Med. Rev. 2021, 60, 101556. [Google Scholar] [CrossRef]
- Milojevich, H.M.; Lukowski, A.F. Sleep and mental health in undergraduate students with generally healthy sleep habits. PLoS ONE 2016, 11, e0156372. [Google Scholar] [CrossRef]
- Reiter, R.J.; Manchester, L.; Tan, D.-x. Melatonin in walnuts: Influence on levels of melatonin and total antioxidant capacity of blood. Nutrition 2005, 21, 920–924. [Google Scholar] [CrossRef] [PubMed]
- Yeh, A.-L.; Chao, C.-L.; Huang, W.-F.; Lin, H.-C.; Wang, C.-J. Walnut (Juglans regia L.) Oligopeptide Effects on Enhancing Memory, Cognition and Improving Sleep Quality in Teenagers and Elderly People in a Randomized Double-Blind Controlled Trial. Nat. Prod. Commun. 2022, 17. [Google Scholar] [CrossRef]
- Ali, A.M.; Alkhamees, A.A.; Hori, H.; Kim, Y.; Kunugi, H. The depression anxiety stress scale 21: Development and validation of the depression anxiety stress scale 8-item in psychiatric patients and the general public for easier mental health measurement in a post COVID-19 world. Int. J. Environ. Res. Public Health 2021, 18, 10142. [Google Scholar] [CrossRef] [PubMed]
- Denovan, A.; Dagnall, N.; Dhingra, K.; Grogan, S. Evaluating the Perceived Stress Scale among UK university students: Implications for stress measurement and management. Stud. High. Educ. 2019, 44, 120–133. [Google Scholar] [CrossRef]
- Lee, D. The convergent, discriminant, and nomological validity of the Depression Anxiety Stress Scales-21 (DASS-21). J. Affect. Disord. 2019, 259, 136–142. [Google Scholar] [CrossRef]
- Nguyen, T.H.D.; Vu, D.C. A Review on Phytochemical Composition and Potential Health-promoting Properties of Walnuts. Food Rev. Int. 2021. [Google Scholar] [CrossRef]
- Mateș, L.; Popa, D.-S.; Rusu, M.E.; Fizeșan, I.; Leucuța, D. Walnut Intake Interventions Targeting Biomarkers of Metabolic Syndrome and Inflammation in Middle-Aged and Older Adults: A Systematic Review and Meta-Analysis of Randomized Controlled Trials. Antioxidants 2022, 11, 1412. [Google Scholar] [CrossRef]
- Torabian, S.; Haddad, E.; Rajaram, S.; Banta, J.; Sabaté, J. Acute effect of nut consumption on plasma total polyphenols, antioxidant capacity and lipid peroxidation. J. Hum. Nutr. Diet. 2009, 22, 64–71. [Google Scholar] [CrossRef]
- Davis, L.; Stonehouse, W.; Loots, D.T.; Mukuddem-Petersen, J.; van der Westhuizen, F.H.; Hanekom, S.M.; Jerling, J.C. The effects of high walnut and cashew nut diets on the antioxidant status of subjects with metabolic syndrome. Eur. J. Nutr. 2007, 46, 155–164. [Google Scholar] [CrossRef]
- McKay, D.L.; Chen, C.Y.; Yeum, K.J.; Matthan, N.R.; Lichtenstein, A.H.; Blumberg, J.B. Chronic and acute effects of walnuts on antioxidant capacity and nutritional status in humans: A randomized, cross-over pilot study. Nutr. J. 2010, 9, 21. [Google Scholar] [CrossRef] [PubMed]
- Sivoňová, M.; Žitňanová, I.; Hlinčíková, L.; Škodáček, I.; Trebatická, J.; Ďuračková, Z. Oxidative Stress in University Students during Examinations. Stress 2004, 7, 183–188. [Google Scholar] [CrossRef]
- Zwolińska, W.; Dmitrzak-Węglarz, M.; Słopień, A. Biomarkers in Child and Adolescent Depression. Child Psychiatry Hum. Dev. 2021. [Google Scholar] [CrossRef] [PubMed]
- Carvalho, A.F.; Solmi, M.; Sanches, M.; Machado, M.O.; Stubbs, B.; Ajnakina, O.; Sherman, C.; Sun, Y.R.; Liu, C.S.; Brunoni, A.R. Evidence-based umbrella review of 162 peripheral biomarkers for major mental disorders. Transl. Psychiatry 2020, 10, 1–13. [Google Scholar] [CrossRef] [PubMed]
- Nobis, A.; Zalewski, D.; Waszkiewicz, N. Peripheral Markers of Depression. J. Clin. Med. 2020, 9, 3793. [Google Scholar] [CrossRef] [PubMed]
- Freemantle, E.; Chen, G.G.; Cruceanu, C.; Mechawar, N.; Turecki, G. Analysis of oxysterols and cholesterol in prefrontal cortex of suicides. Int. J. Neuropsychopharmacol. 2013, 16, 1241–1249. [Google Scholar] [CrossRef] [PubMed]
- Guidara, W.; Messedi, M.; Maalej, M.; Naifar, M.; Khrouf, W.; Grayaa, S.; Maalej, M.; Bonnefont-Rousselot, D.; Lamari, F.; Ayadi, F. Plasma oxysterols: Altered level of plasma 24-hydroxycholesterol in patients with bipolar disorder. J. Steroid Biochem. Mol. Biol. 2021, 211, 105902. [Google Scholar] [CrossRef]
- Vincent, J.-L. Relevance of albumin in modern critical care medicine. Best Pract. Res. Clin. Anaesthesiol. 2009, 23, 183–191. [Google Scholar] [CrossRef]
- Eckart, A.; Struja, T.; Kutz, A.; Baumgartner, A.; Baumgartner, T.; Zurfluh, S.; Neeser, O.; Huber, A.; Stanga, Z.; Mueller, B.; et al. Relationship of Nutritional Status, Inflammation, and Serum Albumin Levels During Acute Illness: A Prospective Study. Am. J. Med. 2020, 133, 713–722.e717. [Google Scholar] [CrossRef]
- Gregg, L.P.; Carmody, T.; Le, D.; Martins, G.; Trivedi, M.; Hedayati, S.S. A systematic review and meta-analysis of depression and protein–energy wasting in kidney disease. Kidney Int. Rep. 2020, 5, 318–330. [Google Scholar] [CrossRef]
- Almulla, A.F.; Thipakorn, Y.; Vasupanrajit, A.; Algon, A.A.A.; Tunvirachaisakul, C.; Aljanabi, A.A.H.; Oxenkrug, G.; Al-Hakeim, H.K.; Maes, M. The tryptophan catabolite or kynurenine pathway in major depressive and bipolar disorder: A systematic review and meta-analysis. medRxiv 2022. [Google Scholar] [CrossRef] [PubMed]
- Chaturvedi, Y.; Chaturvedy, S.; Marwah, N.; Chaturvedi, S.; Agarwal, S.; Agarwal, N. Salivary Cortisol and Alpha-amylase-Biomarkers of Stress in Children undergoing Extraction: An in vivo Study. Int. J. Clin. Pediatr. Dent. 2018, 11, 214–218. [Google Scholar] [CrossRef] [PubMed]
- Heaney, J.L.J.; Phillips, A.C.; Carroll, D. Ageing, depression, anxiety, social support and the diurnal rhythm and awakening response of salivary cortisol. Int. J. Psychophysiol. 2010, 78, 201–208. [Google Scholar] [CrossRef]
- Nater, U.M.; Rohleder, N.; Schlotz, W.; Ehlert, U.; Kirschbaum, C. Determinants of the diurnal course of salivary alpha-amylase. Psychoneuroendocrinology 2007, 32, 392–401. [Google Scholar] [CrossRef] [PubMed]
- Preuß, D.; Schoofs, D.; Schlotz, W.; Wolf, O.T. The stressed student: Influence of written examinations and oral presentations on salivary cortisol concentrations in university students. Stress 2010, 13, 221–229. [Google Scholar] [CrossRef]
- Khan, A.N.; Abbassi, M.A.; Gandapur, A.; Alam, A.; Haroon, M.Z.; Hussain, J. Frequency of depression among patients with chronic liver disease. J. Ayub Med. Coll. Abbottabad 2020, 32, 535–539. [Google Scholar]
- Zhang, J.; Li, J.; Ding, M.; Chen, Y.; Duan, Z. Cortisol in Peripheral Blood Predicts the Severity and Prognosis in Patients with Liver Failure at 90 Days. Risk Manag. Healthc. Policy 2021, 14, 4311. [Google Scholar] [CrossRef]
- Koley, S.; Sur, A. Effect of Therapeutic Interventions on Salivary Alpha Amylase and Lipid Pro le in Major Depressive Disorder Patients. 2020. (Preprint). Available online: https://pdfs.semanticscholar.org/9523/d9662dd1de9b02a01f6220cd40dc8af2ef3f.pdf (accessed on 8 September 2022).
- Mitoma, M.; Yoshimura, R.; Sugita, A.; Umene, W.; Hori, H.; Nakano, H.; Ueda, N.; Nakamura, J. Stress at work alters serum brain-derived neurotrophic factor (BDNF) levels and plasma 3-methoxy-4-hydroxyphenylglycol (MHPG) levels in healthy volunteers: BDNF and MHPG as possible biological markers of mental stress? Prog. Neuro-Psychopharmacol. Biol. Psychiatry 2008, 32, 679–685. [Google Scholar] [CrossRef]
- Piepmeier, A.T.; Etnier, J.L. Brain-derived neurotrophic factor (BDNF) as a potential mechanism of the effects of acute exercise on cognitive performance. J. Sport Health Sci. 2015, 4, 14–23. [Google Scholar] [CrossRef]
- Wang, Y.; Liu, H.; Zhang, B.-S.; Soares, J.C.; Zhang, X.Y. Low BDNF is associated with cognitive impairments in patients with Parkinson’s disease. Park. Relat. Disord. 2016, 29, 66–71. [Google Scholar] [CrossRef]
- Ehrlich, D.; Humpel, C. Platelets in psychiatric disorders. World J. Psychiatry 2012, 2, 91–94. [Google Scholar] [CrossRef] [PubMed]
- Izzi, B.; Tirozzi, A.; Cerletti, C.; Donati, M.B.; de Gaetano, G.; Hoylaerts, M.F.; Iacoviello, L.; Gialluisi, A. Beyond Haemostasis and Thrombosis: Platelets in Depression and Its Co-Morbidities. Int. J. Mol. Sci. 2020, 21, 8817. [Google Scholar] [CrossRef] [PubMed]
- Serra-Millàs, M. Are the changes in the peripheral brain-derived neurotrophic factor levels due to platelet activation? World J. Psychiatry 2016, 6, 84–101. [Google Scholar] [CrossRef] [PubMed]
- Park, Y.-M.; Lee, B.-H.; Um, T.H.; Kim, S. Serum BDNF Levels in Relation to Illness Severity, Suicide Attempts, and Central Serotonin Activity in Patients with Major Depressive Disorder: A Pilot Study. PLoS ONE 2014, 9, e91061. [Google Scholar] [CrossRef] [PubMed]
- Correia, A.S.; Vale, N. Tryptophan Metabolism in Depression: A Narrative Review with a Focus on Serotonin and Kynurenine Pathways. Int. J. Mol. Sci. 2022, 23, 8493. [Google Scholar] [CrossRef]
- Polyakova, M.; Beyer, F.; Mueller, K.; Sander, C.; Witte, V.; Lampe, L.; Rodrigues, F.; Riedel-Heller, S.; Kratzsch, J.; Hoffmann, K.T.; et al. Serum BDNF levels correlate with regional cortical thickness in minor depression: A pilot study. Sci. Rep. 2020, 10, 14524. [Google Scholar] [CrossRef]
- Puhlmann, L.M.C.; Linz, R.; Valk, S.L.; Vrticka, P.; Vos de Wael, R.; Bernasconi, A.; Bernasconi, N.; Caldairou, B.; Papassotiriou, I.; Chrousos, G.P.; et al. Association between hippocampal structure and serum Brain-Derived Neurotrophic Factor (BDNF) in healthy adults: A registered report. NeuroImage 2021, 236, 118011. [Google Scholar] [CrossRef]
- Chen, Y.-h.; Xue, F.; Yu, S.-f.; Li, X.-s.; Liu, L.; Jia, Y.-y.; Yan, W.-j.; Tan, Q.-r.; Wang, H.-n.; Peng, Z.-w. Gut microbiota dysbiosis in depressed women: The association of symptom severity and microbiota function. J. Affect. Disord. 2021, 282, 391–400. [Google Scholar] [CrossRef]
- Nikolova, V.L.; Hall, M.R.; Hall, L.J.; Cleare, A.J.; Stone, J.M.; Young, A.H. Perturbations in gut microbiota composition in psychiatric disorders: A review and meta-analysis. JAMA Psychiatry 2021, 78, 1343–1354. [Google Scholar] [CrossRef]
- Audet, M.-C. Stress-induced disturbances along the gut microbiota-immune-brain axis and implications for mental health: Does sex matter? Front. Neuroendocrinol. 2019, 54, 100772. [Google Scholar] [CrossRef]
- Org, E.; Mehrabian, M.; Parks, B.W.; Shipkova, P.; Liu, X.; Drake, T.A.; Lusis, A.J. Sex differences and hormonal effects on gut microbiota composition in mice. Gut Microbes 2016, 7, 313–322. [Google Scholar] [CrossRef]
- Carson, T.L.; Wang, F.; Cui, X.; Jackson, B.E.; Van Der Pol, W.J.; Lefkowitz, E.J.; Morrow, C.; Baskin, M.L. Associations between race, perceived psychological stress, and the gut microbiota in a sample of generally healthy black and white women: A pilot study on the role of race and perceived psychological stress. Psychosom. Med. 2018, 80, 640. [Google Scholar] [CrossRef] [PubMed]
- Yang, H.-l.; Li, M.-M.; Zhou, M.-F.; Xu, H.-S.; Huan, F.; Liu, N.; Gao, R.; Wang, J.; Zhang, N.; Jiang, L. Links between Gut Dysbiosis and Neurotransmitter Disturbance in Chronic Restraint Stress-Induced Depressive Behaviours: The Role of Inflammation. Inflammation 2021, 44, 2448–2462. [Google Scholar] [CrossRef] [PubMed]
- Jiang, H.; Ling, Z.; Zhang, Y.; Mao, H.; Ma, Z.; Yin, Y.; Wang, W.; Tang, W.; Tan, Z.; Shi, J.; et al. Altered fecal microbiota composition in patients with major depressive disorder. Brain Behav. Immun. 2015, 48, 186–194. [Google Scholar] [CrossRef] [PubMed]
- Parker, B.J.; Wearsch, P.A.; Veloo, A.C.; Rodriguez-Palacios, A. The genus Alistipes: Gut bacteria with emerging implications to inflammation, cancer, and mental health. Front. Immunol. 2020, 11, 906. [Google Scholar] [CrossRef]
- Kaur, H.; Bose, C.; Mande, S.S. Tryptophan metabolism by gut microbiome and gut-brain-axis: An in silico analysis. Front. Neurosci. 2019, 13, 1365. [Google Scholar] [CrossRef]
- Kennedy, P.J.; Cryan, J.F.; Dinan, T.G.; Clarke, G. Kynurenine pathway metabolism and the microbiota-gut-brain axis. Neuropharmacology 2017, 112, 399–412. [Google Scholar] [CrossRef]
- Bonaz, B.; Bazin, T.; Pellissier, S. The vagus nerve at the interface of the microbiota-gut-brain axis. Front. Neurosci. 2018, 12, 49. [Google Scholar] [CrossRef]
- Decsi, T.; Kennedy, K. Sex-specific differences in essential fatty acid metabolism. Am. J. Clin. Nutr. 2011, 94, 1914S–1919S. [Google Scholar] [CrossRef]
- Vijay, A.; Astbury, S.; Le Roy, C.; Spector, T.D.; Valdes, A.M. The prebiotic effects of omega-3 fatty acid supplementation: A six-week randomised intervention trial. Gut Microbes 2021, 13, 1863133. [Google Scholar] [CrossRef]
- Arumugam, V.; John, V.S.; Augustine, N.; Jacob, T.; Joy, S.M.; Sen, S.; Sen, T. The impact of antidepressant treatment on brain-derived neurotrophic factor level: An evidence-based approach through systematic review and meta-analysis. Indian J. Pharmacol. 2017, 49, 236. [Google Scholar] [CrossRef] [PubMed]
- Lukić, I.; Getselter, D.; Ziv, O.; Oron, O.; Reuveni, E.; Koren, O.; Elliott, E. Antidepressants affect gut microbiota and Ruminococcus flavefaciens is able to abolish their effects on depressive-like behavior. Transl. Psychiatry 2019, 9, 133. [Google Scholar] [CrossRef] [PubMed]


| Group | Control | Walnuts | |||||
|---|---|---|---|---|---|---|---|
| N | Mean | % | N | Mean | % | p | |
| Age | 22 | 22 | >0.999 | ||||
| BMI | 22.86 | 22.82 | 0.968 | ||||
| Sex | 0.3711 | ||||||
| Male | 6 | 10 | 9 | 15 | |||
| Female | 24 | 40 | 21 | 35 | |||
| Ethnicity | 0.7299 | ||||||
| African | 2 | 3.33 | 1 | 1.67 | |||
| Asian | 15 | 25 | 18 | 30.00 | |||
| Caucasian | 11 | 18.33 | 9 | 15.00 | |||
| Afghani | 1 | 1.67 | 1 | 1.67 | |||
| Persian | 1 | 1.67 | 0 | 0.00 | |||
| South American | 0 | 0.00 | 1 | 1.67 | |||
| Relationship status | 0.1312 | ||||||
| Single | 23 | 38.33 | 28 | 46.67 | |||
| Married | 1 | 1.67 | 1 | 1.67 | |||
| Other | 6 | 10.00 | 1 | 1.67 | |||
| Employment | |||||||
| None | 13 | 21.67 | 13 | 21.67 | |||
| Part-time/Casual | 17 | 28.33 | 17 | 28.33 | |||
| Full-time | 0 | 0.00 | 0 | 0.00 | |||
| Number of examinable subjects | 0.2953 | ||||||
| 1 | 0 | 0.00 | 3 | 5.00 | |||
| 2 | 9 | 15.00 | 6 | 10.00 | |||
| 3 | 7 | 11.67 | 8 | 13.33 | |||
| 4 | 14 | 23.33 | 13 | 21.67 | |||
| Control Diet | Walnut Diet | p Value (Control versus Walnut) | |||||||
|---|---|---|---|---|---|---|---|---|---|
| Visit 1 | Visit 2 | Visit 3 | Visit 1 | Visit 2 | Visit 3 | Visit 1 | Visit 2 | Visit 3 | |
| Triglycerides (mmol/L) | 1.720 ± 0.26 (n = 31) | 1.830 ± 0.31 (n = 26) | 1.753 ± 0.30 (n = 24) | 1.348 ± 0.15 (n = 37) | 1.288 ± 0.15 (n = 27) | 1.199 ± 0.21 (n = 22) | 0.6107 | 0.1008 | 0.2858 |
| Cholesterol (mmol/L) | 4.627 ± 0.15 (n = 31) | 4.342 ± 0.15 (n = 26) | 4.460 ± 0.20 (n = 24) | 4.603 ± 0.17 (n = 27) | 4.474 ± 0.18 (n = 27) | 4.524 ± 0.22 (n = 23) | >0.9999 | >0.9999 | >0.9999 |
| Glucose (mmol/L) | 5.075 ± 0.15 (n = 31) | 5.130 ± 0.21 (n = 26) | 4.787 ± 0.13 (n = 24) | 4.857 ± 0.14 (n = 37) | 5.208 ± 0.24 (n = 27) | 5.025 ± 0.12 (n = 23) | 0.9651 | >0.9999 | >0.9999 |
| Total protein (g/L) | 74.99 ± 0.72 (n = 31) | 72.919 ± 0.87 (n = 26) | 72.632 ± 1.09 (n = 24) | 77.027 ± 0.96 (n = 37) | 77.145 ± 1.28 (n = 27) | 75.677 ± 0.96 (n = 23) | 0.3333 | 0.0348 | 0.0465 |
| Albumin (g/L) | 46.723 ± 0.40 (n = 31) | 45.719 ± 0.52 (n = 26) | 45.337 ± 0.613 (n = 24) | 47.604 ± 1.13 (n = 37) | 48.936 ± 0.47 (n = 27) | 48.100 ± 0.44 (n = 23) | >0.9999 | 0.0055 | 0.0262 |
| Total bilirubin (μmol/L) | 9.082 ± 1.01 (n = 31) | 10.475 ± 1.47 (n = 26) | 10.318 ± 1.50 (n = 24) | 7.607 ± 0.53 (n = 37) | 8.670 ± 0.70 (n = 27) | 9.280 ± 0.73 (n = 23) | 0.7509 | 0.9756 | 0.8552 |
| Direct bilirubin (μmol/L) | 3.349 ± 0.26 (n = 31) | 3.633 ± 0.37 (n = 26) | 3.540 ± 0.32 (n = 24) | 2.942 ± 0.17 (n = 37) | 3.107 ± 0.20 (n = 27) | 3.380 ± 0.24 (n = 23) | 0.6548 | 0.6085 | >0.9999 |
| Indirect bilirubin (μmol/L) | 5.732 ± 0.78 (n = 31) | 6.842 ± 1.14 (n = 26) | 6.779 ± 1.21 (n = 24) | 4.665 ± 0.41 (n = 37) | 5.562 ± 0.52 (n = 27) | 5.562 ± 0.52 (n = 23) | 0.8667 | >0.9999 | 0.7149 |
| C-reactive protein (mg/L) | 1.604 ± 0.44 (n = 31) | 1.656 ± 0.60 (n = 26) | 2.124 ± 0.73 (n = 24) | 1.124 ± 0.42 (n = 37) | 1.234 ± 0.46 (n = 27) | 0.600 ± 0.19 (n = 23) | >0.9999 | >0.9999 | 0.3222 |
| Comparison 1 | Comparison 2 | Sample Size | Permutations | Pseudo-F | p-Value | q-Value |
|---|---|---|---|---|---|---|
| Control Visit 1 | Control Visit 2 | 25 | 999 | 0.285249 | 1 | 1 |
| Control Visit 1 | Control Visit 3 | 25 | 999 | 0.401644 | 0.996 | 1 |
| Control Visit 1 | Walnut Visit 1 | 25 | 999 | 0.940845 | 0.589 | 1 |
| Control Visit 1 | Walnut Visit 2 | 24 | 999 | 1.459005 | 0.028 * | 0.42 |
| Control Visit 1 | Walnut Visit 3 | 23 | 999 | 1.205501 | 0.145 | 0.54375 |
| Control Visit 2 | Control Visit 3 | 22 | 999 | 0.242073 | 0.997 | 1 |
| Control Visit 2 | Walnut Visit 1 | 22 | 999 | 0.889242 | 0.667 | 1 |
| Control Visit 2 | Walnut Visit 2 | 21 | 999 | 1.274508 | 0.083 | 0.54375 |
| Control Visit 2 | Walnut Visit 3 | 20 | 999 | 1.119598 | 0.241 | 0.723 |
| Control Visit 3 | Walnut Visit 1 | 22 | 999 | 0.798942 | 0.865 | 1 |
| Control Visit 3 | Walnut Visit 2 | 21 | 999 | 1.213038 | 0.132 | 0.54375 |
| Control Visit 3 | Walnut Visit 3 | 20 | 999 | 1.001359 | 0.452 | 1 |
| Walnut Visit 1 | Walnut Visit 2 | 21 | 999 | 0.495246 | 0.974 | 1 |
| Walnut Visit 1 | Walnut Visit 3 | 20 | 999 | 0.475754 | 0.982 | 1 |
| Walnut Visit 2 | Walnut Visit 3 | 19 | 999 | 0.319278 | 0.998 | 1 |
Publisher’s Note: MDPI stays neutral with regard to jurisdictional claims in published maps and institutional affiliations. |
© 2022 by the authors. Licensee MDPI, Basel, Switzerland. This article is an open access article distributed under the terms and conditions of the Creative Commons Attribution (CC BY) license (https://creativecommons.org/licenses/by/4.0/).
Share and Cite
Herselman, M.F.; Bailey, S.; Deo, P.; Zhou, X.-F.; Gunn, K.M.; Bobrovskaya, L. The Effects of Walnuts and Academic Stress on Mental Health, General Well-Being and the Gut Microbiota in a Sample of University Students: A Randomised Clinical Trial. Nutrients 2022, 14, 4776. https://doi.org/10.3390/nu14224776
Herselman MF, Bailey S, Deo P, Zhou X-F, Gunn KM, Bobrovskaya L. The Effects of Walnuts and Academic Stress on Mental Health, General Well-Being and the Gut Microbiota in a Sample of University Students: A Randomised Clinical Trial. Nutrients. 2022; 14(22):4776. https://doi.org/10.3390/nu14224776
Chicago/Turabian StyleHerselman, Mauritz F., Sheree Bailey, Permal Deo, Xin-Fu Zhou, Kate M. Gunn, and Larisa Bobrovskaya. 2022. "The Effects of Walnuts and Academic Stress on Mental Health, General Well-Being and the Gut Microbiota in a Sample of University Students: A Randomised Clinical Trial" Nutrients 14, no. 22: 4776. https://doi.org/10.3390/nu14224776
APA StyleHerselman, M. F., Bailey, S., Deo, P., Zhou, X.-F., Gunn, K. M., & Bobrovskaya, L. (2022). The Effects of Walnuts and Academic Stress on Mental Health, General Well-Being and the Gut Microbiota in a Sample of University Students: A Randomised Clinical Trial. Nutrients, 14(22), 4776. https://doi.org/10.3390/nu14224776