
Sociodemographic and Health Indicators of Diet Quality in Pre-Frail Older Adults in New Zealand

 ,
,
Abstract
:1. Introduction
2. Materials and Methods
2.1. Study Sample
2.2. Data Collection
2.3. Statistical Tests
2.3.1. Descriptive Data
2.3.2. Regression and Tree Analysis
3. Results
3.1. Sample Descriptives
3.2. Associations: Generalized Linear Models
3.2.1. Univariate Analysis
3.2.2. Multivariate Analysis
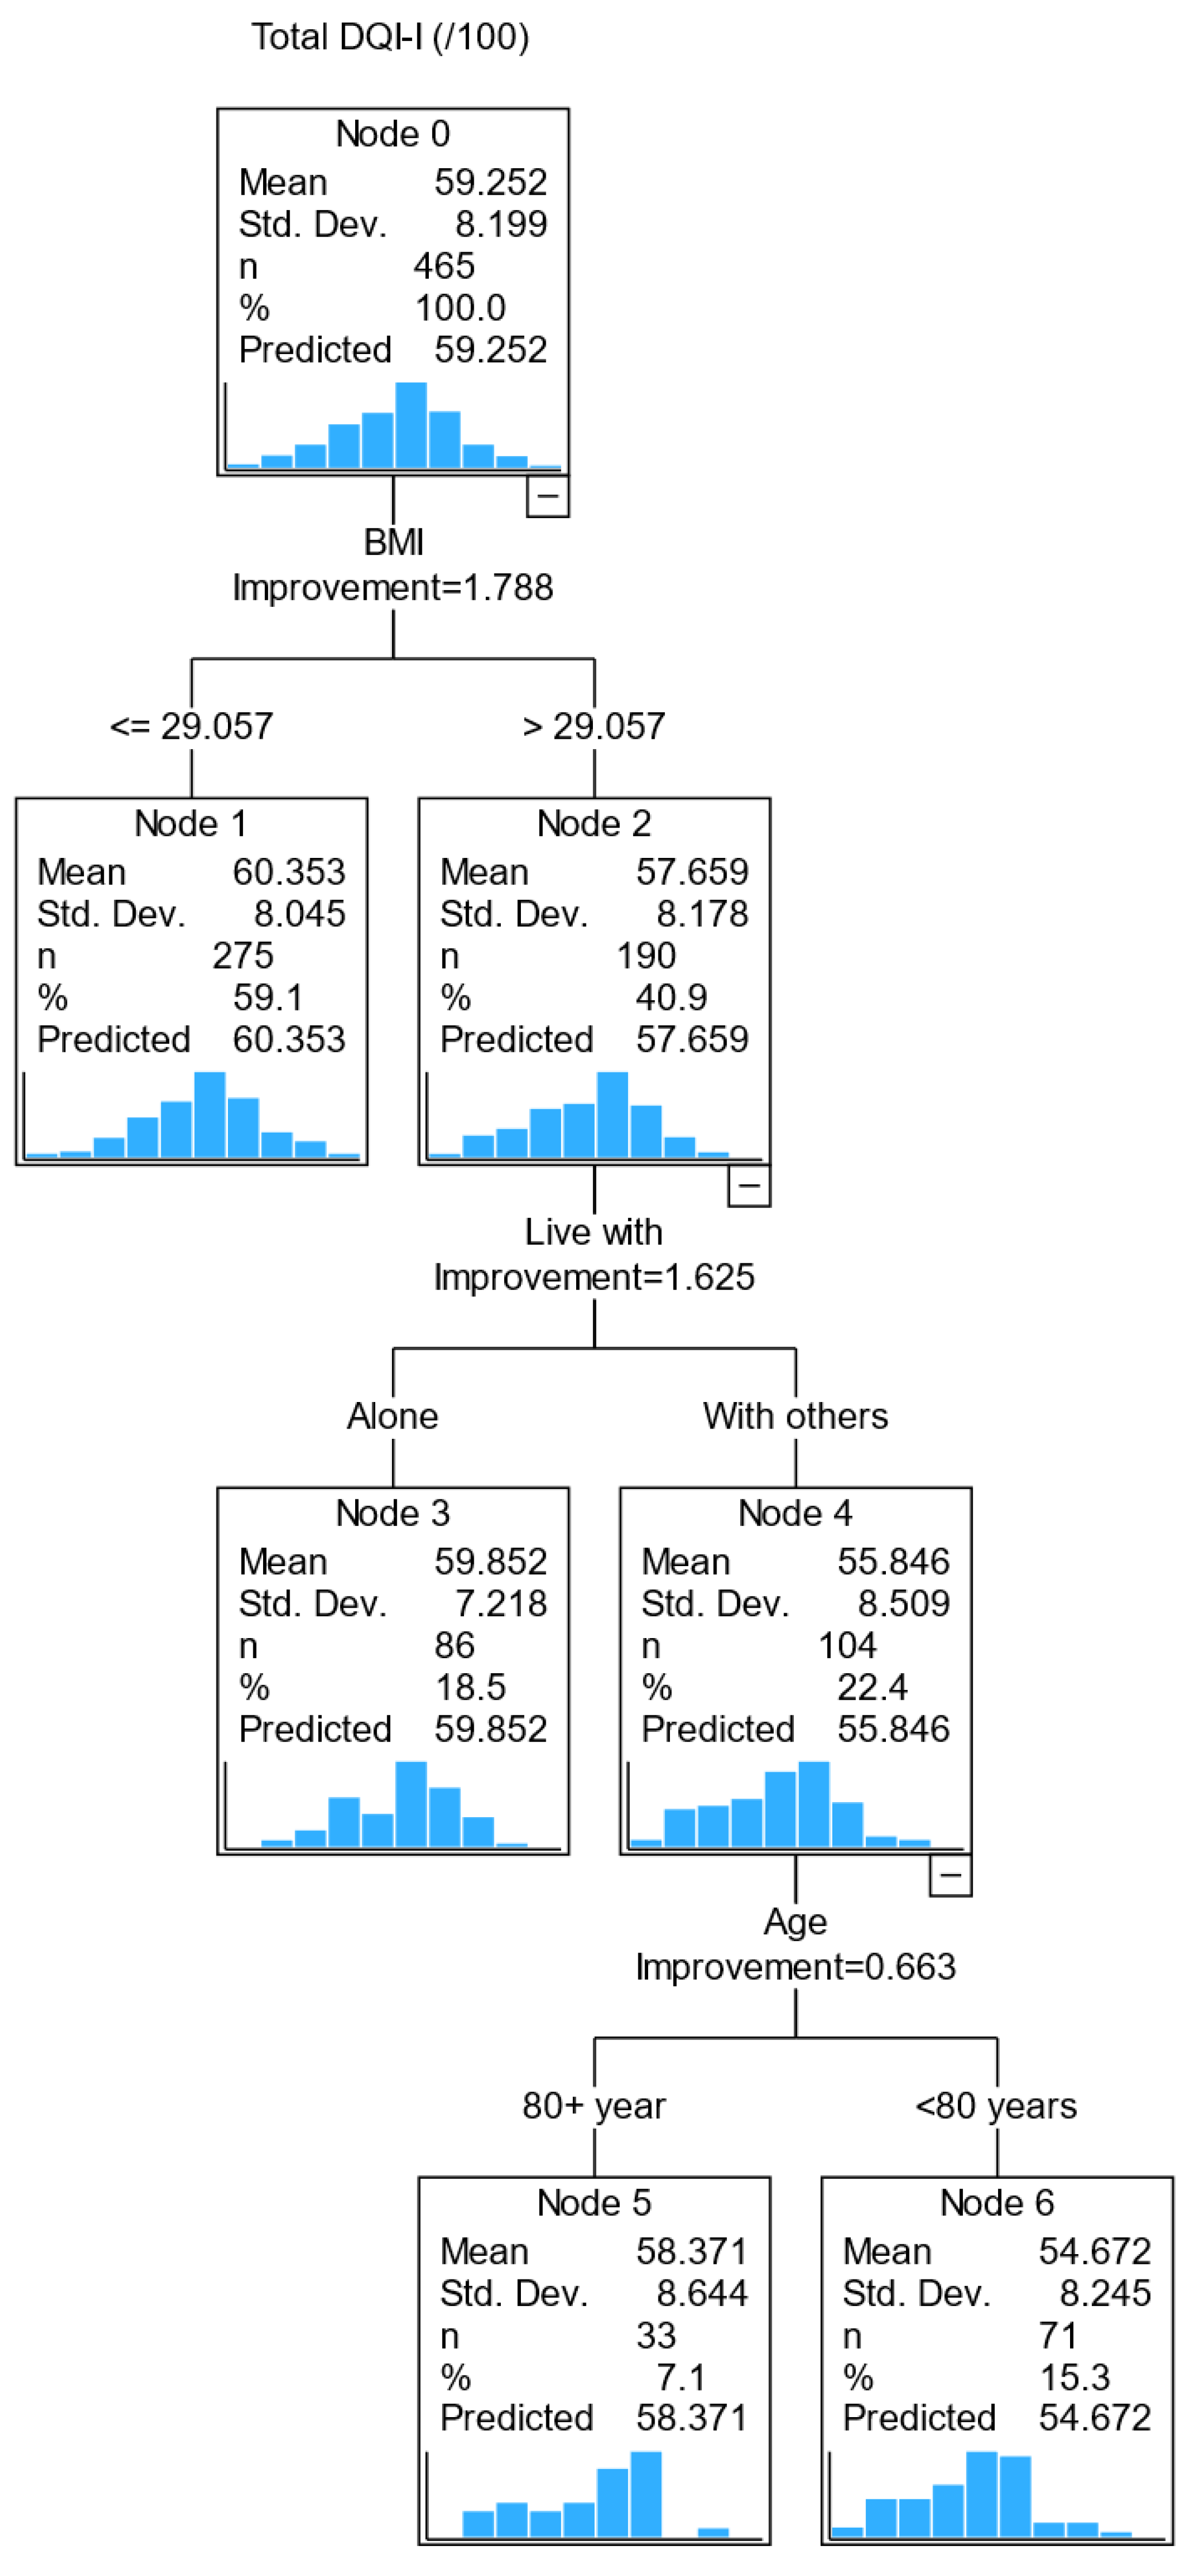
3.3. Relationships between Variables: Classification and Regression Tree (CART) Analysis
4. Discussion
Strengths and Limitations
5. Conclusions
Supplementary Materials
Author Contributions
Funding
Institutional Review Board Statement
Informed Consent Statement
Data Availability Statement
Acknowledgments
Conflicts of Interest
Appendix A

| Demographic and Health Variables | DQI-I | Variety | Adequacy | Moderation | Balance | ||||||||||
|---|---|---|---|---|---|---|---|---|---|---|---|---|---|---|---|
| B | Std. Error | p-Value | B | Std. Error | p-Value | B | Std. Error | p-Value | B | Std. Error | p-Value | B | Std. Error | p-Value | |
| Age, (<80 years; reference: 80+ years) | −1.474 | 0.7572 | 0.052 | −0.247 | 0.3085 | 0.423 | −0.426 | 0.4101 | 0.299 | −0.622 | 0.3931 | 0.114 | −0.178 | 0.1395 | 0.202 |
| Sex (male; reference: female) | −0.776 | 0.7718 | 0.314 | 0.375 | 0.3132 | 0.231 | 0.083 | 0.4173 | 0.843 | −1.394 | 0.3953 | <0.001 | 0.159 | 0.1418 | 0.261 |
| Ethnic group (European; reference: non-European) | 2.260 | 1.2934 | 0.081 | 0.458 | 0.5264 | 0.384 | 1.381 | 0.6979 | 0.048 | 0.117 | 0.6727 | 0.862 | 0.305 | 0.2381 | 0.200 |
| Education level (primary; reference: tertiary) | 0.041 | 2.2660 | 0.985 | −0.108 | 0.9196 | 0.907 | −1.280 | 1.2224 | 0.295 | 1.201 | 1.1728 | 0.306 | 0.227 | 0.4164 | 0.585 |
| (Secondary; reference: tertiary) | −0.079 | 0.7784 | 0.919 | −0.225 | 0.3159 | 0.477 | −0.205 | 0.4199 | 0.625 | 0.365 | 0.4029 | 0.365 | −0.014 | 0.1430 | 0.924 |
| Live with (alone; reference: others) | 1.578 | 0.7619 | 0.038 | 0.356 | 0.3103 | 0.251 | 0.341 | 0.4131 | 0.409 | 0.999 | 0.3941 | 0.011 | −0.118 | 0.1406 | 0.399 |
| Deprivation (reference: high) Low | 1.959 | 0.9405 | 0.037 | 0.604 | 0.3827 | 0.114 | 1.137 | 0.5072 | 0.025 | −0.082 | 0.4900 | 0.867 | 0.300 | 0.1731 | 0.083 |
| Medium | 1.621 | 0.9595 | 0.091 | 0.474 | 0.3904 | 0.225 | 1.112 | 0.5174 | 0.032 | −0.244 | 0.4998 | 0.626 | 0.279 | 0.1766 | 0.115 |
| Medical conditions (1; reference: 2+) | 0.120 | 0.8882 | 0.892 | −0.004 | 0.3606 | 0.992 | −0.244 | 0.4796 | 0.611 | 0.129 | 0.4604 | 0.779 | 0.238 | 0.1629 | 0.143 |
| Vision (impaired; reference: non impaired) | −0.569 | 1.5001 | 0.705 | −0.546 | 0.6086 | 0.370 | 0.513 | 0.8100 | 0.527 | −0.108 | 0.7778 | 0.890 | −0.428 | 0.2751 | 0.120 |
| Hearing (impaired; reference: non impaired) | 1.966 | 1.4367 | 0.171 | −0.008 | 0.5845 | 0.989 | 1.046 | 0.7760 | 0.178 | 0.950 | 0.7450 | 0.202 | −0.022 | 0.2646 | 0.934 |
| BMI, kg/m2 | −0.194 | 0.0769 | 0.012 | −0.062 | 0.0312 | 0.047 | −0.093 | 0.0416 | 0.025 | −0.023 | 0.0401 | 0.574 | −0.016 | 0.0141 | 0.258 |
| Waist circumference, cm | −0.055 | 0.0298 | 0.064 | −0.009 | 0.0121 | 0.461 | −0.022 | 0.0160 | 0.165 | −0.022 | 0.0155 | 0.150 | −0.002 | 0.0055 | 0.753 |
| Medications (1; reference: 2+) | −1.160 | 1.2710 | 0.361 | 0.403 | 0.5162 | 0.435 | −1.236 | 0.6847 | 0.071 | −0.248 | 0.6594 | 0.707 | −0.079 | 0.2338 | 0.735 |
| Supplements (0; reference: 1+) | −0.133 | 0.7653 | 0.862 | −0.274 | 0.3105 | 0.377 | −0.278 | 0.4132 | 0.501 | 0.106 | 0.3968 | 0.790 | 0.314 | 0.1399 | 0.025 |
| Alcohol consumption (never; reference: regular) | −0.369 | 1.0012 | 0.713 | −0.806 | 0.4055 | 0.047 | −0.311 | 0.5409 | 0.565 | 0.428 | 0.5192 | 0.410 | 0.321 | 0.1835 | 0.081 |
| (Occasional; reference: regular) | 0.806 | 0.8704 | 0.355 | −0.289 | 0.3525 | 0.412 | 0.316 | 0.4702 | 0.501 | 0.501 | 0.4514 | 0.267 | 0.278 | 0.1596 | 0.082 |
| Smoking (non-smoker; reference: smoker) | 4.936 | 3.6754 | 0.179 | 2.202 | 1.4917 | 0.140 | 3.936 | 1.9806 | 0.047 | −2.404 | 1.9059 | 0.207 | 1.202 | 0.6746 | 0.075 |
| NEADL score | 0.219 | 0.1662 | 0.188 | 0.052 | 0.0676 | 0.444 | 0.143 | 0.0897 | 0.112 | 0.042 | 0.0863 | 0.623 | −0.018 | 0.0306 | 0.562 |
| SPPB score | 0.187 | 0.1785 | 0.295 | 0.172 | 0.0721 | 0.017 | 0.123 | 0.0963 | 0.202 | −0.099 | 0.0925 | 0.286 | −0.009 | 0.0328 | 0.781 |
| MoCA score (not impaired; reference: impaired) | −0.507 | 0.9252 | 0.583 | −0.307 | 0.3752 | 0.414 | −0.413 | 0.4986 | 0.408 | 0.700 | 0.4779 | 0.143 | −0.488 | 0.1686 | 0.004 |
| GDS score (no depression; reference: depression) | −0.228 | 1.0013 | 0.820 | −0.124 | 0.4065 | 0.760 | 0.028 | 0.5409 | 0.959 | −0.313 | 0.5190 | 0.546 | 0.181 | 0.1839 | 0.324 |
| Demographic and Health Variables | DQI-I | Variety | Adequacy | Moderation | Balance | ||||||||||
|---|---|---|---|---|---|---|---|---|---|---|---|---|---|---|---|
| B | Std. Error | p-Value | B | Std. Error | p-Value | B | Std. Error | p-Value | B | Std. Error | p-Value | B | Std. Error | p-Value | |
| Age, (<80 years; reference: 80+ years) | −1.838 | 1.3889 | 0.186 | −0.344 | 0.5442 | 0.527 | −0.754 | 0.7696 | 0.327 | −0.600 | 0.6749 | 0.374 | −1.404 | 2.4930 | 0.573 |
| Sex (male; reference: female) | −0.732 | 1.4186 | 0.606 | −0.112 | 0.5537 | 0.840 | 0.697 | 0.7826 | 0.373 | −1.763 | 0.6726 | 0.009 | 4.461 | 2.5103 | 0.076 |
| Ethnic group (European; reference: non-European) | −0.733 | 2.4075 | 0.761 | 0.019 | 0.9393 | 0.983 | 0.098 | 1.3309 | 0.941 | −1.502 | 1.1601 | 0.195 | 6.520 | 4.2694 | 0.127 |
| Education level (primary; reference: tertiary) | 0.734 | 4.4166 | 0.868 | 1.427 | 1.7175 | 0.406 | 0.094 | 2.4257 | 0.969 | 0.542 | 2.1298 | 0.799 | −13.295 | 7.8215 | 0.089 |
| (Secondary; reference: tertiary) | −0.736 | 1.4238 | 0.605 | −0.325 | 0.5537 | 0.557 | −1.146 | 0.7820 | 0.143 | 0.896 | 0.6866 | 0.192 | −1.615 | 2.5214 | 0.522 |
| Live with (alone; reference: others) | 2.731 | 1.4060 | 0.052 | 1.038 | 0.5488 | 0.058 | 1.034 | 0.7822 | 0.186 | 0.956 | 0.6851 | 0.163 | −2.985 | 2.5313 | 0.238 |
| Deprivation (low; reference: high) | 2.422 | 1.7735 | 0.172 | 0.049 | 0.6975 | 0.943 | 1.910 | 0.9638 | 0.047 | 0.030 | 0.8638 | 0.972 | 4.318 | 3.1674 | 0.173 |
| (Medium; reference: high) | 2.507 | 1.7245 | 0.146 | 0.106 | 0.6782 | 0.876 | 2.570 | 0.9372 | 0.006 | −0.630 | 0.8400 | 0.453 | 4.612 | 3.0799 | 0.134 |
| Medical conditions (1; reference: 2+) | −1.263 | 1.5795 | 0.424 | −0.183 | 0.6172 | 0.767 | −0.657 | 0.8731 | 0.452 | −0.709 | 0.7646 | 0.354 | 2.858 | 2.8181 | 0.311 |
| Vision (impaired; reference: non impaired) | −4.390 | 2.7860 | 0.115 | −1.730 | 1.0865 | 0.111 | −0.623 | 1.5515 | 0.688 | −1.651 | 1.3539 | 0.223 | −3.856 | 5.0079 | 0.441 |
| Hearing (impaired; reference: non impaired) | 1.092 | 2.4885 | 0.661 | −0.430 | 0.9706 | 0.658 | 0.514 | 1.3755 | 0.709 | 1.280 | 1.2017 | 0.287 | −2.720 | 4.4429 | 0.540 |
| BMI, kg/m2 | −0.001 | 0.1381 | 0.994 | 0.066 | 0.0535 | 0.220 | 0.125 | 0.0757 | 0.098 | −0.153 | 0.0657 | 0.020 | −0.388 | 0.2447 | 0.113 |
| Waist circumference, cm | 0.046 | 0.0558 | 0.406 | 0.028 | 0.0217 | 0.199 | 0.082 | 0.0298 | 0.006 | −0.059 | 0.0268 | 0.029 | −0.050 | 0.1007 | 0.618 |
| Medications (1; reference: 2+) | −2.636 | 2.0071 | 0.189 | 0.090 | 0.7873 | 0.909 | −1.769 | 1.1062 | 0.110 | −0.823 | 0.9755 | 0.399 | −1.339 | 3.6044 | 0.710 |
| Supplements (0; reference: 1+) | −0.095 | 1.4198 | 0.947 | −0.367 | 0.5530 | 0.507 | −0.393 | 0.7840 | 0.616 | 0.121 | 0.6877 | 0.860 | 5.436 | 2.4976 | 0.030 |
| Alcohol consumption (never; reference: regular) | −2.726 | 1.8244 | 0.135 | −0.643 | 0.7194 | 0.371 | −1.759 | 1.0080 | 0.081 | 0.045 | 0.8956 | 0.960 | −3.688 | 3.2937 | 0.263 |
| (Occasional; reference: regular) | 1.112 | 1.5913 | 0.485 | 0.185 | 0.6275 | 0.768 | 0.318 | 0.8793 | 0.718 | 0.614 | 0.7812 | 0.432 | −0.049 | 2.8729 | 0.986 |
| Smoking (non-smoker; reference: smoker) | 5.788 | 8.5987 | 0.501 | 1.192 | 3.3576 | 0.723 | 5.772 | 4.7360 | 0.223 | −0.797 | 4.1710 | 0.849 | −3.793 | 15.3810 | 0.805 |
| NEADL score | 0.057 | 0.2766 | 0.836 | 0.009 | 0.1079 | 0.935 | 0.006 | 0.1529 | 0.969 | 0.063 | 0.1339 | 0.638 | −0.207 | 0.4940 | 0.676 |
| SPPB score | −0.080 | 0.3031 | 0.791 | 0.049 | 0.1182 | 0.681 | −0.035 | 0.1675 | 0.836 | −0.112 | 0.1466 | 0.444 | 0.179 | 0.5414 | 0.740 |
| MoCA score (not impaired; reference: impaired) | 1.281 | 1.7996 | 0.477 | 0.604 | 0.6973 | 0.386 | 0.868 | 0.9930 | 0.382 | 0.050 | 0.8717 | 0.954 | −2.413 | 3.2173 | 0.453 |
| GDS score (no depression; reference: depression) | 0.079 | 1.8228 | 0.965 | 0.909 | 0.7071 | 0.199 | −0.094 | 1.0073 | 0.926 | −0.783 | 0.8807 | 0.374 | 0.474 | 3.2561 | 0.884 |
| Demographic and Health Variables | DQI-I | Variety | Adequacy | Moderation | Balance | ||||||||||
|---|---|---|---|---|---|---|---|---|---|---|---|---|---|---|---|
| B | Std. Error | p-Value | B | Std. Error | p-Value | B | Std. Error | p-Value | B | Std. Error | p-Value | B | Std. Error | p-Value | |
| Age, (<80 years; reference: 80+ years) | −1.252 | 0.8823 | 0.156 | −0.108 | 0.3431 | 0.753 | −0.157 | 0.4212 | 0.709 | −0.761 | 0.4480 | 0.090 | −2.258 | 1.6636 | 0.175 |
| Sex (male; reference: female) | −0.730 | 0.8991 | 0.417 | 0.603 | 0.3472 | 0.083 | −0.188 | 0.4282 | 0.661 | −1.190 | 0.4527 | 0.009 | 0.450 | 1.6962 | 0.791 |
| Ethnic group (European; reference: non-European) | 3.720 | 1.4864 | 0.012 | 0.680 | 0.5807 | 0.242 | 2.026 | 0.7053 | 0.004 | 0.864 | 0.7618 | 0.257 | 1.508 | 2.8284 | 0.594 |
| Education level (primary; reference: tertiary) | −0.399 | 2.5654 | 0.876 | −0.879 | 0.9930 | 0.376 | −2.029 | 1.2146 | 0.095 | 1.627 | 1.3014 | 0.211 | 8.825 | 4.8104 | 0.067 |
| (Secondary; reference: tertiary) | 0.228 | 0.9074 | 0.802 | −0.238 | 0.3512 | 0.499 | 0.190 | 0.4296 | 0.659 | 0.192 | 0.4603 | 0.676 | 0.836 | 1.7014 | 0.623 |
| Live with (alone; reference: others) | 0.805 | 0.8860 | 0.363 | −0.106 | 0.3439 | 0.757 | −0.237 | 0.4221 | 0.574 | 1.182 | 0.4461 | 0.008 | −0.335 | 1.6721 | 0.841 |
| Deprivation (low; reference: high) | 1.705 | 1.0818 | 0.115 | 0.750 | 0.4183 | 0.073 | 0.658 | 0.5155 | 0.202 | 0.020 | 0.5522 | 0.970 | 2.769 | 2.0418 | 0.175 |
| (Medium; reference: high) | 1.378 | 1.1286 | 0.222 | 0.821 | 0.4363 | 0.060 | 0.630 | 0.5378 | 0.241 | −0.238 | 0.5760 | 0.680 | 1.646 | 2.1300 | 0.440 |
| Medical conditions (1; reference: 2+) | 1.014 | 1.0485 | 0.333 | 0.256 | 0.4068 | 0.529 | 0.208 | 0.4997 | 0.677 | 0.369 | 0.5336 | 0.489 | 1.815 | 1.9767 | 0.359 |
| Vision (impaired; reference: non impaired) | 1.257 | 1.7273 | 0.467 | 0.031 | 0.6702 | 0.963 | 1.107 | 0.8205 | 0.177 | 0.562 | 0.8785 | 0.523 | −4.422 | 3.2490 | 0.173 |
| Hearing (impaired; reference: non impaired) | 2.267 | 1.7240 | 0.188 | 0.040 | 0.6702 | 0.953 | 1.069 | 0.8206 | 0.193 | 1.002 | 0.8772 | 0.254 | 1.581 | 3.2574 | 0.627 |
| BMI, kg/m2 | −0.171 | 0.1028 | 0.096 | 0.000 | 0.0399 | 0.991 | −0.011 | 0.0491 | 0.817 | −0.134 | 0.0520 | 0.010 | −0.249 | 0.1936 | 0.198 |
| Waist circumference, cm | −0.064 | 0.0367 | 0.083 | 0.013 | 0.0143 | 0.345 | −0.015 | 0.0175 | 0.383 | −0.056 | 0.0185 | 0.002 | −0.055 | 0.0695 | 0.428 |
| Medications (1; reference: 2+) | 0.726 | 1.6297 | 0.656 | 1.286 | 0.6278 | 0.041 | 0.122 | 0.7759 | 0.875 | −0.556 | 0.8283 | 0.502 | −1.265 | 3.0719 | 0.681 |
| Supplements (0; reference: 1+) | 0.053 | 0.8877 | 0.953 | −0.118 | 0.3441 | 0.733 | −0.017 | 0.4225 | 0.969 | −0.023 | 0.4514 | 0.960 | 2.096 | 1.6690 | 0.209 |
| Alcohol consumption (never; reference: regular) | 1.012 | 1.1664 | 0.386 | −0.817 | 0.4504 | 0.070 | 0.564 | 0.5548 | 0.309 | 0.581 | 0.5930 | 0.327 | 6.840 | 2.1656 | 0.002 |
| (Occasional; reference: regular) | 0.755 | 1.0085 | 0.454 | −0.405 | 0.3894 | 0.298 | 0.461 | 0.4797 | 0.337 | 0.311 | 0.5127 | 0.544 | 3.883 | 1.8724 | 0.038 |
| Smoking (non-smoker; reference: smoker) | 5.214 | 3.9235 | 0.184 | 2.823 | 1.5169 | 0.063 | 4.061 | 1.8586 | 0.029 | −3.235 | 1.9923 | 0.104 | 15.647 | 7.3633 | 0.034 |
| NEADL score | 0.266 | 0.2050 | 0.195 | 0.038 | 0.0796 | 0.632 | 0.164 | 0.0974 | 0.092 | 0.077 | 0.1044 | 0.462 | −0.132 | 0.3873 | 0.733 |
| SPPB score | 0.195 | 0.2209 | 0.377 | 0.135 | 0.0854 | 0.114 | 0.029 | 0.1052 | 0.784 | 0.047 | 0.1124 | 0.674 | −0.162 | 0.4167 | 0.697 |
| MoCA score (not impaired; reference: impaired) | −0.982 | 1.0486 | 0.349 | −0.505 | 0.4061 | 0.213 | −0.650 | 0.4985 | 0.192 | 0.777 | 0.5322 | 0.144 | −6.024 | 1.9498 | 0.002 |
| GDS score (no depression; reference: depression) | −0.397 | 1.1694 | 0.734 | −0.683 | 0.4518 | 0.131 | 0.037 | 0.5567 | 0.947 | −0.016 | 0.5948 | 0.979 | 2.647 | 2.1996 | 0.229 |
References
- Fried, L.P.; Tangen, C.M.; Walston, J.; Newman, A.B.; Hirsch, C.; Gottdiener, J.; Seeman, T.; Tracy, R.; Kop, W.J.; Burke, G.; et al. Frailty in Older Adults: Evidence for a Phenotype. J. Gerontol. Ser. A 2001, 56, M146–M157. [Google Scholar] [CrossRef] [PubMed]
- Rockwood, K.; Song, X.; MacKnight, C.; Bergman, H.; Hogan, D.B.; McDowell, I.; Mitnitski, A. A global clinical measure of fitness and frailty in elderly people. CMAJ 2005, 173, 489–495. [Google Scholar] [CrossRef] [PubMed]
- O’Caoimh, R.; Sezgin, D.; O’Donovan, M.R.; Molloy, D.W.; Clegg, A.; Rockwood, K.; Liew, A. Prevalence of frailty in 62 countries across the world: A systematic review and meta-analysis of population-level studies. Age Ageing 2020, 50, 96–104. [Google Scholar] [CrossRef] [PubMed]
- Barrett, P.; Twitchin, S.; Kletchko, S.; Ryan, F. The living environments of community-dwelling older people who become frail: Another look at the living standards of older New Zealanders survey. Soc. Policy J. N. Z. 2006, 28, 133–157. [Google Scholar]
- Verlaan, S.; Ligthart-Melis, G.C.; Wijers, S.L.J.; Cederholm, T.; Maier, A.B.; de van der Schueren, M.A.E. High Prevalence of Physical Frailty Among Community-Dwelling Malnourished Older Adults–A Systematic Review and Meta-Analysis. J. Am. Med. Dir. Assoc. 2017, 18, 374–382. [Google Scholar] [CrossRef]
- Hirani, V.; Naganathan, V.; Blyth, F.; Le Couteur, D.G.; Seibel, M.J.; Waite, L.M.; Handelsman, D.J.; Cumming, R.G. Longitudinal associations between body composition, sarcopenic obesity and outcomes of frailty, disability, institutionalisation and mortality in community-dwelling older men: The Concord Health and Ageing in Men Project. Age Ageing 2016, 46, 413–420. [Google Scholar] [CrossRef]
- Crow, R.S.; Lohman, M.C.; Titus, A.J.; Cook, S.B.; Bruce, M.L.; Mackenzie, T.A.; Bartels, S.J.; Batsis, J.A. Association of Obesity and Frailty in Older Adults: NHANES 1999–2004. J. Nutr. Health Aging 2019, 23, 138–144. [Google Scholar] [CrossRef]
- Villareal, D.T.; Banks, M.; Siener, C.; Sinacore, D.R.; Klein, S. Physical Frailty and Body Composition in Obese Elderly Men and Women. Obes. Res. 2004, 12, 913–920. [Google Scholar] [CrossRef]
- Woo, J.; Leung, J.; Kwok, T. BMI, Body Composition, and Physical Functioning in Older Adults. Obesity 2007, 15, 1886–1894. [Google Scholar] [CrossRef]
- Lang, P.O.; Michel, J.P.; Zekry, D. Frailty Syndrome: A Transitional State in a Dynamic Process. Gerontology 2009, 55, 539–549. [Google Scholar] [CrossRef]
- Wirt, A.; Collins, C.E. Diet quality—What is it and does it matter? Public Health Nutr. 2009, 12, 2473–2492. [Google Scholar] [CrossRef] [PubMed]
- Payette, H.; Shatenstein, B. Determinants of Healthy Eating in Community-dwelling Elderly People. Can. J. Public Health 2005, 96, S30–S35. [Google Scholar] [CrossRef]
- Thiele, S.; Mensink, G.B.M.; Beitz, R. Determinants of diet quality. Public Health Nutr. 2004, 7, 29–37. [Google Scholar] [CrossRef] [PubMed]
- Thorpe, M.G.; Milte, C.M.; Crawford, D.; McNaughton, S.A. A Revised Australian Dietary Guideline Index and Its Association with Key Sociodemographic Factors, Health Behaviors and Body Mass Index in Peri-Retirement Aged Adults. Nutrients 2016, 8, 160. [Google Scholar] [CrossRef] [PubMed]
- Huang, C.H.; Okada, K.; Matsushita, E.; Uno, C.; Satake, S.; Arakawa Martins, B.; Kuzuya, M. Sex-Specific Association between Social Frailty and Diet Quality, Diet Quantity, and Nutrition in Community-Dwelling Elderly. Nutrients 2020, 12, 2845. [Google Scholar] [CrossRef]
- Host, A.; McMahon, A.-T.; Walton, K.; Charlton, K. Factors Influencing Food Choice for Independently Living Older People—A Systematic Literature Review. J. Nutr. Gerontol. Geriatr. 2016, 35, 67–94. [Google Scholar] [CrossRef]
- Bloom, I.; Edwards, M.; Jameson, K.A.; Syddall, H.E.; Dennison, E.; Gale, C.R.; Baird, J.; Cooper, C.; Sayer, A.A.; Robinson, S. Influences on diet quality in older age: The importance of social factors. Age Ageing 2017, 46, 277–283. [Google Scholar] [CrossRef]
- Atkins, J.L.; Ramsay, S.E.; Whincup, P.H.; Morris, R.W.; Lennon, L.T.; Wannamethee, S.G. Diet quality in older age: The influence of childhood and adult socio-economic circumstances. Br. J. Nutr. 2015, 113, 1441–1452. [Google Scholar] [CrossRef]
- Bailey, R.L.; Harris Ledikwe, J.; Smiciklas-Wright, H.; Mitchell, D.C.; Jensen, G.L. Persistent oral health problems associated with comorbidity and impaired diet quality in older adults. J. Am. Diet. Assoc. 2004, 104, 1273–1276. [Google Scholar] [CrossRef]
- Deierlein, A.L.; Morland, K.B.; Scanlin, K.; Wong, S.; Spark, A. Diet Quality of Urban Older Adults Age 60 to 99 Years: The Cardiovascular Health of Seniors and Built Environment Study. J. Acad. Nutr. Diet. 2014, 114, 279–287. [Google Scholar] [CrossRef]
- Schoufour, J.D.; de Jonge, E.A.L.; Kiefte-de Jong, J.C.; van Lenthe, F.J.; Hofman, A.; Nunn, S.P.T.; Franco, O.H. Socio-economic indicators and diet quality in an older population. Maturitas 2018, 107, 71–77. [Google Scholar] [CrossRef]
- de Souza Fernandes, D.P.; Duarte, M.S.L.; Pessoa, M.C.; do Carmo Castro Franceschini, S.; Ribeiro, A.Q. Evaluation of diet quality of the elderly and associated factors. Arch. Gerontol. Geriatr. 2017, 72, 174–180. [Google Scholar] [CrossRef] [PubMed]
- Freitas, T.; Previdelli, A.; Ferreira, M.; Marques, K.; Goulart, R.; Aquino, R. Factors associated with diet quality of older adults. Rev. Nutr. 2017, 30, 297–306. [Google Scholar] [CrossRef]
- Park, S.; Kim, H.J.; Kim, K. Do Where the Elderly Live Matter? Factors Associated with Diet Quality among Korean Elderly Population Living in Urban Versus Rural Areas. Nutrients 2020, 12, 1314. [Google Scholar] [CrossRef]
- Bloom, I.; Lawrence, W.; Barker, M.; Baird, J.; Dennison, E.; Sayer, A.A.; Cooper, C.; Robinson, S. What influences diet quality in older people? A qualitative study among community-dwelling older adults from the Hertfordshire Cohort Study, U.K. Public Health Nutr. 2017, 20, 2685–2693. [Google Scholar] [CrossRef] [PubMed]
- Nohan, A.F.; Adznam, S.N.A.; Jamaluddin, R.; Norazman, C.W. Diet quality and its associated factors among community dwelling older adults in urban district in Kuala Lumpur, Malaysia. Malays. J. Med. Health Sci. 2020, 16, 153–162. [Google Scholar]
- Wong, J.E.; Haszard, J.J.; Howe, A.S.; Parnell, W.R.; Skidmore, P.M.L. Development of a Healthy Dietary Habits Index for New Zealand Adults. Nutrients 2017, 9, 454. [Google Scholar] [CrossRef]
- Kim, C.-O. Food choice patterns among frail older adults: The associations between social network, food choice values, and diet quality. Appetite 2016, 96, 116–121. [Google Scholar] [CrossRef]
- Tay, E.; Barnett, D.; Leilua, E.; Kerse, N.; Rowland, M.; Rolleston, A.; Waters, D.L.; Edlin, R.; Connolly, M.; Hale, L.; et al. The Diet Quality and Nutrition Inadequacy of Pre-Frail Older Adults in New Zealand. Nutrients 2021, 13, 2384. [Google Scholar] [CrossRef]
- Teh, R.; Kerse, N.; Waters, D.L.; Hale, L.; Pillai, A.; Leilua, E.; Tay, E.; Rolleston, A.; Edlin, R.; Maxted, E.; et al. Study protocol of a randomised controlled trial to examine the impact of a complex intervention in pre-frail older adults. Aging Clin. Exp. Res. 2019, 31, 1407–1417. [Google Scholar] [CrossRef]
- Statistics New Zealand. National and Subnational Period Life Tables: 2017–2019; New Zealand Government: Wellington, New Zealand, 2021. [Google Scholar]
- Simpson, E.; Bradley, J.; Poliakov, I.; Jackson, D.; Olivier, P.; Adamson, A.J.; Foster, E. Iterative Development of an Online Dietary Recall Tool: INTAKE24. Nutrients 2017, 9, 118. [Google Scholar] [CrossRef] [PubMed]
- Dietary Intake Data were Collected Using Intake24.org (NZ 2018): An Open Source Dietary Assessment Research Tool, Freely Available to Researchers, Maintained and Developed by the Nutrition Measurement Platform, MRC Epidemiology Unit, University of Cambridge, in Collaboration with Open Lab, Newcastle University. Available online: https://www.mrc-epid.cam.ac.uk/research/measurement-platform/dietary-assessment/intake24/ (accessed on 20 August 2023).
- Adamson, A.; Davies, K.; Wham, C.; Kepa, M.; Foster, E.; Jones, A.; Mathers, J.; Granic, A.; Teh, R.; Moyes, S.; et al. Assessment of Dietary Intake in Three Cohorts of Advanced Age in Two Countries: Methodology Challenges. J. Nutr. Health Aging 2023, 27, 59–66. [Google Scholar] [CrossRef] [PubMed]
- Sivakumaran, S.; Huffman, L.; Gilmore, Z.; Sivakumaran, S. New Zealand FOODfiles 2016 Manual; The New Zealand Institute for Plant & Food Research Limited and Ministry of Health: Auckland, New Zealand, 2017. [Google Scholar]
- Kim, S.; Haines, P.S.; Siega-Riz, A.M.; Popkin, B.M. The Diet Quality Index-International (DQI-I) Provides an Effective Tool for Cross-National Comparison of Diet Quality as Illustrated by China and the United States. J. Nutr. 2003, 133, 3476–3484. [Google Scholar] [CrossRef]
- Chan, R.; Leung, J.; Woo, J. Dietary Patterns and Risk of Frailty in Chinese Community-Dwelling Older People in Hong Kong: A Prospective Cohort Study. Nutrients 2015, 7, 7070–7084. [Google Scholar] [CrossRef] [PubMed]
- Lemon, S.C.; Roy, J.; Clark, M.A.; Friedmann, P.D.; Rakowski, W. Classification and regression tree analysis in public health: Methodological review and comparison with logistic regression. Ann. Behav. Med. 2003, 26, 172–181. [Google Scholar] [CrossRef]
- Pereira, M.H.Q.; Pereira, M.L.A.S.; Campos, G.C.; Molina, M.C.B. Food insecurity and nutritional status among older adults: A systematic review. Nutr. Rev. 2021, 80, 631–644. [Google Scholar] [CrossRef]
- Wham, C.A.; Teh, R.; Moyes, S.; Dyall, L.; Kepa, M.; Hayman, K.; Kerse, N. Health and social factors associated with nutrition risk: Results from life and living in advanced age: A cohort study in New Zealand (LILACS NZ). J. Nutr. Health Aging 2015, 19, 637–645. [Google Scholar] [CrossRef]
- O’Keeffe, M.; Kelly, M.; O’Herlihy, E.; O’Toole, P.W.; Kearney, P.M.; Timmons, S.; O’Shea, E.; Stanton, C.; Hickson, M.; Rolland, Y.; et al. Potentially modifiable determinants of malnutrition in older adults: A systematic review. Clin. Nutr. Off. J. Eur. Soc. Parenter. Enter. Nutr. 2019, 38, 2477–2498. [Google Scholar] [CrossRef]
- Choi, Y.J.; Ailshire, J.A.; Crimmins, E.M. Living alone, social networks in neighbourhoods, and daily fruit and vegetable consumption among middle-aged and older adults in the USA. Public Health Nutr. 2020, 23, 3315–3323. [Google Scholar] [CrossRef]
- Lane, K.; Poland, F.; Fleming, S.; Lambert, N.; Macdonald, H.; Potter, J.; Raats, M.; Skidmore, P.; Vince, C.; Wellings, A.; et al. Older women’s reduced contact with food in the Changes Around Food Experience (CAFE) study: Choices, adaptations and dynamism. Ageing Soc. 2014, 34, 645–669. [Google Scholar] [CrossRef]
- Breslow, R.A.; Guenther, P.M.; Smothers, B.A. Alcohol Drinking Patterns and Diet Quality: The 1999–2000 National Health and Nutrition Examination Survey. Am. J. Epidemiol. 2006, 163, 359–366. [Google Scholar] [CrossRef]
- MacLean, R.R.; Cowan, A.; Vernarelli, J.A. More to gain: Dietary energy density is related to smoking status in US adults. BMC Public Health 2018, 18, 365. [Google Scholar] [CrossRef] [PubMed]
- Alkerwi Aa Baydarlioglu, B.; Sauvageot, N.; Stranges, S.; Lemmens, P.; Shivappa, N.; Hébert, J.R. Smoking status is inversely associated with overall diet quality: Findings from the ORISCAV-LUX study. Clin. Nutr. 2017, 36, 1275–1282. [Google Scholar] [CrossRef] [PubMed]
- Shatenstein, B.; Ferland, G.; Belleville, S.; Gray-Donald, K.; Kergoat, M.-J.; Morais, J.; Gaudreau, P.; Payette, H.; Greenwood, C. Diet quality and cognition among older adults from the NuAge study. Exp. Gerontol. 2012, 47, 353–360. [Google Scholar] [CrossRef]
- Livingston, G.; Huntley, J.; Sommerlad, A.; Ames, D.; Ballard, C.; Banerjee, S.; Brayne, C.; Burns, A.; Cohen-Mansfield, J.; Cooper, C.; et al. Dementia prevention, intervention, and care: 2020 report of the Lancet Commission. Lancet 2020, 396, 413–446. [Google Scholar] [CrossRef] [PubMed]
- Zhao, H.; Andreyeva, T. Diet Quality and Health in Older Americans. Nutrients 2022, 14, 1198. [Google Scholar] [CrossRef] [PubMed]
- Ward, R.E.; Orkaby, A.R.; Chen, J.; Hshieh, T.T.; Driver, J.A.; Gaziano, J.M.; Djousse, L. Association between Diet Quality and Frailty Prevalence in the Physicians’ Health Study. J. Am. Geriatr. Soc. 2020, 68, 770–776. [Google Scholar] [CrossRef]
- Feart, C. Nutrition and frailty: Current knowledge. Prog. Neuro-Psychopharmacol. Biol. Psychiatry 2019, 95, 109703. [Google Scholar] [CrossRef]
- Wray, C.M.; Byers, A.L. Methodological Progress Note: Classification and Regression Tree Analysis. J. Hosp. Med. 2020, 15, 549–551. [Google Scholar] [CrossRef]
- Aguayo, G.A.; Donneau, A.-F.; Vaillant, M.T.; Schritz, A.; Franco, O.H.; Stranges, S.; Malisoux, L.; Guillaume, M.; Witte, D.R. Agreement Between 35 Published Frailty Scores in the General Population. Am. J. Epidemiol. 2017, 186, 420–434. [Google Scholar] [CrossRef]
- University of Otago and Ministry of Health. A Focus on Nutrition: Key Findings of the 2008/09 New Zealand Adult Nutrition Survey; Ministry of Health: Wellington, New Zealand, 2011. [Google Scholar]
- Adamson, A.J.; Collerton, J.; Davies, K.; Foster, E.; Jagger, C.; Stamp, E.; Mathers, J.C.; Kirkwood, T.; Newcastle 85+ Study Core Team. Nutrition in advanced age: Dietary assessment in the Newcastle 85+ study. Eur. J. Clin. Nutr. 2009, 63, S6–S18. [Google Scholar] [CrossRef] [PubMed]
- Statistics New Zealand. Ethnic Group by Age and Sex, for the Census Usually Resident Population Count, 2013 and 2018 Census. Available online: https://nzdotstat.stats.govt.nz/wbos/Index.aspx?DataSetCode=TABLECODE8320 (accessed on 20 August 2023).
| Characteristics | All (n = 465) |
|---|---|
| Age, n (% ≥80 years) | 242 (52.0) |
| Sex, n (% female) | 275 (59.1) |
| Ethnic group a, n (% European/ Pākehā) | 421 (90.5) |
| Education level, n (%) | |
| Primary | 14 (3.0) |
| Secondary | 256 (55.1) |
| Tertiary | 195 (41.9) |
| Living arrangement, n (%) | |
| Alone | 204 (43.9) |
| With others | 261 (56.1) |
| NZ Dep Index 2018, n (%) | |
| Low, 1–4 | 174 (37.4) |
| Medium, 5–7 | 159 (34.2) |
| High, 8–10 | 132 (28.4) |
| Medical conditions, n (%) | |
| 0–1 | 112 (24.1) |
| ≥2 | 353 (75.9) |
| Vision, n (% impaired) | 32 (6.9) |
| Hearing, n (% impaired) | 35 (7.5) |
| BMI (kg/m2) median (IQR) | 28.3 (25.3–31.4) |
| Waist circumference (cm) median (IQR) | |
| Male | 102.5 (95.8–109.5) |
| Female | 93.8 (85.4–101.9) |
| Medications, n (%) | |
| 1 | 46 (9.9) |
| ≥2 | 419 (90.1) |
| Supplements, n (%) | |
| 0 | 261 (56.1) |
| ≥1 | 204 (43.9) |
| Alcohol consumption, n (%) | |
| Never | 111 (23.9) |
| Occasional | 187 (40.2) |
| Regular | 167 (35.9) |
| Smoking, n (% smoker) | 5 (1.1) |
| NEADL score, median (IQR) | 20 (18–21) |
| SPPB score, median (IQR) | 9 (8–10) |
| MoCA, median (IQR) | 25 (23–27) |
| Cognitive impairment (MoCA score ≤22), n (%) | 100 (21.5) |
| Total DQI-I scores, median (IQR) | 60 (11) |
| Variety, median (IQR) | 14 (5) |
| Adequacy, median (IQR) | 30 (7) |
| Moderation, median (IQR) | 12 (6) |
| Balance, median (IQR) | 7 (2) |
| Demographic and Health Variables | B | 95% CI | p-Value |
|---|---|---|---|
| DQI-I total score | |||
| Age (<80 year; reference: 80+ years) | −0.99 | −2.55, 0.57 | 0.213 |
| NZ Dep Index 2018 (low; reference: high) | 2.14 | 0.29, 3.99 | 0.024 |
| (Medium; reference: high) | 1.49 | −0.39, 3.37 | 0.121 |
| Living arrangement: Live alone; reference: with others | 1.60 | 0.06, 3.15 | 0.042 |
| BMI, kg/m2 | −0.17 | −0.33, −0.02 | 0.026 |
| Smoking (reference: smoker) | 5.91 | −1.22, 13.03 | 0.104 |
| NEADL | 64.32 | 56.53, 73.20 | 0.164 |
| Variety score | |||
| Deprivation (low; reference: high) | 0.38 | −0.37, 1.14 | 0.320 |
| (Medium; reference: high) | 0.28 | −0.49, 1.04 | 0.478 |
| BMI, kg/m2 | −0.06 | −0.12, 0.01 | 0.068 |
| Alcohol consumption (never; reference: regular) | −0.84 | −1.65, −0.04 | 0.040 |
| (Occasional; reference: regular) | −0.23 | −0.93, 0.47 | 0.526 |
| Smoking (reference: smoker) | 2.71 | −0.20, 5.63 | 0.068 |
| SPPB score | 0.13 | −0.02, 0.27 | 0.086 |
| Adequacy score | |||
| (Intercept) | 26.378 | 21.657, 31.099 | <0.001 |
| Deprivation (low; reference: high) | 1.08 | 0.09, 2.07 | 0.033 |
| (Medium; reference: high) | 0.97 | −0.04, 1.97 | 0.060 |
| BMI, kg/m2 | −0.10 | −0.181, −0.018 | 0.016 |
| Smoking (non-smoker; reference: smoker) | 3.92 | 0.08, 7.75 | 0.045 |
| Medications (1; reference: 2+) | −1.54 | −2.87, −0.20 | 0.025 |
| NEADL | 0.15 | −0.03, 0.32 | 0.093 |
| Moderation score | |||
| Age, (<80 years; reference: 80+ years) | −0.65 | −1.41, 0.11 | 0.095 |
| Sex (male; reference: female) | −1.41 | −2.18, −0.63 | <0.001 |
| Balance score | |||
| Deprivation (low; reference: high) | 0.28 | −0.06, 0.62 | 0.104 |
| (Medium; reference: high) | 0.29 | −0.05, 0.64 | 0.092 |
| Supplement (no, reference: yes) | 0.31 | 0.04, 0.59 | 0.023 |
| Alcohol consumption (never; reference: regular) | 0.38 | 0.02, 0.73 | 0.039 |
| (Occasional; reference: regular) | 0.28 | −0.02, 0.59 | 0.072 |
| MoCA score (not impaired; reference: impaired) | −0.49 | −0.82, −0.16 | 0.003 |
Disclaimer/Publisher’s Note: The statements, opinions and data contained in all publications are solely those of the individual author(s) and contributor(s) and not of MDPI and/or the editor(s). MDPI and/or the editor(s) disclaim responsibility for any injury to people or property resulting from any ideas, methods, instructions or products referred to in the content. |
© 2023 by the authors. Licensee MDPI, Basel, Switzerland. This article is an open access article distributed under the terms and conditions of the Creative Commons Attribution (CC BY) license (https://creativecommons.org/licenses/by/4.0/).
Share and Cite
Tay, E.; Barnett, D.; Rowland, M.; Kerse, N.; Edlin, R.; Waters, D.L.; Connolly, M.; Pillai, A.; Tupou, E.; Teh, R. Sociodemographic and Health Indicators of Diet Quality in Pre-Frail Older Adults in New Zealand. Nutrients 2023, 15, 4416. https://doi.org/10.3390/nu15204416
Tay E, Barnett D, Rowland M, Kerse N, Edlin R, Waters DL, Connolly M, Pillai A, Tupou E, Teh R. Sociodemographic and Health Indicators of Diet Quality in Pre-Frail Older Adults in New Zealand. Nutrients. 2023; 15(20):4416. https://doi.org/10.3390/nu15204416
Chicago/Turabian StyleTay, Esther, Daniel Barnett, Maisie Rowland, Ngaire Kerse, Richard Edlin, Debra L. Waters, Martin Connolly, Avinesh Pillai, Evelingi Tupou, and Ruth Teh. 2023. "Sociodemographic and Health Indicators of Diet Quality in Pre-Frail Older Adults in New Zealand" Nutrients 15, no. 20: 4416. https://doi.org/10.3390/nu15204416