The Serum Metabolite Response to Diet Intervention with Probiotic Acidified Milk in Irritable Bowel Syndrome Patients Is Indistinguishable from that of Non-Probiotic Acidified Milk by 1H NMR-Based Metabonomic Analysis


Abstract
:1. Introduction
2. Experimental Section
2.1. Study participants and design
2.2. Dietary treatment and sample collection

| Nutrient | GDL milk product b | Probiotic milk product c |
|---|---|---|
| Energy, kJ/(kg body wt) d | ||
| Baseline | 31.07 ± 1.57 | 28.25 ± 1.50 |
| Post treatment | 27.78 ± 1.86 * | 24.24 ± 1.25 * |
| Protein, g/(kg body wt) | ||
| Baseline | 1.22 ± 0.08 | 1.12 ± 0.05 |
| Post treatment | 1.04 ± 0.07 * | 0.95 ± 0.04 * |
| Fat, g/(kg body wt) | ||
| Baseline | 1.21 ± 0.09 | 1.04 ± 0.07 |
| Post treatment | 0.98 ± 0.09 * | 0.89 ± 0.05 * |
| Carbohydrates, g/(kg body wt) | ||
| Baseline | 3.62 ± 0.18 | 3.34 ± 0.19 |
| Post treatment | 3.31 ± 0.23 * | 2.89 ± 0.19 * |
| Calcium, mg/(kg body wt) | ||
| Baseline | 16.06 ± 1.19 | 13.71 ± 1.14 |
| Post treatment | 12.68 ± 1.24 * | 10.07 ± 1.00 * |
| Fiber, g/(kg body wt) | ||
| Baseline | 0.31 ± 0.02 | 0.26 ± 0.01 |
| Post treatment | 0.26 ± 0.03 * | 0.21 ± 0.01 * |
| Weight, kg | ||
| Baseline | 73.13 ± 2.58 | 72.17 ± 2.74 |
| Post treatment | 74.11 ± 2.75 * | 72.51 ± 2.74 |
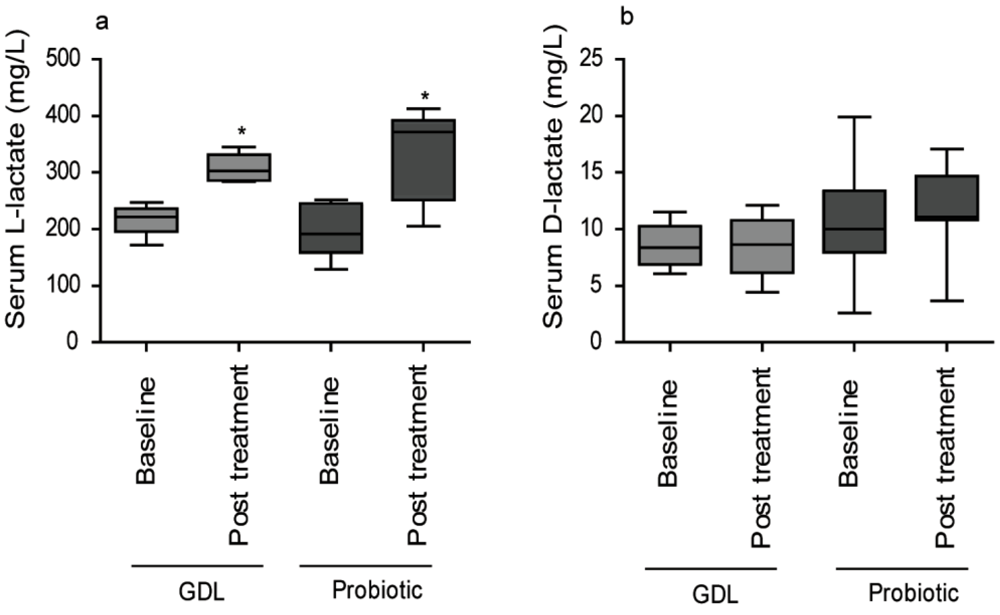
2.3. D- and L-lactate measurements
2.4. Sample preparation and 1H NMR analysis
2.5. Data processing and statistical analysis
3. Results
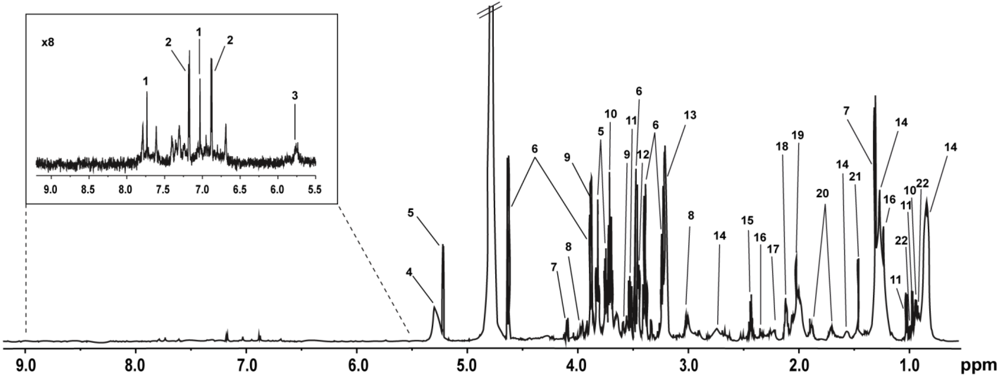
| Key | Metabolite | δ 1H (multiplicity) | Moieties |
|---|---|---|---|
| 1 | Histidine | 7.74 (s), 7.03 (s) | CH, CH |
| 2 | Tyrosine | 7.17 (m), 6.87 (m) | CH, CH |
| 3 | Urea | 5.76 (s) | NH2 |
| 4 | Unsaturated lipids in serum | 5.28 (m) | -CH=CH- |
| 5 | α-Glucose | 5.22 (d), 3.82 (m), 3.71 (t), 3.52 (d) | C-H1, C-H6, C-H3, C-H2 |
| 6 | β-Glucose | 4.63 (d), 3.89 (d), 3.47 (d), 3.40 (t), 3.23 (d) | C-H1, C-H6, C-H5, C-H4, C-H2 |
| 7 | Lactate | 4.10 (q), 1.32 (d) | αCH, βCH3 |
| 8 | Creatine | 3.92 (s), 3.04 (s) | CH2, NCH3 |
| 9 | Glycerol | 3.88 (m), 3.65 (d) | CH, CH2 |
| 10 | Leucine | 3.70 (m), 0.96 (d) | αCH, γCH3 |
| 11 | Valine | 3.60 (d), 1.03 (d), 0.97 (d) | αCH, γCH3, δCH3 |
| 12 | Proline | 3.44 (t) | δCH2 |
| 13 | Choline | 3.21 (s) | N(CH3)3 |
| 14 | Lipid | 2.73 (m), 1.56 (m), 1.25 (m), 0.84 (m) | C=CCH2C=C, CH2CH2CO, (CH2)n, CH3(CH2)n |
| 15 | Glutamine | 2.43 (m) | γCH2 |
| 16 | 3-hydroxybutyrate | 2.34 (m), 1.20 (d) | αCH2, βCH3 |
| 17 | Acetoacetate | 2.21 (s) | CH3 |
| 18 | Glutamate | 2.10 (m) | βCH2 |
| 19 | N-acetyl glycoproteins | 2.03 (s) | CH3 |
| 20 | Lysine | 1.88 (m), 1.72 (m) | βCH2, δCH2 |
| 21 | Alanine | 1.46 (d) | βCH3 |
| 22 | Isoleucine | 0.99 (t) | βCH3 |


4. Discussion
5. Conclusions
Declare
Acknowledgements
Supplementary Files
References
- Drossman, D.A.; Camilleri, M.; Mayer, E.A.; Whitehead, W.E. AGA technical review on irritable bowel syndrome. Gastroenterology 2002, 123 (6), 2108–2131. [Google Scholar] [CrossRef] [PubMed]
- Akehurst, R.; Kaltenthaler, E. Treatment of irritable bowel syndrome: A review of randomised controlled trials. Gut 2001, 48 (2), 272–282. [Google Scholar] [CrossRef] [PubMed]
- Foxx-Orenstein, A. IBS—review and what’s new. MedGenMed 2006, 8 (3), 20. [Google Scholar]
- Kim, H.J.; Camilleri, M.; McKinzie, S.; Lempke, M.B.; Burton, D.D.; Thomforde, G.M.; Zinsmeister, A.R. A randomized controlled trial of a probiotic, VSL#3, on gut transit and symptoms in diarrhoea-predominant irritable bowel syndrome. Aliment. Pharmacol. Ther. 2003, 17 (7), 895–904. [Google Scholar] [CrossRef] [PubMed]
- Gosselink, M.P.; Schouten, W.R.; van Lieshout, L.M.; Hop, W.C.; Laman, J.D.; Ruseler-van Embden, J.G. Delay of the first onset of pouchitis by oral intake of the probiotic strain Lactobacillus rhamnosus GG. Dis. Colon Rectum 2004, 47 (6), 876–884. [Google Scholar] [PubMed]
- Gionchetti, P.; Rizzello, F.; Helwig, U.; Venturi, A.; Lammers, K.M.; Brigidi, P.; Vitali, B.; Poggioli, G.; Miglioli, M.; Campieri, M. Prophylaxis of pouchitis onset with probiotic therapy: A double-blind, placebo-controlled trial. Gastroenterology 2003, 124 (5), 1202–1209. [Google Scholar] [PubMed]
- Niedzielin, K.; Kordecki, H.; Birkenfeld, B. A controlled, double-blind, randomized study on the efficacy of Lactobacillus plantarum 299V in patients with irritable bowel syndrome. Eur. J. Gastroenterol. Hepatol. 2001, 13 (10), 1143–1147. [Google Scholar] [CrossRef] [PubMed]
- Kajander, K.; Hatakka, K.; Poussa, T.; Farkkila, M.; Korpela, R. A probiotic mixture alleviates symptoms in irritable bowel syndrome patients: A controlled 6-month intervention. Aliment. Pharmacol. Ther. 2005, 22 (5), 387–394. [Google Scholar] [CrossRef] [PubMed]
- Kajander, K.; Myllyluoma, E.; Rajilic-Stojanovic, M.; Kyronpalo, S.S.; Rasmussen, M.; Jarvenpaa, S.S.; Zoetendal, E.G.; de Vos, W.M.; Vapaatalo, H.; Korpela, R. Clinical trial: Multispecies probiotic supplementation alleviates the symptoms of IBS and stabilises intestinal microbiota. Aliment. Pharmacol. Ther. 2007, 27 (1), 48–57. [Google Scholar] [PubMed]
- Simren, M.; Ohman, L.; Olsson, J.; Svensson, U.; Ohlson, K.; Posserud, I.; Strid, H. Clinical trial: The effect of a fermented milk containing three probiotic bacteria in patients with irritable bowel syndrome (IBS)—a randomized, double-blind, controlled study. Aliment. Pharmacol. Ther. 2010, 31 (2), 218–227. [Google Scholar] [PubMed]
- Guyonnet, D.; Chassany, O.; Ducrotte, P.; Picard, C.; Mouret, M.; Mercier, C.H.; Matuchansky, C. Effect of a fermented milk containing Bifidobacterium animalis DN-173 010 on the health-related quality of life and symptoms in irritable bowel syndrome in adults in primary care: a multicentre, randomized, double-blind, controlled trial. Aliment. Pharmacol. Ther. 2007, 26 (3), 475–486. [Google Scholar] [CrossRef] [PubMed]
- Enck, P.; Klosterhalfen, S. The placebo response in functional bowel disorders: Perspectives and putative mechanisms. Neurogastroenterol. Motil. 2005, 17 (3), 325–331. [Google Scholar] [CrossRef] [PubMed]
- Pitz, M.; Cheang, M.; Bernstein, C.N. Defining the predictors of the placebo response in irritable bowel syndrome. Clin. Gastroenterol. Hepatol. 2005, 3 (3), 237–247. [Google Scholar] [CrossRef] [PubMed]
- Weljie, A.M.; Dowlatabadi, R.; Miller, B.J.; Vogel, H.J.; Jirik, F.R. An inflammatory arthritis-associated metabolite biomarker pattern revealed by 1H NMR spectroscopy. J. Proteome Res. 2007, 6 (9), 3456–3464. [Google Scholar] [PubMed]
- Slupsky, C.M.; Rankin, K.N.; Wagner, J.; Fu, H.; Chang, D.; Weljie, A.M.; Saude, E.J.; Lix, B.; Adamko, D.J.; Shah, S.; Greiner, R.; Sykes, B.D.; Marrie, T.J. Investigations of the effects of gender, diurnal variation, and age in human urinary metabolomic profiles. Anal. Chem. 2007, 79 (18), 6995–7004. [Google Scholar] [PubMed]
- Holmes, E.; Loo, R.L.; Stamler, J.; Bictash, M.; Yap, I.K.; Chan, Q.; Ebbels, T.; De Iorio, M.; Brown, I.J.; Veselkov, K.A.; Daviglus, M.L.; Kesteloot, H.; Ueshima, H.; Zhao, L.; Nicholson, J.K.; Elliott, P. Human metabolic phenotype diversity and its association with diet and blood pressure. Nature 2008, 453 (7193), 396–400. [Google Scholar] [PubMed]
- Lenz, E.M.; Wilson, I.D. Analytical strategies in metabonomics. J. Proteome Res. 2007, 6 (2), 443–458. [Google Scholar] [PubMed]
- Ersryd, A.; Posserud, I.; Abrahamsson, H.; Simren, M. Subtyping the irritable bowel syndrome by predominant bowel habit: Rome II versus Rome III. Aliment. Pharmacol. Ther. 2007, 26 (6), 953–961. [Google Scholar] [CrossRef] [PubMed]
- Francis, C.Y.; Morris, J.; Whorwell, P.J. The irritable bowel severity scoring system: A simple method of monitoring irritable bowel syndrome and its progress. Aliment. Pharmacol. Ther. 1997, 11 (2), 395–402. [Google Scholar] [PubMed]
- Bax, A.; Davis, D.G. MLEV-17-Based Two-Dimensional Homonuclear Magnetization Transfer Spectroscopy. J. Magn. Reson. 1985, 65, 355–360. [Google Scholar]
- Trygg, J.; Wold, S. O2-PLS, a two-block (X-Y) latent variable regression (LVR) method with an integral OSC filter. J. Chemom. 2003, 17 (1), 53–64. [Google Scholar] [CrossRef]
- Nicholson, J.K.; Foxall, P.J.; Spraul, M.; Farrant, R.D.; Lindon, J.C. 750 MHz 1H and 1H-13C NMR spectroscopy of human blood plasma. Anal. Chem. 1995, 67 (5), 793–811. [Google Scholar] [CrossRef] [PubMed]
- Fan, M. Metabolite profiling by one- and two-dimensional NMR analysis of complex mixtures. Prog. Nucl. Magn. Reson. Spectrosc. 1996, 28, 161–219. [Google Scholar]
- Lindon, J.C. NMR Spectroscopy on Biofluids. Annu. Rep. NMR Spectrosc. 1999, 38, 1–88. [Google Scholar]
- Tugnoli, V.; Mucci, A.; Schenetti, L.; Calabrese, C.; Di Febo, G.; Rossi, M.C.; Tosi, M.R. Molecular characterization of human gastric mucosa by HR-MAS magnetic resonance spectroscopy. Int. J. Mol. Med. 2004, 14 (6), 1065–1071. [Google Scholar] [PubMed]
- Wishart, D.S.; Tzur, D.; Knox, C.; Eisner, R.; Guo, A.C.; Young, N.; Cheng, D.; Jewell, K.; Arndt, D.; Sawhney, S.; et al. HMDB: The Human Metabolome Database. Nucleic Acids Res. 2007, 35, D521–D526. [Google Scholar] [PubMed]
- Connolly, E.; Lönnerdal, B. D(-)-Lactic acid producing bacteria—Safety to use in infant formulas. Nutrafoods 2004, 3 (3), 37–49. [Google Scholar]
- Ljungh, A.; Lan, J.; Yanagisawa, N. Isolation, selection and characteristics of Lactobacillus paracasei subsp. paracasei F19. Microb. Ecol. Health Dis. 2002, 14 (1), 4–6. [Google Scholar]
- Bergman, B.C.; Wolfel, E.E.; Butterfield, G.E.; Lopaschuk, G.D.; Casazza, G.A.; Horning, M.A.; Brooks, G.A. Active muscle and whole body lactate kinetics after endurance training in men. J. Appl. Physiol. 1999, 87 (5), 1684–1696. [Google Scholar] [PubMed]
- Van Hall, G.; Calbet, J.A.; Sondergaard, H.; Saltin, B. Similar carbohydrate but enhanced lactate utilization during exercise after 9 wk of acclimatization to 5,620 m. Am. J. Physiol. Endocrinol. Metab. 2002, 283 (6), E1203–E1213. [Google Scholar] [PubMed]
- Gladden, L.B. Lactate metabolism: A new paradigm for the third millennium. J. Physiol. 2004, 558 (1), 5–30. [Google Scholar] [CrossRef] [PubMed]
- Stanley, W.C.; Gertz, E.W.; Wisneski, J.A.; Neese, R.A.; Morris, D.L.; Brooks, G.A. Lactate extraction during net lactate release in legs of humans during exercise. J. Appl. Physiol. 1986, 60 (4), 1116–1120. [Google Scholar] [PubMed]
- Kreisberg, R.A. Lactate homeostasis and lactic acidosis. Ann. Intern. Med. 1980, 92 (2), 227–237. [Google Scholar] [PubMed]
- Eldridge, F.L.; T’So, L.; Chang, H. Relationship between turnover rate and blood concentration of lactate in normal dogs. J. Appl. Physiol. 1974, 37 (3), 316–320. [Google Scholar] [PubMed]
- Lloyd, S.; Brocks, C.; Chatham, J.C. Differential modulation of glucose, lactate, and pyruvate oxidation by insulin and dichloroacetate in the rat heart. Am. J. Physiol. Heart Circ. Physiol. 2003, 285 (1), H163–H172. [Google Scholar] [PubMed]
- Kelleher, J.K. Gluconeogenesis from labeled carbon: Estimating isotope dilution. Am. J. Physiol. 1986, 250 (3), E296–E305. [Google Scholar] [PubMed]
- Burgess, S.C.; Hausler, N.; Merritt, M.; Jeffrey, F.M.; Storey, C.; Milde, A.; Koshy, S.; Lindner, J.; Magnuson, M.A.; Malloy, C.R.; Sherry, A.D. Impaired tricarboxylic acid cycle activity in mouse livers lacking cytosolic phosphoenolpyruvate carboxykinase. J. Biol. Chem. 2004, 279 (47), 48941–48949. [Google Scholar] [PubMed]
- Spiller, R.C.; Jenkins, D.; Thornley, J.P.; Hebden, J.M.; Wright, T.; Skinner, M.; Neal, K.R. Increased rectal mucosal enteroendocrine cells, T lymphocytes, and increased gut permeability following acute Campylobacter enteritis and in post-dysenteric irritable bowel syndrome. Gut 2000, 47 (6), 804–811. [Google Scholar] [CrossRef] [PubMed]
- Marshall, J.K.; Thabane, M.; Garg, A.X.; Clark, W.; Meddings, J.; Collins, S.M. Intestinal permeability in patients with irritable bowel syndrome after a waterborne outbreak of acute gastroenteritis in Walkerton, Ontario. Aliment. Pharmacol. Ther. 2004, 20 (11-12), 1317–1322. [Google Scholar] [CrossRef] [PubMed]
- Dunlop, S.P.; Hebden, J.; Campbell, E.; Naesdal, J.; Olbe, L.; Perkins, A.C.; Spiller, R.C. Abnormal intestinal permeability in subgroups of diarrhea-predominant irritable bowel syndromes. Am. J. Gastroenterol. 2006, 101 (6), 1288–1294. [Google Scholar] [CrossRef] [PubMed]
- Gecse, K.; Roka, R.; Ferrier, L.; Leveque, M.; Eutamene, H.; Cartier, C.; Ait-Belgnaoui, A.; Rosztoczy, A.; Izbeki, F.; Fioramonti, J.; Wittmann, T.; Bueno, L. Increased faecal serine protease activity in diarrhoeic IBS patients: A colonic lumenal factor impairing colonic permeability and sensitivity. Gut 2008, 57 (5), 591–599. [Google Scholar] [PubMed]
- Piche, T.; Barbara, G.; Aubert, P.; Bruley des Varannes, S.; Dainese, R.; Nano, J.L.; Cremon, C.; Stanghellini, V.; De Giorgio, R.; Galmiche, J.P.; Neunlist, M. Impaired intestinal barrier integrity in the colon of patients with irritable bowel syndrome: Involvement of soluble mediators. Gut 2009, 58 (2), 196–201. [Google Scholar] [PubMed]
© 2010 by the authors; licensee MDPI, Basel, Switzerland This article is an open-access article distributed under the terms and conditions of the Creative Commons Attribution license (http://creativecommons.org/licenses/by/3.0/).
Share and Cite
Pedersen, S.M.M.; Nielsen, N.C.; Andersen, H.J.; Olsson, J.; Simrén, M.; Öhman, L.; Svensson, U.; Malmendal, A.; Bertram, H.C. The Serum Metabolite Response to Diet Intervention with Probiotic Acidified Milk in Irritable Bowel Syndrome Patients Is Indistinguishable from that of Non-Probiotic Acidified Milk by 1H NMR-Based Metabonomic Analysis. Nutrients 2010, 2, 1141-1155. https://doi.org/10.3390/nu2111141
Pedersen SMM, Nielsen NC, Andersen HJ, Olsson J, Simrén M, Öhman L, Svensson U, Malmendal A, Bertram HC. The Serum Metabolite Response to Diet Intervention with Probiotic Acidified Milk in Irritable Bowel Syndrome Patients Is Indistinguishable from that of Non-Probiotic Acidified Milk by 1H NMR-Based Metabonomic Analysis. Nutrients. 2010; 2(11):1141-1155. https://doi.org/10.3390/nu2111141
Chicago/Turabian StylePedersen, Simon M. M., Niels Chr. Nielsen, Henrik J. Andersen, Johan Olsson, Magnus Simrén, Lena Öhman, Ulla Svensson, Anders Malmendal, and Hanne C. Bertram. 2010. "The Serum Metabolite Response to Diet Intervention with Probiotic Acidified Milk in Irritable Bowel Syndrome Patients Is Indistinguishable from that of Non-Probiotic Acidified Milk by 1H NMR-Based Metabonomic Analysis" Nutrients 2, no. 11: 1141-1155. https://doi.org/10.3390/nu2111141