The Association between the Macronutrient Content of Maternal Diet and the Adequacy of Micronutrients during Pregnancy in the Women and Their Children’s Health (WATCH) Study

 ,
,
Abstract
:
1. Introduction
2. Experimental Section
2.1. Sample
2.2. Data Collection
2.3. Australian Food and Nutrient Recommendations
2.4. Statistical Analysis
3. Results

| Characteristic | Low P:NP ratio | Medium P:NP ratio | High P:NP ratio | All women |
|---|---|---|---|---|
| 0.21 (0.19, 0.22) 3 | 0.24 (0.23, 0.25) | 0.28 (0.27, 0.30) | 0.24 (0.21, 0.27) | |
| n = 50 | n = 50 | n = 49 | n = 149 | |
| Age (year) | 27.8 ± 5.2 4 | 29.6 ± 5.7 | 29.5 ± 5.5 | 29.0 ± 5.5 |
| Height (cm) | 165.0 ± 6.4 | 166.1 ± 6.3 | 163.3 ± 6.8 | 164.8 ± 5.6 |
| Born in Australia [n (%)] 5 | 49 (98.0) | 45 (90.0) | 45 (91.8) | 139 (93.3) |
| Aboriginal, not Torres Strait Islander [n (%)] | 2 (4.0) | 0 (0) | 3 (6.1) | 5 (3.4) |
| Married or in de facto relationship [n (%)] | 41 (82.0) | 45 (90.0) | 43 (87.8) | 129 (86.6) |
| Education [n (%)] 6 | 28 (56.0) | 43 (86.0) | 40 (81.6) | 111 (74.5) |
| Socioeconomic status, IRSAD 7 decile ≤5 [n (%)] 8 | 15 (30.0) | 12 (24.0) | 17 (34.7) | 57 (38.3) |
| Smoked during pregnancy [n (%)] | 7 (14.0) | 3 (6.0) | 5 (10.2) | 15 (10.2) |
| Prepregnancy weight (kg) | 64.5 (57.0, 79.0) | 67.3 (56.0, 78.5) | 65.0 (60.0, 80.0) | 69.7 ± 17.0 |
| Weight gain during pregnancy (kg) | 12.9 ± 6.2 | 14.2 ± 7.8 | 12.6 ± 6.0 | 13.2 ± 6.7 |
| Nulliparous [n (%)] | 15 (30.0) | 25 (50.0) | 23 (46.9) | 63 (42.3) |
| Preterm delivery before 37 weeks of gestation | 0 (0) | 7 (14.0) | 6 (12.2) | 13 (8.7) |
| Infant birthweight (g) | 3608 (3185, 3910) | 3575 (3100, 3980) | 3420 (3049, 3718) | 3500 (3100, 3820) |
| Dietary composition | Low P:NP ratio 3 | Medium P:NP ratio | High P:NP ratio | P 4 | |||
|---|---|---|---|---|---|---|---|
| 0.21 (0.19, 0.22) 4 | 0.24 (0.23, 0.25) | 0.28 (0.27, 0.30) | |||||
| n = 50 | n = 50 | n = 49 | |||||
| Median | IQR | Median | IQR | Median | IQR | ||
| Macronutrients | |||||||
| Energy (kJ) | 7316.6 | 5994.7–9527.9 | 8158.6 | 6483.2–9624.9 | 7294.7 | 5943.9–8872.4 | |
| Protein (%E) | 16.8 a,b | 15.9–17.2 | 18.8 a,c | 18.2–19.4 | 21.4 b,c | 20.7–22.5 | <0.001 a,b,c |
| Total fat (%E) | 37.8 | 35.1–40.5 | 37.7 | 35.8–40.7 | 37.7 | 35.3–40.4 | |
| Saturated fat (%E) | 16.3 | 14.1–18.9 | 16.2 | 13.9–17.5 | 15.8 | 13.7–18.7 | |
| Monounsaturated fat (%E) | 12.5 | 11.7–13.5 | 13.1 | 12.2–14.1 | 13.3 | 12.3–14.6 | |
| Polyunsaturated fat (%E) | 5.0 | 4.1–6.7 | 5.2 | 4.1–6.7 | 5.0 | 4.0–5.8 | |
| Total carbohydrate (%E) | 43.5 a,b | 41.2–46.0 | 41.2 a,c | 38.7–43.4 | 39.0 b,c | 36.1–41.3 | <0.001 a,b, <0.01 c |
| Sugars (%E) | 20.1 a | 18.1–23.4 | 19.6 | 17.7–21.2 | 18.2 a | 15.7–21.0 | <0.01 a |
| Starch (%E) | 23.0 a | 20.8–25.0 | 21.5 | 20.4–23.3 | 20.3 a | 18.4–21.7 | <0.001 a |
| Fiber (%E) | 3.7 | 3.2–4.5 | 4.3 | 3.7–4.9 | 4.0 | 3.4–4.4 | |
| Cholesterol (mg) | 223.0 a | 170.9–319.8 | 300.5 | 210.3–350.2 | 273.1 a | 224.0–372.2 | <0.01 a |
| Vitamins | |||||||
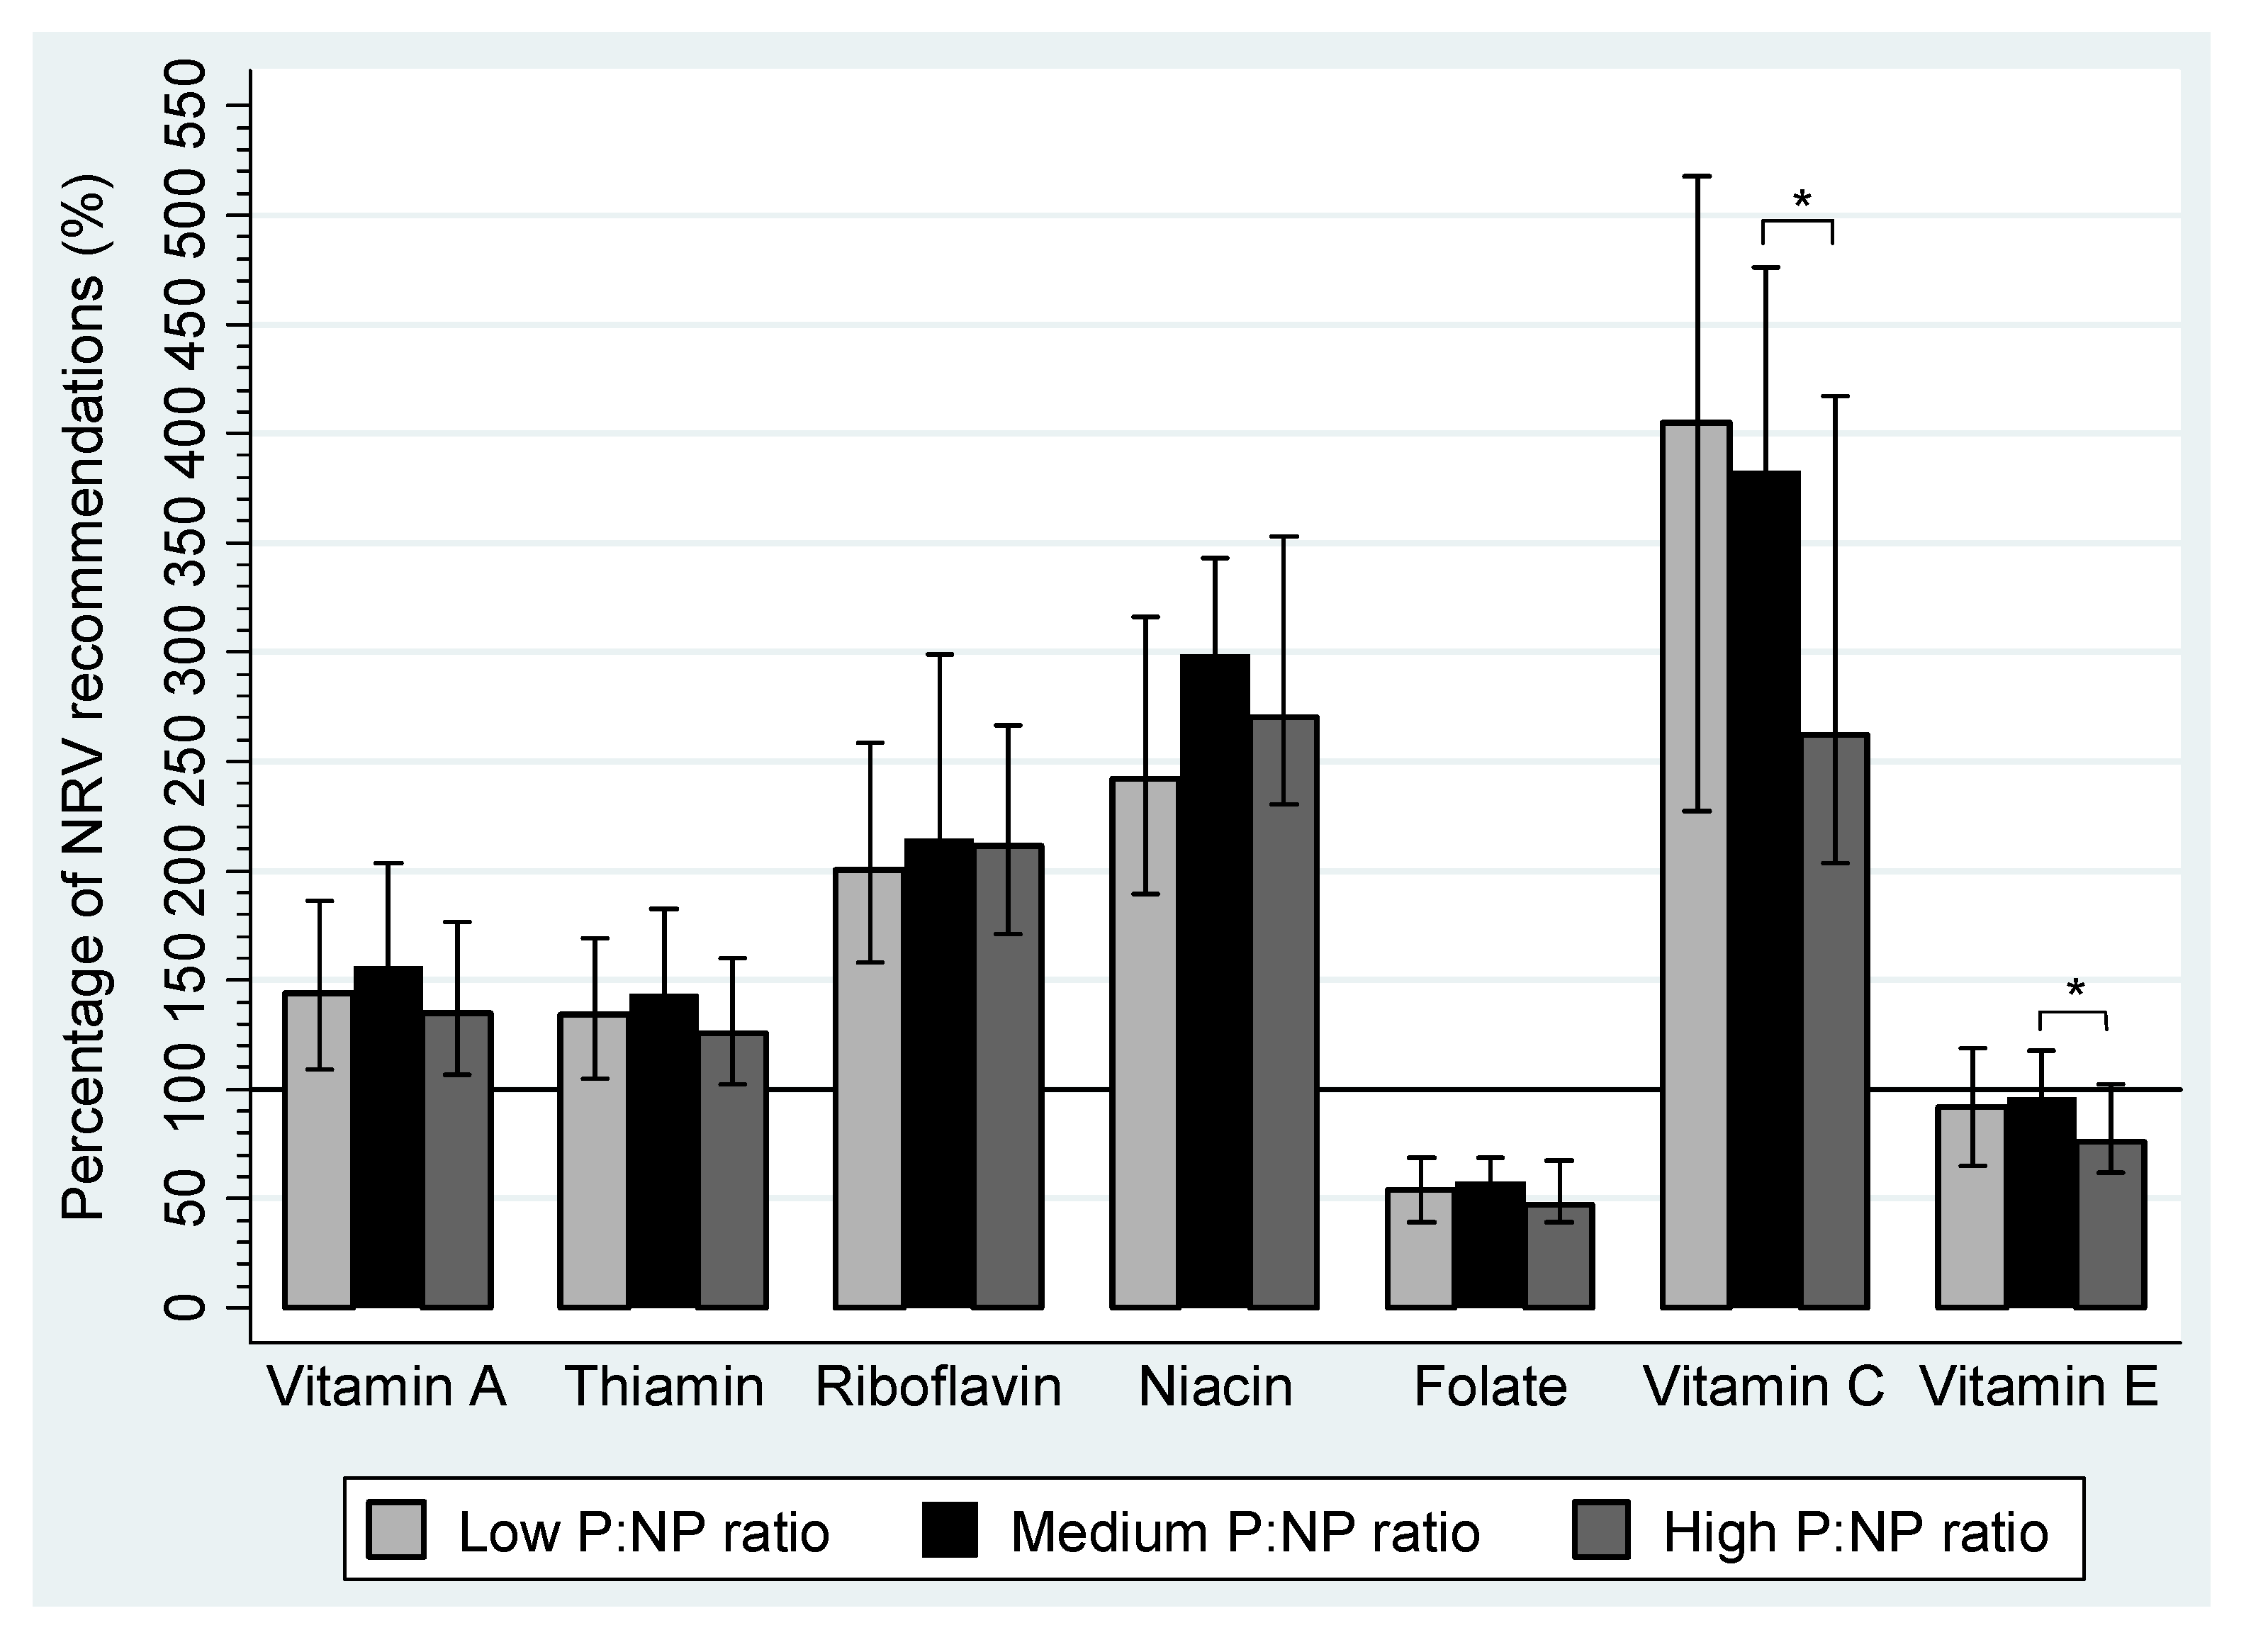
| Vitamin A (RE μg) | 793.1 | 600.6–1025.1 | 860.8 | 707.8–1119.7 | 741.0 | 585.2–971.9 | |
| Retinol (μg) | 415.1 | 315.0–541.1 | 451.6 | 348.3–520.2 | 378.7 | 295.9–501.7 | |
| β-carotene (μg) | 2004.2 | 1454.1–2980.2 | 2322.1 | 1663.3–3254.4 | 2198.0 | 1460.1–2642.4 | |
| Thiamin (mg) | 1.6 | 1.3–2.0 | 1.7 | 1.3–2.2 | 1.5 | 1.2–1.9 | |
| Riboflavin (mg) | 2.4 | 1.9–3.1 | 2.6 | 2.1–3.6 | 2.5 | 2.1–3.2 | |
| Niacin Equivalents (mg) | 33.9 | 26.5–44.2 | 41.8 | 32.4–48.0 | 37.9 | 32.2–49.4 | |
| Niacin (mg) | 19.6 | 15.0–26.2 | 23.1 | 18.1–28.0 | 21.0 | 16.7–27.4 | |
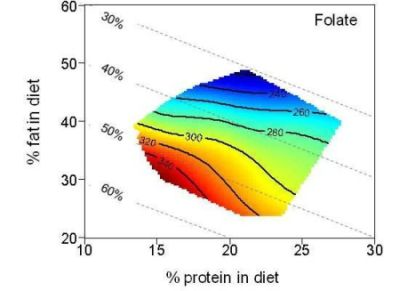
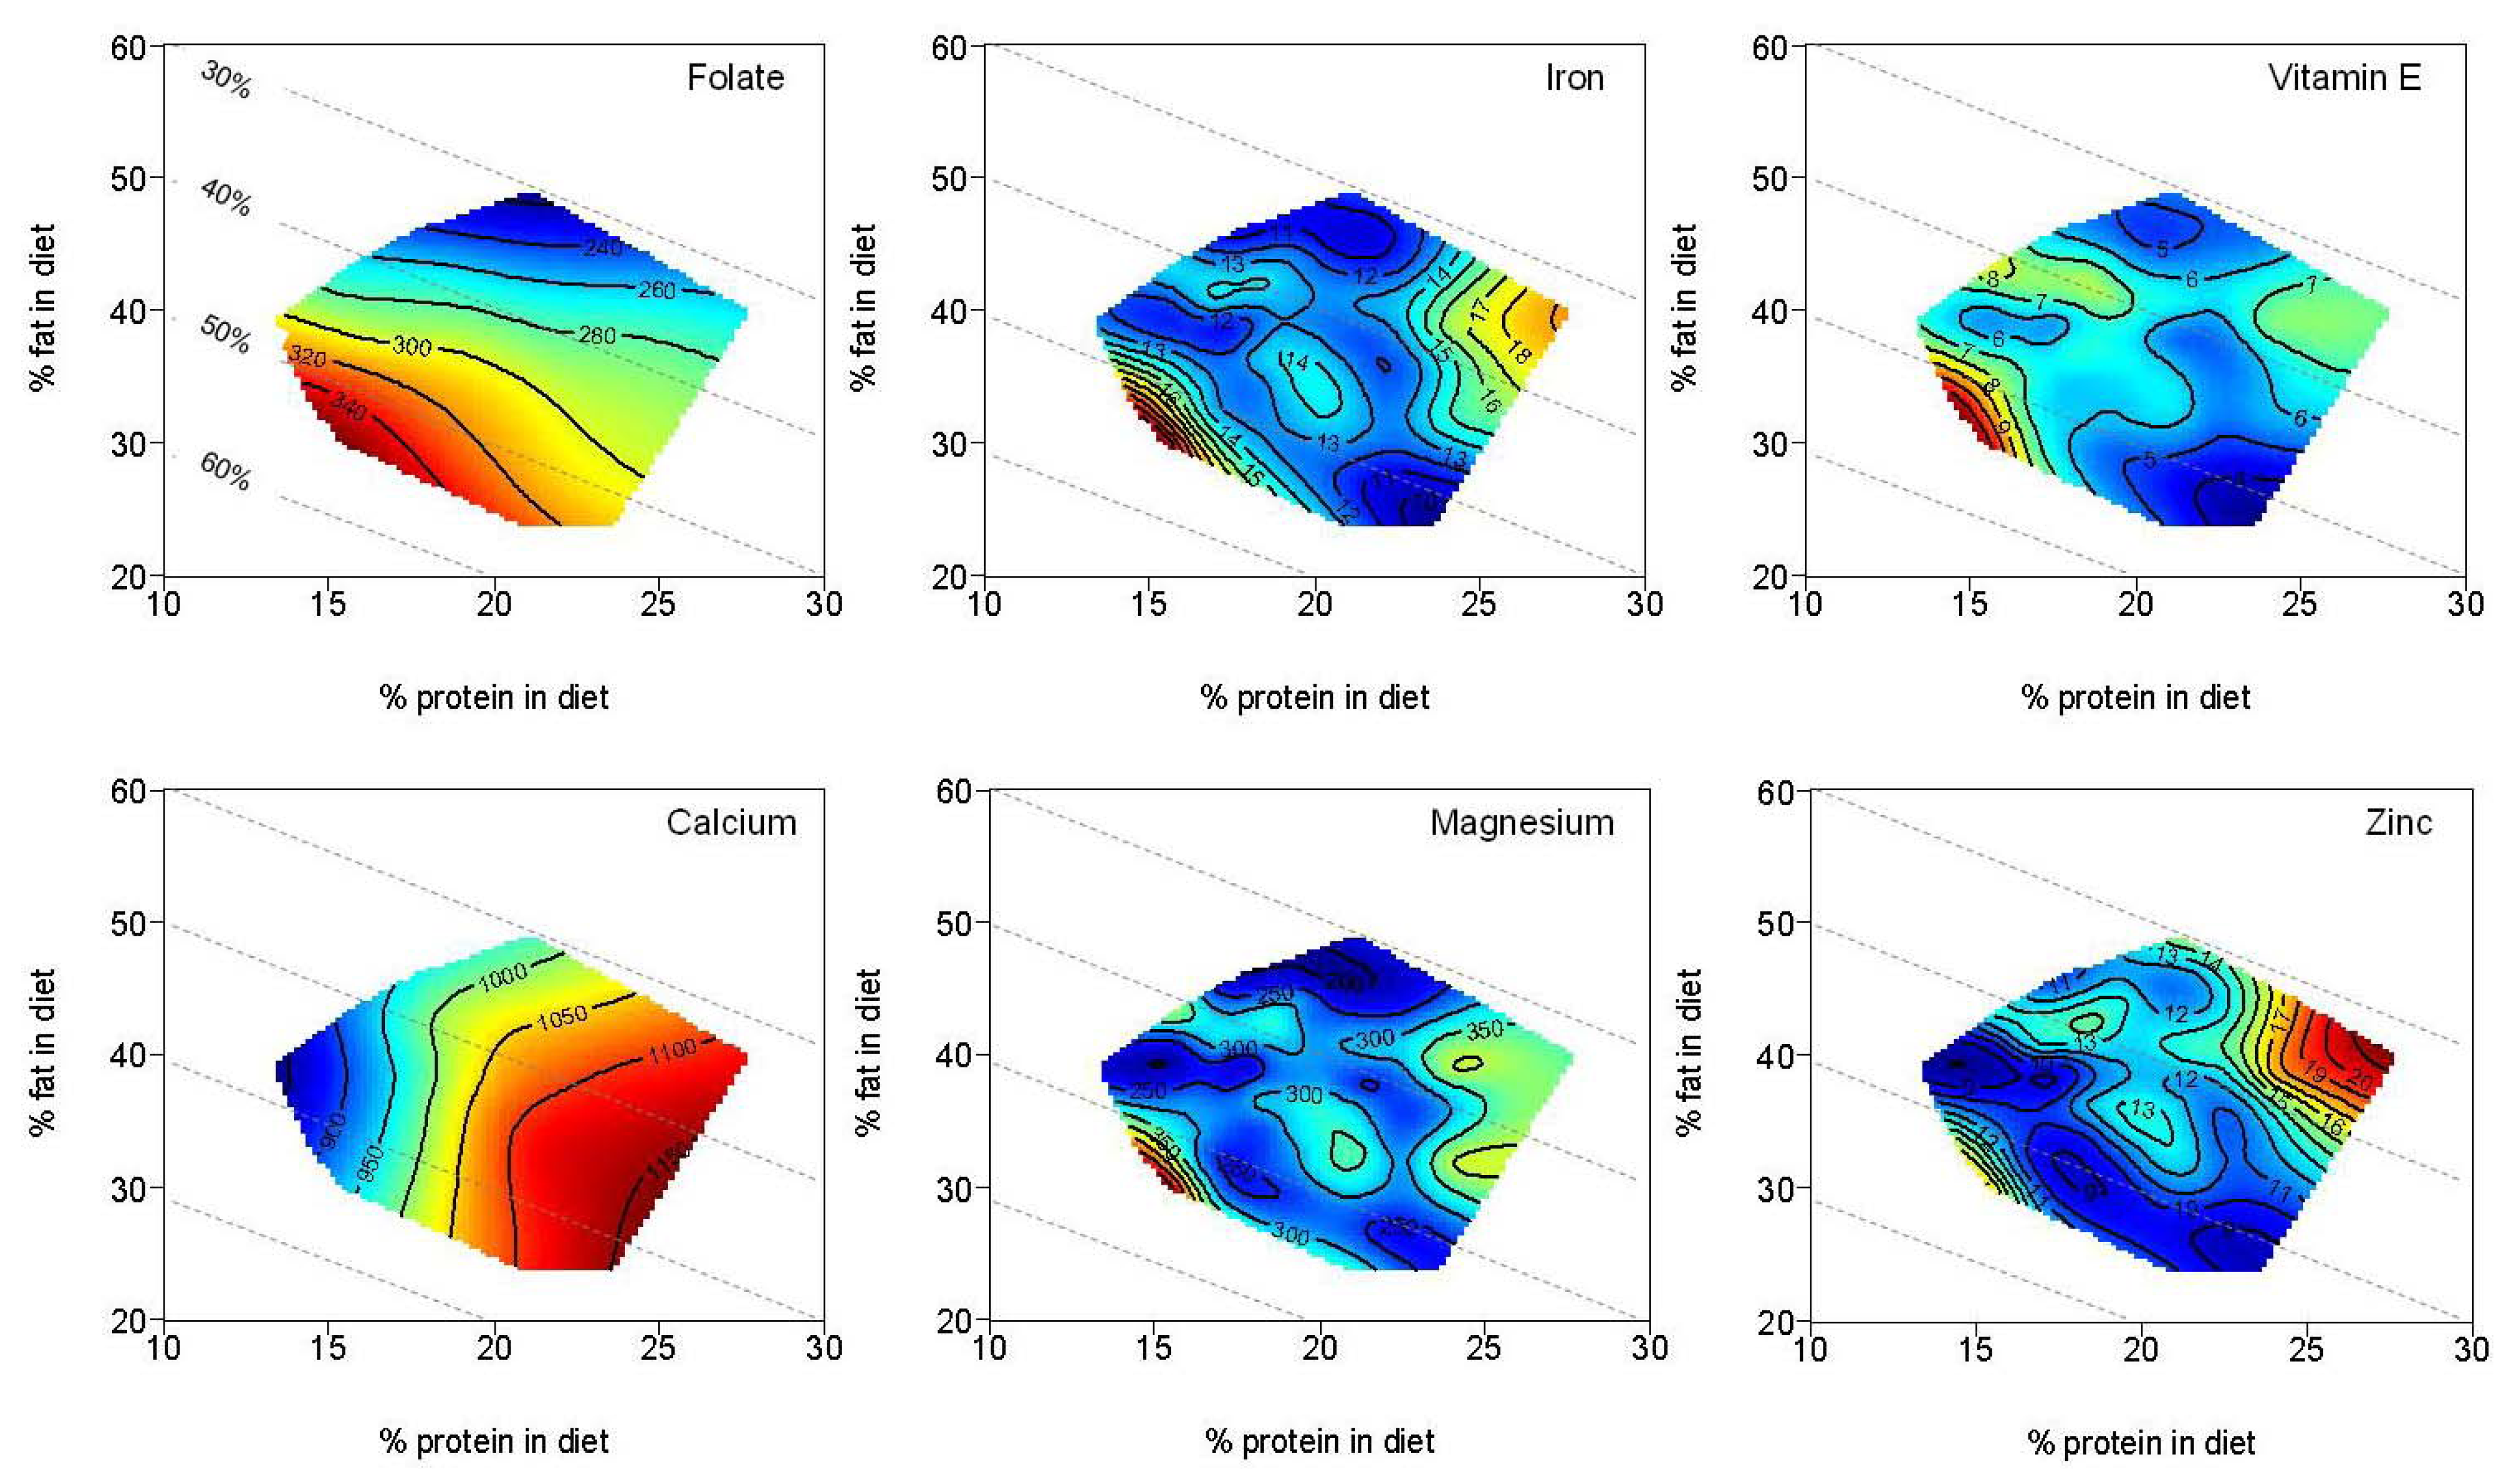
| Folate (µg) | 279.7 | 205.2–356.0 | 298.1 | 243.2–355.4 | 244.4 | 205.3–350.0 | |
| Vitamin C (mg) | 161.9 | 90.9–207.2 | 153.2 a | 116.5–190.3 | 105.0 a | 81.4–166.9 | <0.01 a |
| Vitamin E (mg) | 6.5 | 4.6–8.3 | 6.7 a | 5.5–8.2 | 5.3 a | 4.3–7.2 | <0.01 a |
| Minerals | |||||||
| Calcium (mg) | 867.2 a,b | 715.9–1006.9 | 965.6 a | 811.5–1305.6 | 1067.8 b | 826.0–1279.6 | <0.01 a,b |
| Iron (mg) | 11.9 | 8.9–15.2 | 12.9 | 10.1–16.3 | 11.7 | 9.6–15.4 | |
| Magnesium (mg) | 259.6 | 202.2–322.0 | 291.5 | 240.9–361.0 | 272.2 | 218.2–356.0 | |
| Phosphorus (mg) | 1299.5 | 1093.0–1626.9 | 1588.8 | 1277.0–1911.0 | 1548.5 | 1254.4–1905.2 | |
| Potassium (mg) | 2586. | 2026.8–3200.1 | 3010.9 | 2612.6–3505.5 | 2848.8 | 2204.8–3491.2 | |
| Sodium (mg) | 2255.9 | 1805.1–2868.3 | 2566.9 | 2091.6–3184.1 | 2404.6 | 2072.6–2941.5 | |
| Zinc (mg) | 9.2 a,b | 7.6–12.7 | 12.2 a | 9.3–14.3 | 11.1 b | 9.9–14.8 | <0.01 a,b |
| Food group servings 3 | Recommended food group servings | Low P:NP ratio | Medium P:NP ratio | High P:NP ratio | P 5 | |||
|---|---|---|---|---|---|---|---|---|
| 0.21 (0.19, 0.22) 4 | 0.24 (0.23, 0.25) | 0.28 (0.27, 0.30) | ||||||
| n = 50 | n = 50 | n = 49 | ||||||
| Median | IQR | Median | IQR | Median | IQR | |||
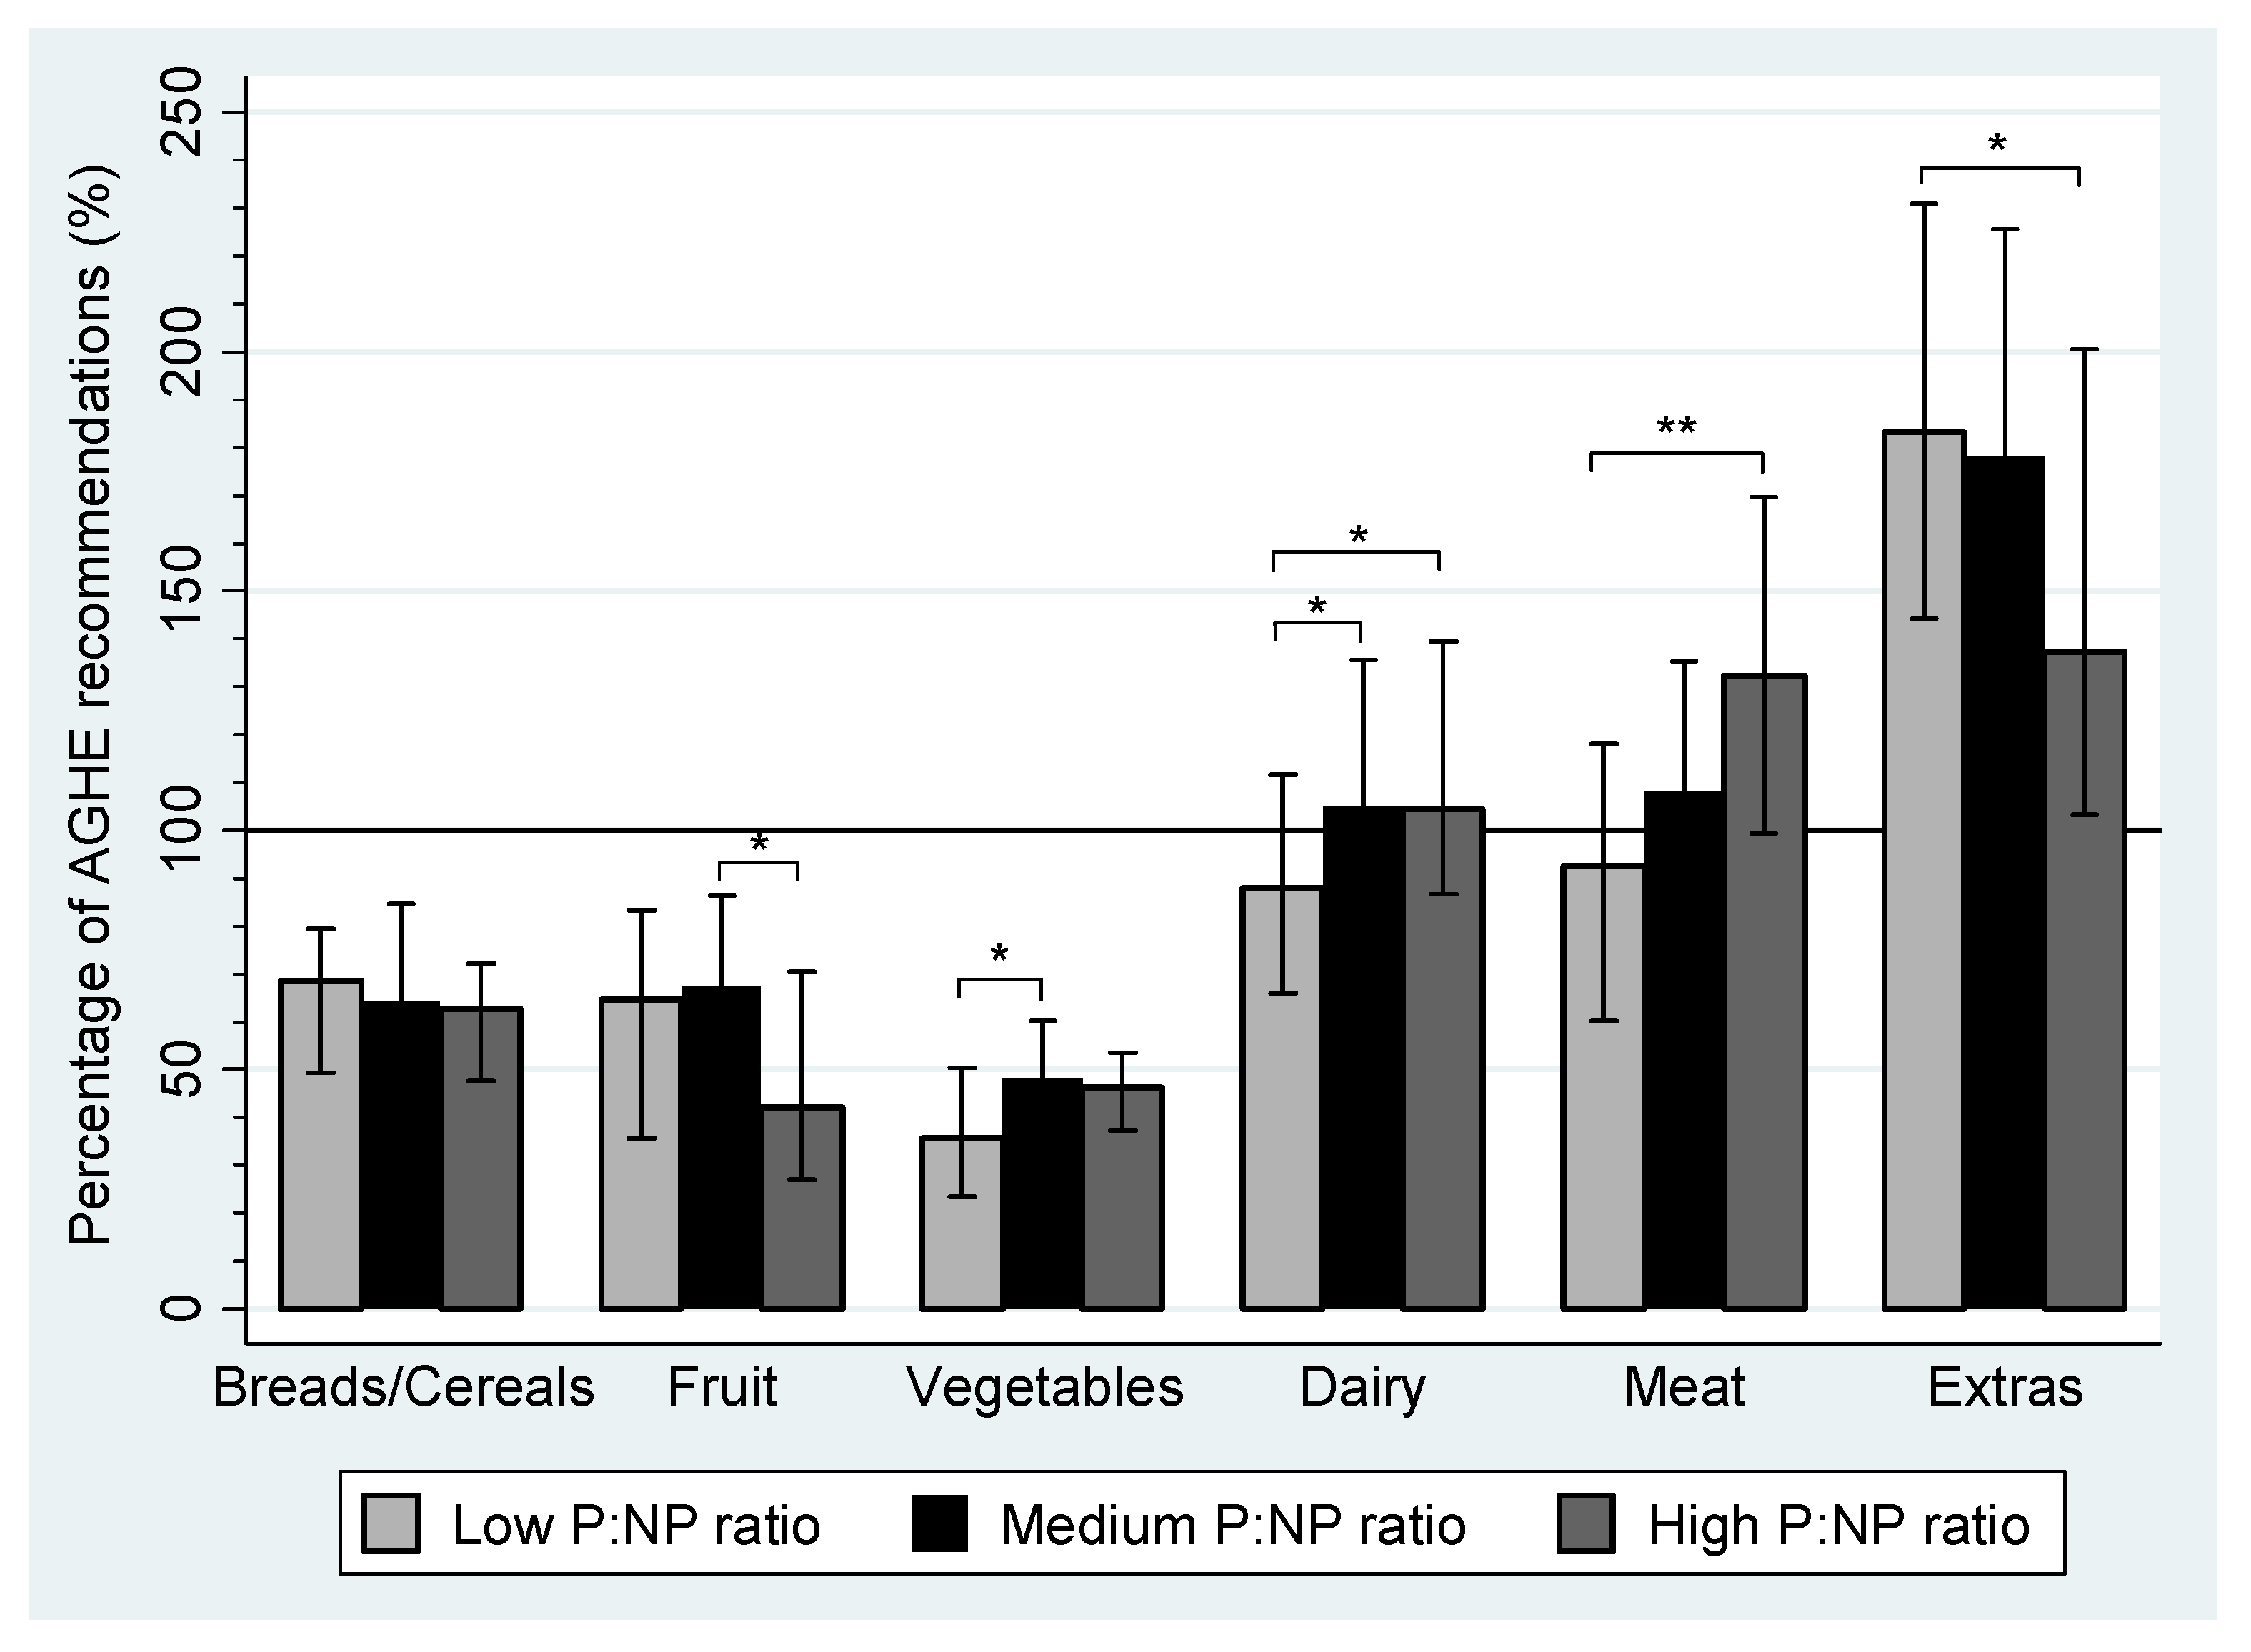
| Breads/cereals (servings/day) | 4–6 | 2.7 | 2.0–3.2 | 2.6 | 2.2–3.4 | 2.5 | 1.9–2.9 | |
| Fruit (servings/day) | 4 | 2.6 | 1.4–3.3 | 2.7 a | 2.0–3.5 | 1.7 a | 1.0–2.8 | <0.01 a |
| Vegetables (servings/day) | 5–6 | 1.8 a | 1.2–2.5 | 2.4 a | 1.8–3.0 | 2.3 | 1.9–2.7 | <0.01 a |
| Dairy (servings/day) | 2 | 1.8 a,b | 1.3–2.2 | 2.0 a | 1.7–2.6 | 2.1 b | 1.7–2.8 | <0.01 a,b |
| Meat and alternatives (servings/day) | 1.5 | 1.4 a | 0.9–1.8 | 1.6 | 1.4–2.0 | 2.0 a | 1.5–2.5 | <0.001 a |
| Extras (servings/day) | 0–2.5 | 4.6 a | 3.6–5.8 | 4.3 | 3.1–5.6 | 3.6 a | 2.6–5.5 | <0.01 a |
| Sweet (servings/day) | 1.5 a | 1.1–2.1 | 1.2 | 0.7–1.8 | 1.2 a | 0.6–2.0 | <0.01 a | |
| Savory (servings/day) | 2.6 | 2.0–3.4 | 2.6 | 1.9–3.6 | 2.1 | 1.8–2.9 | ||
| Alcohol (servings/day) | 0.02 | 0.0–0.05 | 0.03 | 0.0–0.11 | 0.03 | 0.0–0.18 | ||


4. Discussion
5. Conclusions
Acknowledgments
Conflict of Interest
References
- McMillen, I.C.; Robinson, J.S. Developmental origins of the metabolic syndrome: Prediction, plasticity, and programming. Physiol. Rev. 2005, 85, 571–633. [Google Scholar] [CrossRef]
- Fall, C.H.D. Evidence for the intra-uterine programming of adiposity in later life. Ann. Hum. Biol. 2011, 38, 410–428. [Google Scholar] [CrossRef]
- Rehfeldt, C.; Lang, I.S.; Gors, S.; Hennig, U.; Kalbe, C.; Stabenow, B.; Brussow, K.P.; Pfuhl, R.; Bellmann, O.; Nurnberg, G.; et al. Limited and excess dietary protein during gestation affects growth and compositional traits in gilts and impairs offspring fetal growth. J. Anim. Sci. 2011, 89, 329–341. [Google Scholar] [CrossRef]
- Zambrano, E.; Bautista, C.J.; Deas, M.; Martinez-Samayoa, P.M.; Gonzalez-Zamorano, M.; Ledesma, H.; Morales, J.; Larrea, F.; Nathanielsz, P.W. A low maternal protein diet during pregnancy and lactation has sex- and window of exposure-specific effects on offspring growth and food intake, glucose metabolism and serum leptin in the rat. J. Physiol. 2006, 571, 221–230. [Google Scholar]
- McCurdy, C.E.; Bishop, J.M.; Williams, S.M.; Grayson, B.E.; Smith, M.S.; Friedman, J.E.; Grove, K.L. Maternal high-fat diet triggers lipotoxicity in the fetal livers of nonhuman primates. J. Clin. Investig. 2009, 119, 323–335. [Google Scholar]
- Bayol, S.A.; Farrington, S.J.; Stickland, N.C. A maternal “junk food” diet in pregnancy and lactation promotes an exacerbated taste for “junk food” and a greater propensity for obesity in rat offspring. Br. J. Nutr. 2007, 98, 843–851. [Google Scholar]
- Blumfield, M.L.; Hure, A.J.; MacDonald-Wicks, L.; Smith, R.; Simpson, S.J.; Giles, W.B.; Raubenheimer, D.; Collins, C.E. Dietary balance during pregnancy is associated with fetal adiposity and fat distribution. Am. J. Clin. Nutr. 2012, 96, 1032–1041. [Google Scholar]
- Sebert, S.; Sharkey, D.; Budge, H.; Symonds, M.E. The early programming of metabolic health: Is epigenetic setting the missing link? Am. J. Clin. Nutr. 2012, 94, 1953S–1958S. [Google Scholar]
- Maurer, A.D.; Reimer, R.A. Maternal consumption of high-prebiotic fibre or -protein diets during pregnancy and lactation differentially influences satiety hormones and expression of genes involved in glucose and lipid metabolism in offspring in rats. Br. J. Nutr. 2011, 105, 329–338. [Google Scholar] [CrossRef]
- Buckley, A.J.; Jaquiery, A.L.; Harding, J.E. Nutritional programming of adult disease. Cell Tissue Res. 2005, 322, 73–79. [Google Scholar] [CrossRef]
- Almond, K.; Bikker, P.; Lomax, M.; Symonds, M.E.; Mostyn, A. The influence of maternal protein nutrition on offspring development and metabolism: The role of glucocorticoids. Proc. Nutr. Soc. 2012, 71, 198–203. [Google Scholar] [CrossRef]
- Simpson, S.J.; Raubenheimer, D. Obesity: The protein leverage hypothesis. Obes. Rev. 2005, 6, 133–142. [Google Scholar] [CrossRef]
- Heppolette, C.A.A.; Palmer, D.; Ozanne, S.E. Experimental models of low birth weight—Insight into the developmental programming of metabolic health, aging and immune function. In Perinatal Programming: The State of the Art; Plagemann, A., Ed.; Walter de Gruyter: Berlin, Germany, 2012; pp. 11–25. [Google Scholar]
- Hales, C.N.; Barker, D.J. Type 2 (non-insulin-dependent) diabetes mellitus: The thrifty phenotype hypothesis. Diabetologia 1992, 35, 595–601. [Google Scholar] [CrossRef]
- Petry, C.J.; Dorling, M.W.; Pawlak, D.B.; Ozanne, S.E.; Hales, C.N. Diabetes in old male offspring of rat dams fed a reduced protein diet. Int. J. Exp. Diabetes Res. 2001, 2, 139–143. [Google Scholar] [CrossRef]
- Desai, M.; Crowther, N.J.; Ozanne, S.E.; Lucas, A.; Hales, C.N. Adult glucose and lipid metabolism may be programmed during fetal life. Biochem. Soc. Trans. 1995, 23, 331–335. [Google Scholar]
- Barker, D.J. Adult consequences of fetal growth restriction. Clin. Obstet. Gynecol. 2006, 49, 270–283. [Google Scholar] [CrossRef]
- Andreasyan, K.; Ponsonby, A.L.; Dwyer, T.; Morley, R.; Riley, M.; Dear, K.; Cochrane, J. Higher maternal dietary protein intake in late pregnancy is associated with a lower infant ponderal index at birth. Eur. J. Clin. Nutr. 2007, 61, 498–508. [Google Scholar]
- Metzler-Zebeli, B.U.; Lang, I.S.; Gors, S.; Brussow, K.P.; Hennig, U.; Nurnberg, G.; Rehfeldt, C.; Otten, W.; Metges, C.C. High-protein-low-carbohydrate diet during pregnancy alters maternal plasma amino acid concentration and placental amino acid extraction but not fetal plasma amino acids in pigs. Br. J. Nutr. 2012, in press.. [Google Scholar]
- Rao, K.R.; Padmavathi, I.J.; Raghunath, M. Maternal micronutrient restriction programs the body adiposity, adipocyte function and lipid metabolism in offspring: A review. Rev. Endocr. Metab. Disord. 2012, 13, 103–108. [Google Scholar] [CrossRef]
- Ramakrishnan, U.; Grant, F.; Goldenberg, T.; Zongrone, A.; Martorell, R. Effect of women’s nutrition before and during early pregnancy on maternal and infant outcomes: A systematic review. Paediatr. Perinat. Epidemiol. 2012, 26, 285–301. [Google Scholar] [CrossRef]
- Hure, A.J.; Smith, R.; Collins, C.E. A recruiting failure turned success. BMC Health Serv. Res. 2008, 8, 64. [Google Scholar] [CrossRef]
- Hure, A.J.; Collins, C.E.; Giles, W.B.; Paul, J.W.; Smith, R. Greater maternal weight gain during pregnancy predicts a large but lean phenotype: A prospective cohort study. Matern. Child Health J. 2012, 16, 1374–1384. [Google Scholar] [CrossRef]
- Hure, A.J.; Collins, C.E.; Giles, W.B.; Wright, I.M.R.; Smith, R. Protocol for the women and their children’s health (WATCH) study: A cohort of pregnancy and beyond. J. Epidemiol. 2012, 22, 267–275. [Google Scholar]
- Hodge, A.; Patterson, A.J.; Brown, W.J.; Ireland, P.; Giles, G. The Anti Cancer Council of Victoria FFQ: Relative validity of nutrient intakes compared with weighed food records in young to middle-aged women in a study of iron supplementation. Aust. N. Z. J. Public Health 2000, 24, 576–583. [Google Scholar] [CrossRef]
- Smith, A.; Kellett, E.; Schmerlaib, Y. The Australian Guide to Healthy Eating: Background Information for Nutrition Educators; Commonwealth of Australia: Canberra, Australia, 1998. [Google Scholar]
- Food Standards Australia New Zealand, NUTTAB 2006: Australian Food Composition Tables; Australian Government Publishing Service: Canberra, Austalia, 2006.
- Research Institute for Gender and Health, Women’s Health Australia: Databook for Survey 1 of the Australian Longitudinal Study on Women’s Health; University of Newcastle: Newcastle, New South Wales, Australia, 1997.
- National Health and Medical Research Council, Dietary Guidelines for Australians; Australian Government Publishing Service: Canberra, Austalia, 1992.
- National Health and Medical Research Council, Nutrient Reference Values for Australia and New Zealand; Commonwealth of Australia: Canberra, Austalia, 2006.
- Meltzer, H.M.; Brantsaeter, A.L.; Ydersbond, T.A.; Alexander, J.; Haugen, M. Methodological challenges when monitoring the diet of pregnant women in a large study: Experiences from the norwegian mother and child cohort study (MoBa). Matern. Child Nutr. 2008, 4, 14–27. [Google Scholar]
- Blows, M.W. Measuring nonlinear selection. Am. Nat. 2003, 162, 815–820. [Google Scholar] [CrossRef] [Green Version]
- StataCorp, Stata Statistical Software: Release 11; StataCorp LP: College Station, Texas, USA, 2009.
- R Development Core Team, R: A Language and Environment for Statistical Computing; R Foundation for Statistical Computing: Vienna, Austria, 2011.
- Raubenheimer, D. Toward a quantitative nutritional ecology: The right-angled mixture triangle. Ecol. Monogr. 2011, 81, 407–427. [Google Scholar] [CrossRef]
- Blumfield, M.L.; Hure, A.J.; MacDonald-Wicks, L.K.; Patterson, A.J.; Smith, R.; Collins, C.E. Disparities exist between national food group recommendations and the dietary intakes of women. BMC Women’s Health 2011, 11, 37. [Google Scholar] [CrossRef]
- Ostbye, T.; Peterson, B.L.; Krause, K.M.; Swamy, G.K.; Lovelady, C.A. Predictors of postpartum weight change among overweight and obese women: Results from the active mothers postpartum study. J. Women’s Health 2012, 21, 215–222. [Google Scholar] [CrossRef]
- Ong, Z.Y.; Muhlhausler, B.S. Maternal “junk-food” feeding of rat dams alters food choices and development of the mesolimbic reward pathway in the offspring. FASEB J. 2011, 25, 2167–2179. [Google Scholar] [CrossRef]
- Liu, R.H. Potential synergy of phytochemicals in cancer prevention: Mechanism of action. J. Nutr. 2004, 134, 3479S–3485S. [Google Scholar]
- Blumfield, M.L.; Collins, C.; MacDonald-Wicks, L.; Hure, A.J.; Smith, R. A systematic review and meta-analysis of micronutrient intakes during pregnancy in developed countries. Nutr. Rev. 2012, in press.. [Google Scholar]
- Noakes, M.; Keogh, J.B.; Foster, P.R.; Clifton, P.M. Effect of an energy-restricted, high-protein, low-fat diet relative to a conventional high-carbohydrate, low-fat diet on weight loss, body composition, nutritional status, and markers of cardiovascular health in obese women. Am. J. Clin. Nutr. 2005, 81, 1298–1306. [Google Scholar]
- Galan, P.; Yoon, H.C.; Preziosi, P.; Viteri, F.; Valeix, P.; Fieux, B.; Briancon, S.; Malvy, D.; Roussel, A.M.; Favier, A.; et al. Determining factors in the iron status of adult women in the SU.VI.MAX study (SUpplementation en VItamines et Mineraux Antioxydants). Eur. J. Clin. Nutr. 1998, 52, 383–388. [Google Scholar]
- Gibson, S.A. Iron intake and iron status of preschool children: Associations with breakfast cereals, vitamin C and meat. Public Health Nutr. 1999, 2, 521–528. [Google Scholar]
- Heath, A.L.; Skeaff, C.M.; Williams, S.; Gibson, R.S. The role of blood loss and diet in the aetiology of mild iron deficiency in premenopausal adult new zealand women. Public Health Nutr. 2001, 4, 197–206. [Google Scholar]
- Geissler, C.; Singh, M. Iron, meat and health. Nutrients 2011, 3, 283–316. [Google Scholar] [CrossRef]
- Altmann, S.; Murani, E.; Schwerin, M.; Metges, C.C.; Wimmers, K.; Ponsuksili, S. Maternal dietary protein restriction and excess affects offspring gene expression and methylation of non-SMC subunits of condensin I in liver and skeletal muscle. Epigenetics 2012, 7, 239–252. [Google Scholar]
- Hure, A.; Young, A.; Smith, R.; Collins, C. Diet and pregnancy status in Australian women. Public Health Nutr. 2009, 12, 853–861. [Google Scholar] [CrossRef]
© 2012 by the authors; licensee MDPI, Basel, Switzerland. This article is an open-access article distributed under the terms and conditions of the Creative Commons Attribution license (http://creativecommons.org/licenses/by/3.0/).
Share and Cite
Blumfield, M.; Hure, A.; MacDonald-Wicks, L.; Smith, R.; Simpson, S.; Raubenheimer, D.; Collins, C. The Association between the Macronutrient Content of Maternal Diet and the Adequacy of Micronutrients during Pregnancy in the Women and Their Children’s Health (WATCH) Study. Nutrients 2012, 4, 1958-1976. https://doi.org/10.3390/nu4121958
Blumfield M, Hure A, MacDonald-Wicks L, Smith R, Simpson S, Raubenheimer D, Collins C. The Association between the Macronutrient Content of Maternal Diet and the Adequacy of Micronutrients during Pregnancy in the Women and Their Children’s Health (WATCH) Study. Nutrients. 2012; 4(12):1958-1976. https://doi.org/10.3390/nu4121958
Chicago/Turabian StyleBlumfield, Michelle, Alexis Hure, Lesley MacDonald-Wicks, Roger Smith, Stephen Simpson, David Raubenheimer, and Clare Collins. 2012. "The Association between the Macronutrient Content of Maternal Diet and the Adequacy of Micronutrients during Pregnancy in the Women and Their Children’s Health (WATCH) Study" Nutrients 4, no. 12: 1958-1976. https://doi.org/10.3390/nu4121958