1. Introduction
Glucose that comes from the mother provides fuel for fetal growth [
1]. High maternal blood glucose levels (BGL), even within the current recommended range, have been associated with higher infant body fat [
2]. The peak postprandial BGL (PBGL) occurs later in pregnant women than in the non-pregnant state [
3],
i.e., at 60
vs. 30 min, and is an important contributor to the risk of fetal overgrowth [
4,
5]. Treatment of gestational diabetes mellitus (GDM), where maternal glucose homeostasis is impaired, is therefore generally based on a combination of pre-meal BGL and PBGL 1 or 2 h after meals as monitored by self-blood glucose monitoring [
6,
7].
The glycemic index (GI) is a measurement of the glycemic quality of the carbohydrates in foods, where a low GI indicates that the carbohydrates are digested and absorbed slowly [
8]. The limited evidence available suggests that GI of meals is of relevance in the setting of GDM [
9]. A low GI diet was shown to reduce the requirement for insulin in the glycemic management of women with GDM [
10], and was equally effective in improving pregnancy outcomes in GDM when compared to a conventional high fibre diet [
11].
While the GI concept may be valid in diabetic pregnancy, scepticism of the efficacy of a low GI diet in GDM remains. This could partly be attributed to the lack of scientific evidence to demonstrate that low GI meals actually reduce, but not delay, the peak PBGL in GDM. A recent analysis of glycemic responses to over 1000 foods indicated that the timing of the peak was the same for high
vs. low GI foods in non-diabetic individuals [
12]. Whether this is true in pregnancy, especially those complicated by GDM, remains unclear because changes in gastric motility [
13] and insulin sensitivity [
14] during pregnancy may alter digestion and absorption.
In this study we investigated whether two bread-based breakfasts with different GI produced different postprandial peaks and peak time points in a group of women with GDM. Our hypothesis was that a low GI bread-based breakfast would produce a lower but not delayed PBGL peak in GDM when compared to an energy and macronutrient matched high GI bread-based breakfast.
2. Experimental Section
2.1. Subjects
All women who attended the Royal Prince Alfred Hospital GDM antenatal clinic during June 2010 to November 2011 were approached for recruitment, and ten women aged 18–45 years, who had been diagnosed with GDM by a 75 g oral glucose tolerance test (OGTT) using the following criteria: fasting glucose 5.5 mmol/L or more and/or 1 h post-load glucose of 10.0 mmol/L or more and/or 2 h post-load glucose of 8.0 mmol/L or more; were between 30 and 32 weeks of gestation, with no known food allergy and/or special dietary requirement and not currently using insulin were enrolled in the study. Information about demographics and ethnicity was gathered. All women in this study received a standard GDM group education session with an experienced diabetes dietitian, which covered carbohydrate counting, importance of even distribution of carbohydrates throughout the day, and food sources of carbohydrate, with no specific emphasis of GI.
2.2. Anthropometry and Self Blood Glucose Monitoring (SBGM)
Subjects were weighed at the first study session in light clothing and with shoes off, and their height was obtained from their electronic medical record. Subjects were instructed to self-monitor their BGL using a glucometer (AccuChek Performa, Roche Diagnostic, Castle Hill, NSW, Australia). Fasting BGL on the 7 previous days was obtained from the electronic record of the glucometer.
2.3. Test Meals
Subjects were required to fast for at least 8 h prior to the start of the test sessions. They consumed a carbohydrate controlled, low GI bread-based breakfast on one occasion, and an energy and macronutrient matched high GI bread-based breakfast on the other occasion one to two weeks apart. The order of test meals was randomized, and the allocation sequence was unpredictable and concealed from the recruiter. The subjects were asked to complete the meals within 15 min. The composition and nutritional content of the two test meals (
Table 1) were analysed with FoodWorks Professional (version 2009, Xyris Software, Brisbane, Australia), using AUSNUT2007 as the source of nutrition composition [
15].
Table 1.
Composition and nutritional analysis of the test meals. a Burgen fruit and muesli bread; b Flora mono-sun margarine; c Devondale light dairy blend; d Benefibre fibre supplement; e Tip Top Sunblest wholemeal; f Lucozade orange flavour.
Table 1.
Composition and nutritional analysis of the test meals. a Burgen fruit and muesli bread; b Flora mono-sun margarine; c Devondale light dairy blend; d Benefibre fibre supplement; e Tip Top Sunblest wholemeal; f Lucozade orange flavour.
| | Low GI | High GI |
|---|
| Foods included | 70 g fruit bread a | 60 g wholemeal bread e |
| 3 g margarine b | 134 g Fizzy glucose drink f |
| 3 g light dairy blend c | 1 hardboiled egg |
| 200 mL skim milk | |
| 1.7 g fibre supplement d |
| Nutritional Analyses |
| Energy (kcal) | 328 | 328 |
| Protein (% kcal) | 18.9 | 18.3 |
| Fat (% kcal) | 22.1 | 24.7 |
| Carbohydrates (% kcal) | 54.5 | 52.1 |
| Dietary Fibre (g) | 4.2 | 3.9 |
| Glycemic index | 45 | 82 |
| Glycemic load | 21 | 36 |
2.4. Quantification of Fasting and Postprandial Blood Glucose Levels
Finger prick blood samples were collected before the start of the meal, and at 15, 30, 45, 60, 75, 90 and 120 min after the start of the meal. The blood samples were analysed immediately after collection using a portable blood analyser (HemoCue Glucose Analyzer 201, HemoCue Australia Pty Ltd., Wamberal, Australia).
2.5. Subjective Satiety
Participants were asked to indicate their subjective satiety rating on a 15 cm visual analogue scale at each blood sample collection, with 0% representing “extremely hungry” and 100% representing “extremely full”.
2.6. Statistical Analyses
All statistical analyses were performed in IBM SPSS version 19 (IBM Australia, St Leonards, Australia). Two women withdrew from the study after the first session, and their results were used only in the overall analysis (
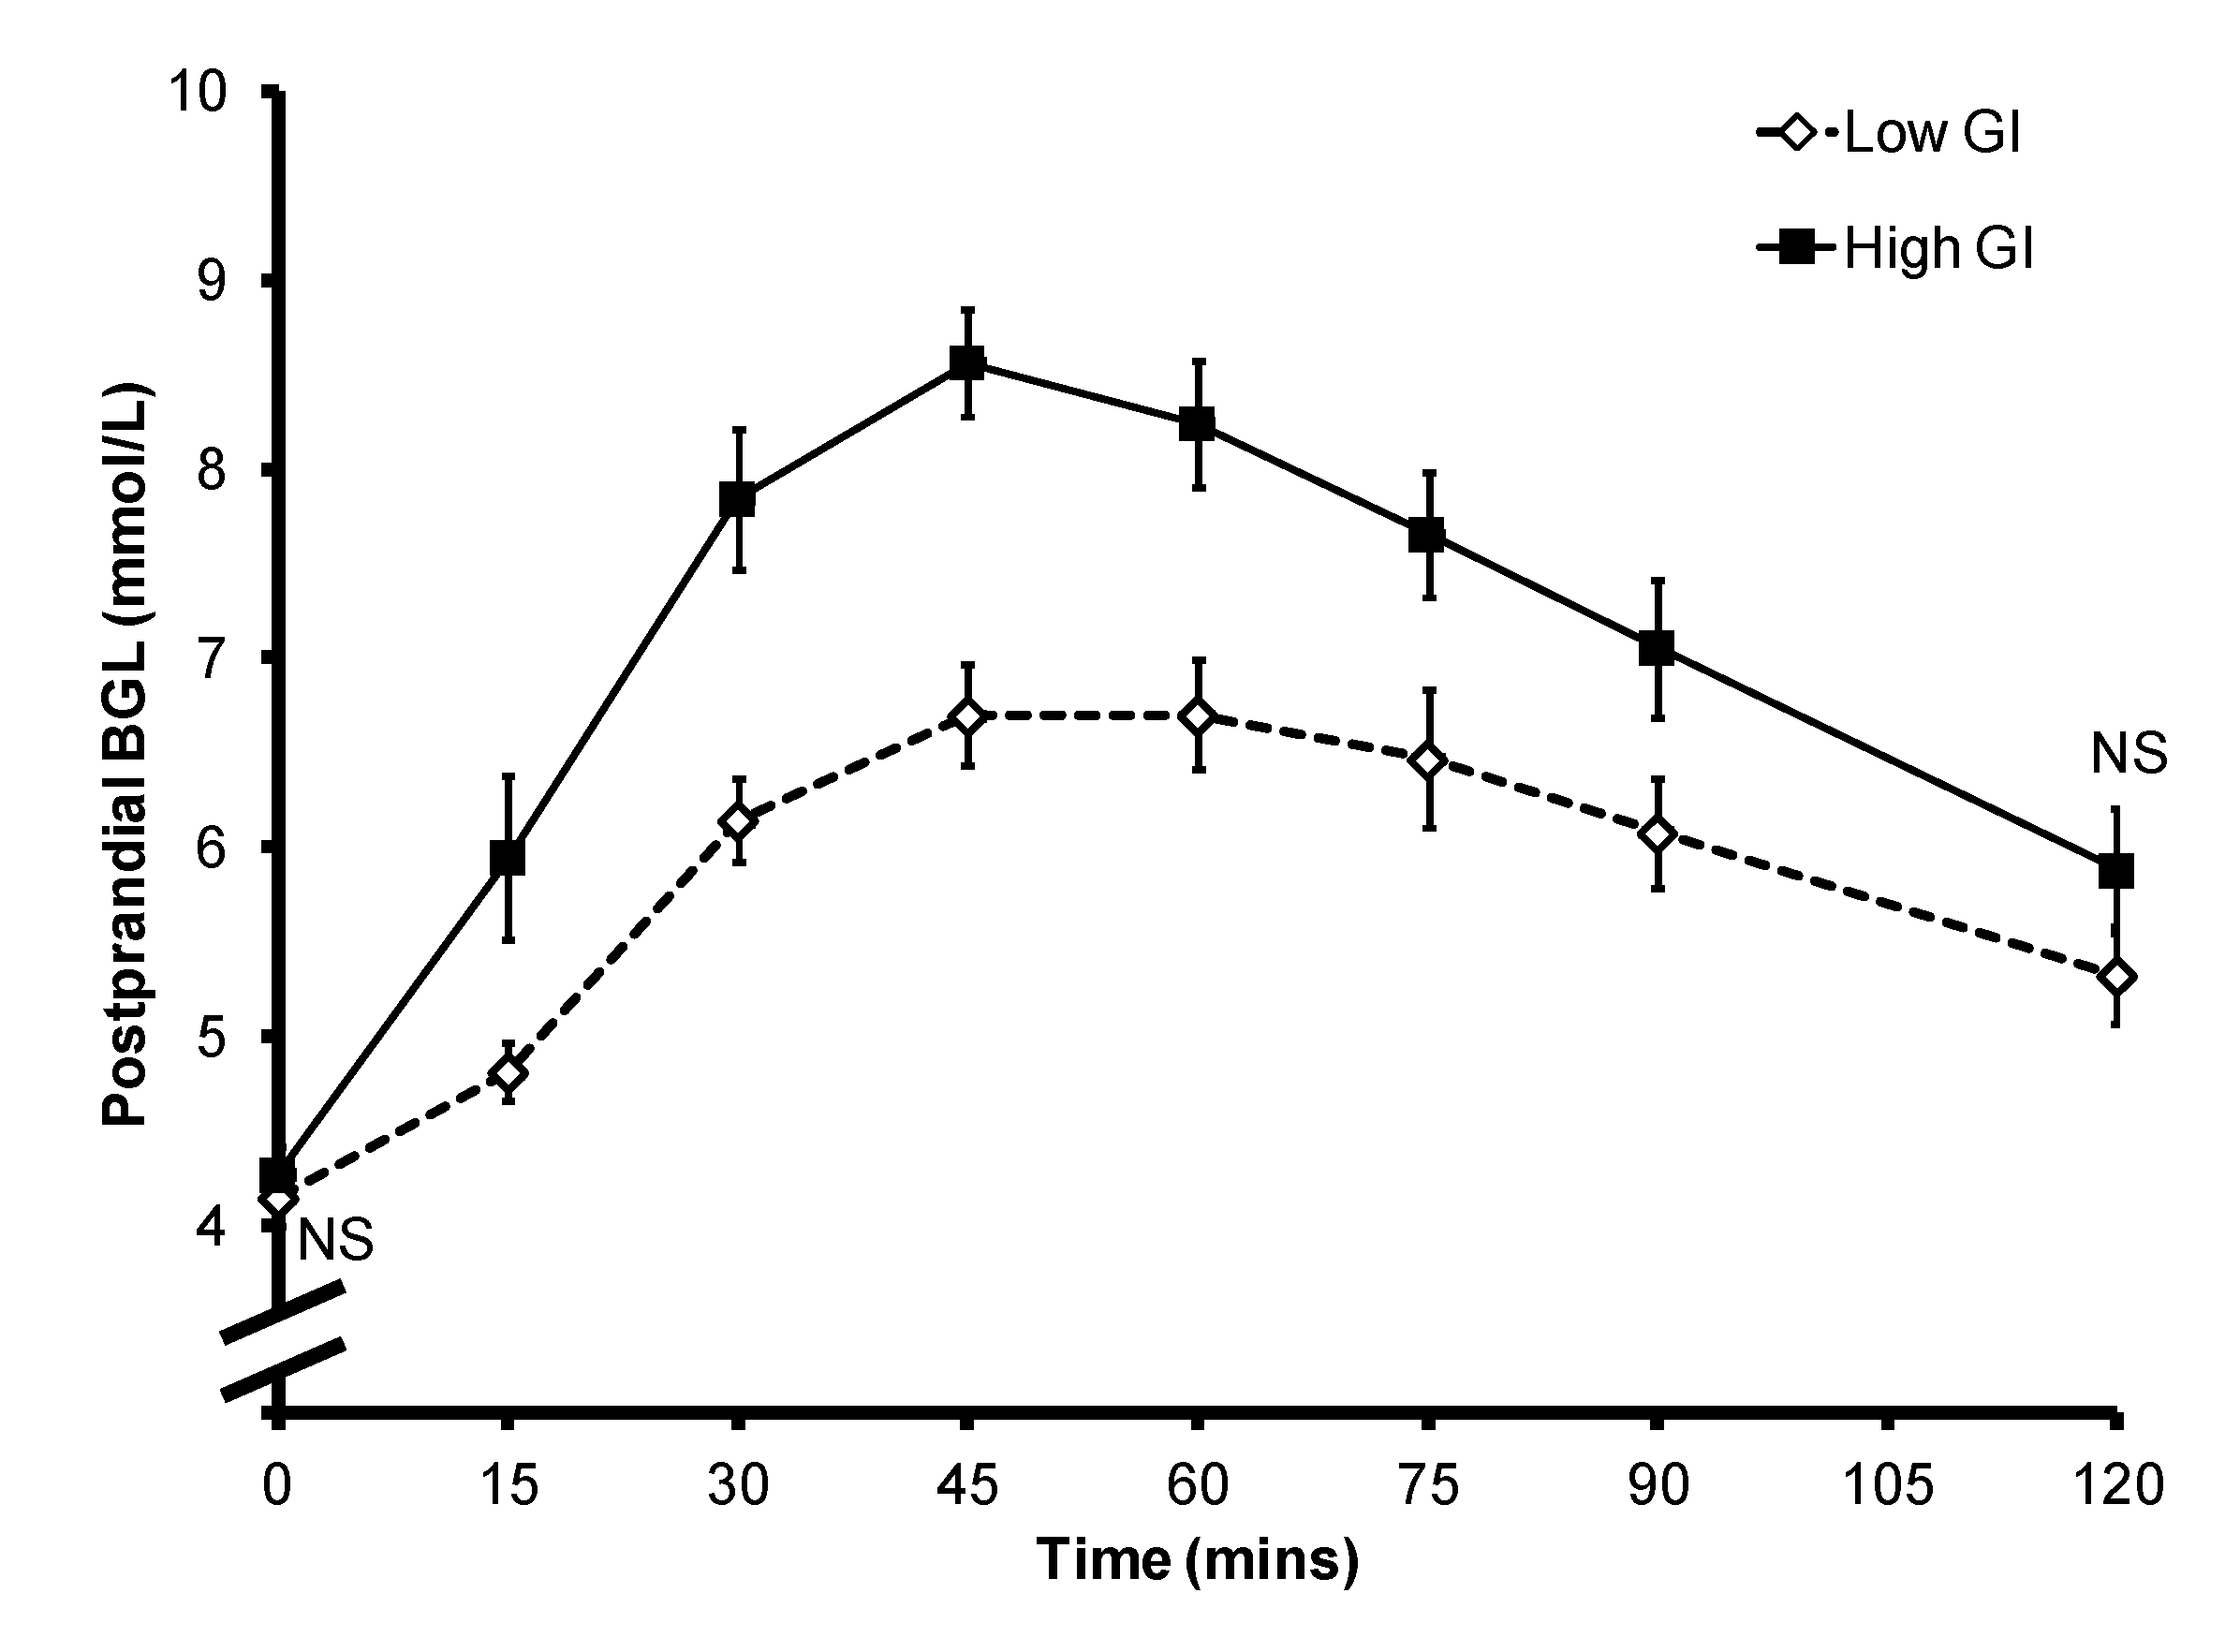
Figure 1). Mean ± SEM BGL for all subjects (
Figure 1), as well as that of the individual subjects (
Figure 2) were plotted against time to obtain postprandial blood glucose curves, and the incremental area under the glucose curve (iAUC
glucose) was calculated by the trapezoidal rule. Paired sample
t-test was used to compare differences in PBGL and subjective satiety between the breakfasts, and independent sample
t-test was used to compare differences in postprandial iAUC
glucose between the breakfasts as two subjects only provided data for one breakfast. Their data were included in the analysis because the results did not differ significantly when they were excluded. The time point with the highest mean blood glucose level was deemed as the time of peak PBGL for the overall analysis (
Figure 1), and the peak PBGL time for individual subjects were also identified (
Figure 2).
Figure 1.
Mean ± SEM postprandial blood glucose level of the 10 subjects. NS: non-significant.
Figure 1.
Mean ± SEM postprandial blood glucose level of the 10 subjects. NS: non-significant.
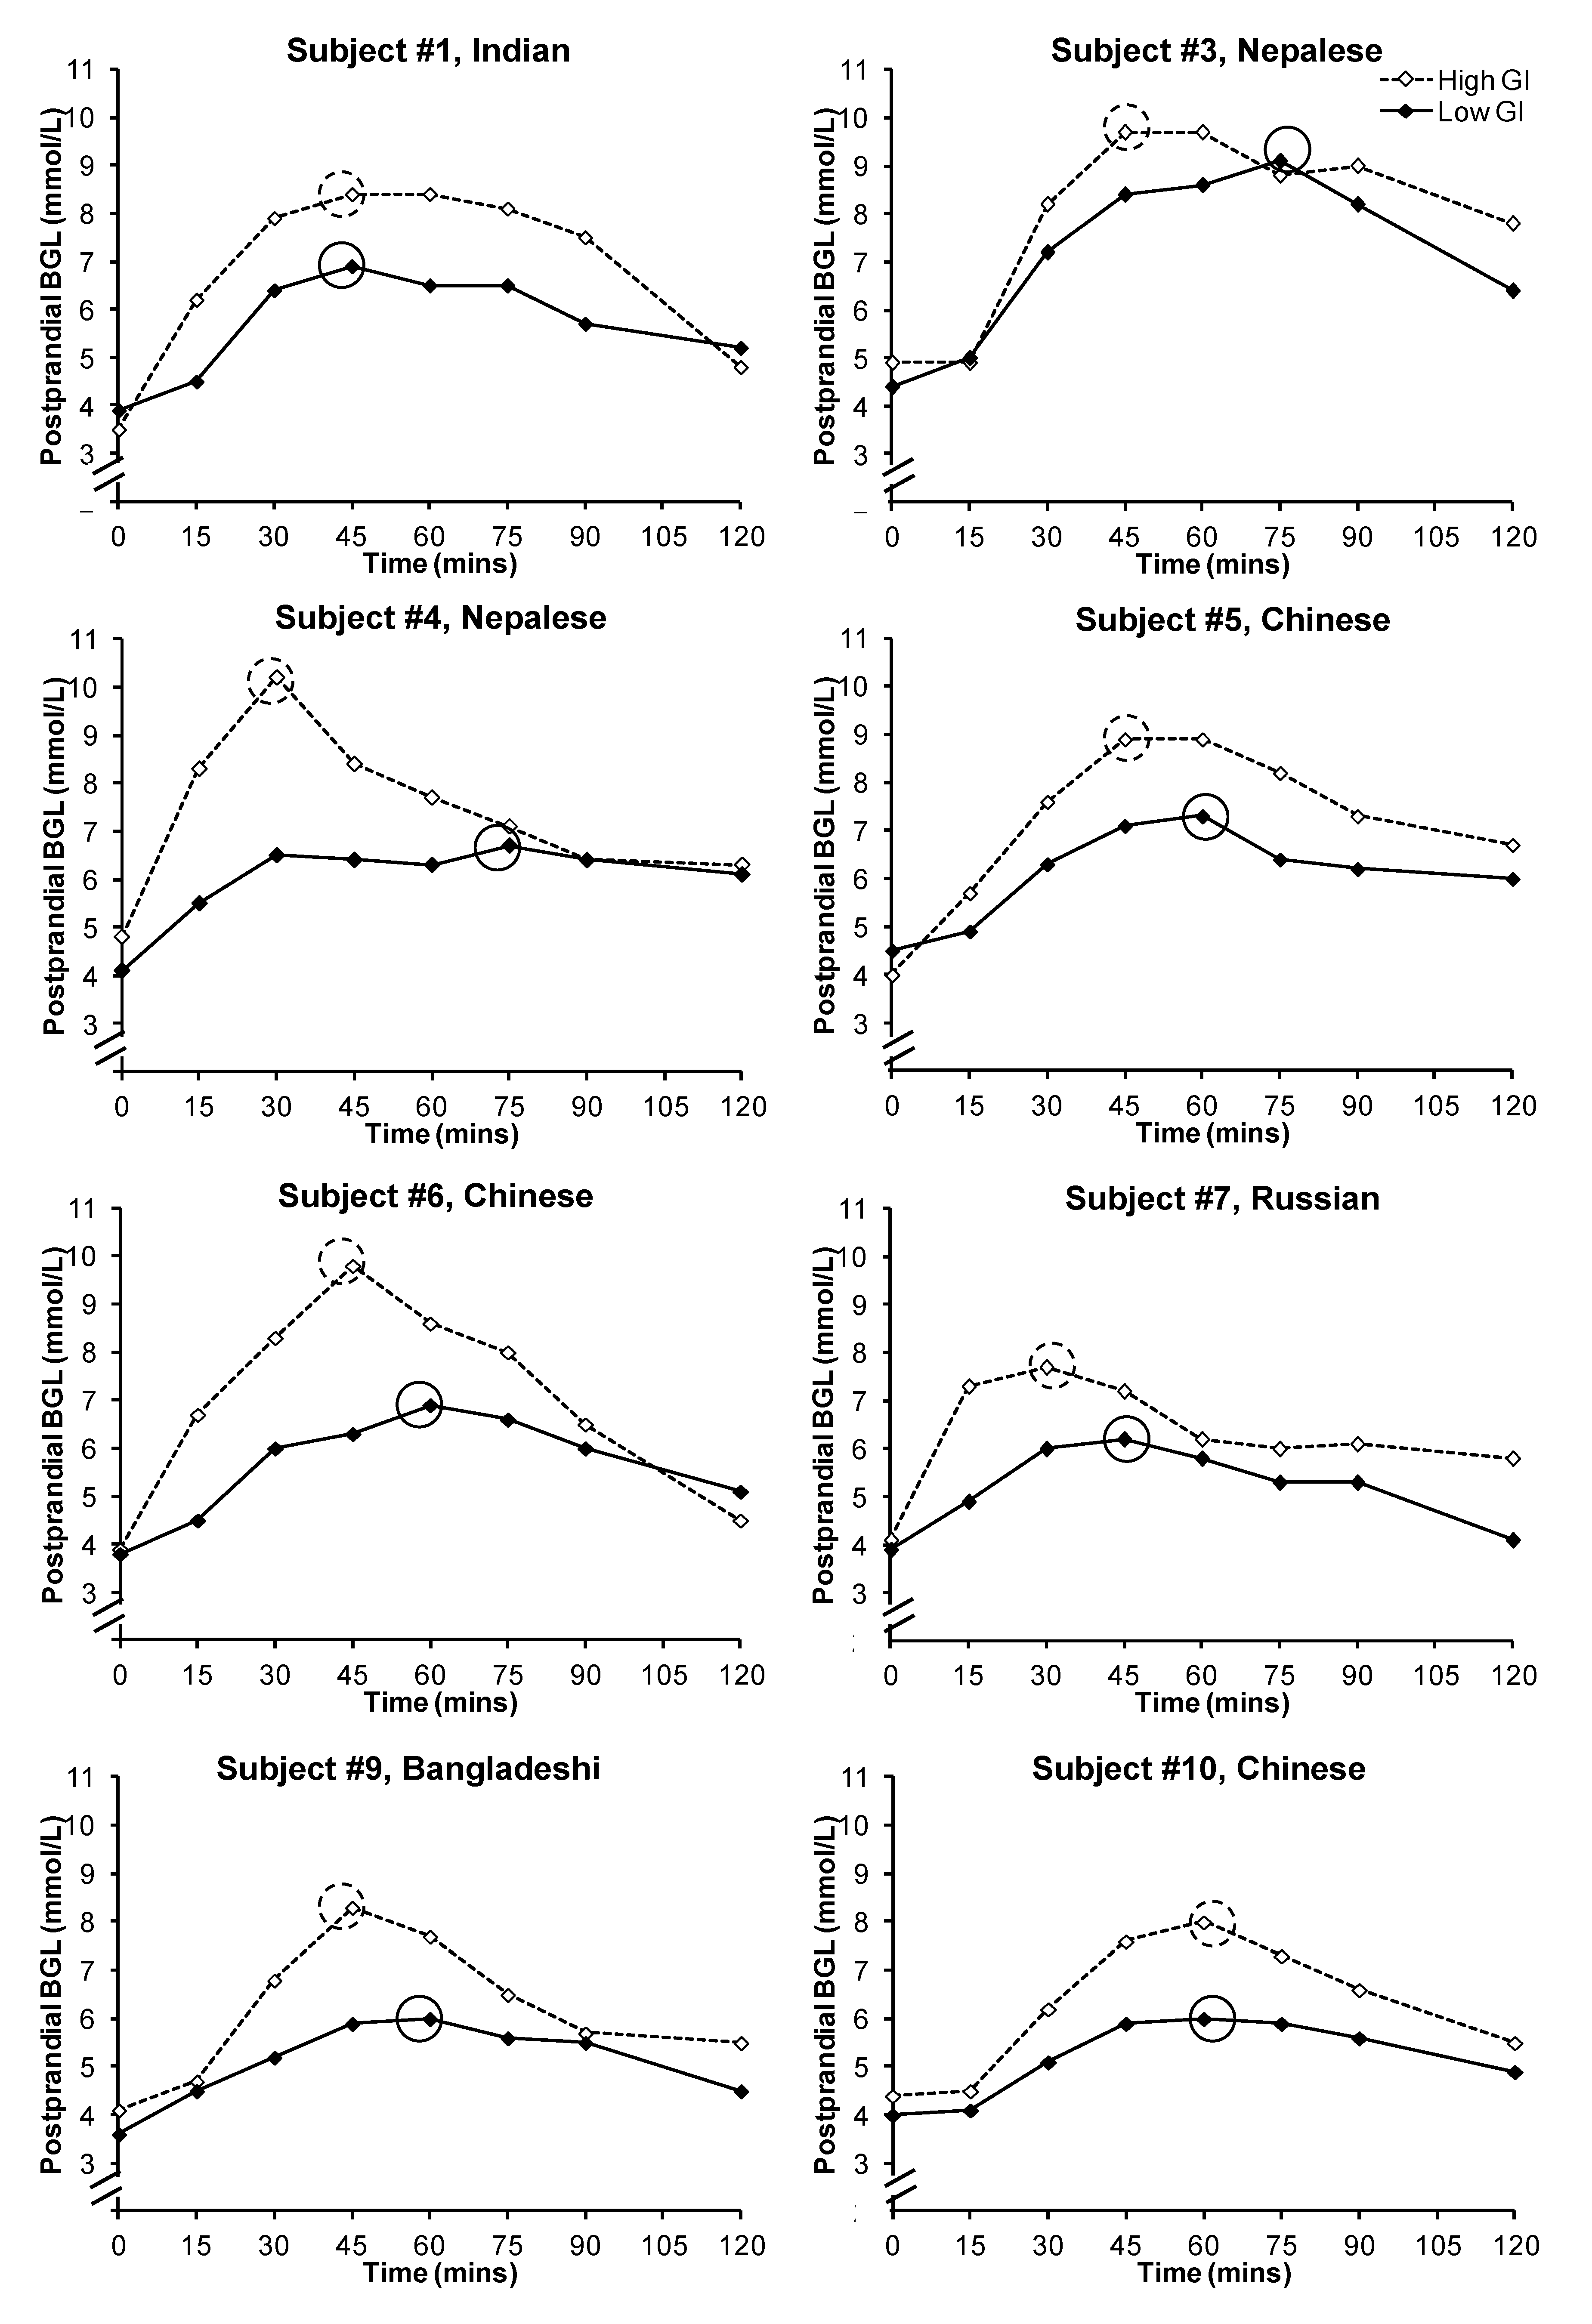
Figure 2.
Postprandial glycemic responses of the subjects after the consumption of a low or high glycemic index breakfast. Peak blood glucose levels were circled. Subjects #2 and #8 withdrew after the first test session and hence their individual data were not presented.
Figure 2.
Postprandial glycemic responses of the subjects after the consumption of a low or high glycemic index breakfast. Peak blood glucose levels were circled. Subjects #2 and #8 withdrew after the first test session and hence their individual data were not presented.
2.7. Ethics Approval
This study was conducted according to the guidelines laid down in the Declaration of Helsinki and all procedures involving human subjects/patients were approved by the Human Research Ethics Committee of the Sydney South West Area Health Service (RPAH Zone). Written, informed consent was obtained from all subjects in this study.
3. Results
The study sample included five South Asians (Indian, Nepalese and Bangladeshi), four Chinese, and one Caucasian. The subjects attended the first and second session at a mean ± SEM of 33.5 ± 0.5 and 35.1 ± 0.6 weeks of gestation respectively. There was no difference in BMI (first visit: 24.9 ± 0.4 kg/m2 vs. second visit: 26.1 ± 0.9 kg/m2; p = 0.212) and mean 7-day fasting BGL (first visit: 4.8 ± 0.1 mmol/L vs. second visit: 4.8 ± 0.1 mmol/L; p = 0.461) on the test days. No subject started insulin therapy during the study period.
Overall the consumption of a high GI bread-based breakfast resulted in higher postprandial glycemia (
Figure 1). The mean ± SEM iAUC
glucose after a low GI breakfast was significantly lower than that after the consumption of a high GI breakfast (212.7 ± 22.9
vs. 340.8 ± 23.4;
p = 0.001). The mean ± SEM peak BGL was 6.7 ± 0.3 mmol/L for the low GI breakfast and 8.6 ± 0.3 mmol/L for the high GI breakfast (
p < 0.001). However, there was large inter-subject variability in the timing of the peak between the two test meals (
Figure 2): the peak occurred between 45 and 75 min for the low GI breakfast (mean ± SEM: 60.0 ± 4.0 min), and between 30 and 60 min for the high GI breakfast (mean ± SEM: 43.1 ± 3.4 min;
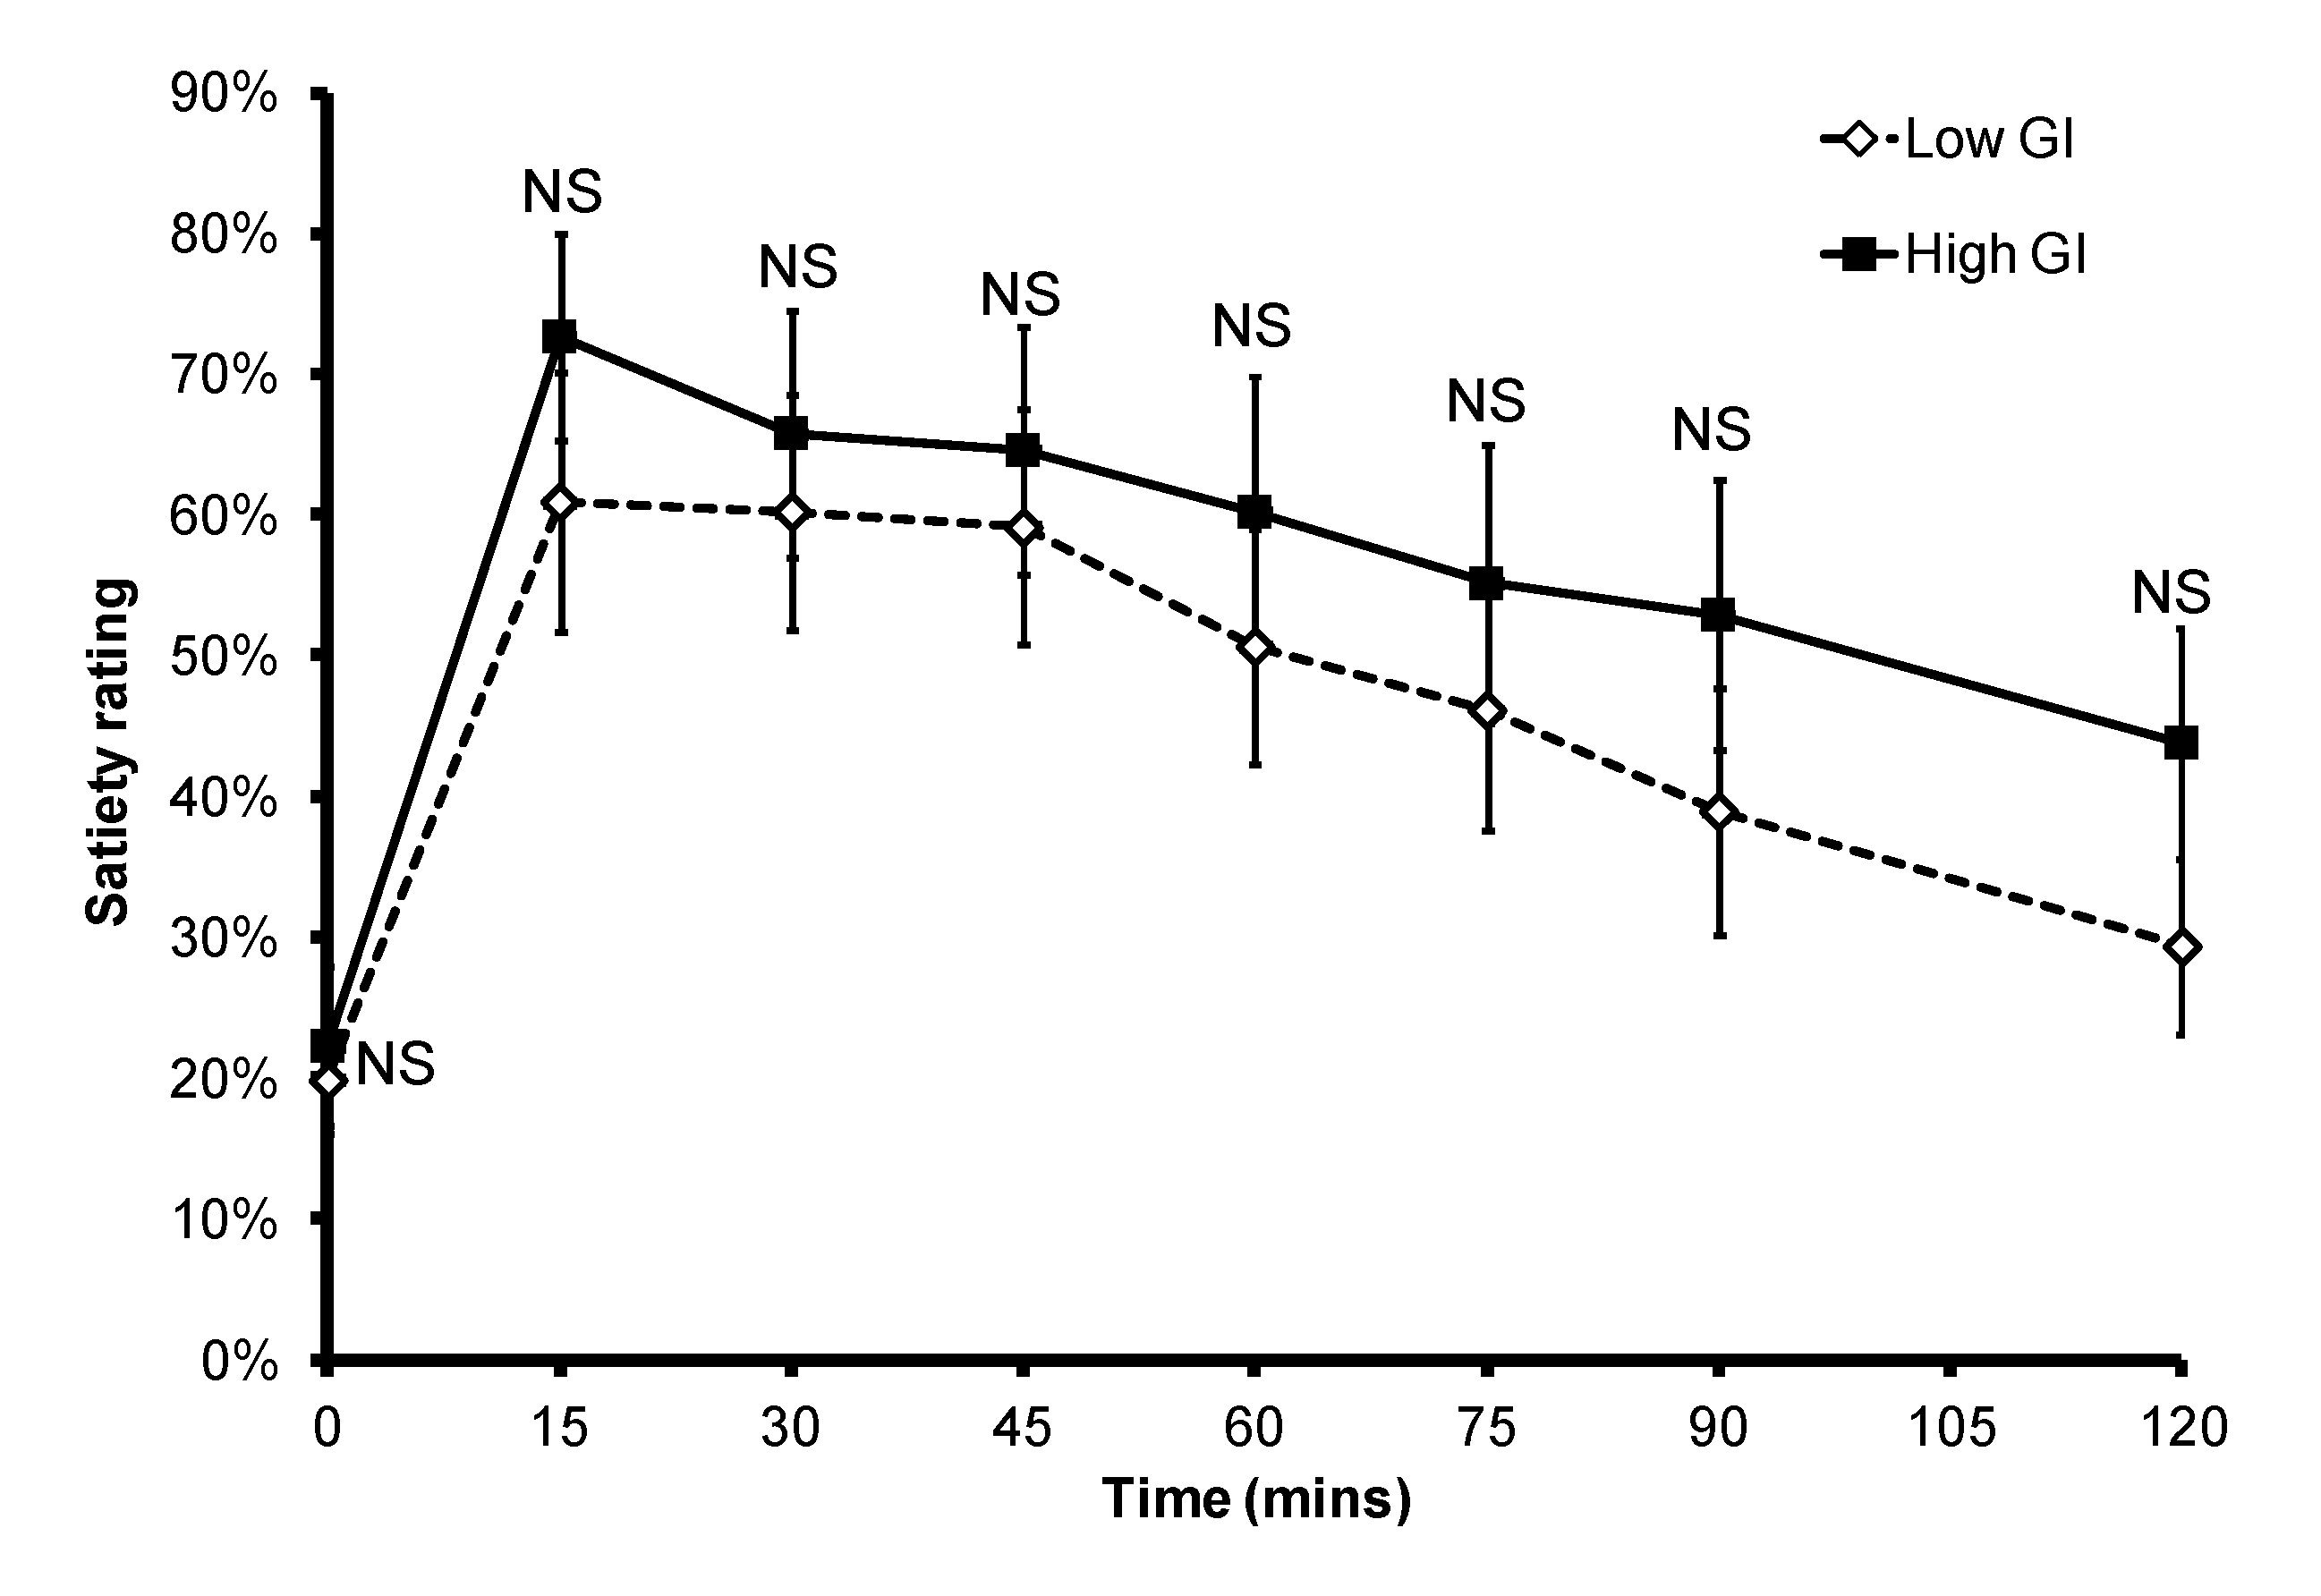
p = 0.015). In the eight subjects who provided data for both breakfasts, six had a delayed peak PBGL time after consuming the low GI breakfast when compared to that of the high GI breakfast. There was no significant difference in subjective satiety throughout the 2-h test period (
Figure 3).
Figure 3.
Subjective satiety after a low or high GI breakfast. NS: non-significant.
Figure 3.
Subjective satiety after a low or high GI breakfast. NS: non-significant.
4. Discussion
This study is the first attempt to examine the timing of the peak PBGL in women with GDM after consumption of breakfasts of different GI values. We expected to see differences in the peak concentration but similar timing of the peak. However we found that the low GI breakfast produced a peak at closer to 60 min after the start of the meal compared with ~45 min after the high GI breakfast.
It has been previously shown that a low GI diet produces comparable outcomes as a conventional high fibre diet in pregnancy complicated with GDM [
11]. The limited evidence on the efficacy of a low GI diet for the management of GDM has suggested that a low GI diet may improve postprandial glycemia [
10,
16], therefore reducing excessive transfer of maternal blood glucose to the fetus. In GDM, breakfast was shown to have the greatest variability in postprandial glycemic response [
17]. The results from our study suggested that a low GI breakfast may be of benefit in the management of post-breakfast glycemia.
Since peak PBGL has been shown to be more strongly associated with outcomes of GDM pregnancy [
18] than 2-h PBGL, it is important to accurately time the postprandial SBGM testing to capture the peak BGL. In healthy, non-pregnant subjects low and high GI meals reach peak concentrations at the same time,
i.e., at 30 min [
12]. However during pregnancy, especially those complicated with GDM, changes in gastric motility [
13] and insulin sensitivity [
14] can be expected to alter the rate of carbohydrate digestion and absorption, and hence shape of the postprandial glucose curve. Indeed, Wolever
et al. [
19] showed that the peak PBGL after a standard test meal occurred later and later as glucose tolerance worsened in subjects with diabetes.
A previous study had found that the peak PBGL in GDM occurs at about 60 min post meal [
7]. Therefore SBGM that tests the 2 h PBGL may miss the glucose peak, and the clinical decision to commence insulin therapy was usually based on a cut-off of 1-h PBGL [
6]. We found that while a low GI breakfast delayed the peak PBGL in GDM, the peak occurs closer to 60 min after the start of the meal than a high GI breakfast, which produced a peak at ~45 min post meal. Therefore our results suggested the findings of the study by Moses
et al. [
10], which demonstrated that a low GI diet reduces the need for insulin in GDM for BGL management, was indeed due to the fact that low GI meals produce a lower peak PBGL at 60 min post meal. Our results also suggest that the 1-h postprandial SBGM reading is likely to underestimate the actual postprandial glycemic response to a high GI meal. Therefore our finding raises the question whether the GI of the patient’s diet should be considered in the interpretation of SBGM results.
Our study has limitations, including a small sample size and a high proportion of Asian subjects, which compromises the generalizability of the findings. In addition, the non-continuous nature of blood sample collection did not allow accurate determination of the actual peak time. However, more frequent fingerprick blood sampling would be impractical. Although continuous glucose monitoring might be helpful in this context, it measures changes in the interstitial fluid rather than capillary blood, and by nature is subject to a delay [
20,
21,
22].
5. Conclusions
The low GI breakfast produces lower postprandial glycemia than a macronutrient matched high GI breakfast. The timing of the peak BGL varies within and between breakfasts of different GI. The peak PBGL after a high GI breakfast occurs at ~45 min, 15 min earlier than that of a low GI breakfast. The peak PBGL of a low GI breakfast occurs closer to the time recommended for PBGL monitoring in GDM. Since many women consume high GI meals throughout pregnancy, there are implications for clinical practice.
Acknowledgments
This study was funded by internal revenue. The authors would like to thank the subjects for their participation.
Conflict of Interest
JCBM is a co-author of The New Glucose Revolution book series (Hodder and Stoughton, London, UK; Marlowe and Co., New York, NY, USA; Hodder Headline, Sydney; and elsewhere), is the director of a not-for-profit GI-based food endorsement program in Australia, and manages the University of Sydney GI testing service. All other authors declare they have no conflict of interest.
References
- Scholl, T.O.; Chen, X.; Khoo, C.S.; Lenders, C. The dietary glycemic index during pregnancy: Influence on infant birth weight, fetal growth, and biomarkers of carbohydrate metabolism. Am. J. Epidemiol. 2004, 159, 467–474. [Google Scholar] [CrossRef]
- Metzger, B.E.; Lowe, L.P.; Dyer, A.R.; Trimble, E.R.; Sheridan, B.; Hod, M.; Chen, R.; Yogev, Y.; Cousta, D.R.; Catalano, P.M.; et al. Hyperglycemia and adverse pregnancy outcome (hapo) study: Associations with neonatal anthropometrics. Diabetes 2009, 58, 453–459. [Google Scholar]
- Ben-Haroush, A.; Yogev, Y.; Chen, R.; Rosenn, B.; Hod, M.; Langer, O. The postprandial glucose profile in the diabetic pregnancy. Am. J. Obstet. Gynecol. 2004, 191, 576–581. [Google Scholar] [CrossRef]
- Leguizamon, G.; von Stecher, F. Third trimester glycemic profiles and fetal growth. Curr. Diab. Rep. 2003, 3, 323–326. [Google Scholar] [CrossRef]
- Jovanovic-Peterson, L.; Peterson, C.M.; Reed, G.F.; Metzger, B.E.; Mills, J.L.; Knopp, R.H.; Aarons, J.H. Maternal postprandial glucose levels and infant birth weight: The diabetes in early pregnancy study. The national institute of child health and human development—Diabetes in early pregnancy study. Am. J. Obstet. Gynecol. 1991, 164, 103–111. [Google Scholar]
- Jovanovic, L. Point: Yes, it is necessary to rely entirely on glycemic values for the insulin treatment of all gestational diabetic women. Diabetes Care 2003, 26, 946–947. [Google Scholar] [CrossRef]
- Jovanovic, L. Using meal-based self-monitoring of blood glucose as a tool to improve outcomes in pregnancy complicated by diabetes. Endocr. Pract. 2008, 14, 239–247. [Google Scholar]
- Wolever, T.M. The glycemic index. World Rev. Nutr. Diet. 1990, 62, 120–185. [Google Scholar]
- Lock, D.R.; Bar-Eyal, A.; Voet, H.; Madar, Z. Glycemic indices of various foods given to pregnant diabetic subjects. Obstet. Gynecol. 1988, 71, 180–183. [Google Scholar]
- Moses, R.G.; Barker, M.; Winter, M.; Petocz, P.; Brand-Miller, J.C. Can a low-glycemic index diet reduce the need for insulin in gestational diabetes mellitus? A randomized trial. Diabetes Care 2009, 32, 996–1000. [Google Scholar] [CrossRef]
- Louie, J.C.; Markovic, T.P.; Perera, N.; Foote, D.; Petocz, P.; Ross, G.P.; Brand-Miller, J.C. A randomized controlled trial investigating the effects of a low-glycemic index diet on pregnancy outcomes in gestational diabetes mellitus. Diabetes Care 2011, 34, 2341–2346. [Google Scholar] [CrossRef]
- Brand-Miller, J.C.; Stockmann, K.; Atkinson, F.; Petocz, P.; Denyer, G. Glycemic index, postprandial glycemia, and the shape of the curve in healthy subjects: Analysis of a database of more than 1000 foods. Am. J. Clin. Nutr. 2009, 89, 97–105. [Google Scholar]
- Wald, A.; van Thiel, D.H.; Hoechstetter, L.; Gavaler, J.S.; Egler, K.M.; Verm, R.; Scott, L.; Lester, R. Effect of pregnancy on gastrointestinal transit. Dig. Dis. Sci. 1982, 27, 1015–1018. [Google Scholar] [CrossRef]
- Butte, N.F. Carbohydrate and lipid metabolism in pregnancy: Normal compared with gestational diabetes mellitus. Am. J. Clin. Nutr. 2000, 71, 1256S–1261S. [Google Scholar]
- AUSNUT 2007. Available online: http://www.foodstandards.gov.au/consumerinformation/ausnut2007/ (accessed on 30 September 2012).
- Grant, S.M.; Wolever, T.M.S.; O’Connor, D.L.; Nisenbaum, R.; Josse, R.G. Effect of a low glycaemic index diet on blood glucose in women with gestational hyperglycaemia. Diabetes Res. Clin. Pract. 2011, 91, 15–22. [Google Scholar] [CrossRef]
- Peterson, C.M.; Jovanovic-Peterson, L. Percentage of carbohydrate and glycemic response to breakfast, lunch, and dinner in women with gestational diabetes. Diabetes 1991, 40, 172–174. [Google Scholar]
- Bühling, K.J.; Winkel, T.; Wolf, C.; Kurzidim, B.; Mahmoudi, M.; Wohlfarth, K.; Wäscher, C.; Schink, T.; Dudenhausen, J.W. Optimal timing for postprandial glucose measurement in pregnant women with diabetes and a non-diabetic pregnant population evaluated by the Continuous Glucose Monitoring System (CGMS). J. Perinat. Med. 2005, 33, 125–131. [Google Scholar]
- Wolever, T.M.; Chiasson, J.L.; Csima, A.; Hunt, J.A.; Palmason, C.; Ross, S.A.; Ryan, E.A. Variation of postprandial plasma glucose, palatability, and symptoms associated with a standardized mixed test meal versus 75 g oral glucose. Diabetes Care 1998, 21, 336–340. [Google Scholar] [CrossRef]
- Ellison, J.M.; Stegmann, J.M.; Colner, S.L.; Michael, R.H.; Sharma, M.K.; Ervin, K.R.; Horwitz, D.L. Rapid changes in postprandial blood glucose produce concentration differences at finger, forearm, and thigh sampling sites. Diabetes Care 2002, 25, 961–964. [Google Scholar] [CrossRef]
- Stout, P.J.; Peled, N.; Erickson, B.J.; Hilgers, M.E.; Racchini, J.R.; Hoegh, T.B. Comparison of glucose levels in dermal interstitial fluid and finger capillary blood. Diabetes Technol. Ther. 2001, 3, 81–90. [Google Scholar] [CrossRef]
- Cengiz, E.; Tamborlane, W.V. A tale of two compartments: Interstitial versus blood glucose monitoring. Diabetes Technol. Ther. 2009, 11, S11–S16. [Google Scholar] [CrossRef]
© 2013 by the authors; licensee MDPI, Basel, Switzerland. This article is an open-access article distributed under the terms and conditions of the Creative Commons Attribution license (http://creativecommons.org/licenses/by/3.0/).


