The Prevalence of Food Addiction as Assessed by the Yale Food Addiction Scale: A Systematic Review

 , and
, and
Abstract
:1. Introduction
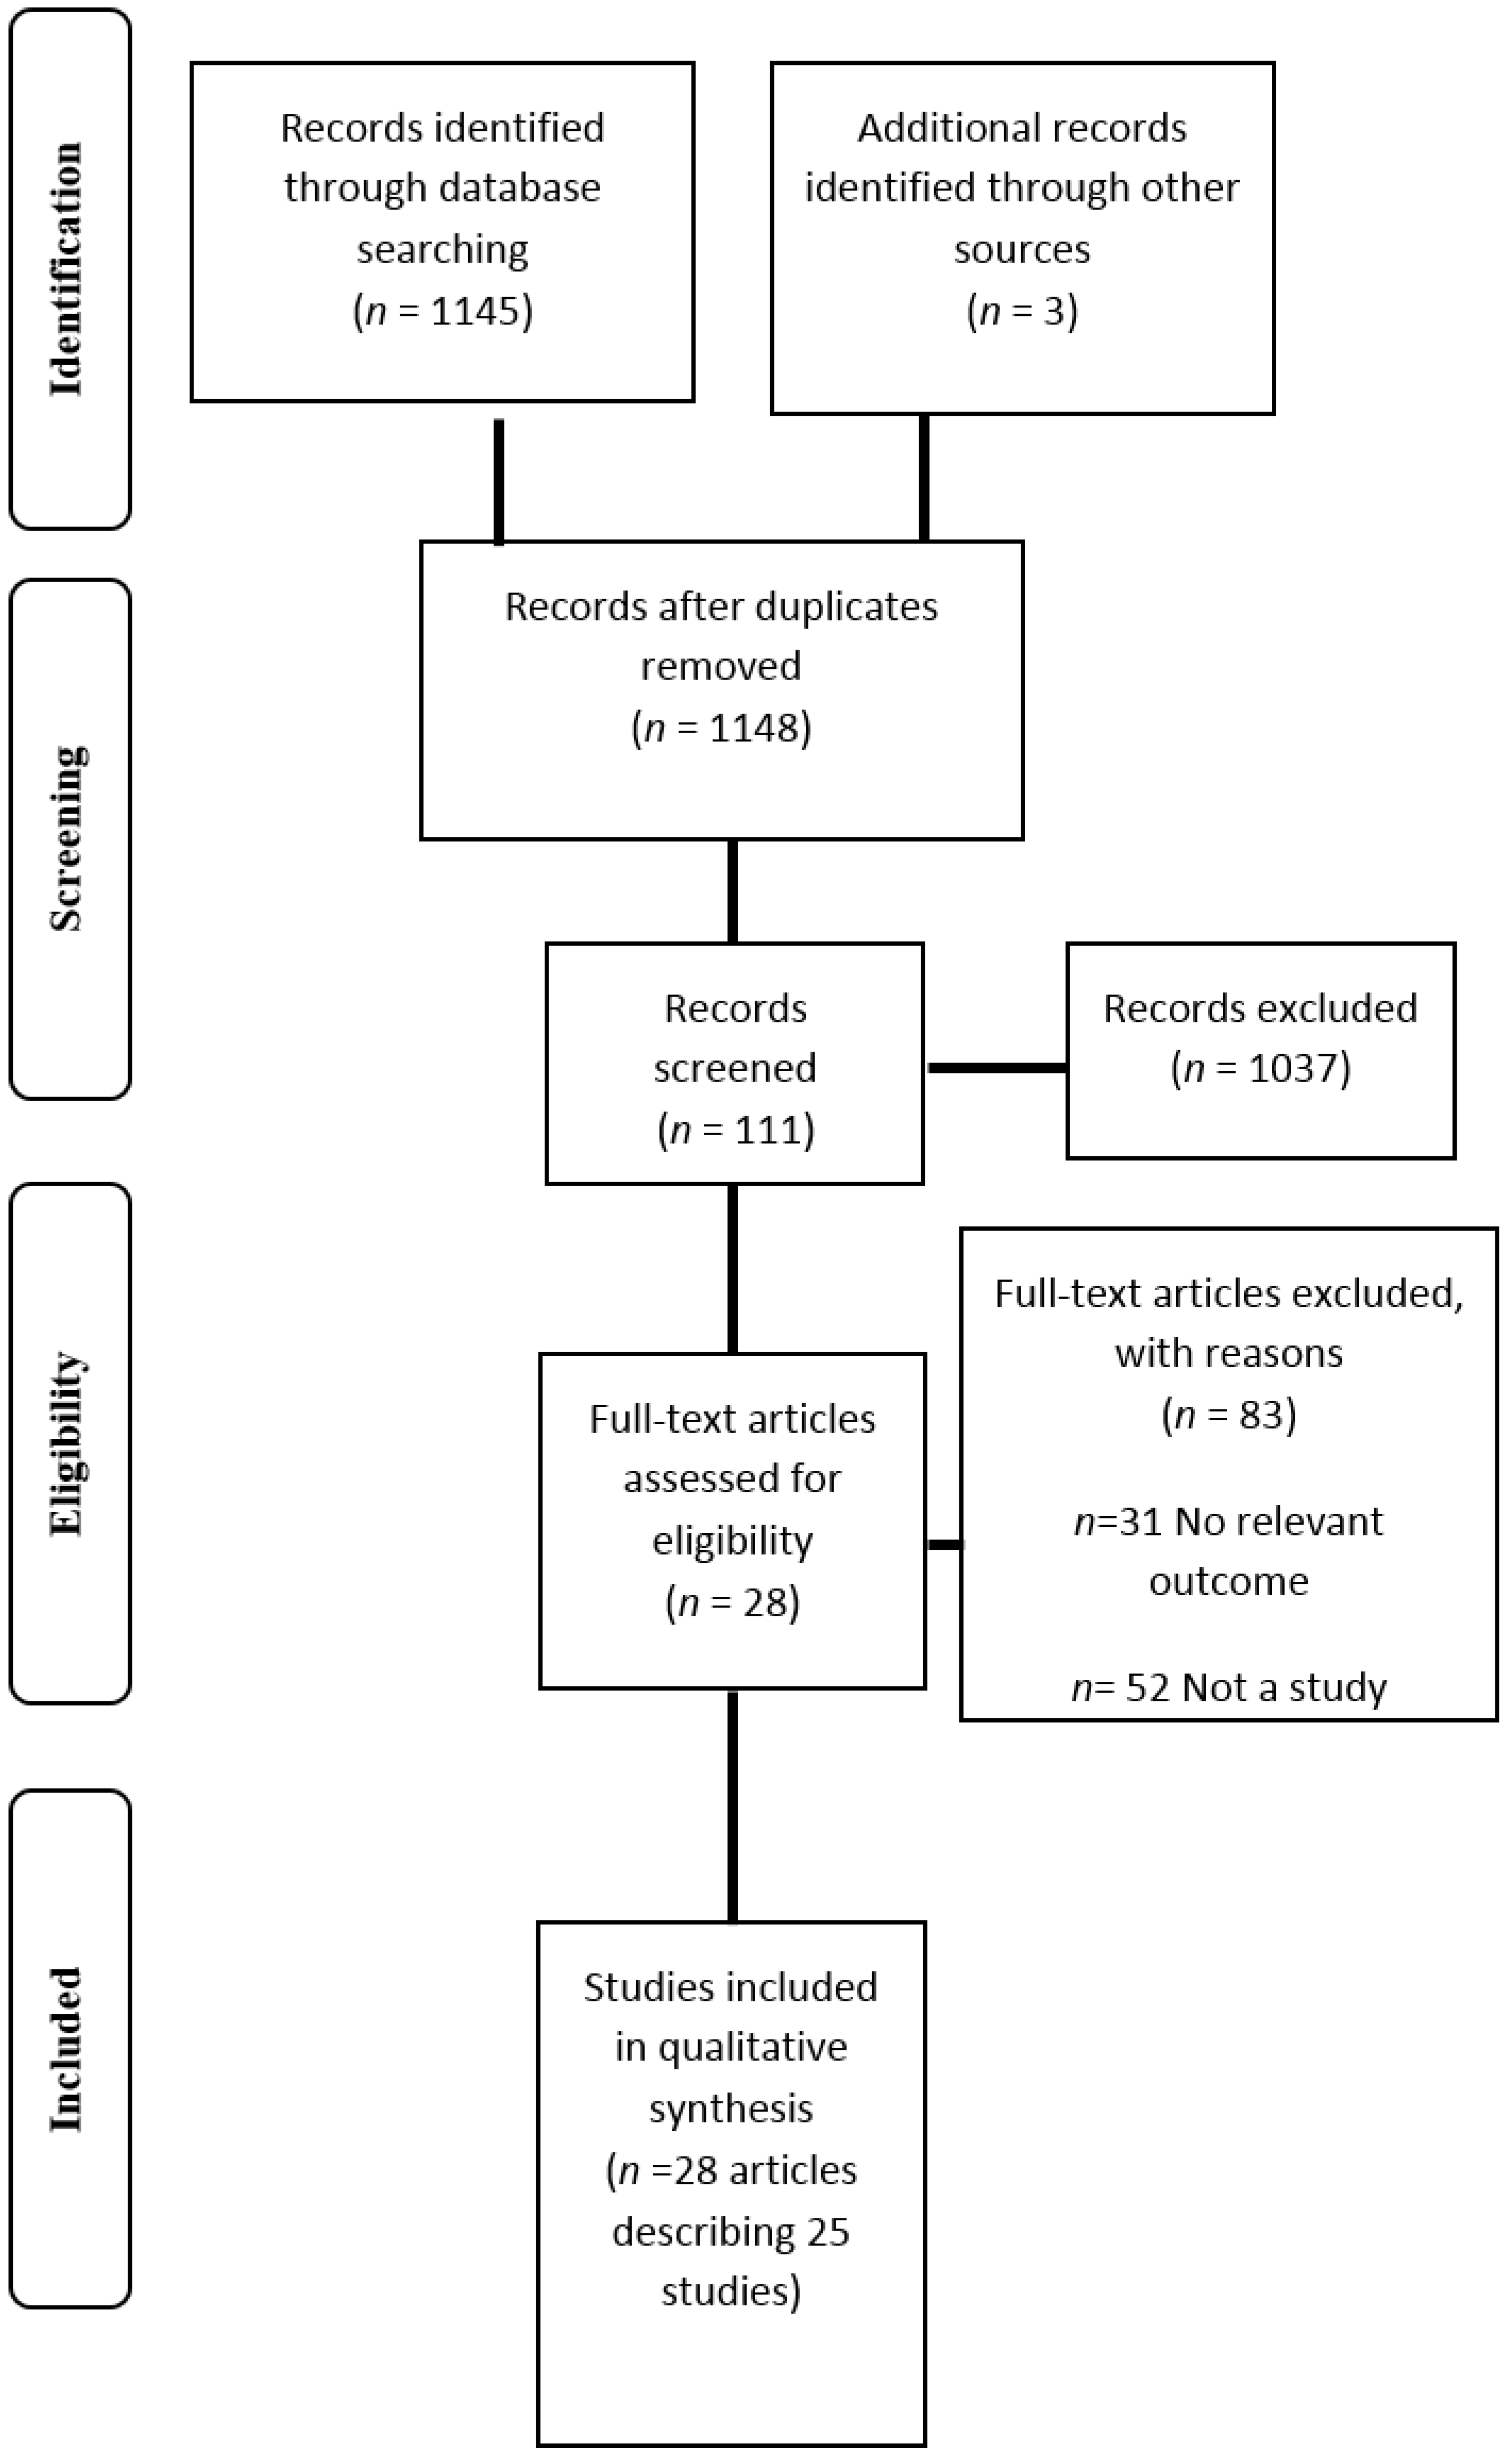
2. Methods
3. Results


| Type of study | Number of participants | Population studied | Participant characteristics | Study information | Outcome measures | YFAS details (e.g., Type and method of administration) | Symptom score or diagnosis used? | Follow up? Duration? |
|---|---|---|---|---|---|---|---|---|
| Cross sectional | n = 553 | Non clinical sample | Age: 28.9 ± 12.0 years (95% CI 27.9–29.9 years). BMI: 22.5 ± 4.5 kg/m2 (95% CI 22.2–22.9 kg/m2). | Assessment of the psychometric properties of the French version of the YFAS. | Socio demographic characteristics; BMI; BES; the Bulimic Investigatory Test- Edinburgh | YFAS French version. Online questionnaire | D + SS | N/A |
| Cross sectional | n = 150 | College undergraduate students | 70.7% female Age: 24.4 years (range 17–60) BMI: 26.3 (range 16.4–51.0 kg/m2). 2% underweight, 52.7% HW, 22% OW, 18% OB, 5.3% severely OB. | Validation of the Palatable Eating Motives Scale. | PEMS; BES; Sensitivity to punishment and reward; BMI; Demographics | YFAS. Paper based survey completed at face to face session. | SS | N/A |
| Double blind crossover design | n = 136 | Healthy adults participating in a community based study of overeating | Age: 25–50 years 67.6% female Age food addicts 33.9 ± 5.9 years, non-food addicts 32.4 ± 6.6 years (NS). BMI: food addiction group 34.6 ± 7.0 kg/m2, non-food addiction group 33.8 ± 8.4 (NS). 26% food addicts and 20% control group smokers. | Part of a larger study. 3 assessment sessions Participants randomised to oral methylphenidate or placebo capsule. Methylphenidate suppresses appetite and reduces binge episodes. Participants could eat as much of snack food as desired 3 h post capsule | General FCQ- State; Appetite ratings, Snack food consumption; Demographics; Favorite snack foods; mood ratings. | Questionnaires distributed at initial session and completed at home. | D | 3 sessions, 1 week interval. |
| Cross sectional | n = 134,175 YFAS and modified YFAS on subsample n = 2061. | Female nurses in the USA involved in the NHS and NHS II | 100% female Age range: NHS 62–88 years, NHS II 45–64 years. BMI: NHS 43.7% HW, 34.2% OW, 22.2% OB. NHS II 40.2% HW, 30.5% OW, 29.2% OB. 86.6% NHS and 81.0% NHS II provided sufficient data | Biennial questionnaires. NHS established in 1976 with 121,700 nurses. Food addiction data collected 2008–2010. NHS II established in 1989 with 116,609 nurses. Food addiction data collected 2009–2011. | Demographics; Self-reported anthropometrics; Physical activity; Medical assessment | Modified YFAS NHS completed in written hardcopy, NHS II completed online. | D | N/A |
| Cross sectional | n = 815 | Non clinical sample of community volunteers | 88.1% female Age: 33 years (range 18–73) BMI: 28.70 ± 8.77 kg/m2 (range 14.60–69.23) 79.1% Caucasian | Investigate the relationships between YFAS and BMI, BN and BED. Grouped based on eating behavior: (1) FA only; (2) BED/BN exclusively; (3) BED + FA; (4) BN + FA; (5) healthy controls no FA. | Demographics, self-reported anthropometrics, Eating Disorder Examination Questionnaire, Questionnaire for Eating and Weight Patterns Revised. | YFAS. No details re completion. | D + SS | N/A |
| Cross sectional | n = 112 | OW and OB patients seeking low energy diet therapy | 71.4% female Age: 43.46 ± 12.91 years (range 18–73). BMI: 32.09 ± 6.76 kg/m2 (range 25.04–53.04). 49% used tobacco in previous 6 months. Majority employed and educated. | Aim: to test the association between FA, psychopathology and binge eating | BES; Symptom Checklist-90- Revised; Sociodemographic and clinical history. | Assessed at study baseline. YFAS translated in to Italian by authors. Cronbach’s alpha = 0.87 | D + SS | N/A |
| Cross sectional | n = 178 | OW/OB adults seeking/enrolled in behavioral weight loss treatment | Whole sample: 51.2 ± 11.7 years, 36.1 ± 4.8 kg/m2, 92.1% OB, 74.7% female, 69.1% African American. Study 1: n = 100, Age 55.6 ± 10.6 years, BMI 35.8 ± 5.3 kg/m2, 59% African American. Study 2: n = 78, Age 45.6 ± 10.6 years, BMI 36.4 ± 4.2 kg/m2, 82.1% African American. Completers were older than non-completers (p = 0.001). | Study 1: 6 month behavioral intervention for individuals with T2DM-randomised to portion controlled diet or self-management program. Study 2: enhanced behavioral treatment for emotional eating including portion control, mindfulness and emotion regulation | BDI; BMI; Demographics; Anthropometrics | YFAS. Scale adapted from “past year” to “past month”. Completed at baseline. | D + SS | 6 month weight loss program |
| Cross sectional/case control | n = 109 | Females with current BN recruited from outpatient clinics, remitted BN and control group | n = 26 current BN, n = 20 remitted BN, n = 63 control. Age: current BN 25.23 ± 5.82years, remitted BN 25.55 ± 3.72 years, control 23.57 ± 4.20 years (NS). BMI: current BN 20.92 ± 1.92 kg/m2, remitted BN 21.92 ± 1.50 kg/m2, control 21.84 ± 2.65 kg/m2 (NS). | Measurement of food addiction in BN and associations between BN symptomology and FA. | Eating disorder examination; DEBQ; Borderline Symptom List of BPD; Brief Symptom Inventory; Centre for Epidemiologic Studies Depression Scale-Short; Socio demographics; Anthropometrics | YFAS German version. No info re completion | D + SS | N/A |
| Cross sectional | n = 50 | Female students | n = 82 screened 100% female Age; 22.3 ± 3.0 years (range 19–32). BMI 21.5 ± 2.7 g/m2. 18 trying to control their weight. | Go no go trials where respond to X Y stimuli base on type of image shown: (high cal sweet or savory food images or neutral household objects). No food, caffeine, nicotine, or alcohol 3 h before task. FCQ completed immediately after task, other questionnaires completed same day or within 1–2 weeks. | Centre for Epidemiologic studies depression scale; BMI; Dieting status; Perceived self-regulatory success in dieting scale (PSRS); BIS-short; FCQ-S; Stop signal task (reaction times, errors). | YFAS. Completed on same day or within 1–2 weeks of task | SS | N/A |
| Cross sectional | n = 233 | Students at the University of Georgia | 77% female Age: 19.65 ± 2.15 years (range 18–32) BMI: 22.78 ± 4.0 kg/m2 (range 16.09–47.82 kg/m2). Underweight 5%, 73% HW, 16% OW, 5% OB. 84% white | Goal to investigate the relationships between food addiction, impulsive personality traits and weight status. | Impulsive behavior scale; demographics; Anthropometrics | YFAS. Pencil and paper format. | D + SS | N/A |
| Longitudinal (pre post test) | n = 44 | OB patients selected to undergo gastric bypass surgery | RYGB n = 25, LAGB n = 11, SG n = 8. Age: non-food addicted: 42.6 ± 10.9 years, food addicted: 43.2 ± 11.1 years. n = 39 female BMI pre surgery: non-food addicted 48.2 ± 8.2 kg/m2, food addicted 47.5 ± 8.0 kg/m2 (NS). BMI post-surgery: non-food addicted 38.5 ± 6.9 kg/m2, food addicted 37.7 ± 6.6 kg/m2 (NS). Non-food addicted 77% white, food addicted 86% white. | FA assessment pre and 9 months post gastric bypass surgery. Dietary counselling after surgery: liquid diet first week followed by 2–4 week progression to regular food 1000–1200 kcal/day. Dietitian involved- weekly phone or face to face weight monitoring, education and advice. | DEBQ (emotional, external and restrained eating); Food Craving Inventory | Assessed at baseline and following surgical weight loss of ~20%. Questionnaires administered in a private room onsite at the Washington University. | D + SS | 9 months |
| Cross sectional | n = 57 | OW/OB individuals seeking weight loss/part of weight loss intervention | 68.4% female Age: 47.4 ± 13.7 years BMI: 38.2 kg/m2 ± 8.1. 84.2% Caucasian 70.2% married 91.2% college education. | 18 week behavioral weight loss intervention. Individuals who met goals randomised to a lower intensity treatment at week 7. Results of the current study focus on outcomes up to 7 weeks prior to randomisation. | Centre for Epidemiological Studies Depression Scale; BES; DEBQ; Eating Self Efficacy Scale; Anti-Fat Attitudes questionnaire; Weight Bias; Objectified Body Consciousness Scale Body Shame; Multidimensional Body Self Relations Questionnaire Anthropometrics | YFAS. Completed at baseline | SS | 7 week weight loss intervention |
| Cross sectional | n = 67 | Post bariatric surgery patients recruited from surgery support group | 62.7% female Age: 42.27 years (range 25–73). 59.7% RYGB. 86.6% Caucasian | Validation of the YFAS in a post weight loss surgery population. Questionnaires completed before surgery | Demographics; BES; BIS/BAS reactivity; Eating attitudes test; Emotional eating scale; Michigan assessment screening test for alcohol and drugs; Alcohol, smoking and substance screening test | YFAS. Online survey. Completed pre surgery. | D + SS | N/A |
| Cross sectional | n = 120 | Recruited for overeating/OW study | 68.3% female Age: food addicts 34.7 ± 5.9 years (range 45–44), non food addicts 32.5 ± 6.6 years (range 25–47) (NS) BMI: Food addicts: 35.5 ± 7.3 kg/m2 (range 22–49.4), Non food addicts 33.1 ± 8.9 kg/m2 (range 19–60) (NS). 24% met diagnostic criteria for BED. | Investigate relationships between YFAS and genotypes. | Demographics; Anthropometrics; Multilocus genetic profile; PFS; Binge eating questionnaire; DEBQ (emotional eating); Eating behaviors questionnaire (snacking on sweets); FCQ | YFAS. Paper based, taken home to complete. | D | N/A |
| Cross sectional | n = 75 | Children and their parents recruited from a larger study on family eating habits | n = 117 recruited 42.7% female. Age: 8.32 ± 2.78 years (range 4–16 years) Parents 65.1% Caucasian. | Validation study of the YFAS for children. | BMI percentile (parental report); Child eating behavior questionnaire. | YFAS-C. Parents could complete scale. | D + SS | N/A |
| Cross sectional | n = 96 | OB BED patients respondents to a treatment study. | 75.8% female. Age: 44.88 ± 12.82 years (range 19–65). BMI: 38.30 ± 5.73 kg/m2. 45.3% Caucasian, 32.6% African American, 12.6% Hispanic. 74.7% had college education. | Explore incremental validity of YFAS in predicting binge eating behavior beyond other measures. | Eating disorder examination; BDI-II; Difficulties in emotion regulation scale (DERS); Questionnaire on eating and weight problems revised (QWEP-R) | YFAS. No information re completion | D + SS | N/A |
| Cross sectional | n = 57,321 | Female registered nurses involved in the NHS II | 75% response rate 100% female NHS II age 25–42 years. | Biennial questionnaires 2001 survey included questions about experiences of sexual and physical abuse. 2009 survey included modified version of the YFAS. | Sexual and physical abuse experienced in childhood or adolescence (2001); Food addiction status (2009) | Modified YFAS. | D | N/A |
| Cross sectional | n = 652 | Citizens of Canadian provinces Newfoundland and Labrador | 63.7% female. Age: 44.3 ± 12.9 years (range 20–90). Age female 45.1 ± 12.9, male 42.9 ± 12.8 (p < 0.05). BMI: 27.4 ± 5.4 kg/m2 (range 17.05–54.2). Waist hip ratio 0.9 ± 0.08 (range 0.68–1.62). BMI female 26.8 ± 5.7, male 28.5 ± 4.6 (p < 0.05). Underweight/normal weight BMI 38.2%, OW/OB BMI 61.8%. | Investigation of food addiction in Canadian province and relationships with gender and weight status. 12 h fast prior to measurements | Anthropometrics; Body composition; Food frequency questionnaire (macronutrient intake); Physical activity | YFAS. No information re completion. | D + SS | N/A |
| Cross sectional | n = 81 | OB individuals who “eat out of control” and are seeking weight treatment | 70.1% female Age: 47.47 ± 8.43 years (range 28–64) BMI: 40.58 ± 6.63 kg/m2. 79.3% Caucasian 82.6% had some college education. | Eating disorder confirmed by interview followed by battery of self-report questionnaires. | Anthropometrics; Eating Disorder Examination; BDI; Difficulties in Emotion Regulation Scale; Rosenberg Self Esteem Scale. | YFAS. No information re completion | D + SS | N/A |
| Case report | n = 1 | Female who believed she was addicted to cola. | 40 year old female. Heavy smoker, depression, metabolic syndrome. Weight: 72.9 kg. FBG: 5.9 mmol/L, HDL: 1.17 mmol/L, triglycerides 0.75 mmol/L. | Patient used cola to boost energy (3 L daily). Offered cognitive therapy for depression. Reduced cola consumption to 200 mL. | Major Depression Inventory; Hamilton Depression Scale; Young Mania Rating Scale; Global Assessment of Functioning; Waist circumference; blood pressure; Fasting blood glucose; HDL; triglycerides. | YFAS Danish version | Points | 6 months |
| Cross sectional | n = 617 completed all surveys. 1 excluded. Retest completed by n = 197 | Students at German universities | 38.2% survey completion rate 75.8% female Age: 24.5 ± 4.0 years. BMI: 22.3 ± 3.3 g/m2. 89% students 95.5% German citizens. 39.1% Non-dieters, 14.6% successful dieters, 22.7% unsuccessful dieters. Sig greater BMI in unsuccessful dieters than successful dieters and non-dieters (p < 0.001). | Validation of the German version of Food Cravings Questionnaire. Investigation of the relationships between food addiction and craving. | BMI; FCQ; Restraint scale subscale concern for dieting (RS-CD); Perceived self-regulatory success in dieting (PSRS); Flexible and rigid control of eating behavior; Eating disorder examination questionnaire (EDE-Q); Mannheimer Craving Scale (MaCS); BIS/BAS; PANAS. | YFAS. Online survey. | SS | N/A |
| Cross sectional | n = 96 | Individuals attending first bariatric surgery consultation | 65.6% female Age: 39.92 ± 11.51 years BMI: 50.64 ± 8.99 (range 34.89–73.44 kg/m2). 91.7% had BMI ≥ 40 kg/m2. | Investigation of food addiction of individuals attending first bariatric consultation | - | German YFAS. Completed on day of bariatric consultation | D + SS | N/A |
| Cross sectional | n = 72 | Non clinical sample of OW/OB adults | 68.1% female Age: Food addicts 35.3 years, non addicts 33.0 years. BMI food addicts 37.5 kg/m2, non addicts 38.8 kg/m2. % female food addicts 72.2%, non addicts 66.7%. | Validation of YFAs in non-clinical OW/OB individuals. | Eating Disorder Examination; BDI; Wender Utah rating scale for ADHD symptoms; BIS; Delay of gratification task; Eyesnck personality questionnaire revised; PFS; DEBQ (emotional and external eating); FCQ-T; Demographics | YFAS. Completed at home | D + SS | N/A |
| Cross sectional | n = 48. n = 9 excluded | Recruited from a weight loss and maintenance program | 100% female Age: 20.8 ± 1.31 years BMI: 28.0 ± 3.0 kg/m2 (range 23.8–39.2). | Neural responses of OB vs. normal weight individuals to milkshake. | Anthropometrics; fMRI | YFAS. No information re completion | SS | N/A |
| Cross sectional | n = 353 | Undergraduate students | Response rate 24.5%. 64.2% female Age: 20.11 ± 1.38 years. BMI: 22.58 ± 3.18 kg/m2. 73.5% HWR, 18.7% OW, 4.7% underweight, 2.7% OB. 72.5% Caucasian. | Initial validation study of YFAS. | BES; BIS/BAS; Eating Troubles Module; Emotional eating scale; Rutgers alcohol problem index; Daily drinking questionnaire. | YFAS. Part of larger health behaviors online survey. | D + SS | N/A |
| Author, year | Was a random or pseudo random sample used? | Was the inclusion criteria clearly defined? | Were confounding factors identified and control strategies stated? | Were outcomes assessed using objective criteria | Was there sufficient description of the groups? | Was follow up carried out over a sufficient time period? | Were the outcomes of people who withdrew described and included in analysis? | Were outcomes measured in a reliable way? | Was appropriate statistical analysis used? | Quality score |
|---|---|---|---|---|---|---|---|---|---|---|
| BRUNAULT 2014 [32] | UC | N | UC | Y | UC | N/A | UC | Y | Y | 1 |
| BURGESS 2014 [33] | Y | Y | Y | Y | Y | N/A | UC | Y | Y | 6 |
| DAVIS 2014 [34] | N | Y | Y | Y | Y | Y | UC | Y | Y | 6 |
| FLINT 2014 [35] | Y | Y | Y | Y | Y | N/A | Y | Y | Y | 8 |
| GEARHARDT 2014 [36] | Y | Y | Y | Y | Y | N/A | UC | Y | Y | 6 |
| IMPERATORI 2014 [37] | N | Y | Y | Y | UC | N/A | UC | Y | Y | 3 |
| LENT 2014 [38] | N | N | Y | Y | Y | N/A | Y | Y | Y | 6 |
| MEULE 2014 [40] | Y | Y | UC | Y | Y | N/A | Y | Y | Y | 6 |
| MEULE 2014 [41] | Y | Y | Y | Y | N | N/A | UC | Y | Y | 5 |
| MURPHY 2014 [43] | Y | N | Y | Y | N/A | N/A | UC | Y | Y | 4 |
| PEPINO 2014 [44] | N | Y | UC | Y | Y | Y | N | Y | Y | 5 |
| BURMEISTER 2013 [45] | Y | Y | UC | Y | N/A | Y | Y | Y | Y | 6 |
| CLARK 2013 [46] | UC | N | UC | Y | N/A | N/A | Y | Y | Y | 2 |
| DAVIS 2013 [47] | Y | Y | Y | Y | Y | N/A | UC | Y | Y | 6 |
| EICHEN 2013 [39] | N | UC | Y | Y | Y | N/A | UC | Y | Y | 3 |
| GEARHARDT 2013 [48] | Y | N | Y | Y | N/A | N/A | N | Y | Y | 5 |
| GEARHARDT 2013 [49] | Y | Y | UC | Y | Y | N/A | N | Y | Y | 5 |
| MASON 2013 [50] | Y | N | Y | Y | Y | N/A | UC | Y | Y | 5 |
| PEDRAM 2013 [51] | Y | Y | Y | Y | Y | N/A | UC | Y | Y | 6 |
| GEARHARDT 2012 [27] | Y | N | UC | Y | Y | N/A | UC | Y | Y | 3 |
| MEULE 2012 [56] | N | N | UC | Y | N/A | N/A | UC | Y | Y | 1 |
| MEULE 2012 [42] | Y | Y | UC | Y | Y | N/A | UC | Y | Y | 4 |
| MEULE 2012 [53] | Y | N | UC | Y | Y | N/A | N | Y | Y | 4 |
| MEULE 2012 [54] | Y | N | Y | Y | Y | N/A | N | Y | Y | 6 |
| DAVIS 2011 [57] | Y | Y | UC | Y | Y | N/A | UC | Y | UC | 2 |
| GEARHARDT 2011 [11] | UC | Y | Y | Y | N | N/A | N | Y | Y | 4 |
| GEARHARDT 2009 [26] | Y | N | UC | Y | N/A | N/A | N | Y | Y | 3 |
3.1. Prevalence of FA Diagnosis
| Prevalence of FA by diagnosis | YFAS symptoms | YFAS outcomes in association with other variables | Conclusions |
|---|---|---|---|
| FA diagnosis: 8.7% | Median symptoms: 1, mean YFAS symptoms: 1.9 ± 1.4 (95% CI 1.8–2.0). | DIAGNOSIS: Diagnosis of food addiction associated with higher binge eating scores using BITE and BES (p < 0.001). SYMPTOM SCORE: YFAS symptom score was significantly correlated with the binge eating scores using BITE (p = 0.59, p < 0.001), and BES (p = 0.58 p < 0.001). | French version of the YFAs is a psychosometrically sound tool to assess food addiction. |
| - | - | SYMPTOM SCORE: Sig associations between YFAS and all subscales of the PEMS (p < 0.001). | Provided preliminary validation of the PEMS. PEMS accounted for unique variability in predicting BMI. |
| FA diagnosis: 16.9% | - | DIAGNOSIS: Food addiction group reported higher food cravings and appetite ratings (p < 0.0001). Methylphenidate compared to placebo reduced snack food intake in the non-food addiction group (p < 0.0001) but did not significantly change the snack food consumption of food addicts. | Methylphenidate did not change the snack food consumption or appear to reduce the appetite of food addicts. |
| FA diagnosis whole sample 5.8%. FA diagnosis NHS II 8.4% NHS 2.7%. | Most common symptoms: NHS: Consumption despite significant problems 15.6%; Eating same amount of food does not produce same feelings 18.4%. NHS II: Consumption despite significant problems 22.3%; Cutting down foods 22.9%; Consume foods despite not being hungry 17.8% | Women with FA more likely to be OW. Reduction in FA prevalence with increasing age (45–61 years: 7.4%–9.4%, 62–70 years: 2%–3%). Increasing prevalence of FA with higher BMI (BMI < 25 kg/m2: 0.4%–2.8%: BMI 25–30 kg/m2: 1.6%–8.4%, >30 kg/m2: 6.1%–24.7%). Proportion of FA diagnosis higher in white women. FA less common in more physically active women. FA positively associated with hypercholesterolaemia, former smoking and depression. Modified YFAS had similar internal consistency, convergent validity as the original YFAS. | FA prevalence as assessed by the modified YFAS ranged from 1%–9% in middle aged and older women. FA was negatively associated with age and positively associated with BMI |
| FA diagnosis whole sample: 25.7% FA diagnosis BN 83.6%, FA diagnosis BED 47.2% | Mean symptoms: 3.05 ± 2.0 | DIAGNOSIS: FA associated with higher current BMI, higher lifetime BMI, earlier age of first dieting, current dieting, and weight cycling (p < 0.001). Food addiction significantly associated with all disordered eating variables including binge eating behaviors (p < 0.001). Higher prevalence of FA diagnosis in BN than BED (p < 0.001). FA alone had a higher BMI than all other groups (p < 0.001). BED + FA and BN + FA reported more dieting than FA or BED/BN alone (p < 0.001). BN + FA had highest subjective binge episodes compared to other groups followed by BED + FA (p < 0.001). Sig higher restraint in FA (p < 0.001). | FA prevalence higher in BN than BED and associated with BMI and eating pathology. |
| FA diagnosis: 33.9%. | Mean symptoms 2.68 ± 1.89 | 28.9% food addicts met criteria for BED compared to 4.1% of non-food addicts. YFAS had strong positive correlation with BES (r = 0.78, p = 0.0045), and moderate positive correlations with all the psychopathology criteria (p = 0.0045) except phobic anxiety. More severe FA was associated with more severe psychopathology when mediated by BES (p < 0.001). | FA associated with binge eating severity and psychopathology. Relationship of FA and psychopathology completely mediated by BES. |
| Baseline FA diagnosis: 15.2%. | Mean symptoms: 2.57 ± 1.67. 45% reported ≥3 symptoms. Most common symptoms: Inability to cut down or stop eating (96.1%); continued use despite consequences (44.4%); tolerance (36%). | DIAGNOSIS: Food addicts had higher BDI scores (p < 0.001). No effect of FA status on weight loss when controlling for treatment, gender and baseline weight.SYMPTOM SCORE: Higher number of symptoms reported by females (p = 0.04) and African Americans (p = 0.002). Negative correlation between age and number of symptoms (r = −0.284 p < 0.001). Positive relationship between symptom count and BDI scores (r = 0.48, p < 0.001). YFAS symptom score did not account for unique variance in weight change. FA status and symptom count not associated with attrition. | 15% of OW and OB individuals were found to meet the criteria for FA. Baseline FA status did not predict weight loss success or attrition. |
| FA diagnosis: 100% current BN, 30% remitted BN, 0% control group (p < 0.001). | Mean symptoms: current BN 6.27 ± 1.04, remitted BN 3.95 ± 1.79, control 0.86 ± 0.90 (p < 0.001). Most common symptoms: persistent desire or unsuccessful attempts to cut down, giving up activities and withdrawal symptoms. | DIAGNOSIS: Food addiction group had fewer years of education (p = 0.02) and a lower BMI (p = 0.08) than the no FA group. Food addiction group had higher eating disorder psychopathology (p < 0.001). Food addicted had higher depression scores (p < 0.001) and binge eating behavior (p < 0.001). SYMPTOM SCORE: YFAS symptom score positively correlated with all measures of eating disorder psychopathology (total r = 0.82, p < 0.001) and negatively correlated with BMI (r = −0.19, p = 0.05). Higher number FA symptoms related to depression (r = 0.60, p < 0.001) and binge eating behaviors (r = 0.65, p < 0.001). | BN symptomology strongly associated with addictive eating as measured by the YFAS and attenuates the positive relationship between FA and BMI. |
| Low FA group 60%, High FA group 40%. | Mean symptoms: Low FA group: 0.83 ± 0.38 (range 0–1), High FA group: 2.65 ± 0.75 (range 2–4). | HIGH VS LOW FA: High FA group were younger (p < 0.05) and had higher levels of self-reported attentional impulsivity (p < 0.05). High FA had faster reaction times to food images compared to neutral cues (p < 0.01) in XY task. SYMPTOM SCORE: FA symptoms positively correlated with BMI (r = 0.42, p < 0.01), self-reported impulsivity (r = 0.344, p < 0.05) and depressive symptoms (r = 0.29, p < 0.05). FA symptoms not correlated with task performance or the FCQ-S. FA symptoms did not differ between dieters and non-dieters. | FA symptoms related to accelerated responses to high calorie food cues, BMI and heightened self-reported attentional impulsivity. Response time was slower to foods than neutral cues, reduced inhibitory control when shown food images which was predictive of food craving. |
| FA diagnosis: 24%. | Mean symptoms: 1.80 ± 1.39. | SYMPTOM SCORE: BMI and FA positively correlated (r = 0.18, p < 0.01). Impulsivity measures including negative urgency (p < 0.01) and perseverance (p < 0.05) significant predictors of number of symptoms endorsed. | FA symptoms associated with BMI and impulsivity. |
| FA diagnosis pre surgery: 32% FA diagnosis post-surgery: 2%. p < 0.05 93% changed FA diagnosis | Food addicts had more symptoms pre weight loss compared to non-food addicts (5.0 ± 1.0, 2.0 ± 0.5 respectively, p < 0.0001). Surgery reduced mean number of symptoms (p < 0.0001). | Food addicts greater cravings than non addicts pre surgery. Food addicts had greater reductions in cravings post-surgery than non-food addicts (p < 0.05). Food addicts had greater craving of fast foods and starchy foods pre surgery (p < 0.05) and greater cravings of starchy foods after surgery (p = 0.009). Surgical weight loss reduced emotional and external eating in all subjects, restrained eating behavior decreased in food addicts only (p < 0.05 Cohen’s d ≥ 0.80). | Weight loss following bariatric surgery is an effective treatment for food addiction and abnormal eating behaviors associated with food addiction. |
| FA diagnosis: 19.6%. FA diagnosis males 19.3%, female 14.0%. | - | SYMPTOM SCORES: Greater FA scores more likely to have psychological distress and depression (r = 0.50, p <0.01). Higher FA scores positively related to binge eating behaviors, emotional eating, difficulty controlling eating, weight bias internalisation, fear of fat and body shame (p < 0.01). High YFAS scores negatively related to percent weight loss at week 7 (r = −0.24, p = 0.04). | Number of FA symptoms related to negative attitudes about being OW/OB. Number of FA symptoms endorsed was negatively correlated with weight loss. |
| FA diagnosis 53.7% pre surgery. | - | DIAGNOSIS: Sig relationship between YFAS diagnosis and emotional eating, binge eating and symptoms of eating disorders (p < 0.05). Food addicts had a non-significant poorer weight loss (27% vs. 32%). SYMPTOM SCORE: Sig relationship between YFAS symptoms and emotional eating and binge eating scale (p < 0.05). When controlling for eating disorders and emotional eating, YFAS explained 6% (p = 0.014) of variance in binge eating scores. | YFAS contributed unique variability in predicting binge eating. |
| FA diagnosis 17.5%. FA diagnosis females 13.3%, males 4.2% | - | DIAGNOSIS: Food addicts had higher MLGP scores than non-food addicts (p = 0.023). Higher hedonic eating, binge eating, emotional eating, food craving and sweet snacking scores in food addicts compared to non-food addicts (p < 0.0001). | Food addicts had higher MLGP scores, food craving, binge eating, emotional eating compared to non-addicted. |
| FA diagnosis: 7.2% | Median number symptoms 2 ± 1.81. ≥3 symptoms reported by 38.6%. Given up activities 38.7%; loss of control 29.3%; tolerance 24.7%; inability to cut down 65.3%; withdrawal 18.9%; large amount of time spent 25.7%; clinically sig impairment or distress 9.6% | - | Preliminary evidence that the YFAS-C is a valid and reliable tool to operationalise FA in children. |
| FA Diagnosis: 41.5%. | Mean symptoms: 4.33 ± 1.81. Consumed more than planned 58.9%; unable to cut down 100%; much time spent 67.4%; activities given up 38.9%; use despite consequences 60.6%; tolerance 61.7%; withdrawal 44.2% impairment or distress 42.6% | DIAGNOSIS: FA diagnosis sig associated with earlier age of being OW (p = 0.014). SYMPTOM SCORE: YFAS positively correlated with negative affect and emotional dysregulation, and negatively correlated with self-esteem (p = 0.01). YFAS scores positively correlated with frequency of binge eating, eating concern, and weight concern (p < 0.05). YFAS scores associated with earlier age of being OW (r2 = −0.24, p = 0.015), age of dieting onset (r2 = −0.21, p = 0.037). YFAS sig accounted for 11% of unique variance in BED (p < 0.001). | FA rates not different in different ethnic groups. FA may represent a more severe presentation of BED. |
| FA diagnosis: 8.2% | Symptoms endorsed by ≥70% of participants with FA except tolerance and withdrawal. | DIAGNOSIS: Greater BMI in women meeting FA criteria (≥2/3 food addicts classified as obese compared to ¼ non-food addicts). Risk ratios for FA increased with severity of physical abuse up to RR 1.92 (CI 1.76–2.09). Risk ratios for FA increased with severity of sexual abuse up to RR 1.87 (CI 1.69–2.05). Sexual and physical abuse combined increased risk for FA up to RR 2.40 (CI 2.16–2.67). Longer duration of abuse conferred greater FA risk. | Dose response associations between physical and sexual abuse and likelihood of FA. |
| FA diagnosis: 5.4%. FA diagnosis female 6.7%, male 3.0%. FA diagnosis in BMI UW/ HW: 1.6%, OW/OB 7.7%. FA diagnosis percent body fat UW/HW 2.9%, OW/OB 6.8%. | - | DIAGNOSIS: Risk of FA higher in females than males (RR = 2.28, p = 0.046). OW/ OB women had higher risk of FA compared to OW/OB men (RR = 3.50, p = 0.002). Proportion of FA significantly increased with increasing adiposity (UW/HW RR = 0.21, p < 0.001, OW/OB RR = 0.42, p = 0.03). Food addicts had higher BMI (difference +4.6 kg/m2, p < 0.001), weight (difference +11.7 kg, p <0.001), body fat (difference +8.2%, p < 0.001), trunk fat (difference +8.5%, p < 0.001). Food addicts reported greater intake of fat (difference +2.3%, p = 0.04) and protein (difference +1.1%, p = 0.04). SYMPTOM SCORE: FA symptoms correlated with BMI (r = 0.36, p < 0.001), weight (r = 0.35, p < 0.001), waist hip ratio (r = 0.15, p < 0.001), percent body fat (r = 0.31, p < 0.001), and trunk fat (r = 0.32, p < 0.001). | Prevalence of FA in the Canadian province was 5.4%. Females at greater risk of FA and FA related to obesity. |
| FA diagnosis 56.8%. | Mean symptoms 4.56 ± 1.9. 57.1% who did not meet food addiction criteria endorsed ≥3 symptoms. Consumed more than planned 57.3%; unable to cut down or stop 1.2%; great deal of time spent 32.9%; important activities given up 53.7%; use despite consequences 24.7%; tolerance 43.2%; withdrawal 45.1%; impairment or distress 38.3%. | Food addiction related to mood disorder diagnoses (p = 0.01) specifically major depressive disorder (p = 0.06). YFAS symptoms positively correlated with BDI, and negatively correlated with self-esteem (p < 0.01). YFAS positively correlated with restraint and frequency of binge eating, (p < 0.01), and eating disorder psychopathology (p < 0.05). YFAS scores accounted for 6.3% unique variance in binge eating scores (p = 0.28). | BED classified as food addicts appear associated with mood disorders, lower self-esteem and eating disorder psychopathology in patients with BED. |
| - | Scored 40 points on the YFAS at baseline. Following reduction in cola intake YFAS score was 0. | Patient fulfilled all DSM criteria for substance addiction with respect to cola. Abstinence from cola caused obsession and craving for cola. Reduction in cola consumption increased concentration, feelings of wellness, reduction in psychopharmacological medication. Reduction in weight, and no longer fulfilled criteria for metabolic syndrome following reduction in cola consumption. | Overconsumption of caffeinated drink may have caused or accentuated mental health problems. |
| FA diagnosis 7.8%. | - | DIAGNOSIS: Food addicts had higher total FCQ-T total and FCQ subscales scores score (p < 0.001) except for positive reinforcement. SYMPTOM SCORE: Positive reinforcement negatively predicted FA symptoms (p < 0.001). Negative relationship between FA symptoms and anticipation of positive reinforcement in low FA scores (beta = −0.32, p < 0.001), but was weak for those with high food cravings (beta = −0.12, p < 0.01). FA symptoms positively correlated with FCQ-T scores (r = 0.50, p < 0.001). | German FCQ is a reliable and valid measure of food cravings. Individuals with high food cravings and low anticipation of positive reinforcement displayed most FA symptoms. |
| FA diagnosis 41.7%. | Mean symptoms 3.42 ± 1.74. Persistent desire 94.8%; continual eating despite problems 75%; tolerance 54.2%; clinically sig impairment or distress 47.9%; consume larger amounts over longer period than intended 31.3%; spending much time obtaining or recovering 30.2%; giving up activities 29.2%; withdrawal 27.1% | Items related to persistent desire or repeated unsuccessful attempts to cut down do not differentiate well between food addicts and non addicts. Questions regarding continual consumption and activities given up endorsed by greater number of respondents in BED current study than non-clinical samples in other studies. 75% respondents- much higher than non-clinical samples. | Factor structure of the YFAS could be confirmed in a sample of OB individuals seeking bariatric surgery. Some items have poor item based on population studied. |
| FA diagnosis 25%. FA diagnosis female 18.1%, male 6.9%. | - | DIAGNOSIS: FA associated with higher BED (p < 0.0001) and depression (p = 0.018). Food addicts displayed greater impulsivity (p < 0.0001), addictive traits (p = 0.003) and delay of discounting (p = 0.035). Food addicts reported greater binge eating traits, hedonic eating, emotional eating, food cravings, and snacking on sweets (p < 0.0001).SYMPTOM SCORE: Addictive traits, hedonic eating, snacking on sweets and binge eating scores accounted for 56% variance in YFAS symptom scores. | Strong relationships between food and substance abuse in OB. Validation of the YFAS’s ability to identify individuals with addictive like eating behaviors. |
| High FA 38.5%, Low FA 28.2%. Only n = 2 (5.1%) reported clinical impairment. | Mean symptom score for High FA 3.60 ± 0.63, All Low FA only had 1 symptom. | HIGH VS LOW FA: High FA had greater brain activation than Low FA in the dorsolateral prefrontal cortex (p < 0.007), caudate (p < 0.004). SYMPTOM SCORE: YFAS correlated with emotional eating (p < 0.03), and external eating (p < 0.02). Positive correlations YFAS scores and brain activity in the anterior cingulate cortex (p < 0.001), medial orbitofrontal cortex (p < 0.004) and amygdala (p < 0.007). | FA scores are associated with activation of reward regions of the brain. Compulsive food consumption may be driven by the reward anticipation. |
| FA diagnosis: 11.4% | Median symptoms = 1. | DIAGNOSIS: FA diagnosis accounted for 5.8% unique variance in binge eating scores. SYMPTOM SCORE: YFAS symptom count accounted for 14.8% unique variance in binge eating | YFAS is a psychosometrically sound tool to assess FA |
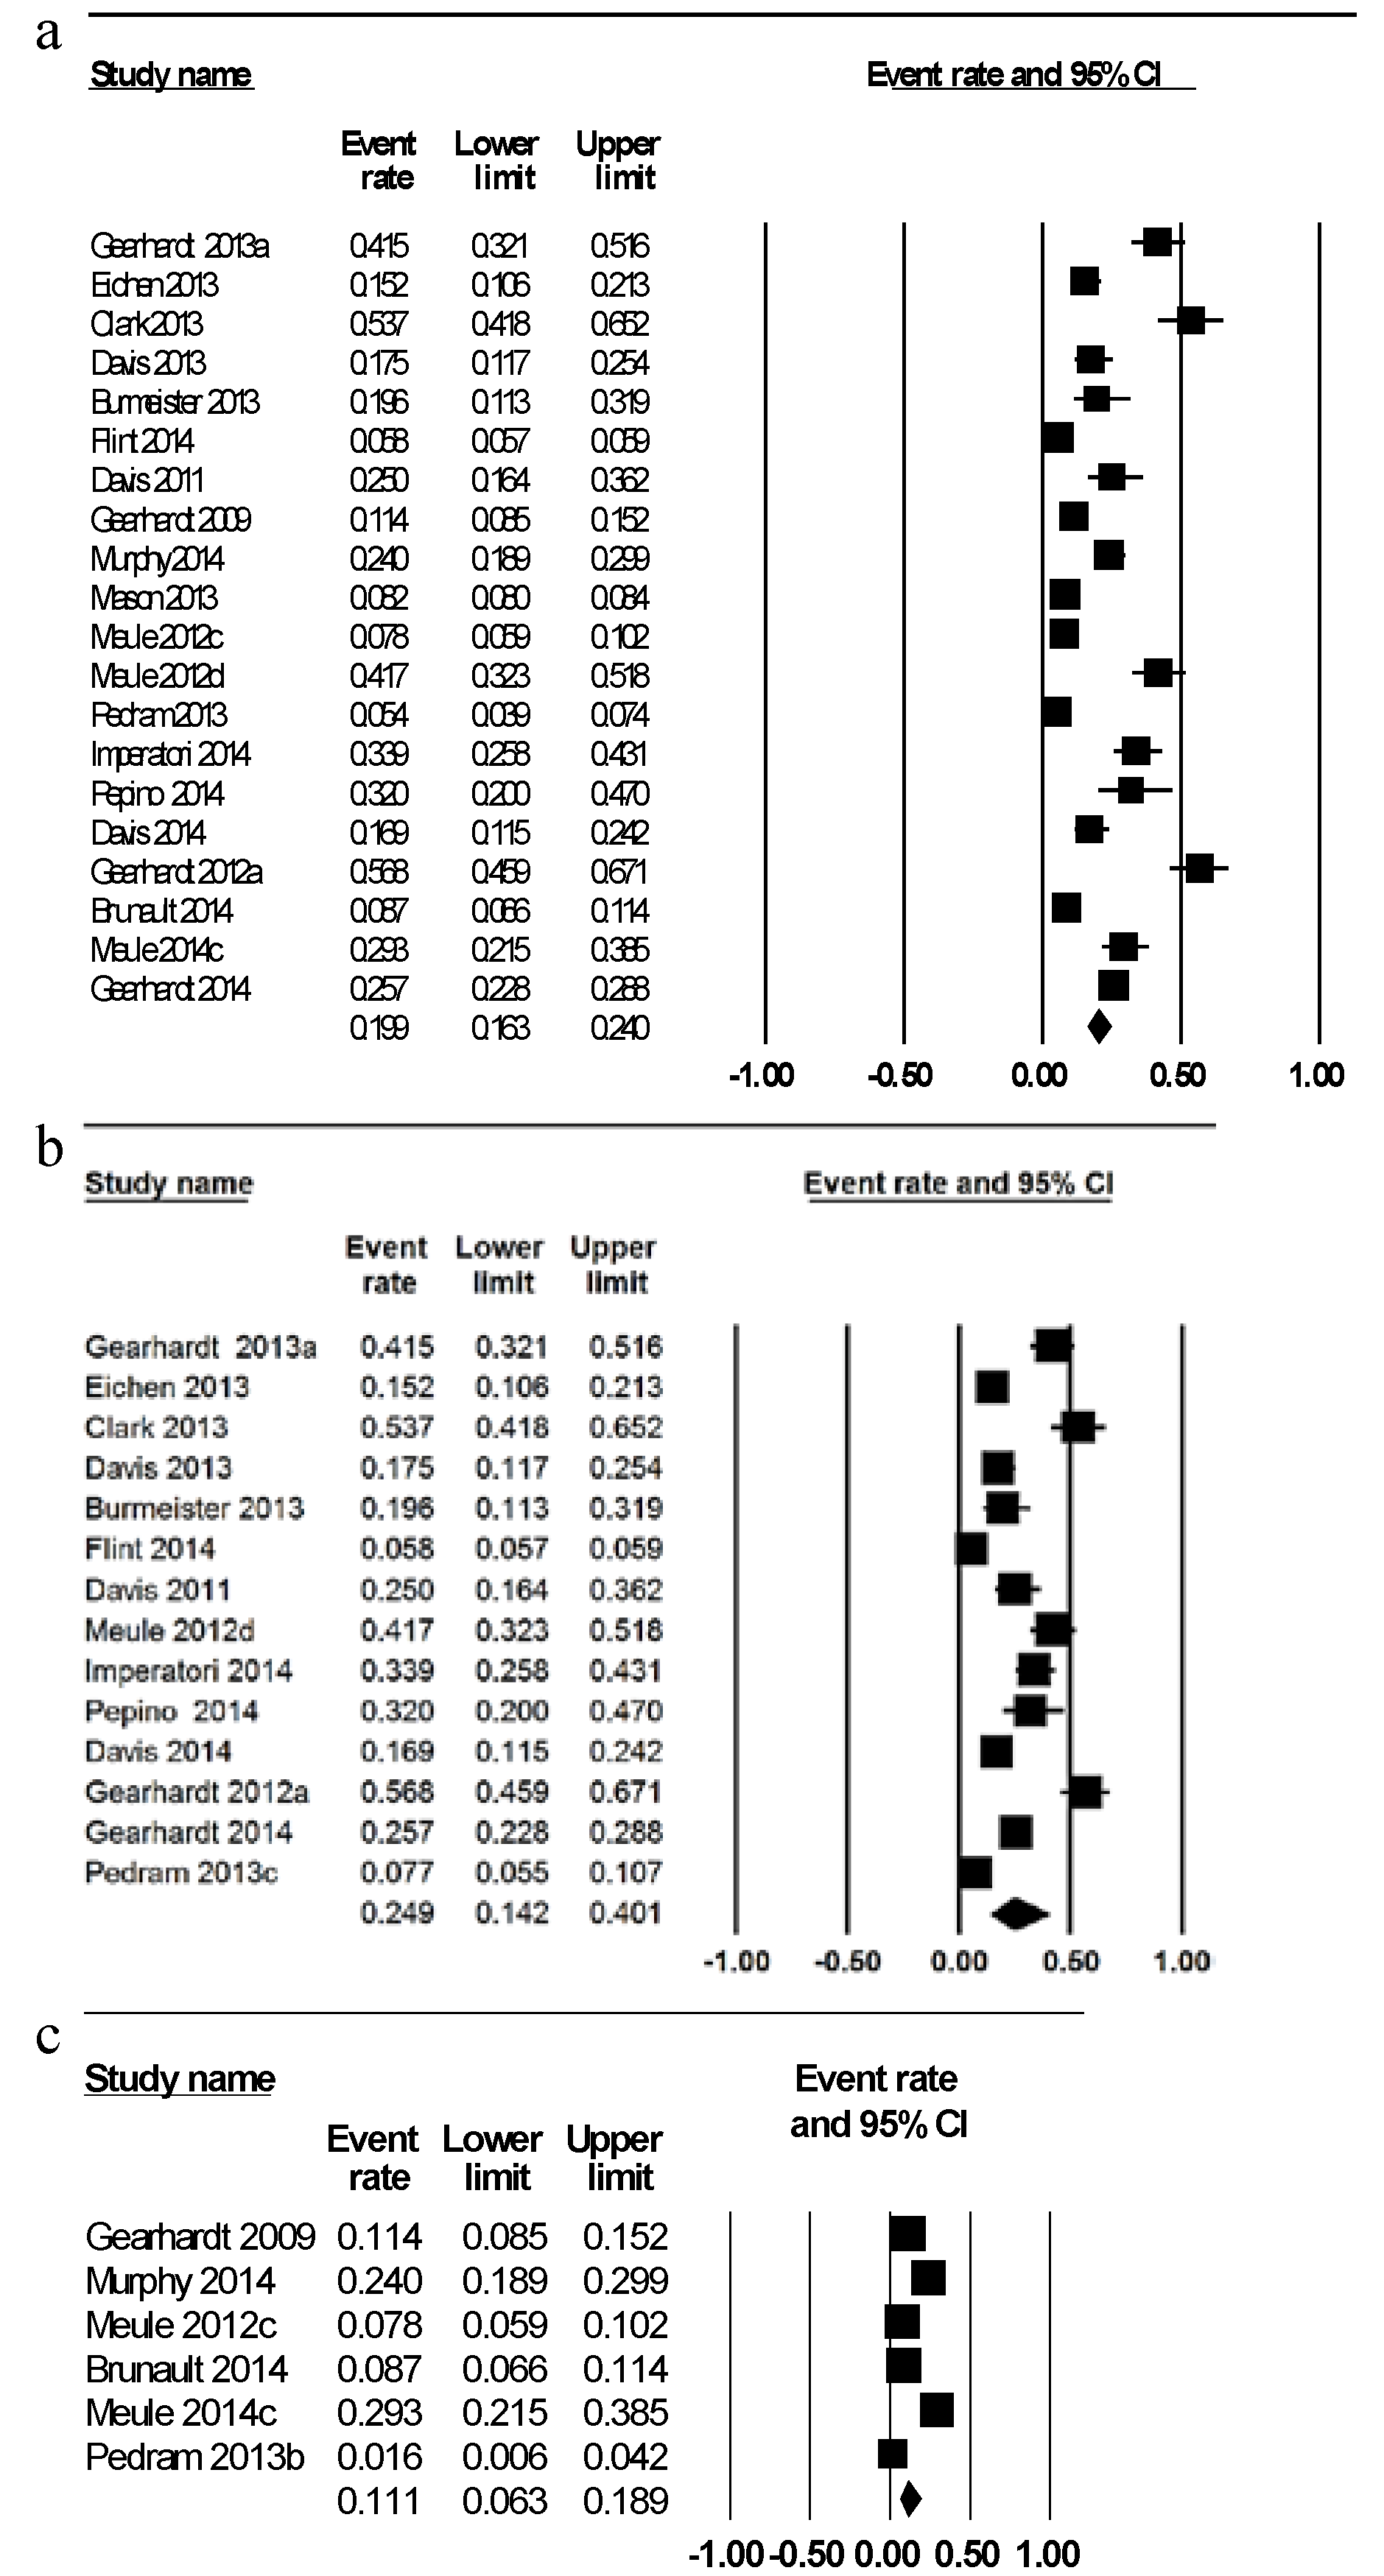
| Population group (n = number of studies) | Weighted mean prevalence of food addiction diagnosis (%) | 95% Confidence interval (%) | Range of prevalence across all studies (%) |
|---|---|---|---|
| Total (n = 20) | 19.9 | 16.3, 24.0 | 5.4%–56.8% |
| Gender | |||
| Male (n = 4) | 6.4 | 2.4, 16.0 | 2.4–16.0 |
| Female (n = 6) | 12.2 | 6.4, 21.4 | 6.7–21.4 |
| Weight status | |||
| Healthy weight (n = 5) a | 11.1 | 6.3, 18.9 | 1.6–24.0 |
| Overweight/obese (n = 13) b | 24.9 | 14.2, 40.1 | 7.7–56.8 |
| Age group | |||
| Adults < 35 years (n = 9) | 17.0 | 11.8, 23.9 | 7.8–25.0 |
| Adults > 35 years (n = 11) | 22.2 | 17.7, 27.5 | 5.4–56.8 |
| Disordered eating | |||
| No clinically diagnosed disordered eating (n = 16) | 16.2 | 13.4, 19.4 | 5.4–25.0 |
| Clinically diagnosed disordered eating (n = 4) c | 57.6 | 35.3, 77.8 | 26.1–62.0 |

3.2. Prevalence of FA Symptoms
3.3. Relationship of YFAS Outcomes with Other Variables
3.4. Comparison of “High” vs. “Low” FA
4. Discussion
5. Conclusions
Acknowledgments
Author Contributions
Conflicts of Interest
References
- Ng, M.; Fleming, T.; Robinson, M.; Thomson, B.; Graetz, N.; Margono, C.; Mullany, E.C.; Biryukov, S.; Abbafati, C.; Abera, S.F.; et al. Global, regional, and national prevalence of overweight and obesity in children and adults during 1980–2013: A systematic analysis for the global burden of disease study 2013. Lancet 2014, 384, 766–781. [Google Scholar] [CrossRef] [PubMed]
- World Health Organization. World Health Statistics: Global Health Statistics; World Health Organization: Geneva, Switzerland, 2014. [Google Scholar]
- Puhl, R.M.; Brownell, K.D. Confronting and coping with weight stigma: An investigation of overweight and obese adults. Obesity 2006, 14, 1802–1815. [Google Scholar] [CrossRef] [PubMed]
- Brownell, K.; Gold, M. Food and Addiction: A Comprehensive Handbook; Oxford University Press Inc.: New York, NY, USA, 2012. [Google Scholar]
- DePierre, J.A.; Puhl, R.M.; Luedicke, J. A new stigmatized identity? Comparisons of a “food addict” label with other stigmatized health conditions. Basic Appl. Soc. Psychol. 2013, 35, 10–21. [Google Scholar] [CrossRef]
- Latner, J.D.; Puhl, R.M.; Murakami, J.M.; O’Brien, K.S. Food addiction as a causal model of obesity. Effects on stigma, blame, and perceived psychopathology. Appetite 2014, 77, 79–84. [Google Scholar] [CrossRef]
- Gearhardt, A.N.; Corbin, W.R.; Brownell, K.D. Food addiction: An examination of the diagnostic criteria for dependence. J. Addict. Med. 2009, 3, 1–7. [Google Scholar] [CrossRef] [PubMed]
- Avena, N.M.; Bocarsly, M.E.; Hoebel, B.G.; Gold, M.S. Overlaps in the nosology of substance abuse and overeating: The translational implications of “food addiction”. Curr. Drug Abuse Rev. 2011, 4, 133–139. [Google Scholar] [CrossRef] [PubMed]
- Hone-Blanchet, A.; Fecteau, S. Overlap of food addiction and substance use disorders definitions: Analysis of animal and human studies. Neuropharmacology 2014, 85, 81–90. [Google Scholar] [CrossRef] [PubMed]
- American Psychiatric Association. Diagnostic and Statistical Manual of Mental Disorders, 4th ed.; text revision; American Psychiatric Publishing: Washington, DC, USA, 2000. [Google Scholar]
- Gearhardt, A.N.; Yokum, S.; Orr, P.T.; Stice, E.; Corbin, W.R.; Brownell, K.D. Neural correlates of food addiction. Arch. Gen. Psychiatry 2011, 68, 808–816. [Google Scholar] [CrossRef] [PubMed]
- Stoeckel, L.E.; Weller, R.E.; Cook, E.W., III; Twieg, D.B.; Knowlton, R.C.; Cox, J.E. Widespread reward-system activation in obese women in response to pictures of high-calorie foods. Neuroimage 2008, 41, 636–647. [Google Scholar] [CrossRef]
- Murdaugh, D.L.; Cox, J.E.; Cook, E.W., III; Weller, R.E. FMRI reactivity to high-calorie food pictures predicts short- and long-term outcome in a weight-loss program. Neuroimage 2012, 59, 2709–2721. [Google Scholar] [CrossRef]
- Garcia-Garcia, I.; Jurado, M.A.; Garolera, M.; Segura, B.; Marques-Iturria, I.; Pueyo, R.; Vernet-Vernet, M.; Sender-Palacios, M.J.; Sala-Llonch, R.; Ariza, M.; et al. Functional connectivity in obesity during reward processing. Neuroimage 2013, 66, 232–239. [Google Scholar] [CrossRef] [PubMed]
- Lawrence, N.S.; Hinton, E.C.; Parkinson, J.A.; Lawrence, A.D. Nucleus accumbens response to food cues predicts subsequent snack consumption in women and increased body mass index in those with reduced self-control. Neuroimage 2012, 63, 415–422. [Google Scholar] [CrossRef] [PubMed]
- Dimitropoulos, A.; Tkach, J.; Ho, A.; Kennedy, J. Greater corticolimbic activation to high-calorie food cues after eating in obese vs. Normal-weight adults. Appetite 2012, 58, 303–312. [Google Scholar] [CrossRef] [PubMed]
- Pursey, K.; Stanwell, P.; Callister, R.J.; Brain, K.; Collins, C.E.; Burrows, T.L. Neural responses to visual food cues according to weight status: A systematic review of functional magnetic resonance imaging studies. Front. Nutr. 2014, 1, 7. [Google Scholar] [CrossRef]
- Kennedy, J.; Dimitropoulos, A. Influence of feeding state on neurofunctional differences between individuals who are obese and normal weight: A meta-analysis of neuroimaging studies. Appetite 2014, 75, 103–109. [Google Scholar] [CrossRef] [PubMed]
- Brooks, S.J.; Cedernaes, J.; Schioth, H.B. Increased prefrontal and parahippocampal activation with reduced dorsolateral prefrontal and insular cortex activation to food images in obesity: A meta-analysis of fmri studies. PLoS One 2013, 8, e60393. [Google Scholar] [CrossRef] [PubMed]
- Appel, L.J.; Clark, J.M.; Yeh, H.C.; Wang, N.Y.; Coughlin, J.W.; Daumit, G.; Miller, E.R.; Dalcin, A.; Jerome, G.J.; Geller, S.; et al. Comparative effectiveness of weight-loss interventions in clinical practice. N. Engl. J. Med. 2011, 365, 1959–1968. [Google Scholar]
- Nijs, I.M.T.; Franken, I.H.A.; Muris, P. The modified trait and state food-cravings questionnaires: Development and validation of a general index of food craving. Appetite 2007, 49, 38–46. [Google Scholar] [CrossRef] [PubMed]
- Cepeda-Benito, A.; Gleaves, D.H.; Williams, T.L.; Erath, S.A. The development and validation of the state and trait food-cravings questionnaires. Behav. Ther. 2000, 31, 151–173. [Google Scholar] [CrossRef]
- Van Strien, T.; Frijters, J.E.R.; Bergers, G.P.A.; Defares, P.B. The dutch eating behavior questionnaire (DEBQ) for assessment of restrained, emotional, and external eating behavior. Int. J. Eat. Disord. 1986, 5, 295–315. [Google Scholar] [CrossRef]
- Stunkard, A.J.; Messick, S. The three-factor eating questionnaire to measure dietary restraint, disinhibition and hunger. J. Psychosom. Res. 1985, 29, 71–83. [Google Scholar] [CrossRef] [PubMed]
- Lowe, M.R.; Butryn, M.L.; Didie, E.R.; Annunziato, R.A.; Thomas, J.G.; Crerand, C.E.; Ochner, C.N.; Coletta, M.C.; Bellace, D.; Wallaert, M.; et al. The power of food scale. A new measure of the psychological influence of the food environment. Appetite 2009, 53, 114–118. [Google Scholar] [CrossRef]
- Gearhardt, A.N.; Corbin, W.R.; Brownell, K.D. Preliminary validation of the yale food addiction scale. Appetite 2009, 52, 430–436. [Google Scholar] [CrossRef] [PubMed]
- Gearhardt, A.N.; White, M.A.; Masheb, R.M.; Morgan, P.T.; Crosby, R.D.; Grilo, C.M. An examination of the food addiction construct in obese patients with binge eating disorder. Int. J. Eat. Disord. 2012, 45, 657–663. [Google Scholar] [CrossRef] [PubMed]
- Meule, A.; Gearhardt, A. Five years of the yale food addiction scale: Taking stock and moving forward. Curr. Addict. Rep. 2014, 1, 193–205. [Google Scholar] [CrossRef]
- Centre for Reviews and Dissemination. Prospero: International Prospective Register of Systematic Reviews. University of York; 2014. Available online: http://www.crd.york.ac.uk/PROSPERO/register_new_review.asp?RecordID=9927&UserID=7047 (accessed on 20 October 2014).
- Joanna Briggs Institute. Joanna Briggs Institute Reviewers’ Manual: 2014 Edition; Joanna Briggs Institute: Adelaide, Australia, 2014. [Google Scholar]
- National Health and Medical Research Council. Australian Dietary Guidelines; NHMRC: Canberra, Australia, 2013. [Google Scholar]
- Brunault, P.; Ballon, N.; Gaillard, P.; Reveillere, C.; Courtois, R. Validation of the French version of the Yale Food Addiction Scale: An examination of its factor structure, reliability, and construct validity in a nonclinical sample. Can. J. Psychiatry 2014, 59, 276–284. [Google Scholar] [PubMed]
- Burgess, E.; Turan, B.; Lokken, K.; Morse, A.; Boggiano, M. Profiling motives behind hedonic eating. Preliminary validation of the Palatable Eating Motives Scale. Appetite 2014, 72, 66–72. [Google Scholar] [CrossRef] [PubMed]
- Davis, C.; Levitan, R.D.; Kaplan, A.S.; Kennedy, J.L.; Carter, J.C. Food cravings, appetite, and snack-food consumption in response to a psychomotor stimulant drug: The moderating effect of “food-addiction”. Front. Psychol. 2014, 5, 403. [Google Scholar] [CrossRef] [PubMed]
- Flint, A.J.; Gearhardt, A.; Corbin, W.; Brownell, K.; Field, A.; Rimm, E. Food addiction scale measurement in two cohorts of middleaged and older women. Am. J. Clin. Nutr. 2014, 99, 578–586. [Google Scholar] [CrossRef] [PubMed]
- Gearhardt, A.N.; Boswell, R.G.; White, M.A. The association of “food addiction” with disordered eating and body mass index. Eat. Behav. 2014, 15, 427–433. [Google Scholar] [CrossRef] [PubMed]
- Imperatori, C.; Innamorati, M.; Contardi, A.; Continisio, M.; Tamburello, S.; Lamis, D.A.; Tamburello, A.; Fabbricatore, M. The association among food addiction, binge eating severity and psychopathology in obese and overweight patients attending low-energy-diet therapy. Compr. Psychiatry 2014, 55, 1358–1362. [Google Scholar] [CrossRef] [PubMed]
- Lent, M.R.; Eichen, D.M.; Goldbacher, E.; Wadden, T.A.; Foster, G.D. Relationship of food addiction to weight loss and attrition during obesity treatment. Obesity 2014, 22, 52–55. [Google Scholar] [CrossRef] [PubMed]
- Eichen, D.M.; Lent, M.R.; Goldbacher, E.; Foster, G.D. Exploration of “food addiction” in overweight and obese treatment-seeking adults. Appetite 2013, 67, 22–24. [Google Scholar] [CrossRef] [PubMed]
- Meule, A.; von Rezori, V.; Blechert, J. Food addiction and bulimia nervosa. Eur. Eat. Disord. Rev. 2014, 5, 331–337. [Google Scholar] [CrossRef]
- Meule, A.; Lutz, A.P.C.; Vogele, C.; Kubler, A. Impulsive reactions to food-cues predict subsequent food craving. Eat. Behav. 2014, 15, 99–105. [Google Scholar] [CrossRef] [PubMed]
- Meule, A.; Lutz, A.; Vogele, C.; Kubler, A. Women with elevated food addiction symptoms show accelerated reactions, but no impaired inhibitory control, in response to pictures of high-calorie food-cues. Eat. Behav. 2012, 13, 423–428. [Google Scholar] [CrossRef] [PubMed]
- Murphy, C.M.; Stojek, M.K.; MacKillop, J. Interrelationships among impulsive personality traits, food addiction, and body mass index. Appetite 2014, 73, 45–50. [Google Scholar] [CrossRef] [PubMed]
- Pepino, M.Y.; Stein, R.I.; Eagon, J.C.; Klein, S. Bariatric surgery-induced weight loss causes remission of food addiction in extreme obesity. Obesity 2014, 22, 1792–1798. [Google Scholar] [CrossRef] [PubMed]
- Burmeister, J.M.; Hinman, N.; Koball, A.; Hoffmann, D.A.; Carels, R.A. Food addiction in adults seeking weight loss treatment. Implications for psychosocial health and weight loss. Appetite 2013, 60, 103–110. [Google Scholar] [CrossRef] [PubMed]
- Clark, S.M.; Saules, K.K. Validation of the Yale Food Addiction Scale among a weight-loss surgery population. Eat. Behav. 2013, 14, 216–219. [Google Scholar] [CrossRef] [PubMed]
- Davis, C.; Loxton, N.J.; Levitan, R.D.; Kaplan, A.S.; Carter, J.C.; Kennedy, J.L. “Food addiction” and its association with a dopaminergic multilocus genetic profile. Physiol. Behav. 2013, 118, 63–69. [Google Scholar] [CrossRef] [PubMed]
- Gearhardt, A.N.; Roberto, C.A.; Seamans, M.J.; Corbin, W.R.; Brownell, K.D. Preliminary validation of the yale food addiction scale for children. Eat. Behav. 2013, 14, 508–512. [Google Scholar] [PubMed]
- Gearhardt, A.N.; White, M.A.; Masheb, R.M.; Grilo, C.M. An examination of food addiction in a racially diverse sample of obese patients with binge eating disorder in primary care settings. Compr. Psychiatry 2013, 54, 500–505. [Google Scholar] [CrossRef] [PubMed]
- Mason, S.M.; Flint, A.J.; Field, A.E.; Austin, S.; Rich-Edwards, J.W. Abuse victimization in childhood or adolescence and risk of food addiction in adult women. Obesity 2013, 21, E775–E781. [Google Scholar] [CrossRef] [PubMed]
- Pedram, P.; Wadden, D.; Amini, P.; Gulliver, W.; Randell, E.; Cahill, F.; Vasdev, S.; Goodridge, A.; Carter, J.C.; Zhai, G.; et al. Food addiction: Its prevalence and significant association with obesity in the general population. PLoS One 2013, 8, e74832. [Google Scholar] [CrossRef] [PubMed]
- Kromann, C.B.; Nielsen, C.T. A case of cola dependency in a woman with recurrent depression. BMC Res. Notes 2012, 5, 692. [Google Scholar] [CrossRef] [PubMed]
- Meule, A.; Kubler, A. Food cravings in food addiction: The distinct role of positive reinforcement. Eat. Behav. 2012, 13, 252–255. [Google Scholar] [CrossRef] [PubMed]
- Meule, A.; Lutz, A.; Vogele, C.; Kubler, A. Food cravings discriminate differentially between successful and unsuccessful dieters and non-dieters. Validation of the Food Cravings Questionnaires in German. Appetite 2012, 58, 88–97. [Google Scholar] [CrossRef] [PubMed]
- Meule, A.; Kubler, A. Corrigendum to “Food cravings in food addiction: The distinct role of positive reinforcement” [Eat Behav 13 (3) (2012) 252-255]. Eat. Behav. 2012, 13, 433. [Google Scholar] [CrossRef]
- Meule, A.; Heckel, D.; Kubler, A. Factor structure and item analysis of the yale food addiction scale in obese candidates for bariatric surgery. Eur. Eat. Disord. Rev. 2012, 20, 419–422. [Google Scholar] [CrossRef] [PubMed]
- Davis, C.; Curtis, C.; Levitan, R.D.; Carter, J.C.; Kaplan, A.S.; Kennedy, J.L. Evidence that “food addiction” is a valid phenotype of obesity. Appetite 2011, 57, 711–717. [Google Scholar] [CrossRef] [PubMed]
- Mechanick, J.I.; Youdim, A.; Jones, D.B.; Garvey, W.T.; Hurley, D.L.; McMahon, M.M.; Heinberg, L.J.; Kushner, R.; Adams, T.D.; Shikora, S.; et al. Clinical practice guidelines for the perioperative nutritional, metabolic, and nonsurgical support of the bariatric surgery patient—2013 update: Cosponsored by american association of clinical endocrinologists, the obesity society, and american society for metabolic & bariatric surgery. Endocrinol. Pract. 2013, 19, 337–372. [Google Scholar] [CrossRef]
- Willett, W.C.; Sampson, L.; Stampfer, M.J.; Rosner, B.; Bain, C.; Witschi, J.; Hennekens, C.H.; Speizer, F.E. Reproducibility and validity of a semiquantitative food frequency questionnaire. Am. J. Epidemiol. 1985, 122, 51–65. [Google Scholar] [PubMed]
- Burger, K.S.; Stice, E. Variability in reward responsivity and obesity: Evidence from brain imaging studies. Curr. Drug Abuse Rev. 2011, 4, 182–189. [Google Scholar] [CrossRef]
- Stice, E.; Figlewicz, D.P.; Gosnell, B.A.; Levine, A.S.; Pratt, W.E. The contribution of brain reward circuits to the obesity epidemic. Neurosci. Biobehav. Rev. 2013, 37, 2047–2058. [Google Scholar] [CrossRef] [PubMed]
- Hintzen, A.K.; Cramer, J.; Karagulle, D.; Heberlein, A.; Frieling, H.; Kornhuber, J.; Bleich, S.; Hillemacher, T. Does alcohol craving decrease with increasing age? Results from a cross-sectional study. J. Stud. Alcohol Drugs 2011, 72, 158–162. [Google Scholar] [PubMed]
- Moore, A.A.; Gould, R.; Reuben, D.B.; Greendale, G.A.; Carter, M.K.; Zhou, K.; Karlamangla, A. Longitudinal patterns and predictors of alcohol consumption in the united states. Am. J. Public Health 2005, 95, 458–465. [Google Scholar]
- Lovejoy, J.C.; Sainsbury, A. Sex differences in obesity and the regulation of energy homeostasis. Obes. Rev. 2009, 10, 154–167. [Google Scholar] [CrossRef] [PubMed]
- Marino, M.; Masella, R.; Bulzomi, P.; Campesi, I.; Malorni, W.; Franconi, F. Nutrition and human health from a sex-gender perspective. Mol. Asp. Med. 2011, 32, 1–70. [Google Scholar] [CrossRef]
- Davis, C. Compulsive overeating as an addictive behavior: Overlap between food addiction and binge eating disorder. Curr. Obes. Rep. 2013, 2, 171–178. [Google Scholar] [CrossRef]
- Davis, C. From passive overeating to food addiction: A spectrum of compulsion and severity. ISRN Obes. 2013, 2013, 435027. [Google Scholar] [CrossRef] [PubMed]
- Freedman, D.S.; Khan, L.K.; Serdula, M.K.; Dietz, W.H.; Srinivasan, S.R.; Berenson, G.S. The relation of childhood bmi to adult adiposity: The bogalusa heart study. Pediatrics 2005, 115, 22–27. [Google Scholar]
- Freedman, D.S.; Khan, L.K.; Serdula, M.K.; Dietz, W.H.; Srinivasan, S.R.; Berenson, G.S. Inter-relationships among childhood bmi, childhood height, and adult obesity: The bogalusa heart study. Int. J. Obes. Relat. Metab. Disord. 2003, 28, 10–16. [Google Scholar] [CrossRef]
© 2014 by the authors; licensee MDPI, Basel, Switzerland. This article is an open access article distributed under the terms and conditions of the Creative Commons Attribution license (http://creativecommons.org/licenses/by/4.0/).
Share and Cite
Pursey, K.M.; Stanwell, P.; Gearhardt, A.N.; Collins, C.E.; Burrows, T.L. The Prevalence of Food Addiction as Assessed by the Yale Food Addiction Scale: A Systematic Review. Nutrients 2014, 6, 4552-4590. https://doi.org/10.3390/nu6104552
Pursey KM, Stanwell P, Gearhardt AN, Collins CE, Burrows TL. The Prevalence of Food Addiction as Assessed by the Yale Food Addiction Scale: A Systematic Review. Nutrients. 2014; 6(10):4552-4590. https://doi.org/10.3390/nu6104552
Chicago/Turabian StylePursey, Kirrilly M., Peter Stanwell, Ashley N. Gearhardt, Clare E. Collins, and Tracy L. Burrows. 2014. "The Prevalence of Food Addiction as Assessed by the Yale Food Addiction Scale: A Systematic Review" Nutrients 6, no. 10: 4552-4590. https://doi.org/10.3390/nu6104552