Taking a Low Glycemic Index Multi-Nutrient Supplement as Breakfast Improves Glycemic Control in Patients with Type 2 Diabetes Mellitus: A Randomized Controlled Trial


Abstract
:1. Introduction
2. Experimental Section
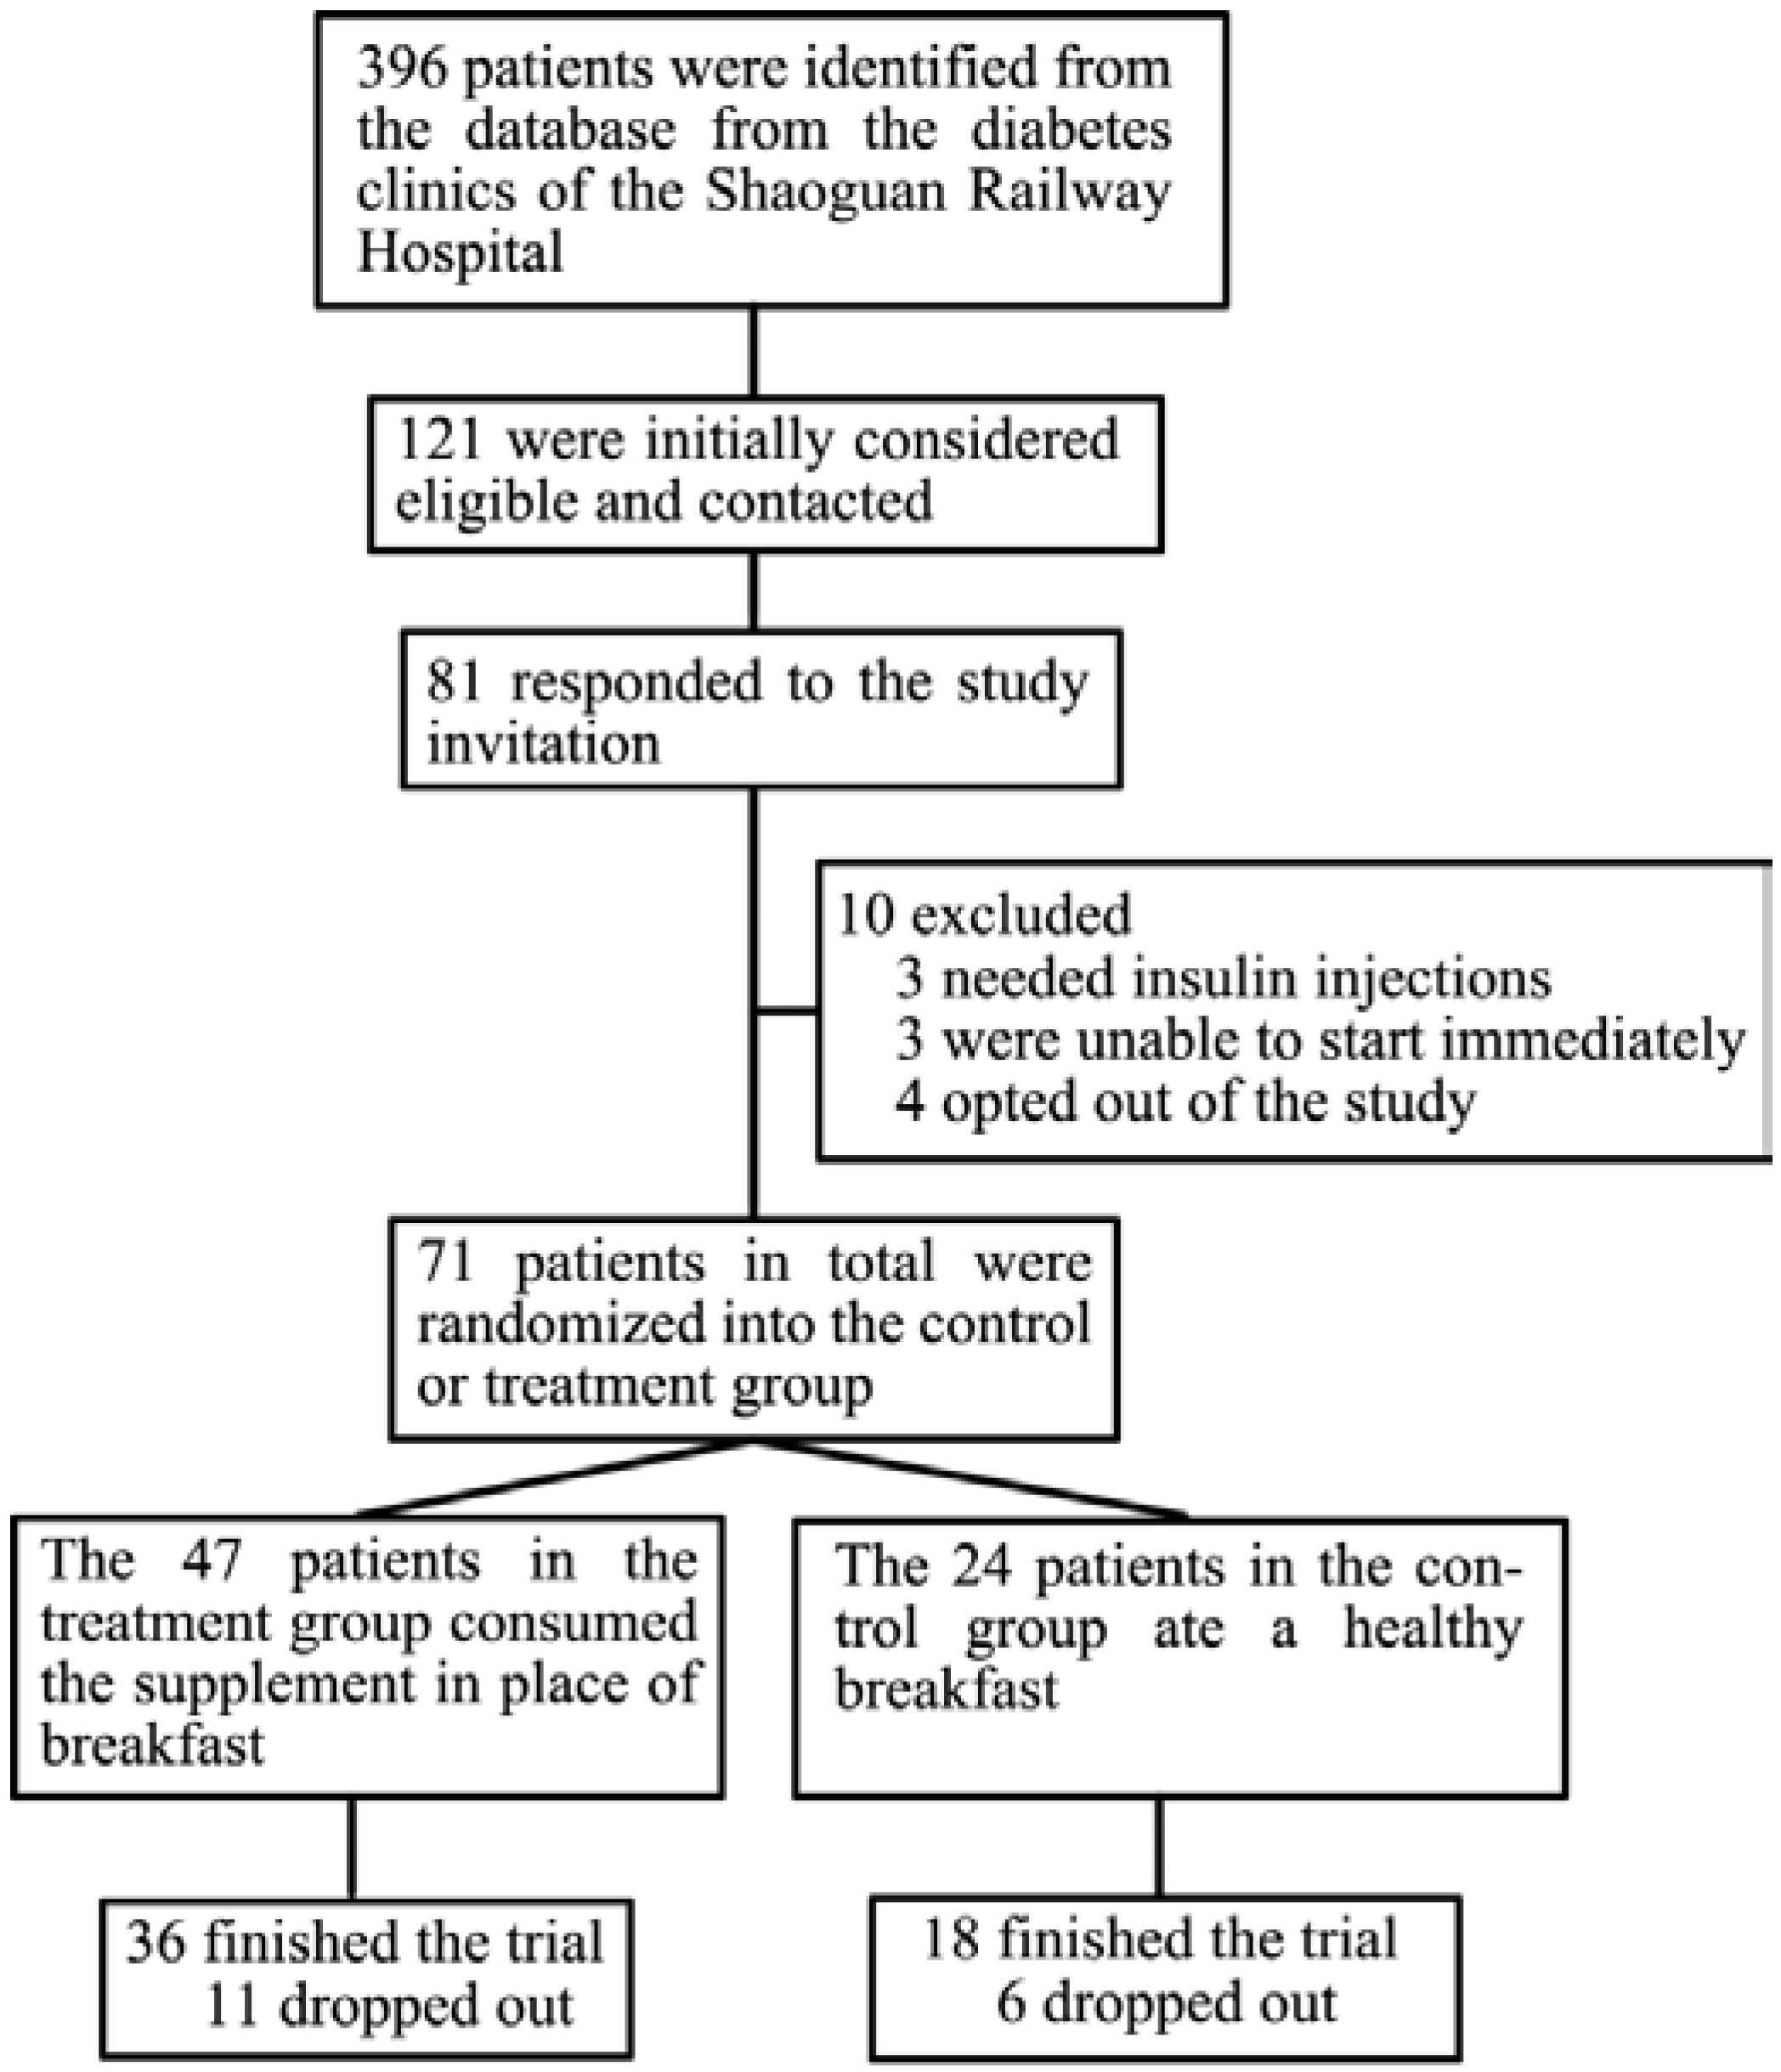
2.1. Participants

2.2. Intervention Content
2.3. Study Design
2.4. Data Collection
2.5. Biochemical and Dietary Analyses
2.6. Statistical Analyses
3. Results
3.1. Characteristics of the Patients

| Characteristics | Participants, No. (%) † | p | |
|---|---|---|---|
| Breakfast Replacement (n = 36) | Control (n = 18) | ||
| Age, year | 56.7 ± 8.6 | 54.5 ± 10.1 | 0.410 |
| Gender | |||
| Male | 22 (61.1) | 11 (61.1) | 1.000 |
| Female | 14 (38.9) | 7 (38.9) | |
| Race | |||
| Han | 35 (97.2) | 17 (94.4) | 1.000 |
| Yao | 1 (2.8) | 1 (5.6) | |
| Weight, kg | 64.3 ± 9.1 | 61.2 ± 11.4 | 0.270 |
| Body Mass Index | 24.6 ± 2.6 | 23.7 ± 2.9 | 0.234 |
| Family History § | 14 (38.9) | 8 (44.4) | 0.695 |
| Educational level | |||
| High School | 20 (55.6) | 10 (55.6) | 1.000 |
| Below | 16 (44.4) | 8 (44.4) | |
| Current Smoker | 19 (52.8) | 7 (38.9) | 0.336 |
| Current Drinker | 7 (19.4) | 3 (16.7) | 1.000 |
| Physical Activity | |||
| Low | 8 (22.2) | 2 (11.1) | 0.448 |
| Moderate | 21 (58.3) | 12 (66.7) | |
| High | 7 (19.4) | 4 (22.2) | |
| HbA1c Value, % of Total Hemoglobin | 6.7 ± 0.9 | 6.5 ± 0.6 | 0.352 |
| ≤7.0% | 26 (72.2) | 14 (77.8) | 0.511 |
| >7.0% | 10 (27.8) | 4 (22.2) | |
| Duration of T2DM, year | 5.3 ± 4.4 | 4.4 ± 4.4 | 0.527 |
| Antihyperglycemic Medications | 32 (88.9) | 18 (100) | 0.289 |
| Biguanides | 27 (75.0) | 11 (61.1) | 0.292 |
| Sulfonylurea | 11 (30.6) | 11 (61.1) | 0.031 |
| Glinides | 9 (25.0) | 4 (22.2) | 1.000 |
| α-glucosidase Inhibitors | 6 (16.7) | 1 (5.6) | 0.403 |
| Thiazolidinedione | 1 (2.8) | 3 (16.7) | 0.103 |
| DPP-IV Inhibitor | 0 (0) | 0 (0) | |
| Glp-1 Receptor Agonist | 0 (0) | 0 (0) | |
| Cholesterol-Lowering Medications | 14 (38.9) | 7 (38.9) | 1.000 |
| Blood Pressure Medications | 12 (33.3) | 8 (44.4) | 0.348 |
| Hyperuricemia Medications | 0 (0) | 0 (0) | |
| Renal Protection Medications | 1 (2.8) | 0 (0) | 1.000 |
| MNA Score, Median ± Quartile ‡ | 26.0 ± 1.5 | 26.0 ± 2.0 | 0.485 |
| Well-Nourished | 34 (94.4) | 16 (88.9) | 0.223 |
| At Risk of Malnutrition | 1 (2.7) | 2 (11.1) | |
| Malnutrition | 0 (0) | 0 (0) | |
3.2. Diet and Physical Activity
3.3. Glycemic Control and Somatometry
| Items | Breakfast Replacement (n = 36) | Control (n = 18) | p § | ||||
|---|---|---|---|---|---|---|---|
| Baseline | Week 12 | Mean Change (95% CI) ‡ | Baseline | Week 12 | Mean Change (95% CI) ‡ | ||
| Total Day | |||||||
| Energy (kcal) | 1567.1 ± 512.9 | 1445.6 ± 400.9 | −121.4 (−290.5, 47.6) | 1425.8 ± 352.5 | 1523.2 ± 550.2 | 97.4 (−114.0, 308.8) | 0.118 |
| Protein (g) | 57.8 ± 22.4 | 79.8 ± 93.2 | 22.1 (−8.3, 52.5) | 54.7 ± 14.2 | 55.4 ± 18.4 | 19.5 (−9.0, 10.5) | 0.327 |
| Protein (%) | 14.6 ± 2.4 | 24.3 ± 38.5 | 9.7 (−3.3, 22.6) | 15.5 ± 2.7 | 15.1 ± 3.7 | −0.4 (−2.4, 1.6) | 0.272 |
| Fat (g) | 53.1 ± 23.9 | 63.2 ± 23.3 * | 10.2 (1.9, 18.4) | 49.3 ± 18.1 | 63.9 ± 24.4 ** | 14.6 (4.1, 25.1) | 0.515 |
| Fat (%) | 30.5 ± 7.5 | 39.7 ± 9.8 ** | 9.3 (6.0, 12.5) | 31.0 ± 8.1 | 38.8 ± 8.9 ** | 7.8 (3.1, 12.4) | 0.593 |
| Carbohydrate (g) | 213.2 ± 73.6 | 164.6 ± 58.2 ** | −48.6 (−74.5, −22.7) | 184.1 ± 53.9 | 166.7 ± 81.3 ** | −17.4 (−49.2, 14.5) | 0.142 |
| Carbohydrate (%) | 54.6 ± 8.1 | 45.6 ± 8.8 ** | −9.0 (−12.2, −5.9) | 52.1 ± 9.4 | 42.7 ± 8.0 ** | −9.4 (−14.5, −4.2) | 0.907 |
| Breakfast | |||||||
| Energy (kcal) | 404.9 ± 180.0 | 408.0 ± 97.6 | 3.1 (−61.4, 67.6) | 420.5 ± 144.8 | 391.4 ± 145.3 | −29.1 (−115.6, 57.4) | 0.55 |
| % of Total Energy | 26.2 ± 8.4 | 30.0 ± 10.0 | 3.8 (−0.1, 7.7) | 29.5 ± 7.8 | 26.4 ± 7.9 | −3.1 (−9.3, 3.1) | 0.049 |
| Protein (g) | 12.9 ± 5.5 | 14.8 ± 4.0 | 1.9 (−0.6, 4.4) | 14.1 ± 4.9 | 13.1 ± 5.0 | −1.0 (−4.0, 2.0) | 0.158 |
| Fat (g) | 10.3 ± 7.9 | 17.1 ± 6.0 ** | 6.9 (3.8, 9.9) | 8.0 ± 3.9 | 13.2 ± 7.6 * | 5.1 (1.2, 9.1) | 0.492 |
| Carbohydrate (g) | 67.2 ± 33.2 | 51.3 ± 15.7 ** | −15.9 (−26.9, −4.9) | 77.5 ± 32.8 | 56.4 ± 23.5 ** | −21.2 (−35.2, −7.1) | 0.562 |
| Dietary Fiber (g) | 3.0 ± 2.7 | 6.2 ± 2.4 ** | 3.2 (2.2, 4.3) | 2.7 ± 1.3 | 2.0 ± 1.6 | −0.7 (−1.5, 0.1) | <0.001 |
| Lunch | |||||||
| Energy (kcal) | 553.9 ± 205.8 | 485.0 ± 163.4 * | −68.9 (−129.7, −8.1) | 509.0 ± 162.8 | 516.9 ± 214.5 | 7.9 (−89.7, 105.4) | 0.157 |
| % of Total Energy | 35.3 ± 5.2 | 33.7 ± 6.4 | −1.5 (−3.8, 0.7) | 35.5 ± 5.4 | 34.1 ± 7.5 | −1.4 (−5.6, 2.9) | 0.915 |
| Dinner | |||||||
| Energy (kcal) | 608.3 ± 252.5 | 487.0 ± 172.9 ** | −121.3 (−207.5, −35.0) | 496.2 ± 124.2 | 599.1 ± 311.1 | 102.9 (−54.0, 259.7) | 0.007 |
| % of Total Energy | 38.6 ± 7.4 | 34.1 ± 8.9 * | −4.5 (−8.6, −4.3) | 35.0 ± 3.9 | 42.0 ± 24.4 | 7.0 (−6.2, 20.2) | 0.032 |
| Characteristics | Breakfast Replacement (n = 36) | Control (n = 18) | p § | ||||
|---|---|---|---|---|---|---|---|
| Baseline | Week 12 | Mean Change (95% CI) ‡ | Baseline | Week 12 | Mean Change (95% CI) ‡ | ||
| Glycemic Control | |||||||
| FBG (mmol/L) | 6.8 ± 1.6 | 7.0 ± 1.5 | 0.2 (−0.1, 0.6) | 6.8 ± 1.1 | 8.1 ± 1.3 ** | 1.4 (0.8, 1.9) | 0.001 |
| GSP (μmol/L) | 274.3 ± 62.7 | 259.8 ± 53.1 ** | −14.5 (−23.9, −5.1) | 280.1 ± 45.3 | 276.0 ± 53.7 | −4.1 (−18.8, 10.7) | 0.209 |
| HbA1c (%) | 6.7 ± 0.9 | 6.5 ± 0.8 ** | −0.2 (−0.38, −0.07) | 6.5 ± 0.6 | 6.8 ± 0.8 ** | 0.3 (0.1, 0.5) | <0.001 |
| Insulin (μU/mL) | 4.8 ± 2.7 | 4.7 ± 3.2 | −0.1 (−1.0, 0.9) | 5.3 ± 2.2 | 6.4 ± 2.6 | 1.1 (−0.1, 2.3) | 0.129 |
| HOMA-IR | 1.5 ± 1.0 | 1.5 ± 1.1 | 0.04 (−0.3, 0.4) | 1.7 ± 0.8 | 2.4 ± 1.0 * | 0.7 (0.2, 1.3) | 0.018 |
| Physical Activity, No. (%) ¶ | |||||||
| Low | 8 (22.2) | 7 (28) | 2 (11.1) | 0 (0) | |||
| Moderate | 21 (58.3) | 8 (32) | 12 (66.7) | 14 (77.8) | |||
| High | 7 (19.4) | 10 (40) | 4 (22.2) | 4 (22.2) | |||
| Somatometry | |||||||
| Weight (kg) | 64.4 ± 9.1 | 63.9 ± 9.6 | −0.4 (−1.7, 0.9) | 61.2 ± 11.4 | 62.5 ± 11.2 ** | 1.3 (0.4, 2.3) | 0.07 |
| BMI (kg/m2) | 24.6 ± 2.6 | 24.4 ± 2.4 | −0.2 (−0.7, 0.2) | 23.7 ± 2.9 | 24.2 ± 2.8 ** | 0.5 (0.2, 0.9) | 0.032 |
| Waistline (cm) | 86.3 ± 7.3 | 84.1 ± 7.4 ** | −2.2 (−3.4, −1.0) | 82.6 ± 9.3 | 83.2 ± 8.9 | 0.6 (−1.8, 2.9) | 0.021 |
| Hipline (cm) | 95.1 ± 5.3 | 94.5 ± 5.8 | −0.6 (−1.5, 0.3) | 92.9 ± 6.4 | 92.9 ± 6.6 | −0.03 (−1.4, 1.4) | 0.475 |
| WHR | 0.91 ± 0.04 | 0.89 ± 0.05 ** | −0.02 (−0.03, −0.01) | 0.89 ± 0.07 | 0.90 ± 0.07 | 0.01 (−.02, 0.03) | 0.037 |
| SBP (mmHg) | 124.1 ± 14.1 | 127.7 ± 14.3 | 3.5 (−2.0, 9.1) | 120.7 ± 15.3 | 134.2 ± 22.2 * | 13.5 (3.5, 23.5) | 0.058 |
| DBP (mmHg) | 79.6 ± 7.7 | 80.6 ± 8.2 | 0.9 (−2.1, 4.0) | 76.4 ± 7.3 | 83.2 ± 9.9 ** | 6.8 (2.7, 10.9) | 0.026 |
| MAP (mmHg) | 94.5 ± 9.3 | 95.9 ± 9.7 | 1.8 (−1.7, 5.3) | 91.1 ± 9.3 | 102.3 ± 13.1 ** | 9.0 (3.6, 14.5) | 0.026 |
| Nutrition Status | |||||||
| MNA Score | 26.0 ± 1.5 | 26.0 ± 3 | −0.4 (−1.2, 0.4) | 26.0 ± 2.0 | 26.8 ± 2.3 | 0.0 (−0.9, 0.9) | 0.412 |
| Body Fat (%) †† | 28.0 ± 7.0 | 28.2 ± 6.7 | 0.2 (−0.4, 0.8) | 26.7 ± 6.6 | 28.2 ± 6.7 ** | 1.5 (0.6, 2.4) | 0.015 |
| Body Water (%) †† | 52.5 ± 5.1 | 52.4 ± 4.9 | −0.1 (−0.6, 0.3) | 53.7 ± 4.8 | 52.6 ± 4.9 ** | −1.1 (−1.8, −0.5) | 0.013 |
| Total Plasma Protein (g/L) | 74.9 ± 4.6 | 76.8 ± 4.5 ** | 1.9 (0.9, 3.0) | 75.7 ± 4.4 | 77.4 ± 4.5 | 1.7 (−0.4, 3.8) | 0.821 |
| Plasma Lipid Levels | |||||||
| TG (mmol/L) | 1.9 ± 1.3 | 2.1 ± 2.6 | 0.2 (−0.3, 0.8) | 2.9 ± 4.9 | 2.0 ± 2.4 | −0.8 (−2.7, 1.0) | 0.27 |
| Cholesterol (mmol/L) | 5.0 ± 1.0 | 5.1 ± 0.8 | 0.2 (−0.1, 0.4) | 5.4 ± 1.5 | 5.3 ± 1.0 | −0.1 (−0.6, 0.4) | 0.276 |
| HDL-C (mmol/L) | 1.4 ± 0.4 | 1.4 ± 0.4 | 0.01 (−0.1, 0.1) | 1.4 ± 0.3 | 1.5 ± 0.4 | 0.1 (−0.1, 0.3) | 0.279 |
| LDL-C (mmol/L) | 3.1 ± 0.8 | 3.0 ± 0.4 | −0.1 (−0.3, 0.1) | 3.3 ± 1.1 | 3.1 ± 0.6 | −0.2 (−0.6, 0.3) | 0.748 |
| ApoA1 (g/L) | 1.2 ± 0.2 | 1.3 ± 0.2 | 0.04 (−0.03, 0.11) | 1.2 ± 0.2 | 1.3 ± 0.2 | 0.1 (−0.01, 0.22) | 0.287 |
| ApoB (g/L) | 0.9 ± 0.1 | 0.9 ± 0.1 | 0.01 (−0.03, 0.05) | 0.9 ± 0.2 | 1.0 ± 0.2 * | 0.1 (0.01, 0.16) | 0.049 |
| Hepatorenal functions | |||||||
| AST (IU/L) | 22.7 ± 5.0 | 24.0 ± 5.5 | 1.3 (−0.4, 3.0) | 26.7 ± 10.7 | 32.7 ± 12.4 | 5.9 (−0.1, 12.0) | 0.138 |
| ALT (IU/L) | 23.6 ± 13.4 | 22.2 ± 9.2 | −1.4 (−5.6, 2.9) | 25.6 ± 15.0 | 25.4 ± 12.1 | −0.1 (−7.1, 6.9) | 0.738 |
| Total bilirubin (μmol/L) | 14.4 ± 3.1 | 14.3 ± 5.2 | −0.2 (−1.9, 1.6) | 14.1 ± 4.4 | 15.8 ± 6.6 | 1.7 (−0.4, 3.8) | 0.185 |
| Urea nitrogen (mmol/l) | 5.4 ± 1.4 | 5.8 ± 1.4 * | 0.4 (0.02, 0.79) | 5.6 ± 1.6 | 6.6 ± 2.6 * | 1.0 (0.2, 1.8) | 0.118 |
| Creatinine (μmol/L) | 87.4 ± 13.7 | 81.3 ± 11.0 ** | −6.1 (−9.3, −3.0) | 87.8 ± 14.6 | 84.9 ± 14.7 | −2.9 (−6.0, 0.3) | 0.138 |
| Uric acid (μmol/L) | 344.3 ± 75.3 | 357.0 ± 78.9 | 12.7 (−8.3, 33.7) | 368.5 ± 158.6 | 357.0 ± 111.1 | −11.5 (−72.3, 49.4) | 0.341 |
3.4. Plasma Lipid Levels
3.5. Hepatorenal Functions
3.6. Nutrition Status
4. Discussion
5. Conclusions
Supplementary Files
Supplementary File 1Acknowledgments
Author Contributions
Conflicts of Interest
References
- Chen, L.; Magliano, D.J.; Zimmet, P.Z. The worldwide epidemiology of type 2 diabetes mellitus—Present and future perspectives. Nat. Rev. Endocrinol. 2012, 8, 228–236. [Google Scholar]
- Heron, M. Deaths: Leading causes for 2010. Natl. Vital Stat. Rep. 2013, 62, 1–96. [Google Scholar] [PubMed]
- Fox, C.S.; Pencina, M.J.; Meigs, J.B.; Vasan, R.S.; Levitzky, Y.S.; D’Agostino, R.B., Sr. Trends in the incidence of type 2 diabetes mellitus from the 1970s to the 1990s: The framingham heart study. Circulation 2006, 113, 2914–2918. [Google Scholar] [CrossRef] [PubMed]
- Li, R.; Lu, W.; Jiang, Q.W.; Li, Y.Y.; Zhao, G.M.; Shi, L.; Yang, Q.D.; Ruan, Y.; Jiang, J.; Zhang, S.N.; et al. Increasing prevalence of type 2 diabetes in Chinese adults in Shanghai. Diabetes Care 2012, 35, 1028–1030. [Google Scholar] [CrossRef] [PubMed]
- Xu, Y.; Wang, L.; He, J.; Bi, Y.; Li, M.; Wang, T.; Jiang, Y.; Dai, M.; Lu, J.; Xu, M.; et al. Prevalence and control of diabetes in Chinese adults. JAMA 2013, 310, 948–959. [Google Scholar] [CrossRef] [PubMed]
- Georgoulis, M.; Kontogianni, M.D.; Yiannakouris, N. Mediterranean diet and diabetes: Prevention and treatment. Nutrients 2014, 6, 1406–1423. [Google Scholar] [CrossRef] [PubMed]
- Hermansen, K.; Sondergaard, M.; Hoie, L.; Carstensen, M.; Brock, B. Beneficial effects of a soy-based dietary supplement on lipid levels and cardiovascular risk markers in type 2 diabetic subjects. Diabetes Care 2001, 24, 228–233. [Google Scholar] [CrossRef] [PubMed]
- Jenkins, D.J.; Kendall, C.W.; McKeown-Eyssen, G.; Josse, R.G.; Silverberg, J.; Booth, G.L.; Vidgen, E.; Josse, A.R.; Nguyen, T.H.; Corrigan, S.; et al. Effect of a low-glycemic index or a high-cereal fiber diet on type 2 diabetes: A randomized trial. JAMA 2008, 300, 2742–2753. [Google Scholar] [CrossRef] [PubMed]
- Yu, K.; Ke, M.Y.; Li, W.H.; Zhang, S.Q.; Fang, X.C. The impact of soluble dietary fibre on gastric emptying, postprandial blood glucose and insulin in patients with type 2 diabetes. Asia Pac. J. Clin. Nutr. 2014, 23, 210–218. [Google Scholar] [PubMed]
- McGeoch, S.C.; Holtrop, G.; Fyfe, C.; Lobley, G.E.; Pearson, D.W.; Abraham, P.; Megson, I.L.; Macrury, S.M.; Johnstone, A.M. Food intake and dietary glycaemic index in free-living adults with and without type 2 diabetes mellitus. Nutrients 2011, 3, 683–693. [Google Scholar] [CrossRef] [PubMed]
- The Expert Committee on the Diagnosis and Classification of Diabetes Mellitus. Report of the expert committee on the diagnosis and classification of diabetes mellitus. Diabetes Care 1997, 20, 1183–1197. [Google Scholar]
- Venn, B.J.; Green, T.J. Glycemic index and glycemic load: Measurement issues and their effect on diet-disease relationships. Eur. J. Clin. Nutr. 2007, 61, S122–S131. [Google Scholar] [CrossRef] [PubMed]
- American Diabetes Association. Standards of medical care in diabetes—2012. Diabetes Care 2012, 35, S11–S63. [Google Scholar]
- Dumville, J.C.; Hahn, S.; Miles, J.N.; Torgerson, D.J. The use of unequal randomisation ratios in clinical trials: A review. Contemp. Clin. Trials 2006, 27, 1–12. [Google Scholar] [CrossRef] [PubMed]
- Li, J. Dietary Nutrition and Health Condition in Type 2 Diabetic Patients Before and After Nutritional Education. Bachelor’s Thesis, Shaoguan University, Shaoguan, China, June 2013. [Google Scholar]
- Heianza, Y.; Arase, Y.; Saito, K.; Tsuji, H.; Fujihara, K.; Hsieh, S.D.; Kodama, S.; Shimano, H.; Yamada, N.; Hara, S.; et al. Role of alcohol drinking pattern in type 2 diabetes in japanese men: The toranomon hospital health management center study 11 (topics 11). Am. J. Clin. Nutr. 2013, 97, 561–568. [Google Scholar] [CrossRef] [PubMed]
- Guo, H.; Zhong, R.; Liu, Y.; Jiang, X.; Tang, X.; Li, Z.; Xia, M.; Ling, W. Effects of bayberry juice on inflammatory and apoptotic markers in young adults with features of non-alcoholic fatty liver disease. Nutrition 2014, 30, 198–203. [Google Scholar] [CrossRef] [PubMed]
- Chun, M.Y. Validity and reliability of korean version of international physical activity questionnaire short form in the elderly. Korean J. Fam. Med. 2012, 33, 144–151. [Google Scholar] [CrossRef] [PubMed]
- Vellas, B.; Guigoz, Y.; Garry, P.J.; Nourhashemi, F.; Bennahum, D.; Lauque, S.; Albarede, J.L. The mini nutritional assessment (MNA) and its use in grading the nutritional state of elderly patients. Nutrition 1999, 15, 116–122. [Google Scholar] [CrossRef] [PubMed]
- Fuangchan, A.; Sonthisombat, P.; Seubnukarn, T.; Chanouan, R.; Chotchaisuwat, P.; Sirigulsatien, V.; Ingkaninan, K.; Plianbangchang, P.; Haines, S.T. Hypoglycemic effect of bitter melon compared with metformin in newly diagnosed type 2 diabetes patients. J. Ethnopharmacol. 2011, 134, 422–428. [Google Scholar] [CrossRef] [PubMed]
- EpiData, 3.1; An extended tool for validated data-entry and documentation of data; The EpiData Association: Odense, Denmark, 2008.
- Tuomilehto, J.; Schwarz, P.; Lindstrom, J. Long-term benefits from lifestyle interventions for type 2 diabetes prevention: Time to expand the efforts. Diabetes Care 2011, 34, S210–S214. [Google Scholar] [CrossRef] [PubMed]
- Post, R.E.; Mainous, A.G., III; King, D.E.; Simpson, K.N. Dietary fiber for the treatment of type 2 diabetes mellitus: A meta-analysis. J. Am. Board Fam. Med. 2012, 25, 16–23. [Google Scholar] [CrossRef] [PubMed]
- Schusdziarra, V.; Hausmann, M.; Wittke, C.; Mittermeier, J.; Kellner, M.; Naumann, A.; Wagenpfeil, S.; Erdmann, J. Impact of breakfast on daily energy intake—An analysis of absolute versus relative breakfast calories. Nutr. J. 2011, 10, 5. [Google Scholar] [CrossRef] [PubMed]
- Atkinson, F.S.; Foster-Powell, K.; Brand-Miller, J.C. International tables of glycemic index and glycemic load values: 2008. Diabetes Care 2008, 31, 2281–2283. [Google Scholar] [CrossRef] [PubMed]
- Yao, B.; Fang, H.; Xu, W.; Yan, Y.; Xu, H.; Liu, Y.; Mo, M.; Zhang, H.; Zhao, Y. Dietary fiber intake and risk of type 2 diabetes: A dose-response analysis of prospective studies. Eur. J. Epidemiol. 2014, 29, 79–88. [Google Scholar] [CrossRef] [PubMed]
- Bethel, M.A.; Sourij, H. Impact of fda guidance for developing diabetes drugs on trial design: From policy to practice. Curr. Cardiol. Rep. 2012, 14, 59–69. [Google Scholar] [CrossRef] [PubMed]
- Chen, H.S.; Jap, T.S.; Chen, R.L.; Lin, H.D. A prospective study of glycemic control during holiday time in type 2 diabetic patients. Diabetes Care 2004, 27, 326–330. [Google Scholar] [CrossRef] [PubMed]
- Liang, W.W. Seasonal changes in preprandial glucose, A1C, and blood pressure in diabetic patients. Diabetes Care 2007, 30, 2501–2502. [Google Scholar] [CrossRef] [PubMed]
- Fagour, C.; Gonzalez, C.; Pezzino, S.; Florenty, S.; Rosette-Narece, M.; Gin, H.; Rigalleau, V. Low physical activity in patients with type 2 diabetes: The role of obesity. Diabetes Metab. 2013, 39, 85–87. [Google Scholar] [CrossRef] [PubMed]
- Sadry, S.A.; Drucker, D.J. Emerging combinatorial hormone therapies for the treatment of obesity and T2DM. Nat. Rev. Endocrinol. 2013, 9, 425–433. [Google Scholar] [CrossRef] [PubMed]
- Accurso, A.; Bernstein, R.K.; Dahlqvist, A.; Draznin, B.; Feinman, R.D.; Fine, E.J.; Gleed, A.; Jacobs, D.B.; Larson, G.; Lustig, R.H.; et al. Dietary carbohydrate restriction in type 2 diabetes mellitus and metabolic syndrome: Time for a critical appraisal. Nutr. Metab. 2008, 5, 9. [Google Scholar] [CrossRef]
- Heilbronn, L.K.; Noakes, M.; Clifton, P.M. Effect of energy restriction, weight loss, and diet composition on plasma lipids and glucose in patients with type 2 diabetes. Diabetes Care 1999, 22, 889–895. [Google Scholar] [CrossRef] [PubMed]
- International Standards Organisation. ISO 26642–2010. In Food Products—Determination of the Glycaemic Index (GI) and Recommendation for Food Classification; International Standards Organisation: Geneva, Switzerland, 2010. [Google Scholar]
- Lin, S.D.; Wang, J.S.; Hsu, S.R.; Sheu, W.H.; Tu, S.T.; Lee, I.T.; Su, S.L.; Lin, S.Y.; Wang, S.Y.; Hsieh, M.C. The beneficial effect of α-glucosidase inhibitor on glucose variability compared with sulfonylurea in Taiwanese type 2 diabetic patients inadequately controlled with metformin: Preliminary data. J. Diabetes Complicat. 2011, 25, 332–338. [Google Scholar] [CrossRef] [PubMed]
- Norris, S.L.; Engelgau, M.M.; Narayan, K.M. Effectiveness of self-management training in type 2 diabetes: A systematic review of randomized controlled trials. Diabetes Care 2001, 24, 561–587. [Google Scholar] [CrossRef] [PubMed]
© 2014 by the authors; licensee MDPI, Basel, Switzerland. This article is an open access article distributed under the terms and conditions of the Creative Commons Attribution license (http://creativecommons.org/licenses/by/4.0/).
Share and Cite
Li, D.; Zhang, P.; Guo, H.; Ling, W. Taking a Low Glycemic Index Multi-Nutrient Supplement as Breakfast Improves Glycemic Control in Patients with Type 2 Diabetes Mellitus: A Randomized Controlled Trial. Nutrients 2014, 6, 5740-5755. https://doi.org/10.3390/nu6125740
Li D, Zhang P, Guo H, Ling W. Taking a Low Glycemic Index Multi-Nutrient Supplement as Breakfast Improves Glycemic Control in Patients with Type 2 Diabetes Mellitus: A Randomized Controlled Trial. Nutrients. 2014; 6(12):5740-5755. https://doi.org/10.3390/nu6125740
Chicago/Turabian StyleLi, Di, Peiwen Zhang, Honghui Guo, and Wenhua Ling. 2014. "Taking a Low Glycemic Index Multi-Nutrient Supplement as Breakfast Improves Glycemic Control in Patients with Type 2 Diabetes Mellitus: A Randomized Controlled Trial" Nutrients 6, no. 12: 5740-5755. https://doi.org/10.3390/nu6125740
APA StyleLi, D., Zhang, P., Guo, H., & Ling, W. (2014). Taking a Low Glycemic Index Multi-Nutrient Supplement as Breakfast Improves Glycemic Control in Patients with Type 2 Diabetes Mellitus: A Randomized Controlled Trial. Nutrients, 6(12), 5740-5755. https://doi.org/10.3390/nu6125740