1. Introduction
Vitamin D plays important roles in calcium and phosphate absorption in the intestine, sustaining sufficient concentrations thereof in the blood. Access to these minerals at bone-forming sites makes normal mineralization of bone possible [
1,
2]. Reports from across the world indicate that vitamin D deficiency is widespread and is re-emerging as a major health problem globally [
3]. Studies from Asian countries, with a few exceptions, have reported a high prevalence of vitamin D deficiency in both sexes and all age groups [
4,
5,
6,
7,
8,
9,
10].
Increasing evidence suggests that vitamin D deficiency may also be an important cause in a variety of nonskeletal disorders including impaired glucose metabolism [
11,
12,
13,
14]. Several studies have reported that low serum 25-hydroxyvitamin D [25(OH)D] may be significantly associated with increased insulin resistance [
1,
15,
16]. On the other hand, other studies have failed to detect a significant relationship between circulating vitamin D levels and insulin resistance [
17,
18,
19,
20,
21]. Therefore, whether or not low serum vitamin D concentrations directly contribute to the development of insulin resistance remains controversial.
In relation to differences in sunlight exposure and physical activity, residential area and one’s occupation can affect serum 25(OH)D levels, as well as insulin sensitivity. However, the impact of residential area or occupation on the association between serum 25(OH)D level and insulin resistance has not been appropriately assessed. Thus, we attempted to investigate the association between serum 25(OH)D and insulin resistance, as well as the impact of residential area thereon, in an elderly cohort recruited from urban and rural communities.
3. Results
The general characteristics of the study participants are presented in
Table 1. This study comprised 505 men with a mean age of 72.8 years and 1123 women with a mean age of 71.4 years. Mean BMI was significantly lower in men than in women; however, mean waist circumference was significantly higher in men than in women. The median serum 25(OH)D level was significantly higher in men than in women (49.4
vs. 39.9 nmol/L). Fasting glucose level was not significantly different between men and women. However, fasting insulin (29.4
vs. 35.4 pmol/L) and HOMA-IR (1.1
vs. 1.3 mmol·pmol/L
2) were lower in men than in women. Cigarette smoking and alcohol drinking were more frequently reported in men than in women. Meanwhile, frequency of regular exercise was similar between men and women.
Table 1.
General characteristics of the study participants.
Table 1.
General characteristics of the study participants.
| Variables | Men (n = 505) | Women (n = 1123) | p-value |
|---|
| Age, year | 72.8 ± 4.9 | 71.4 ± 4.7 | <0.001 |
| Height, cm | 164.6 ± 5.4 | 152.2 ± 5.6 | <0.001 |
| Weight, kg | 64.3 ± 8.9 | 56.3 ± 8.0 | <0.001 |
| Body mass index, kg/m2 | 23.7 ± 2.9 | 24.3 ± 3.0 | <0.001 |
| Waist circumference, cm | 85.7 ± 8.6 | 82.7 ± 8.7 | <0.001 |
| Systolic blood pressure, mmHg | 129.5 ± 14.5 | 127.4 ± 15.7 | 0.008 |
| Diastolic blood pressure, mmHg | 74.1 ± 8.8 | 72.7 ± 8.6 | 0.004 |
| Total cholesterol, mmol/L | 4.5 ± 0.8 | 5.0 ± 0.9 | <0.001 |
| HDL cholesterol, mmol/L | 1.2 ± 0.3 | 1.4 ± 0.3 | <0.001 |
| LDL cholesterol, mmol/L | 2.7 ± 0.7 | 2.9 ± 0.8 | <0.001 |
| Triglycerides, mmol/L | 1.3 [0.3–1.7] | 1.3 [1.0–1.8] | 0.040 |
| 25(OH)D, nmol/L | 49.4 [35.4–61.9] | 39.9 [28.2–54.9] | <0.001 |
| Fasting glucose, mmol/L | 5.1 [4.8–5.5] | 5.1 [4.8–5.4] | 0.364 |
| Fasting insulin, pmol/L | 29.4 [19.8–43.8] | 35.4 [24.6–53.4] | <0.001 |
| HOMA-IR, mmol·pmol/L2 | 1.1 [0.7–1.7] | 1.3 [0.9–2.1] | <0.001 |
| HOMA-IR ≥ 2.5, n (%) | 56 (11.1) | 190 (16.9) | 0.003 |
| Impaired fasting glucose, n (%) | 116 (23.0) | 218 (19.4) | 0.115 |
| Hypertension, n (%) | 293 (58.0) | 694 (61.8) | 0.165 |
| Dyslipidemia, n (%) | 243 (48.1) | 627 (55.8) | 0.005 |
| Current smoker, n (%) | 81 (16.0) | 17 (1.5) | <0.001 |
| Regular alcohol drinker, n (%) | 195 (38.6) | 58 (5.2) | <0.001 |
| Regular exercise, n (%) | 282 (55.8) | 663 (59.0) | 0.248 |
Table 2 presents the characteristics of the study population according to 25(OH)D concentration: <50 (deficient), 50 to 75 (insufficient), and ≥75 nmol/L (sufficient) [
2]. The majority of the participants (52% of men and 69% of women) were 25(OH)D deficient, while an additional 36% of men and 25% of women were 25(OH)D insufficient. Men and women with higher 25(OH)D concentrations tended to have lower BMI and waist circumference. Participants with higher 25(OH)D concentrations were also associated with lower fasting insulin and HOMA-IR levels, although the association was statistically significant only in men.
Table 3 presents the linear correlations between serum 25(OH)D and indices of obesity and glucose metabolism. After controlling for age, serum 25(OH)D level was negatively correlated with fasting insulin and HOMA-IR but not with fasting glucose.
Table 2.
Characteristics of the study participants by vitamin D concentration.
Table 2.
Characteristics of the study participants by vitamin D concentration.
| Variables | Men (n = 505) | Women (n = 1123) |
|---|
| <50 (n = 264, 52.3%) | 50–75 (n = 184, 36.4%) | ≥75 (n = 57, 11.3%) | p for Trend | <50 (n = 771, 68.7%) | 50–75 (n = 280, 24.9%) | ≥75 (n = 72, 6.4%) | p for Trend |
|---|
| Age, year | 72.7 ± 4.8 | 72.9 ± 4.7 | 72.8 ± 5.7 | 0.937 | 71.5 ± 4.7 | 71.2 ± 4.5 | 71.6 ± 4.9 | 0.907 |
| Height, cm | 164.4 ± 5.4 | 165.0 ± 5.2 | 163.9 ± 6.1 | 0.517 | 152.2 ± 5.6 | 152.2 ± 5.8 | 152.5 ± 4.8 | 0.625 |
| Weight, kg | 64.8 ± 8.4 | 64.4 ± 9.5 | 61.8 ± 9.1 | 0.021 | 56.8 ± 8.2 | 55.4 ± 7.6 | 54.3 ± 7.2 | 0.012 |
| Body mass index, kg/m2 | 24.0 ± 2.8 | 23.6 ± 3.0 | 22.9 ± 2.6 | 0.014 | 24.5 ± 3.1 | 23.9 ± 2.8 | 23.4 ± 2.9 | 0.002 |
| Waist circumference, cm | 86.3 ± 8.4 | 85.5 ± 8.8 | 83.3 ± 8.5 | 0.017 | 83.2 ± 8.8 | 81.9 ± 8.4 | 79.9 ± 7.6 | 0.002 |
| Systolic BP, mmHg | 129.1 ± 15.9 | 130.2 ± 13.1 | 129.2 ± 11.3 | 0.978 | 127.7 ± 16.1 | 127.2 ± 14.6 | 125.7 ± 15.7 | 0.316 |
| Diastolic BP, mmHg | 74.0 ± 9.4 | 74.1 ± 8.1 | 74.3 ± 8.5 | 0.867 | 72.8 ± 9.0 | 72.7 ± 8.1 | 71.8 ± 7.4 | 0.350 |
| Total cholesterol, mmol/L | 4.63 ± 0.83 | 4.48 ± 0.82 | 4.35 ± 0.71 | 0.019 | 5.04 ± 0.92 | 4.82 ± 0.93 | 4.56 ± 0.83 | <0.001 |
| HDL cholesterol, mmol/L | 1.22 ± 0.33 | 1.25 ± 0.29 | 1.32 ± 0.33 | 0.038 | 1.35 ± 0.34 | 1.38 ± 0.33 | 1.34 ± 0.32 | 0.688 |
| LDL cholesterol, mmol/L | 2.72 ± 0.76 | 2.61 ± 0.72 | 2.47 ± 0.66 | 0.019 | 2.99 ± 0.82 | 2.81 ± 0.81 | 2.62 ± 0.71 | <0.001 |
| Triglycerides, mmol/L | 116 [84–161] | 103 [79–152] | 102 [90–123] | 0.021 | 120 [90–165] | 113 [82–152] | 102 [76–140] | 0.014 |
| Fasting glucose, mmol/L | 91 [86–99] | 91 [86–98] | 92 [87–98] | 0.596 | 91 [86–98] | 90 [85–95] | 90 [86–97] | 0.471 |
| Fasting insulin, pmol/L | 5.3 [3.7–7.9] | 4.7 [3.2–7.1] | 3.5 [2.5–5.1] | <0.001 | 6.2 [4.3–9.2] | 5.2 [3.7–8.4] | 5.5 [4.2–7.6] | 0.059 |
| HOMA-IR, mmol·pmol/L2 | 1.20 [0.80–1.88] | 1.04 [0.71–1.66] | 0.83 [0.56–1.30] | <0.001 | 1.41 [0.97–2.16] | 1.20 [0.79–1.93] | 1.24 [0.92–1.80] | 0.060 |
| HOMA-IR ≥ 2.5, n (%) | 36 (13.6) | 19 (10.3) | 1 (1.8) | 0.013 * | 140 (18.2) | 42 (15.0) | 8 (11.1) | 0.070 * |
| Current smoker, n (%) | 44 (16.7) | 29 (15.8) | 8 (14.0) | 0.620 * | 13 (1.7) | 3 (1.1) | 1 (1.4) | 0.565 * |
| Regular alcohol drinker, n (%) | 88 (33.3) | 78 (42.4) | 29 (50.9) | 0.005 * | 49 (6.4) | 8 (2.9) | 1 (1.4) | 0.008 * |
| Regular exercise, n (%) | 166 (62.9) | 91 (49.5) | 25 (43.9) | <0.001 * | 459 (59.5) | 161 (57.5) | 43 (59.7) | 0.738 * |
Table 3.
Pearson’s correlation coefficients between serum 25(OH)D * and other variables.
Table 3.
Pearson’s correlation coefficients between serum 25(OH)D * and other variables.
| Variables | Men (n = 505) | Women (n = 1123) |
|---|
| Partial Correlation Coefficient † | p-value | Partial Correlation Coefficient † | p-value |
|---|
| Body mass index | −0.152 | 0.005 | −0.126 | <0.001 |
| Waist circumference | −0.117 | 0.009 | −0.107 | <0.001 |
| Fasting glucose * | −0.071 | 0.110 | −0.035 | 0.245 |
| Fasting insulin * | −0.211 | <0.001 | −0.096 | 0.001 |
| HOMA-IR * | −0.207 | <0.001 | −0.095 | 0.001 |
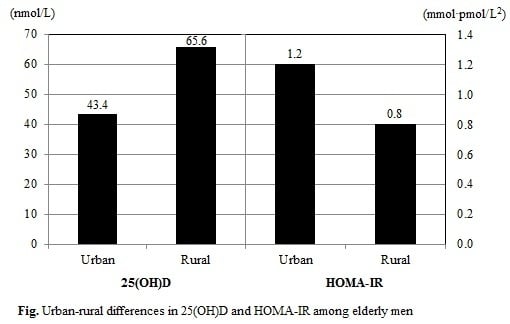
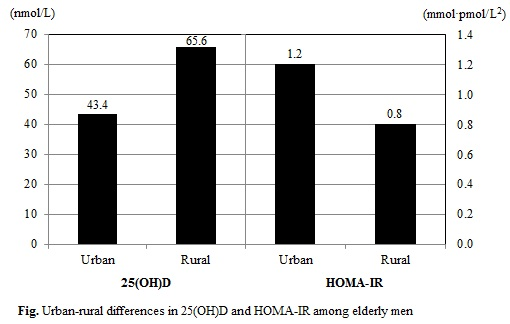
We compared the distributions of serum 25(OH)D level and HOMA-IR according to residential area (
Table 4). Urban-living male participants exhibited lower serum 25(OH)D levels (43.4
vs. 65.6 nmol/L) but higher HOMA-IR (1.2
vs. 0.8 mmol·pmol/L
2), compared to their rural-living counterparts. Similarly, urban-living female participants had lower serum 25(OH)D levels (38.2
vs. 49.9 nmol/L) but higher HOMA-IR (1.4
vs. 1.2 mmol·pmol/L
2), compared to their rural-living counterparts.
Table 4.
Serum 25(OH)D and HOMA-IR according to residential area.
Table 4.
Serum 25(OH)D and HOMA-IR according to residential area.
| Region | Men (n = 505) | Region | Women (n = 1123) |
|---|
| 25(OH)D | HOMA-IR | 25(OH)D | HOMA-IR |
|---|
| Urban (n = 371) | 43.4 [32.7–55.2] | 1.2 [0.8–1.8] | Urban (n = 948) | 38.2 [27.2–51.9] | 1.4 [0.9–2.1] |
| Rural (n = 134) | 65.6 [54.2–76.1] | 0.8 [0.5–1.3] | Rural (n = 175) | 49.9 [36.7–61.7] | 1.2 [0.8–1.8] |
| p-value | <0.001 | <0.001 | p-value | <0.001 | 0.002 |
Table 5 presents the association between serum 25(OH)D level and HOMA-IR after multiple linear regression analyses. In men, serum 25(OH)D levels showed a significant inverse association with HOMA-IR (standardized β = −0.203,
p < 0.001) when adjusted for age and study year. The association remained significant (standardized β = −0.133,
p < 0.001) after additionally adjusting for BMI, waist circumference, smoking, alcohol intake, and exercise. However, the association was markedly attenuated after additional adjustment for residential area (standardized β = −0.063,
p = 0.115). In women, serum 25(OH)D was significantly associated with HOMA-IR (standardized β = −0.092,
p < 0.001) when adjusted for age and study year. However, the association disappeared after additional adjustment for BMI, waist circumference, smoking, alcohol intake, and exercise (
p = 0.187). When we additionally assessed the association between serum 25(OH)D and HOMA-IR, stratified by residential area, we found no significant association for either urban or rural participants (
Table 6). When we controlled occupation instead of residential area, similar results were observed (data presented in
Supplemental Table 1 and 2). However, we did not differentiate the effects of residential area and occupation, because they are too closely correlated.
Table 5.
Association between log-transformed serum 25(OH)D and log-transformed HOMA-IR in men and women.
Table 5.
Association between log-transformed serum 25(OH)D and log-transformed HOMA-IR in men and women.
| Variables | Men (n = 505) | Women (n = 1123) |
|---|
| std. β | p-value | std. β | p-value | std. β | p-value | std. β | p-value | std. β | p-value | std. β | p-value |
|---|
| 25(OH)D, nmol/L | –0.203 | <0.001 | –0.133 | <0.001 | −0.063 | 0.115 | –0.092 | <0.001 | –0.035 | 0.187 | –0.022 | 0.415 |
| Study year, year | 0.057 | 0.193 | 0.054 | 0.148 | 0.067 | 0.067 | 0.057 | 0.055 | 0.074 | 0.007 | 0.076 | 0.006 |
| Age, year | –0.018 | 0.689 | 0.042 | 0.264 | 0.056 | 0.130 | 0.031 | 0.301 | 0.026 | 0.341 | 0.035 | 0.201 |
| Body mass index, kg/m2 | | | 0.318 | <0.001 | 0.321 | <0.001 | | | 0.257 | <0.001 | 0.264 | <0.001 |
| Waist circumference, cm | | | 0.249 | <0.001 | 0.225 | <0.001 | | | 0.231 | <0.001 | 0.222 | <0.001 |
| Current smoker (vs. others) | | | –0.074 | 0.045 | –0.071 | 0.049 | | | –0.006 | 0.825 | –0.008 | 0.751 |
| Regular alcohol drinker (vs. others) | | | –0.001 | 0.981 | 0.001 | 0.978 | | | –0.010 | 0.718 | –0.011 | 0.685 |
| Regular exercise (vs. none) | | | 0.027 | 0.468 | –0.012 | 0.751 | | | –0.003 | 0.920 | –0.021 | 0.456 |
| Rural (vs. urban) | | | | | –0.183 | <0.001 | | | | | –0.074 | 0.008 |
| Coefficient of determination | adj. R2 = 0.041 | adj. R2 = 0.336 | adj. R2 = 0.360 | adj. R2 = 0.011 | adj. R2 = 0.219 | adj. R2 = 0.223 |
Table 6.
Association between log-transformed serum 25(OH)D and log-transformed HOMA-IR in men and women according to residential area.
Table 6.
Association between log-transformed serum 25(OH)D and log-transformed HOMA-IR in men and women according to residential area.
| Variables | Urban (n = 1319) | Rural (n = 309) |
|---|
| Men (n = 371) | Women (n = 948) | Men (n = 134) | Women (n = 175) |
|---|
| std. β | p-value | std. β | p-value | std. β | p-value | std. β | p-value |
|---|
| 25(OH)D, nmol/L | −0.052 | 0.263 | −0.008 | 0.785 | −0.084 | 0.217 | −0.084 | 0.224 |
| Study year, year | 0.101 | 0.035 | 0.046 | 0.129 | 0.035 | 0.582 | 0.180 | 0.011 |
| Age, year | 0.141 | 0.003 | 0.060 | 0.044 | −0.120 | 0.090 | −0.084 | 0.236 |
| Body mass index, kg/m2 | 0.281 | <0.001 | 0.304 | <0.001 | 0.422 | 0.002 | 0.116 | 0.308 |
| Waist circumference, cm | 0.224 | 0.003 | 0.178 | <0.001 | 0.221 | 0.094 | 0.369 | 0.001 |
| Current smoker (vs. others) | −0.054 | 0.240 | −0.003 | 0.910 | −0.114 | 0.091 | −0.072 | 0.285 |
| Regular alcohol drinker (vs. others) | 0.037 | 0.433 | −0.021 | 0.464 | −0.105 | 0.120 | 0.080 | 0.231 |
| Regular exercise (vs. none) | −0.033 | 0.480 | −0.010 | 0.747 | 0.007 | 0.918 | −0.018 | 0.790 |
| Coefficient of determination | adj. R2 = 0.241 | adj. R2 = 0.215 | adj. R2 = 0.467 | adj. R2 = 0.250 |
4. Discussion
The current study was designed to examine the impact of residential area or occupation on the association between serum 25(OH)D level and insulin resistance. Herein, we observed a significant association between serum 25(OH)D and HOMA-IR in men; however, the association was markedly attenuated after adjusting for residential area or occupation.
Several studies, including a few reports from the Korean population, have revealed inverse associations between vitamin D and insulin resistance [
1,
15,
16,
27,
28]. A random sample of the general population of Copenhagen, Denmark, demonstrated that low 25(OH)D level is not significantly related to incident type 2 diabetes mellitus after adjusting for confounders; however, it was significantly associated with adverse longitudinal changes in continuous markers of glucose homeostasis [
27]. In a nested case-control study performed on US military service members, participants with a low serum 25(OH)D level exhibited a substantially higher risk of developing insulin-requiring diabetes mellitus than those with a higher level [
15]. In a Thai population study, low vitamin D level was shown to be modestly associated with a small increase in risk of type 2 diabetes mellitus in urban elderly residents only [
28]. In the Fourth Korea National Health and Nutrition Examination Survey (KNHANES), a low serum 25(OH)D level was associated with fasting insulin, HOMA-IR, and diabetes [
1,
16].
Meanwhile, other studies have shown that serum 25(OH)D level is not significantly correlated to glucose metabolism [
17,
18,
19,
20,
21,
29]. Our previous study suggested that vitamin D is not independently associated with insulin resistance among middle-aged Korean men and women [
29]. In the Third U.S. National Health and Nutrition Examination Survey, serum 25(OH)D level was inversely associated with insulin resistance and diabetes mellitus only in Mexican Americans and non-Hispanic whites, but not in non-Hispanic blacks [
17]. In the Hoorn study, which comprised participants aged 50 to 75 years, no significant relationship was revealed between 25(OH)D, postprandial or fasting glucose concentrations, and incident diabetes [
18]. In a healthy Cree community in Quebec, Canada, no association between vitamin D and insulin homeostasis indices (HOMA-IR and HOMA-Beta) was detected [
19]. In a cross-sectional study of Pan-European subjects with metabolic syndrome, no correlations were recorded between vitamin D and intravenous glucose tolerance test (IVGTT)-based estimates of insulin secretion and action [
20]. Additionally, a Turkish study of children and adolescents found no correlation between insulin measurements during an oral glucose tolerance test and vitamin D deficiency [
21].
Compared with previous studies, ours is distinct in that we investigated the gender and residential area-specific association between low 25(OH)D level and insulin resistance in general elderly Koreans, while other Korean studies were carried out indiscriminately on all participants aged 19 years or older with statistical adjustments for gender and residential area [
1,
16]. Previous studies that set out to investigate the inverse association between vitamin D and insulin resistance also might not have appropriately controlled for residential area and other socio-demographic characteristics. In fact, many previous studies categorized residential areas into rural and urban areas simply based on administrative district, which may not reflect actual urban-rural differences.
The KURE study recruited participants from urban and rural areas. All participants from the two areas resided in the midwestern region of the Korean peninsula, and were of the same ethnic and racial origin, Korean. Total cholesterol, HDL cholesterol, LDL cholesterol, and triglyceride levels were similar between the urban dwellers and the rural dwellers. Distribution of smoking status and alcohol intake were also similar between the two communities. However, there were some differences between the urban and rural residents: in the urban area, only 0.1% of participants worked in the agricultural, forestry, or fishery industry, whereas in the rural area, 60.8% of participants were agricultural, forestry, or fishery workers; people working in these industries typically spend a lot more time working outdoors. Also, urban dwellers were more obese than the rural dwellers (BMI, 24.2 vs. 23.5 kg/m2, p < 0.001; waist circumference, 84.0 vs. 82.1 cm, p < 0.001). Thus, it was possible for us to take into account residential area as a potential confounder. To compare the effect of residential area versus the effect of individual characteristics on the association between serum 25(OH)D and insulin resistance in men, we constructed an additional model that included adjustment for residential area in addition to study year and a participant’s age. Adjusting for residential area resulted in greater attenuation of the effect size (std. β = −0.100, p = 0.035) than adjusting for individual characteristics, such as BMI, waist circumference, smoking, alcohol intake, and exercise (std. β = −0.133, p < 0.001). These results implied that urban-rural differences exert a greater influence on the association between serum 25(OH)D and insulin resistance than other measurable variables: we suspect that urban-rural differences are reflective of any number of combinations of environmental and socioeconomic factors, such as dissimilarities in outdoor activity related to one’s occupation and physical activity related to traveling to and from work. Nonetheless, our findings suggest that vitamin D itself does not exert major influences on insulin resistance and that residential area largely explains the association between 25(OH)D and insulin resistance.
The study has a few limitations that warrant consideration. First, this study was conducted as a cross-sectional study in which all information was collected at the same point in time; therefore, the causal association between serum 25(OH)D and insulin resistance is uncertain and residual confounders might not be totally removed. Second, we did not examine intake of vitamin D supplements and outdoor activity, which may influence vitamin D concentrations in the body, and thus we could not adjust for them. Third, we did not utilize the euglycemic clamp method, known as a gold standard examination for assessing insulin resistance. Instead, we utilized HOMA-IR as a surrogate marker of insulin resistance. Most epidemiological studies widely support the use of HOMA-IR on the basis of a high correlation between estimates of insulin resistance derived from HOMA and from the glucose clamp [
30]. Lastly, serum 25(OH)D level was not measured by tandem-mass spectrometry, the reference method, but by chemiluminescence immunoassay. This immunoassay is intended for quantitative determination of total 25(OH)D and does not distinguish between 25(OH)D
2 and 25(OH)D
3 [
31]. Also, serum 25(OH)D level was measured mainly in the summer and cannot represent annual mean concentrations. Nevertheless, the principal purpose of the current study was to examine the relationship between serum 25(OH)D and insulin resistance in a general elderly population and not to report absolute levels of 25(OH)D over the year. Thus, our findings would not be critically distorted by the single measurement of serum 25(OH)D levels.

