Predictors of Energy Compensation during Exercise Interventions: A Systematic Review

Abstract
:1. Introduction
2. Experimental Section
2.1. Search Protocol
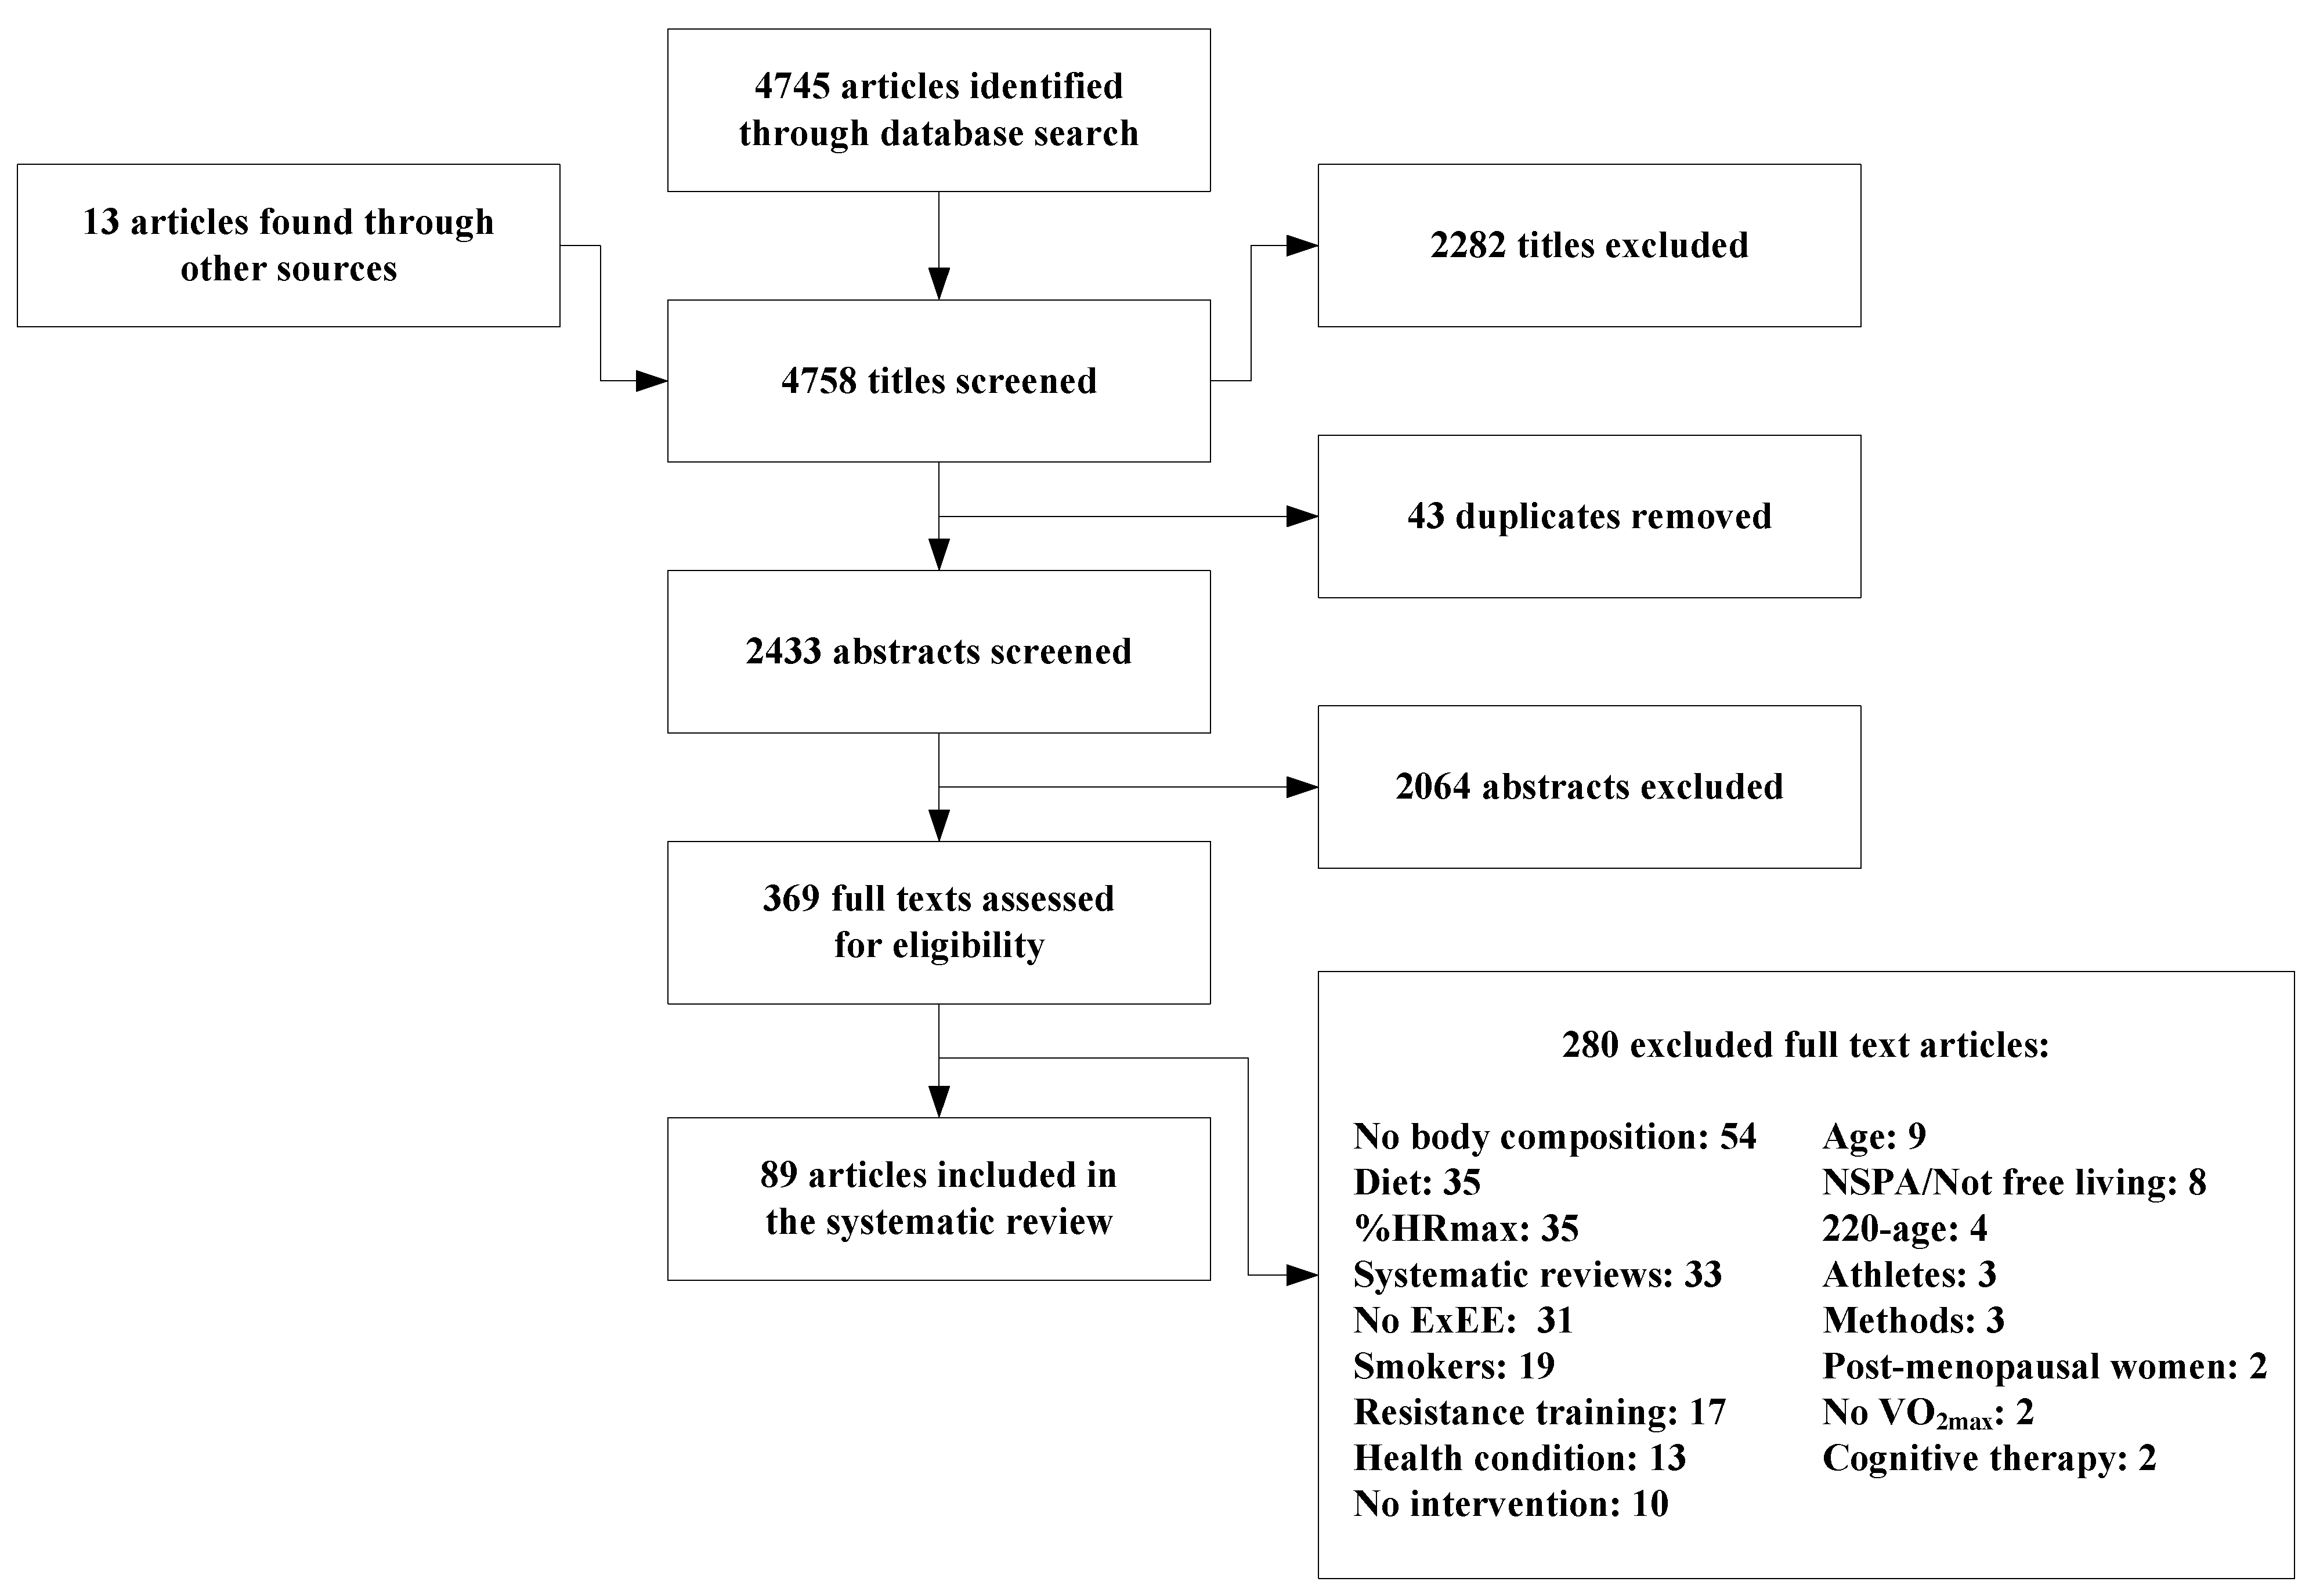
2.2. Article Selection Process

| Criteria | Included | Excluded |
|---|---|---|
| Population | Men and Women Aged from 18–55 years old Any BMI Women with a period on a regular basis Healthy individual | Under 18 or over 55 years old Menopausal women Illness (type 2 diabetes, hypertension, cancer, hyperinsulinemia) Athletes or military Smoker, drinker (>2 drinks/day) or individual with drug abuse Under medication |
| Focus/intervention | Aerobic training Interval training Any intervention time intervention duration | Yoga Stretching program Resistance training/callisthenic exercise Animal intervention Diet, caloric restriction and dietary or vitamin supplement Nutrition or cognitive counselling Intervention that aim to maintain or increasing NSPA |
| Outcomes | Body weight | Maximal heart rate |
| FFM | ||
| FM | ||
| EE | ||
| VO2max reserve | ||
| Maximal heart rate reserve | ||
| Study design | RCTs Pre- and post-test design Interrupted time series | |
| Language | English French | Other languages |
| Publication status | Published articles (including all years) | Unpublished articles Undergoing publication process Abstract only available |
2.3. Synthesis Process: Body Composition, EE Related to Exercise and Degree of Energy Compensation (%)
2.4. Statistical Analysis
3. Results
| Studies | Studies Characteristics | n | Participants Characteristics at Baseline | ||||||
|---|---|---|---|---|---|---|---|---|---|
| First Author | Year | Group Design | Inclusion | Sex | Sedentary | Stable Body Weight | VO2peak (mL/kg/min) | Age (year) | Weight (kg) |
| Abe [30] | 1997 | RCT | 9 | female | Yes | N/A | N/A | 19–23 | 54.5 ± 4.9 (9) |
| Blaney [31] | 1991 | Before-after | 7 | male | Yes | N/A | 32.4 ± N/A | 42.0 ± 6.0 | 91.0 ± 15.0 (7) |
| Brandon [32] | 2006 | RCT | 28 | female | Yes | Yes | 32.0 ± N/A | 37.3 ± N/A | 85.6 ± N/A (28) |
| Carter [33] | 2001 | Before-after | 8 | male | N/A | N/A | 41.5 ± 6.7 | 22.0 ± 1.0 | 78.1 ± 7.2 (8) |
| Carter [33] | 2001 | Before-after | 8 | female | N/A | N/A | 31.9 ± 3.9 | 22.0 ± 2.0 | 68.2 ± 7.0 (8) |
| Caudwell [12] 1 | 2013 | ITS | 35 | male | Yes | Yes | 34.9 ± 6.9 | 41.3 ± 8.6 | 96.9 ± 13.2 (35) |
| Caudwell [12] 1 | 2013 | ITS | 72 | female | Yes | Yes | 29.1 ± 6.5 | 40.6 ± 9.5 | 85.9 ± 11.5 (72) |
| Cowan [34] | 1985 | RCT | 16 | female | Yes | N/A | N/A | 41.3 ± 4.4 | 67.5 ± 11.2 (16) |
| Cramer [35] | 1991 | RCT | 25 | female | N/A | N/A | 25.7 ± 0.9 | 36.0 ± 1.6 | 76.5 ± 1.9 (18) |
| Després [36] | 1991 | Before-after | 13 | female | N/A | N/A | 24.3 ± N/A | 38.8 ± 5.3 | 90.0 ± 11.8 (13) |
| Donnelly [37] | 2000 | ITS | 11 | female | Yes | N/A | 23.6 ± 2.8 | 54.0 ± 9.0 | 81.4 ± 5.7 (11) |
| Donnelly [37] | 2000 | ITS | 11 | female | Yes | N/A | 22.9 ± 4.1 | 49.0 ± 8.0 | 85.9 ± 13.1 (11) |
| Donnelly [38] | 2013 | RCT | 32 | female | N/A | N/A | 31.6 ± 3.8 | 22.6 ± 3.2 | 81.3 ± 13 (18) |
| Donnelly [38] | 2013 | RCT | 31 | female | N/A | N/A | 29.8 ± 4.1 | 22.6 ± 2.9 | 83.3 ± 18.9 (19) |
| Donnelly [38] | 2013 | RCT | 30 | male | N/A | N/A | 36.4 ± 6.4 | 23.3 ± 3.7 | 102. 0 ± 11.7 (19) |
| Donnelly [38] | 2013 | RCT | 22 | male | N/A | N/A | 37.1 ± 6.5 | 23.5 ± 3.2 | 99.9 ± 19.4 (18) |
| Dowdy [39] | 1985 | Before-after | 18 | female | Yes | N/A | 33.8 ± 3.9 | 31.5 ± 5.6 | 63.4 ± 7.2 (18) |
| Earnest [40] 2 | 2013 | Before-after | 21 | male | Yes | N/A | 29.5 ± 2.9 | 48.0 ± 9.0 | 93.9 ± 9.6 (21) |
| Earnest [40] | 2013 | Before-after | 21 | male | Yes | N/A | 28.3 ± 4.5 | 49.0 ± 9.0 | 98.9 ± 12.7 (16) |
| Glisezinski [41] | 2003 | Before-after | 11 | male | N/A | Yes | 34.3 ± 1.3 | 25.6 ± 1.4 | 89.5 ± 1.6 (11) |
| Glowacki [42] | 2004 | RCT + ITS | N/A | male | Yes | N/A | 40.8 ± 9.0 | 25.0 ± 5.0 | 87.9 ± 16.6 (12) |
| Grediagin [24] | 1995 | Before-after | 9 | female | Yes | Yes | 31.5 ± 3.8 | 30.0 ± 5.0 | 68.2 ± 5.9 (6) |
| Grediagin [24] | 1995 | Before-after | 9 | female | Yes | Yes | 31.3 ± 3.3 | 31.0 ± 6.0 | 68.6 ± 4.6 (6) |
| Hardman [43] | 1992 | ITS | 34 | female | Yes | N/A | N/A | 44.9 ± 1.5 | 64.0 ± 1.7 (28) |
| Hinkleman [44] | 1993 | RCT | 25 | female | N/A | N/A | 25.7 ± 0.9 | 36.0 ± 1.6 | 76.5 ± N/A (18) |
| Juneau [45] | 1987 | RCT | 30 | male | Yes | N/A | 31.9 ± 4.4 | 49.0 ± 6.0 | 79.4 ± 11.0 (28) |
| Juneau [45] | 1987 | RCT | 30 | female | Yes | N/A | 25.8 ± 3.9 | 47.0 ± 5.0 | 63.8 ± 8.0 (24) |
| Kirk [46] | 2003 | RCT | N/A | female | Yes | N/A | 32.8 ± 4.2 | 24.0 ± 5.0 | 77.0 ± 11.4 (25) |
| Kirk [46] | 2003 | RCT | N/A | male | Yes | N/A | 39.2 ± 5.2 | 22.0 ± 4.0 | 94.0 ± 12.6 (16) |
| Krustrup [47] | 2010 | RCT | 25 | female | Yes | N/A | 32.7 ± 1.1 | 37.0 ± 2.0 | 71.6 ± 2.3 (21) |
| Krustrup [47] | 2010 | RCT | 25 | female | Yes | N/A | 35.5 ± 1.4 | 37.0 ± 1.0 | 67.1 ± 1.8 (17) |
| Krustrup [48] | 2009 | RCT | 13 | male | Yes | N/A | 39.6 ± 1.5 | 30.0 ± 2.0 | 82.2 ± 2.9 (12) |
| Krustrup [48] | 2009 | RCT | 12 | male | Yes | N/A | 39.3 ± 2.5 | 31.0 ± 2.0 | 85.8 ± 5.5 (10) |
| Lee [49] | 2009 | RCT | 10 | male | N/A | Yes | 46.2 ± 1.2 | 26.2 ± 1.4 | 73.8 ± 2.1 (9) |
| Moro [50] | 2005 | Before-after | 10 | male | N/A | Yes | 34.7 ± 1.2 | 26.0 ± 1.4 | 90.3 ± 1.6 (10) |
| Mougios [25] | 2006 | Before-after | 7 | female | Yes | Yes | 36.6 ± 3.8 | 30.0 ± 9.0 | 64.1 ± 6.3 (7) |
| Mougios [25] | 2006 | Before-after | 7 | female | Yes | Yes | 34.0 ± 5.6 | 31.0 ± 9.0 | 68.7 ± 8.7 (7) |
| Nishida [51] | 2010 | Before-after | 6 | male | Yes | N/A | 41.3 ± 2.0 | 24.5 ± 1.9 | 66.4 ± 3.5 (6) |
| Nordby [52] 3 | 2012 | RCT | 17 | male | Yes | Yes | 38.2 ± 1.7 | 28.0 ± 1.0 | 94.5 ± 2.3 (12) |
| Nybo [53] | 2010 | Before-after | 9 | male | Yes | N/A | 39.3 ± 2.5 | 31.0 ± 2.0 | 85.8 ± 5.5 (9) |
| Polak [54] | 2006 | Before-after | 25 | female | Yes | Yes | 24.6 ± 3.9 | 40.4 ± 6.7 | 88.5 ± 8.2 (25) |
| Rosenkilde [9] 4 | 2012 | RCT | 21 | male | Yes | Yes | 34.6 ± 4.1 | 30.0 ± 7.0 | 93.2 ± 8.1 (18) |
| Rosenkilde [9] 4 | 2012 | RCT | 22 | male | Yes | Yes | 36.2 ± 5.3 | 28.0 ± 5.0 | 91.3 ± 7.2 (18) |
| Ruby [55] | 1996 | Before-after | 6 | female | Yes | N/A | 39.9 ± 1.2 8 | 20.3 ± 0.9 | 58.2 ± 3.3 (6) |
| Ruby [55] | 1996 | Before-after | 6 | female | Yes | N/A | 33.6 ± 0.2 8 | 20.5 ± 1.0 | 61.6 ± 3.6 (6) |
| Ruby [55] | 1996 | Before-after | 6 | female | Yes | N/A | 36.8 ± 1.4 8 | 21.3 ± 0.6 | 62.4 ± 3.0 (6) |
| Santiago [56] | 1995 | RCT | 21 | female | Yes | N/A | 31.5 ± 4.2 | 30.1 ± 5.3 | 64.4 ± 10.2 (16) |
| Sedlock [57] | 2010 | RCT | 10 | male | N/A | Yes | 46.2 ± 1.2 | 26.2 ± 1.4 | 73.8 ± 2.1 (9) |
| Sijie [58] | 2012 | RCT | 20 | female | N/A | N/A | 33.3 ± 3.9 | 19.8 ± 1.0 | 73.7 ± 7.5 (17) |
| Sijie [58] | 2012 | RCT | 20 | female | N/A | N/A | 32.9 ± 4.7 | 19.3 ± 0.7 | 74.2 ± 9.0 (16) |
| Snyder [59] | 1997 | Before-after | 15 | female | Yes | Yes | 24.0 ± 4.6 | 43.0 ± 11.0 | 87.2 ± 21.5 (13) |
| Suter [60] | 1995 | Before-after | 20 | male | Yes | N/A | 39.3 ± 5.5 | 39.1 ± 8.3 | 75.6 ± 9.8 (12) |
| Tan [61] | 2012 | RCT | 30 | female | Yes | N/A | 34.1 ± 2.6 | 20–23 | 70.4 ± 5.3 (29) |
| Trapp [62] | 2008 | RCT | 15 | female | Yes | N/A | 28.8 ± 2.1 | 22.4 ± 0.7 | 63.3 ± 3.8 (11) |
| Trapp [62] | 2008 | RCT | 15 | female | Yes | N/A | 30.9 ± 2.1 | 21.0 ± 0.8 | 59.8 ± 2.4 (8) |
| Van Aggel-Leijssen [63] | 2002 | RCT | 8 | male | Yes | Yes | 31.1 ± N/A | 43.4 ± 6.3 | 102.7 ± 10.8 (8) |
| Van Aggel-Leijssen [63] | 2002 | RCT | 8 | male | Yes | Yes | 31.4 ± N/A | 40.0 ± 6.3 | 105.5 ± 6.6 (8) |
| Van Aggel-Leijssen [64] | 2001 | Before-after | 8 | female | Yes | Yes | 24.7 ± N/A | 32.8 ± 9.6 | 91.2 ± 9.7 (8) |
| Van Aggel-Leijssen [64] | 2001 | RCT | 7 | female | Yes | Yes | 24.6 ± N/A | 37.7 ± 6.4 | 86.5 ± 10.2 (7) |
| Wilmore [65] | 1980 | RCT | 9 | male | Yes | N/A | 38.6 ± N/A | 37.0 ± 8.9 | 85.7 ± 18.9 (9) |
| Wilmore [65] | 1980 | RCT | 9 | male | Yes | N/A | 42.2 ± N/A | 35.6 ± 8.3 | 79.8 ± 8.9 (9) |
| Studies | Interventions Characteristics | Outcomes of the Interventions | ||||||||
|---|---|---|---|---|---|---|---|---|---|---|
| First Author, year | Supervised | Compliance (%) | Exercise Intervention | Measure of BC | FM (Initial) (kg) | FM (Final) (kg) | FFM (Initial) (kg) | FFM (Final) (kg) | ExEE Total (kcal) | Compensation (%) |
| Abe, 1997 [30] | Yes | N/A | 2.8×/week for 30 min during 13 weeks of continuous biking at 50%–60% HRRmax | HW | 15.3 ± 2.7 (9) | 12.7 ± 2.1 (9) | 39.2 ± 3.3 (9) | 38.5 ± 3.4 (9) | 7280 | −245 |
| Blaney, 1991 [31] | No | N/A | 3×/week for 28 min during 16 weeks of continuous running/walking at 70%–80% VO2max | HW | 25.5 ± N/A (7) | 23.7 ± N/A (7) | 65.0 ± 10.0 (7) | 67.0 ± 10.0 (7) | 16,131 | 14 |
| Brandon, 2006 [32] | No | 87.6 | 3×/week for 50 min during 18 weeks of continuous brisk walking at a self-pace with an objective of 3.5 mph | DEXA | 38.5 ± N/A (28) | 36.1 ± N/A (28) | 47.1 ± N/A (28) | 47.6 ± N/A (28) | 17,521 | −24 |
| Carter, 2001 [33] | No | N/A | 5×/week for 60 min during 7 weeks of continuous biking at 60% VO2peak | DEXA | 12.2 ± N/A (8) | 11.8 ± N/A (8) | 65.9 ± 7.1 (8) | 66.0 ± 6.6 (8) | 22,191 | 84 |
| Carter, 2001 [33] | No | N/A | 5×/week for 60 min during 7 weeks of continuous biking at 60% VO2peak | DEXA | 17.9 ± N/A (8) | 17.2 ± N/A (8) | 50.3± 4.2 (8) | 50.3 ± 4.1 (8) | 15,769 | 58 |
| Caudwell, 2013 [12] | Yes | N/A | 5×/week during 12 weeks of continuous walking/biking/running/rowing/stepping machine at 70% HRmax | BP | 33.2 ± 10.4 (35) | 30.1 ± N/A (35) | 63.4 ± 6.5 (35) | 63.5 ± N/A (35) | 29,339 | 0 |
| Caudwell, 2013 [12] | Yes | N/A | 5×/week during 12 weeks of continuous walking/biking/running/rowing/stepping machine at 70% HRmax | BP | 38.3 ± 9.0 (72) | 35.3 ± N/A (72) | 47.7 ± 5.8 (72) | 48.3 ± N/A (72) | 27,547 | 1 |
| Cowan, 1985 [34] | No | 93.75 | 4×/week for 17–44 min during 9 weeks of continuous walking at 80% aged predicted HRmax | HW | 21.9 ± N/A (16) | 21.2 ± N/A (16) | 45.6 ± N/A (16) | 46.3 ± N/A (16) | 6001 | 11 |
| Cramer, 1991 [35] | Yes | 100 | 5×/week for 45 min during 15 weeks of continuous walking/biking at 62% VO2max | HW | 27.9 ± N/A (18) | 27.8 ± N/A (18) | 48.6 ± N/A (18) | 48.7 ± N/A (18) | 20,810 | 94 |
| Després, 1991 [36] | No | N/A | 4.5×/week for 90 min during 61 weeks of continuous walking/biking/aerobic dance/swimming at 55% VO2max | HW | 42.6 ± 9.4 (13) | 38.0 ± 7.3 (13) | 47.4 ± 5.1 (13) | 48.3 ± 4.1 (13) | 163,327 | 74 |
| Donnelly, 2000 [37] | Yes | 91.9 | 3×/week for 29 min during 78 weeks of continuous exercise (N/A) at 60%–75% VO2max | HW | 34.0 ± 3.7 (11) | 31.9 ± 3.3 (11) | 47.4 ± 3.7 (11) | 47.8 ± 3.8 (11) | 41,793 | 54 |
| Donnelly, 2000 [37] | Not always | 90.3 | 5×/week for 14.5 min twice daily during 78 weeks of continuous walking at 50%–65% HRreserve | HW | 36.7 ± 7.0 (11) | 36.0 ± 7.7 (11) | 49.1 ± 7.7 (11) | 49.1 ± 7.5 (11) | 60,492 | 89 |
| Donnelly, 2013 [38] | Yes | >90 | 5×/week for the time necessary to expend 600 kcal/session during 43.5 weeks of continuous biking/running/walking/exercise on elliptical machine at 70%–80% HRmax | DEXA | 34.1 ± 9.4 (18) | 29.7 ± 9.6 (18) | 46.1 ± 5.3 (18) | 46.9 ± 4.8 (18) | 111,703 | 64 |
| Donnelly, 2013 [38] | Yes | >90 | 5×/week for the time necessary to expend 400 kcal/session during 43.5 weeks of continuous biking/running/walking/exercise on elliptical machine at 70%–80% HRmax | DEXA | 34.8 ± 11.1 (19) | 31.7 ±12.2 (19) | 46.9 ± 8.0 (19) | 47.0 ± 7.7 (19) | 74,744 | 61 |
| Donnelly, 2013 [38] | Yes | >90 | 5×/week for the time necessary to expend 600 kcal/session during 43.5 weeks of continuous biking/running/walking/exercise on elliptical machine at 70%–80% HRmax | DEXA | 36.4 ± 7.5 (19) | 30.5 ± 10.1 (19) | 65.0 ± 7.3 (19) | 65.4 ± 7.4 (19) | 111,703 | 51 |
| Donnelly, 2013 [38] | Yes | >90 | 5×/week for the time necessary to expend 400 kcal/session during 43.5 weeks of continuous biking/running/walking/exercise on elliptical machine at 70%–80% HRmax | DEXA | 34.5 ± 11.6 (18) | 31.0 ± 11.4 (18) | 64.4 ± 9.9 (18) | 64.4 ± 9.2 (18) | 74,744 | 56 |
| Dowdy, 1985 [39] | No | ≥90 | 3×/week for 45 min during 10 weeks of continuous aerobic dance at 77% HRreserve | HW | 19.3 ± 6.4 (18) | 19.7 ± 5.8 (18) | 43.8 ± 3.1 (18) | 44.1 ± 2.3 (18) | 11,525 | 146 |
| Earnest, 2013 [40] | No | N/A | 3–4×/week during 12 weeks of continuous running/walking at 50%–70% VO2max and running/walking interval between 90% and 95% VO2max with recuperation at 50% VO2max | DEXA | 27.5 ± N/A (21) | 26.1 ± N/A (21) | 66.4 ± N/A (21) | 65.5 ± N/A (21) | 12,096 | −15 |
| Earnest, 2013 [40] | No | N/A | 3–4×/week during 12 weeks of continuous running/walking at 50%–70% VO2max | DEXA | 28.3 ± N/A (16) | 27.8 ± N/A (16) | 70.6 ± N/A (16) | 69.9 ± N/A (16) | 12,096 | 50 |
| Glisezinski, 2003 [41] | Yes | N/A | 5×/week for 60 min during 17 weeks of continuous running/biking at a VO2max that increased from 50%–85% | DEXA | 20.4 ± N/A (11) | 19.0 ± N/A (11) | 69.1 ± N/A (11) | 68.6 ± N/A (11) | 58,785 | 77 |
| Glowacki, 2004 [42] | Yes | N/A | 2–3×/week for 20–40 min during 12 weeks of continuous running at 65%–80% HRreserve | HW | 19.2 ± N/A (12) | 17.3 ± N/A (12) | 68.7 ± 9.5 (12) | 69.5 ± 9.3 (12) | 13,210 | −25 |
| Grediagin, 1995 [24] | No | 100 | 4×/week during 12 weeks of continuous exercise on a treadmill at 80% VO2max | HW | 21.2 ± N/A (6) | 18.9 ± N/A (6) | 47.0 ± N/A (6) | 48.9 ± N/A (6) | 14,400 | −24 |
| Grediagin, 1995 [24] | No | 100 | 4×/week during 12 weeks of continuous exercise on a treadmill at 50% VO2max | HW | 21.3 ± N/A (6) | 19.0 ± N/A (6) | 47.4 ± N/A (6) | 48.2 ± N/A (6) | 14,400 | −39 |
| Hardman, 1992 [43] | No | N/A | ≥3×/week for ˃20 min during 52 weeks of continuous brisk walking | HW | 23.7 ± 1.5 (28) | 24.7 ± 1.6 (28) | 40.3 ± N/A (28) | 39.6 ± N/A (28) | 44,726 | 125 |
| Hinkleman, 1993 [44] | Yes | N/A | 5×/week for 45 min during 15 weeks of continuous walking at 60% HRreserve | HW | 28.1 ± 1.4 (18) | 28.0 ± 1.3 (18) | 48.4 ± 0.9 (18) | 48.5 ± 0.9 (18) | 20,139 | 96 |
| Juneau, 1987 [45] | No | N/A | 5×/week for 47 min during 24 weeks of continuous exercise (N/A) at 50%–66% VO2max | HW | 17.9 ± N/A (28) | 14.0 ± N/A (28) | 61.5 ± 8.0 (28) | 63.9 ± 13.0 (28) | 38,160 | 15 |
| Juneau, 1987 [45] | No | N/A | 5×/week for 54 min during 24 weeks of continuous exercise (N/A) at 50%–66% VO2max | HW | 17.8 ± N/A (24) | 16.6 ± N/A (24) | 46.0 ± 5.0 (24) | 46.8 ± 4.0 (24) | 30,960 | 68 |
| Kirk, 2003 [46] | Yes | 89.6 | 3–5×/week for 20–45 min during 70 weeks of continuous biking/walking/aerobic exercise in water at a VO2max that increased from 55%–70% | HW | 27.4 ± 7.1 (25) | 27.2 ± 7.9 (25) | 49.5 ± 5.8 (25) | 50.4 ± 5.8 (25) | 118,837 | 100 |
| Kirk, 2003 [46] | Yes | 90.3 | 3–5×/week for 20–45 min during 70 weeks of continuous biking/walking/aerobic exercise in water at a VO2max that increased from 55%–70% | HW | 26.8 ± 6.8 (16) | 21.9 ± 5.5 (16) | 67.1 ± 8.3 (16) | 66.9 ± 7.8 (16) | 177,717 | 74 |
| Krustrup, 2010 [47] | No | 90 | 2×/week for 60 min during 16 weeks of soccer at 83% HRmax | DEXA | 25.6 ± 1.4 (21) | 24.2 ± 1.5 (21) | 42.5 ± 1.2 (21) | 43.9 ± 1.3 (21) | 16,055 | 33 |
| Krustrup, 2010 [47] | No | 92.5 | 2×/week for 60 min during 16 weeks of continuous running at 82% HRmax | DEXA | 22.0 ± 1.7 (17) | 20.9 ± 1.6 (17) | 41.6 ± 0.8 (17) | 42.9 ± 0.8 (17) | 16,055 | 50 |
| Krustrup, 2009 [48] | No | 92 | 2.3×/week for 60 min during 12 weeks of soccer at 82% HRmax | DEXA | 19.9 ± 2.4 (12) | 17.2 ± 2.1 (12) | 57.7 ± 2.2 (12) | 59.4 ±1.9 (12) | 19,783 | −13 |
| Krustrup, 2009 [48] | No | 100 | 2.5×/week for 60 min during 12 weeks of continuous running at 82% HRmax | DEXA | 20.7 ± 2.7 (10) | 19.0 ± 2.6 (10) | 61.3 ± 2.8 (10) | 61.9 ± 2.7 (10) | 21,503 | 31 |
| Lee, 2009 [49] | Yes | 100 | 3×/week for 25 min during 6 weeks of continuous running at 60% VO2max and then 4×/week for 40 min during the following 6 weeks of continuous running at 80% VO2max | HW | 12.1 ± 1.4 (9) | 11.2 ± 1.4 (9) | 61.7 ± 2.0 (9) | 62.1 ± 2.0 (9) | 18,615 | 58 |
| Moro, 2005 [50] | Yes | ≥90 | 5×/week for 45 min (mos1–2) and 60 min (months 3–4) during 17.4 weeks of continuous running/biking at 50%–85% VO2max | DEXA | 20.2 ± N/A (10) | 18.6 ± N/A (10) | 70.1 ± N/A (10) | 68.7 ± N/A (10) | 52,038 | 68 |
| Mougios, 2006 [25] | Yes | N/A | 4×/week during 13 weeks of continuous running at 72% VO2max | HW | 21.1 ± 2.9 (7) | 18.8 ± 2.3 (7) | 42.9 ± 4.7 (7) | 43.4 ± 4.7 (7) | 18,500 | −12 |
| Mougios, 2006 [25] | Yes | N/A | 4×/week during 13 weeks of continuous running/walking at 45% VO2max | HW | 23.0 ± 5.7 (7) | 20.0 ± 5.9 (7) | 45.7 ± 4.2 (7) | 45.4 ± 4.6 (7) | 18,500 | −54 |
| Nishida, 2010 [51] | Yes | 100 | 5×/week for 60 min during 12 weeks of continuous biking at a VO2max that increased from 36.8%–54.8% | HW | 9.1 ± N/A (6) | 8.9 ± N/A (6) | 57.3 ± N/A (6) | 57.6 ± N/A (6) | 25,304 | 95 |
| Nordby, 2012 [52] | Not always | 85.6 | 3.5×/week for 51.4 min during 12 weeks of continuous biking at 65% HRreserve and biking/running/rowing/elliptic machine interval at 85% HRreserve | DEXA | 28.5 ± 1.4 (12) | 20.8 ± 1.7 (12) | 66.0 ± 2.0 (12) | 67.8 ± N/A (12) | 24,205 | −186 |
| Nybo, 2010 [53] | No | N/A | 2.5×/week for 60 min during 12 weeks of continuous running at 65% VO2max | DEXA | 21.1 ± N/A (9) | 19.5 ± N/A (9) | 61.3 ± 2.8 (9) | 61.9 ± 2.7 (9) | 20,454 | 32 |
| Polak, 2006 [54] | Not always | N/A | 5×/week for 45 min during 12 weeks of continuous biking/gymnasium exercise with an increased from 50% to 60% and to 65% VO2peak every 3 weeks | DEXA | 34.3 ± N/A (25) | 30.2 ± N/A (25) | 54.2 ± N/A (25) | 53.1 ± N/A (25) | 17,965 | −120 |
| Rosenkilde, 2012 [9] | No | 99 | 6.2×/week for 30 min during 10 weeks of continuous biking/running at 66% VO2peak | DEXA | 30.0 ± 4.6 (18) | 26.0 ± N/A (18) | 63.3 ± 6.9 (18) | 63.6 ± N/A (18) | 21,105 | −76 |
| Rosenkilde, 2012 [9] | No | 96 | 6.2×/week for 55 min during 10 weeks of continuous biking/running at 67% VO2peak | DEXA | 27.4 ± 4.2 (18) | 23.6 ± N/A (18) | 64.0 ± 5.7 (18) | 65.0 ± N/A (18) | 41,139 | 17 |
| Ruby, 1996 [55] | Yes | ≥95 | 4×/week for 45 min during 10 weeks of continuous running at 70%–80% HRreserve | HW | 12.0 ± N/A (6) | 10.5 ± N/A (6) | 46.2 ± N/A (6) | 46.5 ± N/A (6) | 16,686 | 21 |
| Ruby, 1996 [55] | Yes | ≥95 | 4×/week for 45 min during 10 weeks of continuous biking at 70%–80% HRreserve | HW | 14.5 ± N/A (6) | 13.5 ± N/A (6) | 47.1 ± N/A (6) | 47.7 ± N/A (6) | 14,936 | 47 |
| Ruby, 1996 [55] | Yes | ≥95 | 4×/week for 45 min during 10 weeks of continuous biking/running at 70%–80% HRreserve | HW | 17.5 ± N/A (6) | 17.4 ± N/A (6) | 44.9 ± N/A (6) | 45.4 ± N/A (6) | 16,330 | 101 |
| Santiago, 1995 [56] | Yes | 91 | 4×/week during 38 weeks of continuous walking at 72% HRmax | HW | 18.4 ± N/A (16) | 17.0 ± N/A (16) | 46.0 ± N/A (16) | 46.4 ± N/A (16) | 52,440 | 76 |
| Sedlock, 2010 [57] | Yes | 100 | 3–4×/week for 25–40 min during 12 weeks of continuous running at a VO2max that increased from 60%–80% | HW | 12.1 ± 1.4 (9) | 11.2 ± 1.4 (9) | 61.7 ± 2.0 (9) | 62.1 ± 2.0 (9) | 16,905 | 54 |
| Sijie, 2012 [58] | Yes | N/A | 5×/week for 27 min during 12 weeks of walking (12 min)/running (15 min) interval at 50% and 85% VO2peak | DEXA | 29.9 ± N/A (17) | 24.7 ± N/A (17) | 43.8 ± N/A (17) | 42.8 ± N/A (17) | 14,385 | −248 |
| Sijie 2012 [58] | Yes | N/A | 5×/week for 40 min during 12 weeks of continuous running/walking at 50% VO2peak | DEXA | 30.5 ± N/A (16) | 27.2 ± N/A (16) | 43.7 ± N/A (16) | 42.6 ± N/A (16) | 15,003 | −114 |
| Snyder 1997 [59] | Not always | 82.6 | 5×/week for 3 × 10 min during 32 weeks of continuous walking at 52% HRreserve | HW | 36.7 ± 14.5 (13) | 37.2 ± 14.7 (13) | 50.6 ± 9.8 (13) | 49.9 ± 10.1 (13) | 19,554 | 128 |
| Suter, 1995 [60] | No | N/A 1 | 4×/week for 30 min during 26 weeks of continuous running at 75% VO2max | DEXA | 16.6 ± 6.1 (12) | 15.7 ± 6.4 (12) | 52.9 ± 6.6 (12) | 53.5 ± 6.3 (12) | 36,433 | 80 |
| Tan, 2012 [61] | Yes | ≥88 | 5×/week for 40 min during 8 weeks of continuous running at 54% VO2max | DEXA | 31.0 ± 4.6 (29) | 27.0 ± 4.0 (29) | 39.5 ± 4.9 (29) | 39.4 ± 4.4 (29) | 10,797 | −250 |
| Trapp, 2008 [62] | No | 100 | 3×/week for 20 min during 15 weeks of biking interval at 53.2% VO2peak power output | DEXA | 22.2 ± 30.0 (11) | 19.7 ± 2.6 (11) | 41.1 ± N/A (11) | 42.1 ± N/A (11) | 9915 | −119 |
| Trapp, 2008 [62] | No | 100 | 3×/week for 30 min during 15 weeks of continuous biking at 60% VO2peak | DEXA | 18.4 ± 2.2 (8) | 18.8 ± 2.1 (8) | 41.4 ± N/A (8) | 40.9 ± N/A (8) | 8,673 | 150 |
| Van Aggel-Leijssen, 2002 [63] | Yes | 89.4 | 3×/week for 57 min during 12 weeks of continuous biking at 40% VO2max | HW | 32.7 ± N/A (8) | 32.4 ± N/A (8) | 70.0 ± 9.6 (8) | 70.7 ± 8.7 (8) | 12,600 | 87 |
| Van Aggel-Leijssen, 2002 [63] | Yes | 92.6 | 3×/week for 33 min during 12 weeks of continuous biking at 70% VO2max | HW | 32.7 ± N/A (8) | 33.3 ± N/A (8) | 72.8 ± 5.4 (8) | 71.8 ± 6.7 (8) | 13,104 | 148 |
| Van Aggel-Leijssen, 2001 [64] | Yes | 81 | 3×/week for 57 min during 12 weeks of continuous biking at 40% VO2max | HW | 41.2 ± N/A (8) | 41.7 ± N/A (8) | 50.0 ± 2.4 (8) | 49.5 ± 2.7 (8) | 9000 | 162 |
| Van Aggel-Leijssen, 2001 [64] | Yes | 88 | 3×/week for 57 min during 12 weeks of continuous biking at 40% VO2max | HW | 37.1 ± N/A (7) | 37.5 ± N/A (7) | 49.4 ± 3.7 (7) | 49.6 ± 3.8 (7) | 8892 | 158 |
| Wilmore, 1980 [65] | No | 99.1 | 3×/week for 30 min during 20 weeks of continuous biking at 75% HRreserve | HW | 19.3 ± N/A (9) | 18. 0 ± N/A (9) | 66.4 ± N/A (9) | 67.4 ± N/A (9) | 23,978 | 56 |
| Wilmore, 1980 [65] | No | 93.3 | 3×/week for 30 min during 20 weeks of continuous running at 75% HRreserve | HW | 16.2 ± N/A (9) | 14.5 ± N/A (9) | 63.6 ± N/A (9) | 63.5 ± N/A (9) | 24,239 | 34 |


4. Discussion
5. Conclusions
Author Contributions
Appendix
Appendix 1. MEDLINE search strategy.
- 1
- exercise/or running/or jogging/or swimming/or walking/
- 2
- Motor activity/
- 3
- Physical Fitness/
- 4
- Exercise Therapy/
- 5
- exp Sports/
- 6
- Dancing/
- 7
- exercis*.tw.
- 8
- physical activit*.tw.
- 9
- vigorous activit*.tw.
- 10
- physical training.tw.
- 11
- exertion.tw.
- 12
- (aerobic* or walking or jogging or swimming or cycling or bicycling or running).tw.
- 13
- (fitness adj3 (class* or regime* or program*)).tw.
- 14
- danc*.tw.
- 15
- endurance training.tw.
- 16
- or/1–15
- 17
- Energy Metabolism/
- 18
- (energy adj3 spent).tw.
- 19
- (energy adj3 output).tw.
- 20
- (energy adj2 expend*).tw.
- 21
- (calori* adj3 burn*).tw.
- 22
- (calori* adj3 expend*).tw.
- 23
- Oxygen Consumption/
- 24
- (oxygen adj3 consum*).tw.
- 25
- (O2 adj3 consum*).tw.
- 26
- “(VO(2 max))”.tw.
- 27
- VO2max.tw.
- 28
- (VO2 adj2 peak).tw.
- 29
- (oxygen adj2 uptake).tw.
- 30
- (oxygen adj2 intake).tw.
- 31
- (aerobic capacity adj3 max*).tw.
- 32
- or/17–31
- 33
- body composition.mp.
- 34
- Body Fat Distribution/
- 35
- (fat adj3 mass).tw.
- 36
- body fat.tw.
- 37
- (fat adj3 percentage).tw.
- 38
- body weight/
- 39
- body weight changes/
- 40
- weight gain/ or weight loss/
- 41
- obesity/ or overweight/
- 42
- normal weight.tw.
- 43
- lean body.tw.
- 44
- or/33–43
- 45
- randomized controlled trial.pt.
- 46
- controlled clinical trial.pt.
- 47
- (randomized or randomly).tw.
- 48
- trial.ti.
- 49
- (control* adj3 (study or studies or trial)).tw,hw.
- 50
- time series.tw.
- 51
- (pre test or pretest or posttest or post test).tw.
- 52
- quantitative.tw.
- 53
- cohort studies/
- 54
- or/45–53
- 55
- exp animals/ not humans.sh.
- 56
- 54 not 55
- 57
- 16 and 32 and 44
- 58
- 56 and 57
- 59
- limit 58 to (English or French)
Appendix 2. Risk of bias

Conflicts of Interest
References
- Hill, J.O.; Wyatt, H.R.; Peters, J.C. Energy balance and obesity. Circulation 2012, 126, 126–132. [Google Scholar] [CrossRef] [PubMed]
- Sumithran, P.; Proietto, J. The defence of body weight: A physiological basis for weight regain after weight loss. Clin. Sci. (Lond.) 2013, 124, 231–241. [Google Scholar] [CrossRef]
- Miller, W.C.; Koceja, D.M.; Hamilton, E.J. A meta-analysis of the past 25 years of weight loss research using diet, exercise or diet plus exercise intervention. Int. J. Obes. Relat. Metab. Disord. 1997, 21, 941–947. [Google Scholar] [CrossRef] [PubMed]
- Garrow, J.S.; Summerbell, C.D. Meta-analysis: Effect of exercise, with or without dieting, on the body composition of overweight subjects. Eur. J. Clin. Nutr. 1995, 49, 1–10. [Google Scholar] [PubMed]
- Catenacci, V.A.; Wyatt, H.R. The role of physical activity in producing and maintaining weight loss. Nat. Clin. Pract. Endocrinol. Metab. 2007, 3, 518–529. [Google Scholar] [CrossRef] [PubMed]
- Thomas, D.M.; Bouchard, C.; Church, T.; Slentz, C.; Kraus, W.E.; Redman, L.M.; Martin, C.K.; Silva, A.M.; Vossen, M.; Westerterp, K.; et al. Why do individuals not lose more weight from an exercise intervention at a defined dose? An energy balance analysis. Obes. Rev. 2012, 13, 835–847. [Google Scholar] [CrossRef] [PubMed]
- Blundell, J.E.; Stubbs, R.J.; Hughes, D.A.; Whybrow, S.; King, N.A. Cross talk between physical activity and appetite control: Does physical activity stimulate appetite? Proc. Nutr. Soc. 2003, 62, 651–661. [Google Scholar] [CrossRef] [PubMed]
- King, N.A.; Hopkins, M.; Caudwell, P.; Stubbs, R.J.; Blundell, J.E. Individual variability following 12 weeks of supervised exercise: Identification and characterization of compensation for exercise-induced weight loss. Int. J. Obes. (Lond.) 2008, 32, 177–184. [Google Scholar] [CrossRef] [Green Version]
- Rosenkilde, M.; Auerbach, P.; Reichkendler, M.H.; Ploug, T.; Stallknecht, B.M.; Sjodin, A. Body fat loss and compensatory mechanisms in response to different doses of aerobic exercise—A randomized controlled trial in overweight sedentary males. Am. J. Physiol. Regul. Integr. Comp. Physiol. 2012, 303, R571–R579. [Google Scholar] [CrossRef] [PubMed]
- Todd Alan Hagobian, N.E. Exercise and Weight Loss: What Is the Evidence of Sex Differences? Curr. Obes. Rep. 2012, 2, 86–92. [Google Scholar]
- Boutcher, S.H.; Dunn, S.L. Factors that may impede the weight loss response to exercise-based interventions. Obes. Rev. 2009, 10, 671–680. [Google Scholar] [CrossRef] [PubMed]
- Caudwell, P.; Gibbons, C.; Hopkins, M.; King, N.; Finlayson, G.; Blundell, J. No sex difference in body fat in response to supervised and measured exercise. Med. Sci. Sports Exerc. 2013, 45, 351–358. [Google Scholar] [CrossRef] [PubMed]
- McTiernan, A.; Sorensen, B.; Irwin, M.L.; Morgan, A.; Yasui, Y.; Rudolph, R.E.; Surawicz, C.; Lampe, J.W.; Lampe, P.D.; Ayub, K.; et al. Exercise effect on weight and body fat in men and women. Obesity (Silver Spring) 2007, 15, 1496–1512. [Google Scholar] [CrossRef]
- Kissileff, H.R.; Pi-Sunyer, F.X.; Segal, K.; Meltzer, S.; Foelsch, P.A. Acute effects of exercise on food intake in obese and nonobese women. Am. J. Clin. Nutr. 1990, 52, 240–245. [Google Scholar] [PubMed]
- Unick, J.L.; Otto, A.D.; Goodpaster, B.H.; Helsel, D.L.; Pellegrini, C.A.; Jakicic, J.M. Acute effect of walking on energy intake in overweight/obese women. Appetite 2010, 55, 413–419. [Google Scholar] [CrossRef] [PubMed]
- Westerterp-Plantenga, M.S.; Verwegen, C.R.; Ijedema, M.J.; Wijckmans, N.E.; Saris, W.H. Acute effects of exercise or sauna on appetite in obese and nonobese men. Physiol. Behav. 1997, 62, 1345–1354. [Google Scholar] [CrossRef] [PubMed]
- Ueda, S.Y.; Yoshikawa, T.; Katsura, Y.; Usui, T.; Nakao, H.; Fujimoto, S. Changes in gut hormone levels and negative energy balance during aerobic exercise in obese young males. J. Endocrinol. 2009, 201, 151–159. [Google Scholar] [CrossRef] [PubMed]
- Goran, M.I.; Poehlman, E.T. Endurance training does not enhance total energy expenditure in healthy elderly persons. Am. J. Physiol. 1992, 263, E950–E957. [Google Scholar] [PubMed]
- Morio, B.; Montaurier, C.; Pickering, G.; Ritz, P.; Fellmann, N.; Coudert, J.; Beaufrère, B.; Vermorel, M. Effects of 14 weeks of progressive endurance training on energy expenditure in elderly people. Br. J. Nutr. 1998, 80, 511–519. [Google Scholar] [PubMed]
- Meijer, E.P.; Westerterp, K.R.; Verstappen, F.T. Effect of exercise training on total daily physical activity in elderly humans. Eur. J. Appl. Physiol. Occup. Physiol. 1999, 80, 16–21. [Google Scholar] [CrossRef] [PubMed]
- Melanson, E.L.; Keadle, S.K.; Donnelly, J.E.; Braun, B.; King, N.A. Resistance to Exercise-Induced Weight Loss: Compensatory Behavioral Adaptations. Med. Sci. Sports Exerc. 2013, 45, 1600–1609. [Google Scholar] [CrossRef] [PubMed]
- Jakicic, J.M.; Marcus, B.H.; Gallagher, K.I.; Napolitano, M.; Lang, W. Effect of exercise duration and intensity on weight loss in overweight, sedentary women: A randomized trial. JAMA 2003, 290, 1323–1330. [Google Scholar] [CrossRef] [PubMed]
- Church, T.S.; Martin, C.K.; Thompson, A.M.; Earnest, C.P.; Mikus, C.R.; Blair, S.N. Changes in weight, waist circumference and compensatory responses with different doses of exercise among sedentary, overweight postmenopausal women. PLoS ONE 2009, 4, e4515. [Google Scholar] [CrossRef] [PubMed]
- Grediagin, A.; Cody, M.; Rupp, J.; Benardot, D.; Shern, R. Exercise intensity does not effect body composition change in untrained, moderately overfat women. J. Am. Diet. Assoc. 1995, 95, 661–665. [Google Scholar] [CrossRef] [PubMed]
- Mougios, V.; Kazaki, M.; Christoulas, K.; Ziogas, G.; Petridou, A. Does the intensity of an exercise programme modulate body composition changes? Int. J. Sports Med. 2006, 27, 178–181. [Google Scholar] [CrossRef] [PubMed]
- Ross, R.; Janssen, I. Physical activity, total and regional obesity: Dose-response considerations. Med. Sci. Sports Exerc. 2001, 33 (Suppl. 6), S521–S527, discussion S528–S529. [Google Scholar]
- Hall, K.D. What is the required energy deficit per unit weight loss? Int. J. Obes. (Lond.) 2008, 32, 573–576. [Google Scholar] [CrossRef]
- Thompson, P.D.; Arena, R.; Riebe, D.; Pescatello, L.S. American College of Sports M. ACSM’s new preparticipation health screening recommendations from ACSM’s guidelines for exercise testing and prescription, ninth edition. Curr. Sports Med. Rep. 2013, 12, 215–217. [Google Scholar] [CrossRef] [PubMed]
- Kutner, M.H.; Nachtsheim, C.J.; Neter, J.; Li, W. Applied Linear Statistical Models, 5th ed.; McGraw Hill: Boston, MA, USA, 2004. [Google Scholar]
- Abe, T.; Kawakami, Y.; Sugita, M.; Fukunaga, T. Relationship between training frequency and subcutaneous and visceral fat in women. Med. Sci. Sports Exerc. 1997, 29, 1549–1553. [Google Scholar] [CrossRef] [PubMed]
- Blaney, J.; Sothmann, M.; Raff, H.; Hart, B.; Horn, T. Impact of exercise training on plasma adrenocorticotropin response to a well-learned vigilance task. Psychoneuroendocrinology 1990, 15, 453–462. [Google Scholar] [CrossRef] [PubMed]
- Brandon, L.J.; Elliott-Lloyd, M.B. Walking, body composition, and blood pressure dose-response in African American and white women. Ethn. Dis. 2006, 16, 675–681. [Google Scholar] [PubMed]
- Carter, S.L.; Rennie, C.D.; Hamilton, S.J.; Tarnopolsky, M.A. Changes in skeletal muscle in males and females following endurance training. Can. J. Physiol. Pharmacol. 2001, 79, 386–392. [Google Scholar] [CrossRef] [PubMed]
- Cowan, M.M.; Gregory, L.W. Responses of pre- and post-menopausal females to aerobic conditioning. Med. Sci. Sports Exerc. 1985, 17, 138–143. [Google Scholar] [CrossRef] [PubMed]
- Cramer, S.R.; Nieman, D.C.; Lee, J.W. The effects of moderate exercise training on psychological well-being and mood state in women. J. Psychosom. Res. 1991, 35, 437–449. [Google Scholar] [CrossRef] [PubMed]
- Despres, J.P.; Pouliot, M.C.; Moorjani, S.; Nadeau, A.; Tremblay, A.; Lupien, P.J.; Thériault, G.; Bouchard, C. Loss of abdominal fat and metabolic response to exercise training in obese women. Am. J. Physiol. 1991, 261, E159–E167. [Google Scholar] [PubMed]
- Donnelly, J.E.; Jacobsen, D.J.; Heelan, K.S.; Seip, R.; Smith, S. The effects of 18 months of intermittent vs. continuous exercise on aerobic capacity, body weight and composition, and metabolic fitness in previously sedentary, moderately obese females. Int. J. Obes. Relat. Metab. Disord. 2000, 24, 566–572. [Google Scholar] [CrossRef] [PubMed]
- Donnelly, J.E.; Honas, J.J.; Smith, B.K.; Mayo, M.S.; Gibson, C.A.; Sullivan, D.K.; Lee, J.; Herrmann, S.D.; Lambourne, K.; Washburn, R.A. Aerobic exercise alone results in clinically significant weight loss for men and women: Midwest exercise trial 2. Obesity (Silver Spring) 2013, 21, E219–E228. [Google Scholar] [CrossRef]
- Dowdy, D.B.; Cureton, K.J.; Duval, H.P.; Ouzts, H.G. Effects of Aerobic Dance on Physical Work Capacity, Cardiovascular Function and Body Composition of Middle-Aged Women. Res. Q. Exerc. Sport 1985, 56, 227–233. [Google Scholar] [CrossRef]
- Earnest, C.P.; Lupo, M.; Thibodaux, J.; Hollier, C.; Butitta, B.; Lejeune, E.; Johannsen, N.M.; Gibala, M.J.; Church, T.S. Interval training in men at risk for insulin resistance. Int. J. Sports Med. 2013, 34, 355–363. [Google Scholar] [PubMed]
- De Glisezinski, I.; Moro, C.; Pillard, F.; Marion-Latard, F.; Harant, I.; Meste, M.; Berlan, M.; Crampes, F.; Rivière, D. Aerobic training improves exercise-induced lipolysis in SCAT and lipid utilization in overweight men. Am. J. Physiol. Endocrinol. Metab. 2003, 285, E984–E990. [Google Scholar]
- Glowacki, S.P.; Martin, S.E.; Maurer, A.; Baek, W.; Green, J.S.; Crouse, S.F. Effects of resistance, endurance, and concurrent exercise on training outcomes in men. Med. Sci. Sports Exerc. 2004, 36, 2119–2127. [Google Scholar] [CrossRef] [PubMed]
- Hardman, A.E.; Jones, P.R.; Norgan, N.G.; Hudson, A. Brisk walking improves endurance fitness without changing body fatness in previously sedentary women. Eur. J. Appl. Physiol. Occup. Physiol. 1992, 65, 354–359. [Google Scholar] [CrossRef] [PubMed]
- Hinkleman, L.L.; Nieman, D.C. The effects of a walking program on body composition and serum lipids and lipoproteins in overweight women. J. Sports Med. Phys. Fit. 1993, 33, 49–58. [Google Scholar]
- Juneau, M.; Rogers, F.; De Santos, V.; Yee, M.; Evans, A.; Bohn, A.; Haskell, W.L.; Taylor, C.B.; DeBusk, R.F. Effectiveness of self-monitored, home-based, moderate-intensity exercise training in middle-aged men and women. Am. J. Cardiol. 1987, 60, 66–70. [Google Scholar] [CrossRef] [PubMed]
- Kirk, E.P.; Jacobsen, D.J.; Gibson, C.; Hill, J.O.; Donnelly, J.E. Time course for changes in aerobic capacity and body composition in overweight men and women in response to long-term exercise: The Midwest Exercise Trial (MET). Int. J. Obes. Relat. Metab. Disord. 2003, 27, 912–919. [Google Scholar] [CrossRef] [PubMed]
- Krustrup, P.; Hansen, P.R.; Randers, M.B.; Nybo, L.; Martone, D.; Andersen, L.J.; Bune, L.T.; Junge, A.; Bangsbo, J. Beneficial effects of recreational football on the cardiovascular risk profile in untrained premenopausal women. Scand. J. Med. Sci. Sports 2010, 20 (Suppl. 1), 40–49. [Google Scholar] [CrossRef] [PubMed]
- Krustrup, P.; Nielsen, J.J.; Krustrup, B.R.; Christensen, J.F.; Pedersen, H.; Randers, M.B.; Aagaard, P.; Petersen, A.M.; Nybo, L.; Bangsbo, J.; et al. Recreational soccer is an effective health-promoting activity for untrained men. Br. J. Sports Med. 2009, 43, 825–831. [Google Scholar] [CrossRef] [PubMed]
- Lee, M.G.; Sedlock, D.A.; Flynn, M.G.; Kamimori, G.H. Resting metabolic rate after endurance exercise training. Med. Sci. Sports Exerc. 2009, 41, 1444–1451. [Google Scholar] [CrossRef] [PubMed]
- Moro, C.; Pillard, F.; De Glisezinski, I.; Harant, I.; Rivière, D.; Stich, V.; Lafontan, M.; Crampes, F.; Berlan, M. Training enhances ANP lipid-mobilizing action in adipose tissue of overweight men. Med. Sci. Sports Exerc. 2005, 37, 1126–1132. [Google Scholar] [CrossRef] [PubMed]
- Nishida, Y.; Tanaka, H.; Tobina, T.; Murakami, K.; Shono, N.; Shindo, M.; Ogawa, W.; Yoshioka, M.; St-Amand, J. Regulation of muscle genes by moderate exercise. Int. J. Sports Med. 2010, 31, 656–670. [Google Scholar] [CrossRef] [PubMed]
- Nordby, P.; Auerbach, P.L.; Rosenkilde, M.; Kristiansen, L.; Thomasen, J.R.; Rygaard, L.; Groth, R.; Brandt, N.; Helge, J.W.; Richter, E.A.; et al. Endurance training per se increases metabolic health in young, moderately overweight men. Obesity (Silver Spring) 2012, 20, 2202–2212. [Google Scholar] [CrossRef]
- Nybo, L.; Sundstrup, E.; Jakobsen, M.D.; Mohr, M.; Hornstrup, T.; Simonsen, L.; Bülow, J.; Randers, M.B.; Nielsen, J.J.; Aagaard, P.; et al. High-intensity training versus traditional exercise interventions for promoting health. Med. Sci. Sports Exerc. 2010, 42, 1951–1958. [Google Scholar] [CrossRef] [PubMed]
- Polak, J.; Klimcakova, E.; Moro, C.; Viguerie, N.; Berlan, M.; Hejnova, J.; Richterova, B.; Kraus, I.; Langin, D.; Stich, V. Effect of aerobic training on plasma levels and subcutaneous abdominal adipose tissue gene expression of adiponectin, leptin, interleukin 6, and tumor necrosis factor alpha in obese women. Metabolism 2006, 55, 1375–1381. [Google Scholar] [CrossRef] [PubMed]
- Ruby, B.; Robergs, R.; Leadbetter, G.; Mermier, C.; Chick, T.; Stark, D. Cross-training between cycling and running in untrained females. J. Sports Med. Phys. Fit. 1996, 36, 246–254. [Google Scholar]
- Santiago, M.C.; Leon, A.S.; Serfass, R.C. Failure of 40 weeks of brisk walking to alter blood lipids in normolipemic women. Can. J. Appl. Physiol. 1995, 20, 417–428. [Google Scholar] [CrossRef] [PubMed]
- Sedlock, D.A.; Lee, M.G.; Flynn, M.G.; Park, K.S.; Kamimori, G.H. Excess postexercise oxygen consumption after aerobic exercise training. Int. J. Sport Nutr. Exerc. Metab. 2010, 20, 336–349. [Google Scholar] [PubMed]
- Sijie, T.; Hainai, Y.; Fengying, Y.; Jianxiong, W. High intensity interval exercise training in overweight young women. J. Sports Med. Phys. Fit. 2012, 52, 255–262. [Google Scholar]
- Snyder, K.A.; Donnelly, J.E.; Jabobsen, D.J.; Hertner, G.; Jakicic, J.M. The effects of long-term, moderate intensity, intermittent exercise on aerobic capacity, body composition, blood lipids, insulin and glucose in overweight females. Int. J. Obes. Relat. Metab. Disord. 1997, 21, 1180–1189. [Google Scholar] [CrossRef] [PubMed]
- Suter, E.; Hoppeler, H.; Claassen, H.; Billeter, R.; Aebi, U.; Horber, F.; Jaeger, P.; Marti, B. Ultrastructural modification of human skeletal muscle tissue with 6-month moderate-intensity exercise training. Int. J. Sports Med. 1995, 16, 160–166. [Google Scholar] [CrossRef] [PubMed]
- Tan, S.; Wang, X.; Wang, J. Effects of supervised exercise training at the intensity of maximal fat oxidation in overweight young women. J. Exerc. Sci. Fit. 2012, 10, 64–69. [Google Scholar] [CrossRef]
- Trapp, E.G.; Chisholm, D.J.; Freund, J.; Boutcher, S.H. The effects of high-intensity intermittent exercise training on fat loss and fasting insulin levels of young women. Int. J. Obes. (Lond.) 2008, 32, 684–691. [Google Scholar] [CrossRef]
- Van Aggel-Leijssen, D.P.; Saris, W.H.; Wagenmakers, A.J.; Senden, J.M.; van Baak, M.A. Effect of exercise training at different intensities on fat metabolism of obese men. J. Appl. Physiol. 2002, 92, 1300–1309. [Google Scholar]
- Van Aggel-Leijssen, D.P.; Saris, W.H.; Wagenmakers, A.J.; Hul, G.B.; van Baak, M.A. The effect of low-intensity exercise training on fat metabolism of obese women. Obes. Res. 2001, 9, 86–96. [Google Scholar] [CrossRef] [PubMed]
- Wilmore, J.H.; Davis, J.A.; O’Brien, R.S.; Vodak, P.A.; Walder, G.R.; Amsterdam, E.A. Physiological alterations consequent to 20-week conditioning programs of bicycling, tennis, and jogging. Med. Sci. Sports Exerc. 1980, 12, 1–8. [Google Scholar] [CrossRef] [PubMed]
- Colley, R.C.; Hills, A.P.; King, N.A.; Byrne, N.M. Exercise-induced energy expenditure: Implications for exercise prescription and obesity. Patient Educ. Couns. 2009, 79, 327–332. [Google Scholar] [CrossRef]
- Poehlman, E.T.; Arciero, P.J.; Goran, M.I. Endurance exercise in aging humans: Effects on energy metabolism. Exerc. Sport Sci. Rev. 1994, 22, 251–284. [Google Scholar] [CrossRef] [PubMed]
- Di Blasio, A.; Ripari, P.; Bucci, I.; Di Donato, F.; Izzicupo, P.; D’Angelo, E.; Di Nenno, B.; Taglieri, M.; Napolitano, G. Walking training in postmenopause: Effects on both spontaneous physical activity and training-induced body adaptations. Menopause 2012, 19, 23–32. [Google Scholar]
- Manthou, E.; Gill, J.M.; Wright, A.; Malkova, D. Behavioral compensatory adjustments to exercise training in overweight women. Med. Sci. Sports Exerc. 2010, 42, 1121–1128. [Google Scholar] [CrossRef] [PubMed]
- Stubbs, R.J.; Sepp, A.; Hughes, D.A.; Johnstone, A.M.; Horgan, G.W.; King, N.; Blundell, J. The effect of graded levels of exercise on energy intake and balance in free-living men, consuming their normal diet. Eur. J. Clin. Nutr. 2002, 56, 129–140. [Google Scholar] [CrossRef] [PubMed]
- Stubbs, R.J.; Hughes, D.A.; Johnstone, A.M.; Horgan, G.W.; King, N.; Blundell, J.E. A decrease in physical activity affects appetite, energy, and nutrient balance in lean men feeding ad libitum. Am. J. Clin. Nutr. 2004, 79, 62–69. [Google Scholar] [PubMed]
- Whybrow, S.; Hughes, D.A.; Ritz, P.; Johnstone, A.M.; Horgan, G.W.; King, N.; Blundell, J.E.; Stubbs, R.J. The effect of an incremental increase in exercise on appetite, eating behaviour and energy balance in lean men and women feeding ad libitum. Br. J. Nutr. 2008, 100, 1109–1115. [Google Scholar] [CrossRef] [PubMed]
- Donnelly, J.E.; Hill, J.O.; Jacobsen, D.J.; Potteiger, J.; Sullivan, D.K.; Johnson, S.L.; Heelan, K.; Hise, M.; Fennessey, P.V.; Sonko, B.; et al. Effects of a 16-month randomized controlled exercise trial on body weight and composition in young, overweight men and women: The Midwest Exercise Trial. Arch. Intern. Med. 2003, 163, 1343–1350. [Google Scholar] [CrossRef] [PubMed]
- Slentz, C.A.; Duscha, B.D.; Johnson, J.L.; Ketchum, K.; Aiken, L.B.; Samsa, G.P.; Houmard, J.A.; Bales, C.W.; Kraus, W.E. Effects of the amount of exercise on body weight, body composition, and measures of central obesity: STRRIDE—A randomized controlled study. Arch. Intern. Med. 2004, 164, 31–39. [Google Scholar] [CrossRef] [PubMed]
- Messier, V.; Hayek, J.; Karelis, A.D.; Messier, L.; Doucet, E.; Prud’homme, D.; Rabasa-Lhoret, R.; Strychar, I. Anthropometric, metabolic, psychosocial and dietary factors associated with dropout in overweight and obese postmenopausal women engaged in a 6-month weight loss programme: A MONET study. Br. J. Nutr. 2010, 103, 1230–1235. [Google Scholar] [PubMed]
© 2015 by the authors; licensee MDPI, Basel, Switzerland. This article is an open access article distributed under the terms and conditions of the Creative Commons Attribution license (http://creativecommons.org/licenses/by/4.0/).
Share and Cite
Riou, M.-È.; Jomphe-Tremblay, S.; Lamothe, G.; Stacey, D.; Szczotka, A.; Doucet, É. Predictors of Energy Compensation during Exercise Interventions: A Systematic Review. Nutrients 2015, 7, 3677-3704. https://doi.org/10.3390/nu7053677
Riou M-È, Jomphe-Tremblay S, Lamothe G, Stacey D, Szczotka A, Doucet É. Predictors of Energy Compensation during Exercise Interventions: A Systematic Review. Nutrients. 2015; 7(5):3677-3704. https://doi.org/10.3390/nu7053677
Chicago/Turabian StyleRiou, Marie-Ève, Simon Jomphe-Tremblay, Gilles Lamothe, Dawn Stacey, Agnieszka Szczotka, and Éric Doucet. 2015. "Predictors of Energy Compensation during Exercise Interventions: A Systematic Review" Nutrients 7, no. 5: 3677-3704. https://doi.org/10.3390/nu7053677