Article

Association between Low Dietary Protein Intake and Geriatric Nutrition Risk Index in Patients with Chronic Kidney Disease: A Retrospective Single-Center Cohort Study

1
Department of Nephrology, Omori Medical Center, School of Medicine, Toho University, Tokyo 143-8541, Japan
2
Department of Nephrology, Sakura Medical Center, School of Medicine, Toho University, 564-1, Shimoshizu, Sakura, Chiba 285-8741, Japan
3
Division of Nephrology, Ichiyokai Harada Hospital, Hiroshima 731-5134, Japan
4
Department of Nutrition, Omori Medical Center, Toho University, Tokyo 143-8541, Japan
*
Author to whom correspondence should be addressed.
Nutrients 2016, 8(10), 662; https://doi.org/10.3390/nu8100662
Submission received: 31 August 2016 / Revised: 7 October 2016 / Accepted: 14 October 2016 / Published: 23 October 2016
(This article belongs to the Special Issue Nutrition and Chronic Kidney Disease)

Abstract

:
Reduced dietary protein intake in malnourished patients with chronic kidney disease (CKD) may be associated with adverse clinical outcomes, which may mask any efficacy of a low-protein diet. The study included 126 patients with CKD who attended a dedicated dietary counseling clinic in 2005–2009 and were systematically followed until January 2015. Of these patients, 20 (15.9%) had moderate or severe nutrition-related risk of geriatric nutritional risk index (GNRI) < 92; these patients were more likely to be older, have a greater proteinuria, and have lower body mass index and serum albumin concentration. Dietary protein intake was significantly lower in older patients (r = −0.33, p < 0.001) and those with lower glomerular filtration rate (r = 0.47, p < 0.001). The non-protein to nitrogen calorie ratio was independently associated with GNRI. Reduced GNRI was significantly associated with mortality (hazard ratio (HR) = 4.94; 95% confidence interval (CI) = 1.61–15.42, p = 0.012) and cardiovascular events (HR = 9.37; 95% CI = 2.49–37.34, p = 0.006), but not with adverse renal outcomes. Restricting protein intake may be harmful to patients with any nutrition-related risk, suggesting that improvement of nutritional status should be a high priority.

1. Introduction

Clinical practice guidelines for adult patients with chronic kidney disease (CKD) have recommended dietary protein intake of 0.6–0.8 g/kg body weight per day and energy intake of 30–35 kcal/kg ideal body weight per day [1,2]. However, protein restriction is only a part, though a very relevant part, of a more complex dietary management of CKD patients [3,4,5]. Phosphate intake should be reduced (700–400 mg/day), as well as sodium intake (2–3 g/day). Dietary energy intake must cover energy requirements up to 35 kcal/kg/day for patients <65 years and 30 kcal/kg/day for patients >65 years old. Qualitative aspects of foods (essential amino acid and ketoacids, calcium carbonate, vitamins, iron) are also important. These findings indicated the importance of maintaining adequate energy intake in patients on restricted dietary protein, by increasing caloric intake from carbohydrates and/or fats.
To date, many prospective cohort studies have evaluated the association between body mass index (BMI) and mortality in the Japanese population [6,7,8,9,10,11]; some showed a U-shaped or reverse J-shaped association. The lowest risk of total mortality and mortality was observed for a BMI of 21 to 27 kg/m2 in middle-aged and elderly Japanese [12]. In overview of dietary reference intakes for Japanese 2015, the target BMI was recommended as 18.5–24.9 kg/m2 in the age of ≤49, 20.0–24.9 kg/m2 in the age of 50–69, and 21.0–24.9 kg/m2 in the age of ≥70, considering the necessity to take into account both the prevention of frailty and prevention of life-style related diseases [13]. Protein-energy wasting (PEW) is common in patients with CKD and is associated with an increased risk of death [14]. Dietary protein and energy intake may be inadequate in patients with advanced CKD due to uremic anorexia, inter-current illness, systemic inflammation, and/or dietary protein restriction. A consensus statement by the International Society of Renal Nutrition and Metabolism described the advantages of oral nutritional supplements, including their efficacy, safety, and compliance. Anabolic strategies, alone or combined with nutritional supplementation, have been shown to improve protein stores and PEW [14]. However, it is difficult to replenish protein and energy stores in CKD patients, especially in older patients, on a restricted protein diet. Reduced dietary protein intake by malnourished patients may also be associated with adverse clinical outcomes, which may mask the efficacy of low-protein diets.
A multidisciplinary approach is required to reliably evaluate nutritional status. The geriatric nutritional risk index (GNRI), consisting of BMI and serum albumin concentration, is a simple tool that assesses nutrition-related risk and may indicate reduced body stores of protein and energy [15,16,17]. The ability of the GNRI to predict the risk of mortality in patients with CKD, including those with massive proteinuria, has not yet been determined.
The goals of the present study were: (1) to evaluate the associations among aging, kidney function, and dietary intake in patients with CKD; (2) to determine the associations of GNRI with body composition, mortality, cardiovascular events, and adverse renal outcomes in these patients; and (3) to determine the association between dietary intake and GNRI in patients with CKD.

2. Materials and Methods

2.1. Study Design

This study was approved by the Ethics Committee of Toho University Omori Medical Center, Tokyo, Japan (approval number: 25-252) and adhered to the principles of the Declaration of Helsinki. Informed consent was obtained from all study participants.
Between 2005 and 2009, 175 patients with CKD aged ≥20 years attended a dedicated dietary counseling clinic, consisting of a nephrologist and two registered dietitians in our department. At the clinic, patients were advised to consume the recommended 0.6–0.8 g protein per kg ideal body weight per day and a total of 30–35 kcal total energy per kg ideal body weight per day. Patients were followed-up approximately once every 1–2 months. Daily nutrient intake, estimated from 24-h dietary recall, and analysis using standard food composition tables was assessed in 126 of these patients (a median age (10th–90th percentile) of 67 years old (37–81 years old)). The median period between the first visit to the dietary clinic and the day of assessment of their dietary records was 1552 days (10th–90th percentile, 256–3330 days). A retrospective review of their medical charts identified 126 patients with complete clinical data, including anthropometric measurements, blood pressure, proteinuria, kidney function, and dietary intake of sodium, protein, and energy at the time of dietary nutrient assessment. Patients have been monitored until death, loss to follow-up, or January 2015, for a median 64 months (10th–90th percentile, 14–96 months).
Patient characteristics were recorded, including age, sex, height, body weight, BMI, body composition, underlying renal disease, and blood pressure. Serum concentrations of albumin, calcium, phosphorus, total cholesterol, triglycerides, fasting blood glucose, uric acid, C-reactive protein and creatinine (Cr) were measured, as were hemoglobin levels, estimated glomerular filtration rate (eGFR), urinary protein to creatinine ratio (UPCR) in random urine samples, and urea nitrogen appearance (UNA) estimated from 24 h urine collection tests. Age-specific underweight was defined as <18.5 kg/m2 in the age of ≤49, <20.0 kg/m2 in the age of 50–69, or <21.5 kg/m2 in the age of ≥70 for three age categories of adults, according to comprehensive investigation of BMI ranges with the lowest all-cause mortality reported in epidemiological observational studies and actual BMI of Japanese people [12]. Resistant hypertension was defined as uncontrolled blood pressure (office systolic blood pressure ≥130 mmHg or office diastolic blood pressure ≥80 mmHg) despite antihypertensive therapy using three or more medications, including diuretics. Controlled blood pressure using four or more drugs was also considered resistant hypertension [18,19]. Hyperuricemia was defined as uric acid concentrations >7.0 mg/dL in men and >5.7 mg/dL in women [20]. eGFR was calculated according to the revised formula for Japanese patients, as 194 × creatinine − 1.094 × age − 0.287 (×0.739 for women), according to the Modification of Diet in Renal Disease (MDRD) method [21]. Basal energy expenditure (BEE) was calculated using the Harris–Benedict equation as (66.47 + 13.75 × body weight (kg) + 5.0 × height (cm) − 6.76 × age (years)) in men and (655.1 + 9.56 × body weight (kg) + 1.85 × height (cm) − 4.68 × age (years)) in women [22]. GNRI was calculated as (14.89 + albumin (g/dL)) + (41.7 × body weight/ideal body weight). The ideal body weight was calculated using height and an idealized BMI of 22 kg/m2 [15,17]. Clinical characteristics and adverse clinical outcomes were compared in groups with GNRI < 92 (defined as moderate or severe nutrition-related risk) and ≥92 (defined as low or no nutrition-related risk) [23,24,25].

2.2. Assessment of Body Composition

Bioimpedance analysis (BIA) was performed at the time of dietary nutrient assessment in a standard manner with the patient lying supine on a flat, nonconductive bed for at least 15 min. A segmental BIA instrument (Inbody S20®; Biospace Co., Ltd., Seoul, Korea) with eight tactile electrodes used. The microprocessor-controlled switches and BIA analyzer were activated, and segmental resistances of the arms, trunk, and legs were measured at four frequencies (5, 50, 250, and 500 kHz), for a total of 20 segmental resistances per patient. Using the BIA software, the sum of the segmental resistances for each body segment was used to calculate total body water (TBW), intracellular water (ICW), and extracellular water (ECW) [26]. Body composition was separated into three components: (a) water-free mass, consisting of proteins, fats, and minerals; (b) ICW content; and (c) ECW content. Each measured fluid compartment was expressed as both the actual value and the percentage of body weight. The phase angle was calculated by using the sum of impedance and reactance of the right arm, trunk, and right leg and based on the following equation: Phage angle (°) = (Reactance/Resistance) × (180°/Π) [27].

2.3. Endpoints

The endpoint of the study was the time to the first recorded adverse event. Cox proportional hazard models were used to compare adverse renal outcomes, cardiovascular events, and all-cause mortality. Adverse renal outcomes were defined as a ≥50% decline in eGFR relative to baseline, initiation of dialysis therapy or renal transplantation [28,29]. Cardiovascular events were defined as a composite of hospital-treated myocardial infarction or coronary intervention, hospital-treated heart failure, and hospital-treated stroke.

2.4. Statistical Analyses

The measured values were expressed as the means ± standard deviations and percentages. Continuous variables in the low and high GNRI groups were compared using a linear regression model, whereas categorical variables were compared using Pearson’s chi-squared tests. Correlations between variables were determined using the Pearson product-moment correlation coefficient. Logistic and linear regression analyses were used to identify associations between a GNRI < 92 and demographic factors. Explanatory variables that showed significant correlations (p < 0.10) with a GNRI < 92 were entered into a multivariate analysis to evaluate independent associations. The Kaplan–Meier method was used to evaluate survival outcomes. Nutrition-related risk of a GNRI < 92 was tested in the Cox model to identify the association of the investigated outcomes, with the results expressed as hazard ratios (HRs) and 95% confidence intervals (CIs). A graphical approach (log–log plots) was used to assess the proportionality of HRs. Continuous variables were divided into two groups by the median value. All variables in HR were estimated satisfied this assumption. A probability (p) value < 0.05 was considered statistically significant. All statistical analyses were performed using JMP 12.0 statistical software (SAS Institute, Inc., Cary, NC, USA).

3. Results

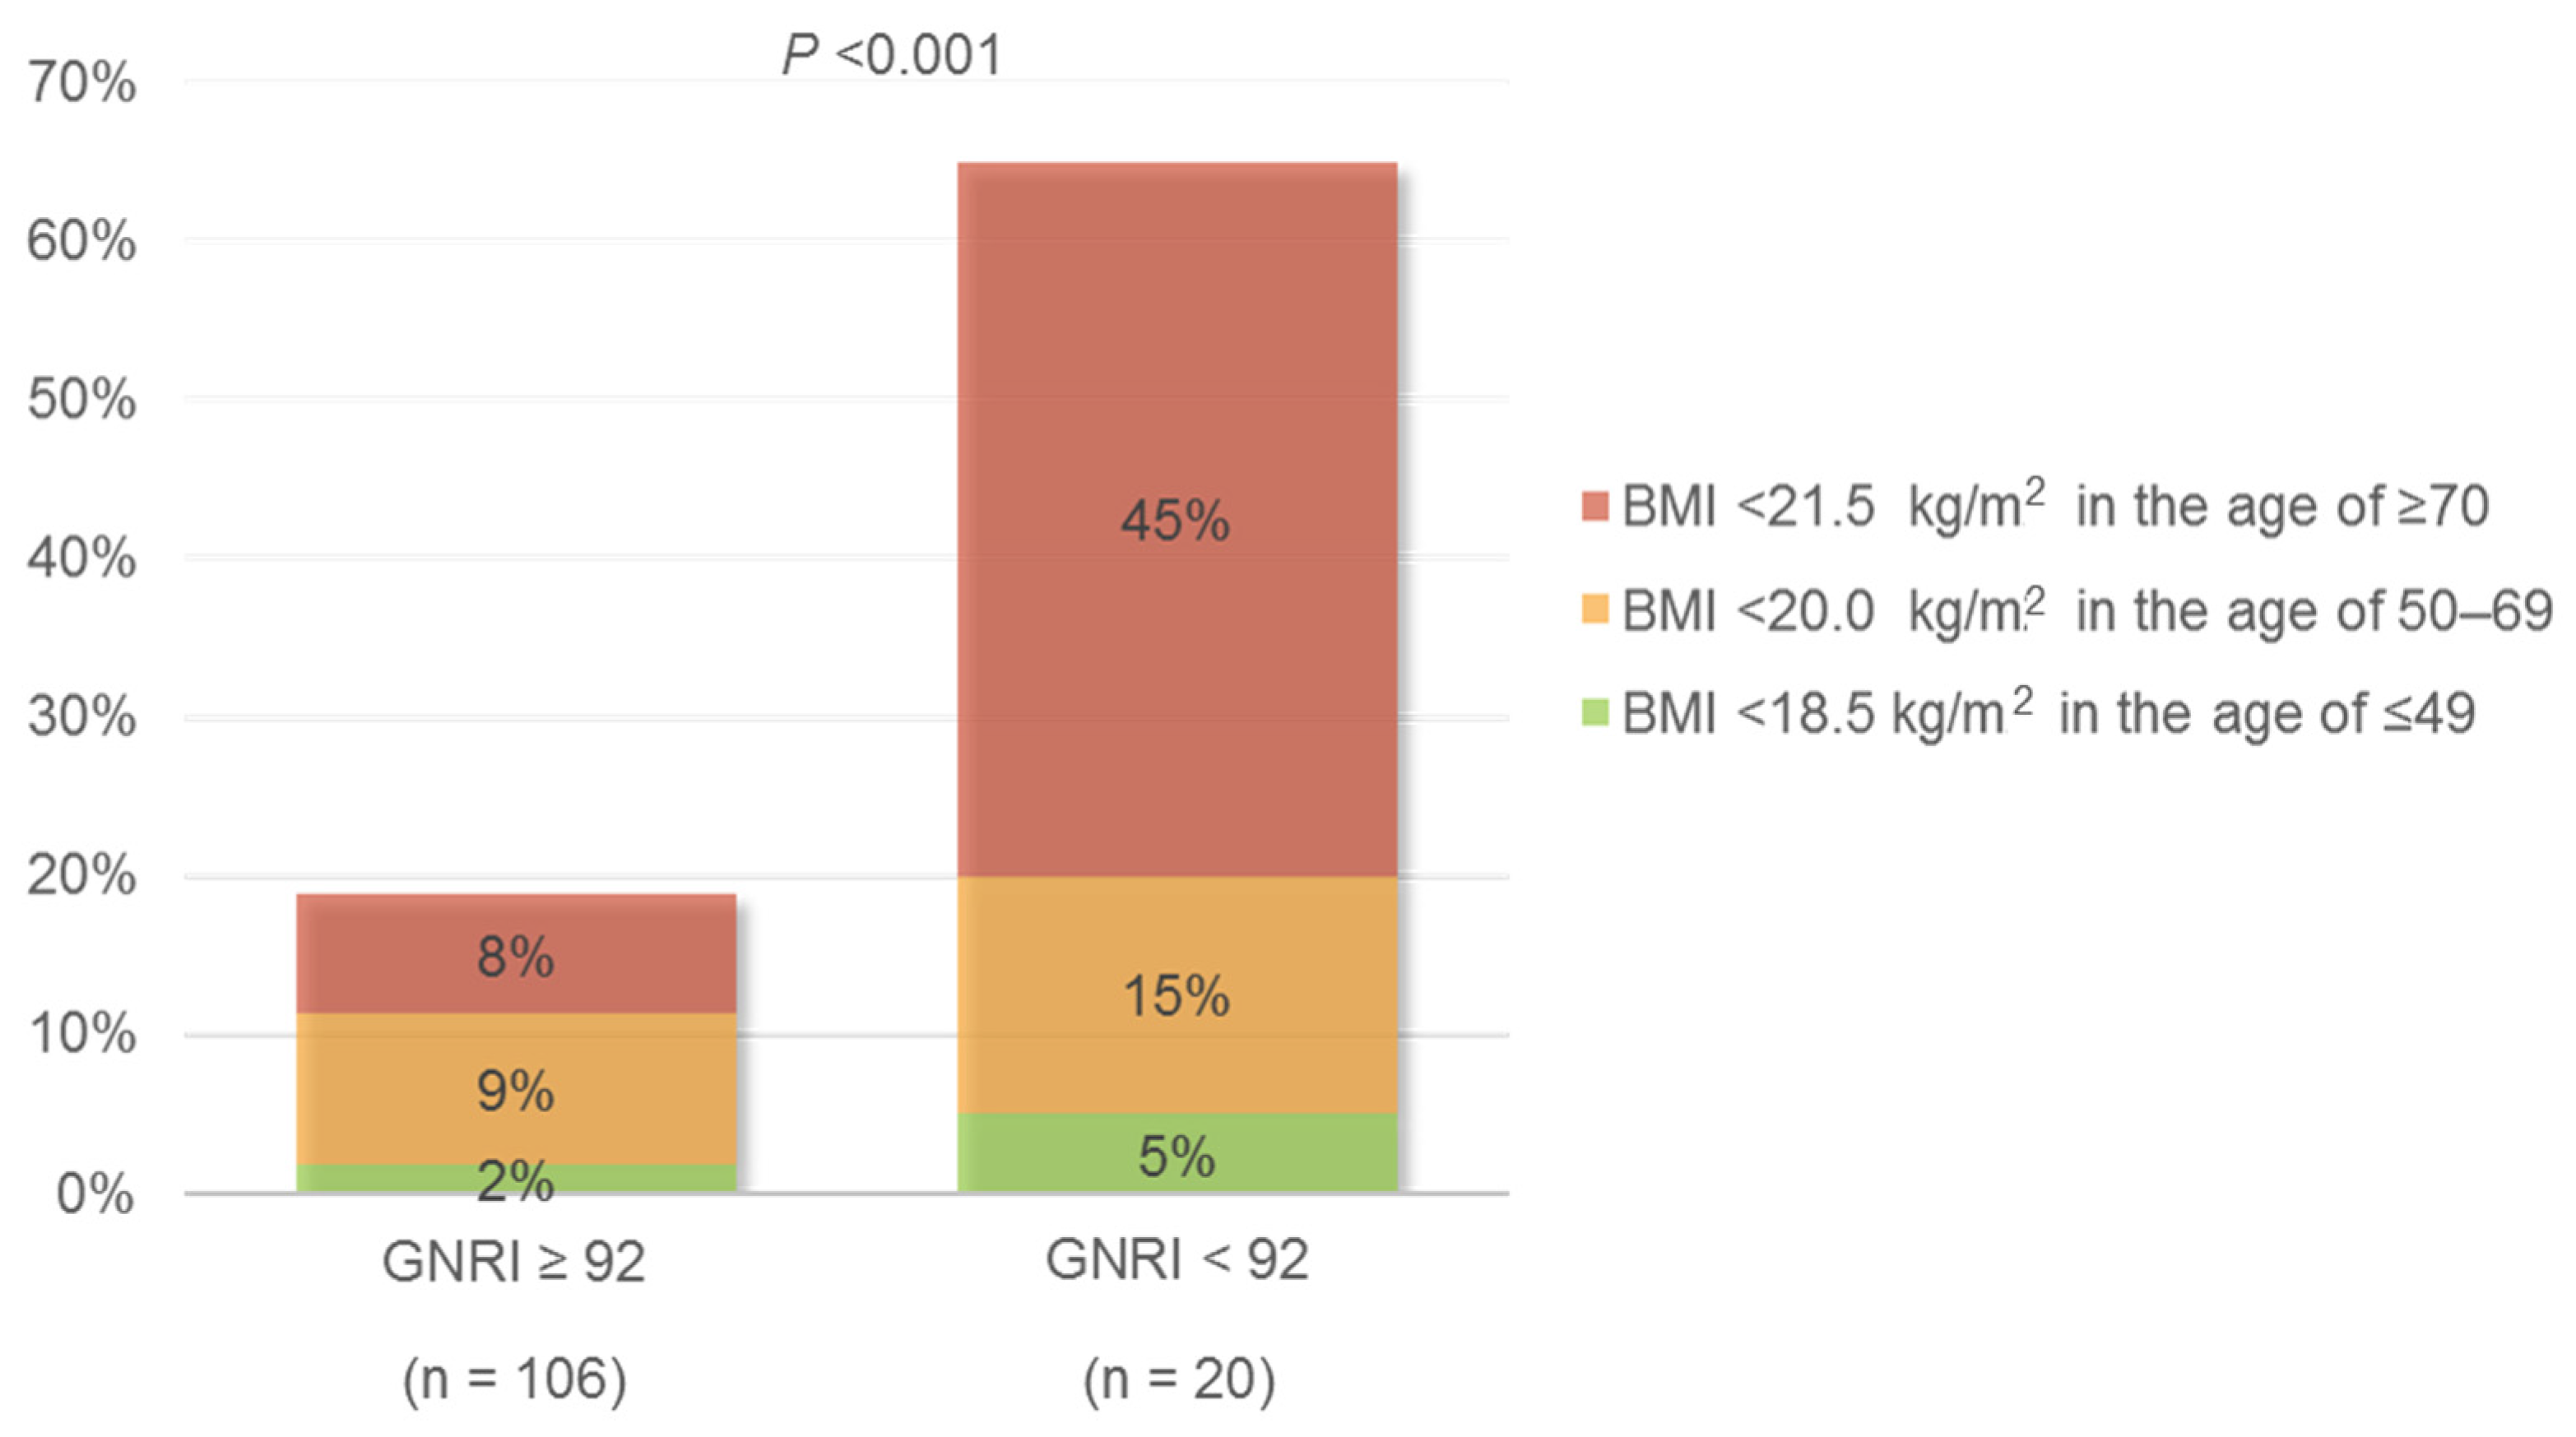
3.1. Patient Characteristics at the Time of Dietary Nutrient Assessment

Table 1 shows the characteristics of the study population at the time of dietary nutrient assessment. Of the 126 patients, 20 (15.9%) had a GNRI < 92 and 106 (84.1%) had a GNRI ≥ 92. Patients with low GNRI were significantly older (69.7 ± 14.3 vs. 62.1 ± 16.3 years, p = 0.043) and had lower hemoglobin concentrations, and greater proteinuria (1.8 ± 2.1 vs. 0.8 ± 1.3 g/g Cr, p = 0.045) than patients with high GNRI. Patients in the low GNRI group also had significantly lower BMI (19.6 ± 2.1 vs. 23.3 ± 3.8 kg/m2, p < 0.001) and serum albumin concentrations (3.3 ± 0.4 vs. 4.0 ± 0.4 kg/m2, p < 0.001). Age-specific underweight, especially BMI < 21.5 kg/m2 in the age of ≥70, was more likely to be observed in the low GNRI group (65% vs. 19%, p < 0.001) (Figure 1). Assessments of body composition in the two groups showed that phase angle (5.1° ± 0.9° vs. 4.4° ± 0.6°, p < 0.001) and all three components, water-free mass (20.0 ± 4.2 vs. 28.1 ± 7.9 kg, p < 0.001), ICW content (16.5 ± 2.5 vs. 19.3 ± 4.3 L, p < 0.001), and ECW content (11.1 ± 1.7 vs. 12.4 ± 2.7 L, p < 0.01), were significantly lower in the low, than in the high, GNRI group (Supplementary Materials Table S1; Figure 2).
Patients with both low protein intake and inadequate calorie intake tended to be older and have lower GFR levels than patients with higher protein intake (Supplementary Materials Table S2).

3.2. Dietary Intake of Sodium, Protein, and Energy at the Time of Dietary Nutrient Assessment

Table 2 shows the dietary intake of sodium, protein, and energy in patients with a GNRI < 92 and ≥ 92. Both protein intake (41 ± 15 vs. 47 ± 15 g, p = 0.09) and calorie intake (1763 ± 129 vs. 1819 ± 189, p = 0.11) tended to be lower in the low, than in the high, GNRI group, but the differences were not statistically significant. The average non-protein calorie to nitrogen (NPC/N) ratio was significantly lower in the low GNRI group than in the high GNRI group (p < 0.05), due to the greater reduction in protein intake in patients in the low GNRI group. In both groups, however, the average calorie intake was 35 kcal/standard weight/day lower than the target level.

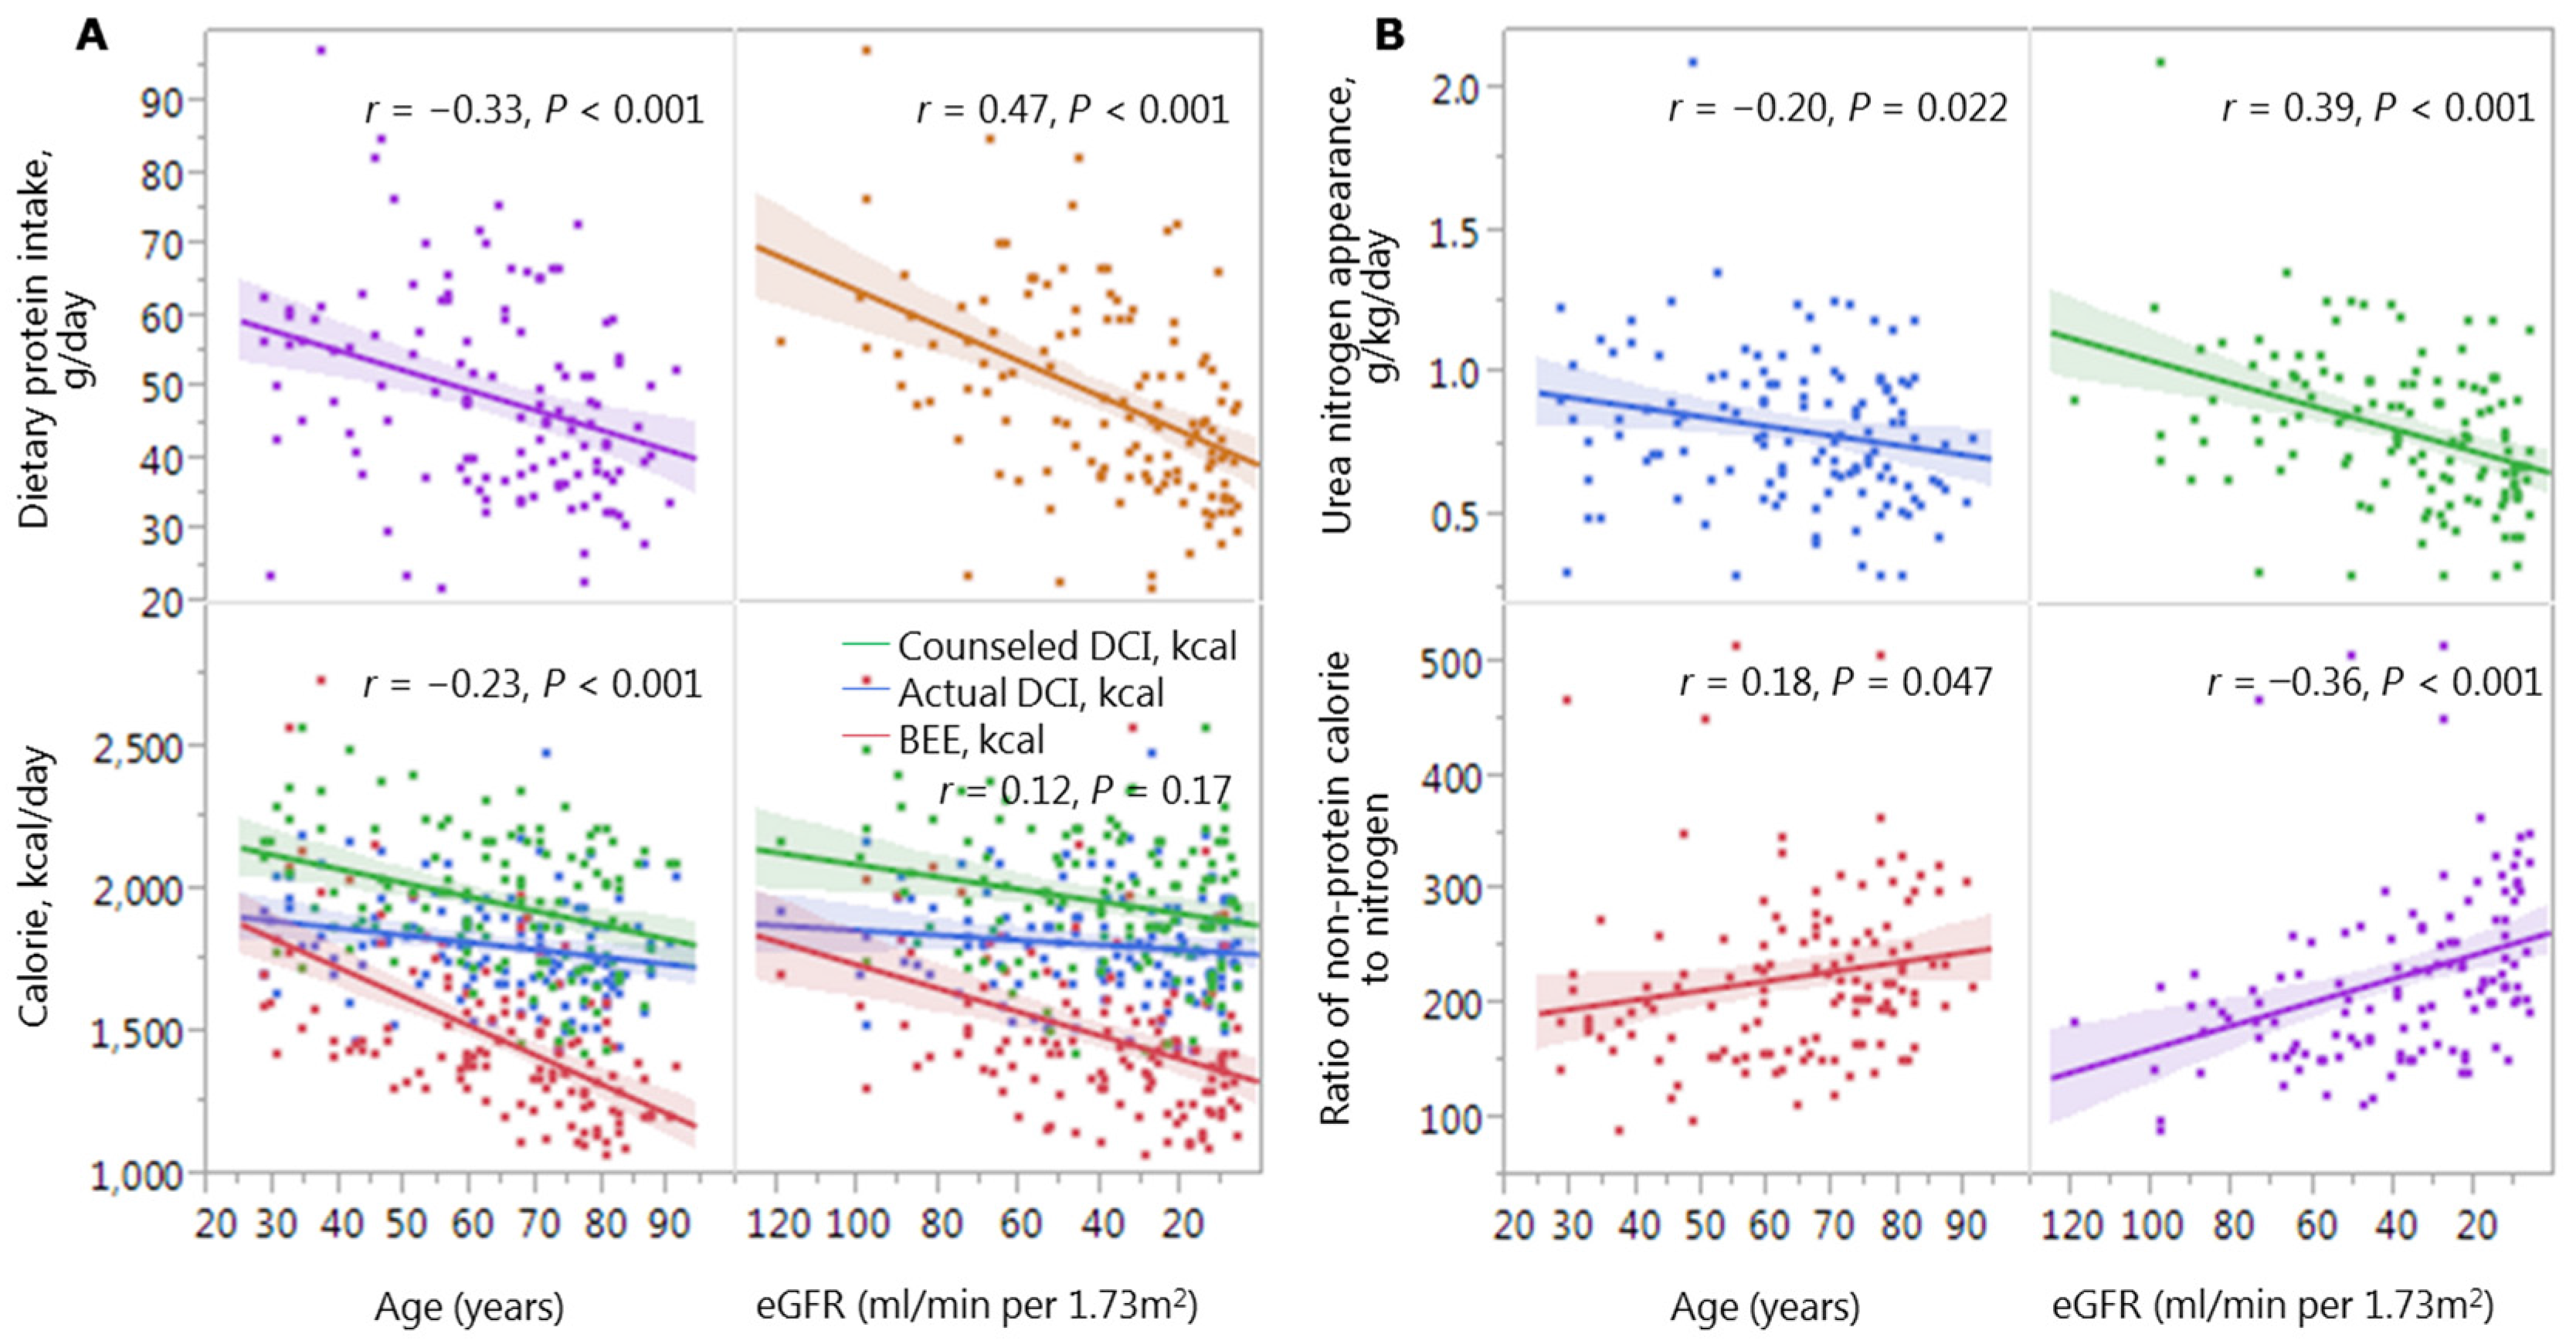
3.3. Associations of Protein and Calorie Intake with Age and Kidney Function

Dietary protein intake was significant lower at older ages (r = −0.33, p < 0.001) and lower GFRs (r = 0.47, p < 0.001). In addition, calorie intake tended to be lower at older ages (r = −0.23, p < 0.05) (Figure 3A). Although the actual calorie intake was above the BEE, it remained below the counseled intake. Notably, the downward slopes in protein intake at older ages and lower GFRs were steeper than the slope in calorie intake. As a result, the NPC/N ratio tended to be higher at older ages (r = 0.18, p < 0.05) and lower GFRs (r = −0.36, p < 0.01) (Figure 3B).

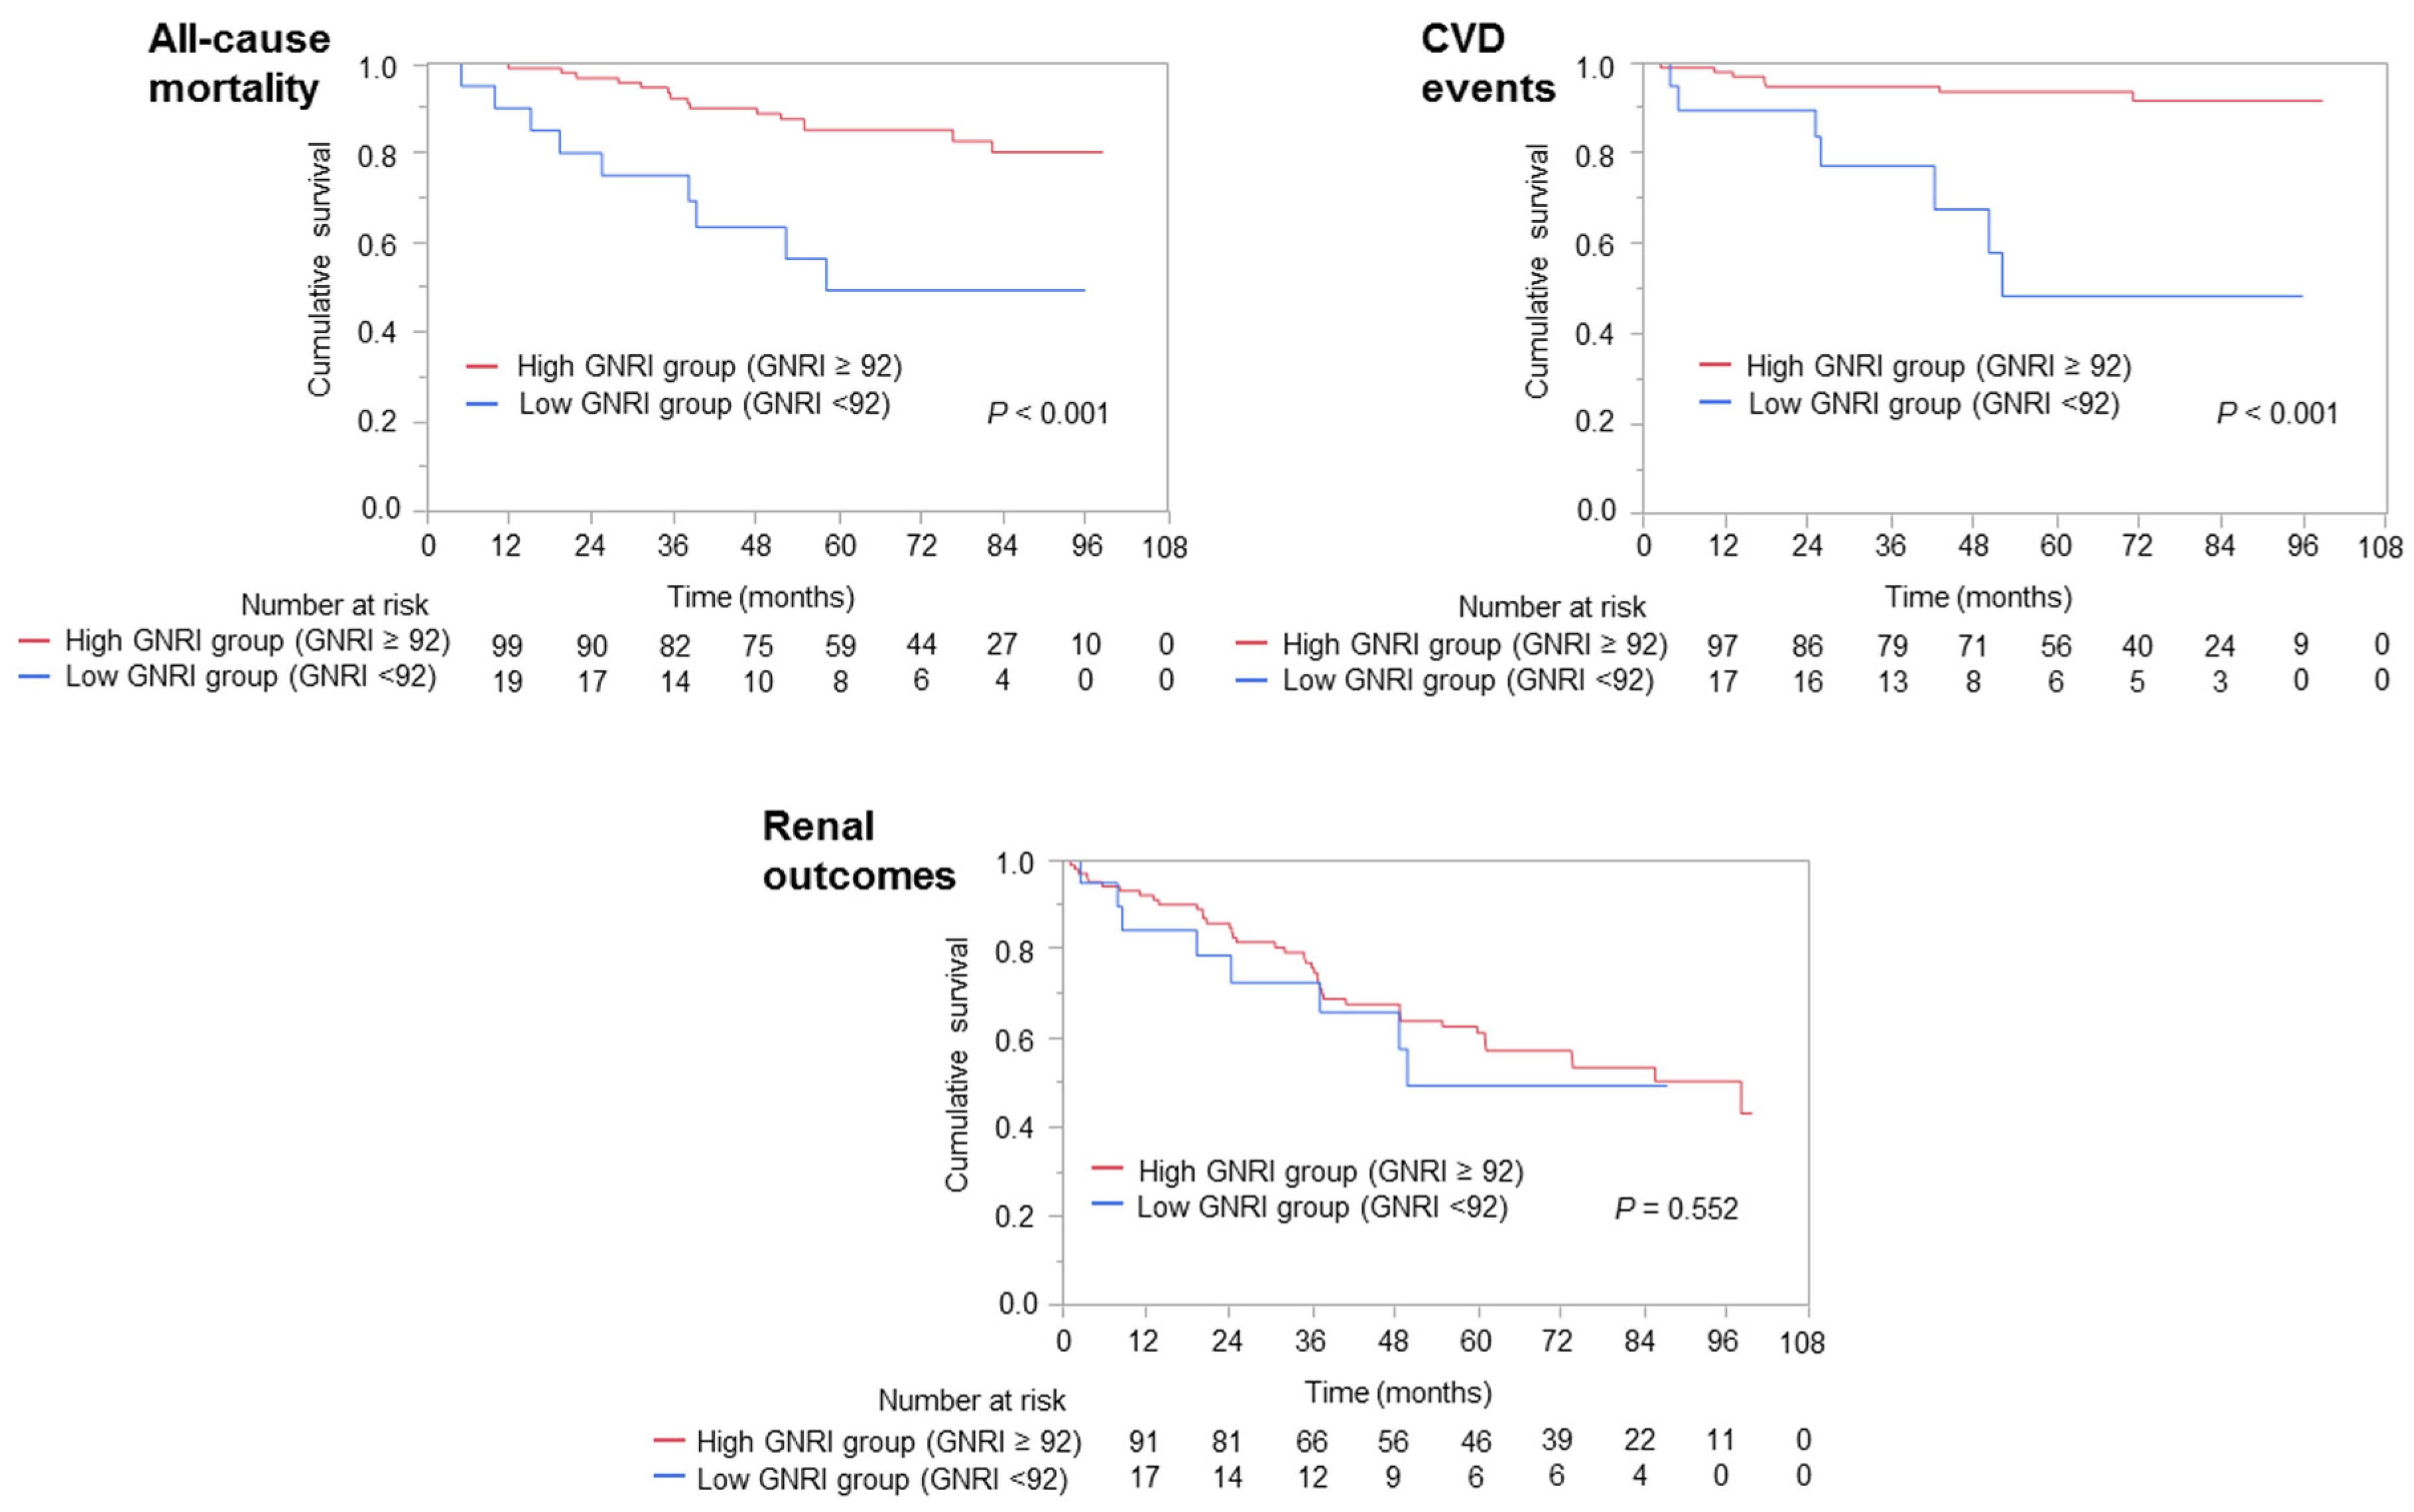
3.4. Associations of GNRI with All-Cause Mortality, Cardiovascular Events, and Adverse Renal Outcomes

During a median 5.3-year follow-up period, 24 patients died, 14 experienced cardiovascular events, and 50 had adverse renal outcomes. Kaplan–Meier analysis showed significant differences in all-cause mortality and cardiovascular events, but not in renal outcomes, between the low and high GNRI groups (Figure 4). After adjustment for covariates, including age, diabetes mellitus, resistant hypertension, UPCR levels, NPC/N ratio, and baseline eGFR, GNRI < 92 was significantly associated with all-cause mortality (HR = 4.94; 95% CI = 1.61–15.42, p = 0.006) and cardiovascular events (HR = 9.37; 95% CI = 2.49–37.34, p < 0.001) (Table 3). Mortality rate was significantly higher in the low, than in the high, GNRI group (12.2 vs. 2.3 per 100 patient-years, p < 0.001). Seven patients (35%) in the low GNRI group (9.9 per 100 patient-years) and seven (6.6%) in the high GNRI group (1.2 per 100 patient-years) experienced cardiovascular events (p < 0.001). The rates of development of the composite renal end point were similar in the low (12.6 per 100 patient-years) and high (7.1 per 100 patient-years) GNRI groups (p = 0.55).

3.5. Independent Factors Associated with GNRI < 92

Univariate analysis showed that patient age, UPCR level, hyperuricemia, and the NPC/N ratio correlated with a GNRI < 92. Following multivariate analysis, UPCR and the NPC/N ratio remained independently associated with a GNRI < 92 (Table 4).

4. Discussion

The results of this study revealed that both dietary protein and calorie intake were significantly lower at older ages and lower GFRs in patients with CKD, and that the downward slope in protein intake was steeper than the slope in calorie intake, as we might induce a behavior modification for dietary intake balance between protein and energy. Consequently, the NPC/N ratio was higher at older ages and lower GFRs. Lower intake of dietary protein and calories were found to be significantly associated with lower GNRI, which, in turn, was significantly associated with body composition, all-cause mortality, and cardiovascular disease events, but not with adverse renal outcomes.
Clinical practice guideline for patients with CKD, defined as those with eGFR < 30 mL/min/1.73 m2, have recommended reducing protein intake to 0.8 g/kg/day in adults both with and without diabetes [1,2,30]. It reported that a protein-restricted diet supplemented with ketoanalogs of essential amino acids was effective and safe in ameliorating nitrogen waste product retention, as well as in delaying the renal replacement therapy initiation, with no deleterious effect on the nutritional status in selected patients with CKD [3,4]. In contrast, patients with advanced CKD, especially those below eGFR categories 4 and 5, frequently experience spontaneous reductions in dietary protein intake [31]. Frequent involuntary weight loss has been reported in outpatients over 65 years old, with a loss of >4% of body weight being an independent predictor of increased mortality [32]. These findings suggest the need for caution in restricting dietary protein in patients with advanced CKD. To date, however, no guidelines have been formulated regarding the discontinuation of dietary protein restrictions in these patients. This study found that the combination of an elevated NPC/N ratio and low dietary protein intake was associated with moderate or severe nutrition-related risk (GNRI < 92) even in patients receiving dietary counseling. Inadequate calorie intake was observed in 35.7% of these patients (Supplementary Materials Table S2), although most achieved BEE levels. Such patients with inadequate dietary intake were not always associated with adverse outcomes (data not shown). However, moderate or severe nutrition-related risk was linked to age-specific underweight and was associated with all-cause mortality and cardiovascular events. These findings suggest that dietary protein restriction may be inappropriate for patients with GNRI < 92 and that these patients should be counseled about dietary intake adequate to replenish protein and energy stores. Otherwise, any concomitant debilitating diseases and comorbidities in these malnourished patients may reduce life expectancy prognoses even if they retain the calorie intake.
Malnutrition and inflammation often coexist. Serum albumin concentration and BMI are often used as indicators of nutritional status in clinical practice [33,34,35]. However, both are influenced by several non-nutritional factors, including proteinuria, fluid status, and inflammation [36,37,38,39]. Therefore, measuring albumin or BMI alone may be insufficient to assess nutritional risk. In contrast, GNRI can minimize the multifactorial effects of each indicator by combining serum albumin and BMI. This study found that GNRI was associated with the NPC/N ratio and proteinuria, but not C-reactive protein. Low GNRI was associated with significantly higher rates of mortality and cardiovascular events, it was not associated with adverse renal outcomes, despite the inclusion of patients with massive proteinuria. These findings suggested that GNRI may be a useful predictor of patient prognosis, even in patients with CKD. Moreover, GNRI was positively correlated with water-free mass, consisting of proteins, fat, and minerals; ICW content; and ECW content. ICW content strongly depends on age and muscle mass, since the body cell mass is composed of a hydration component. With the decrease in water-free mass and ICW content, the percentage of the ECW content in the body weight relatively increased in the low GNRI group. Body composition in patients with CKD is characterized by excess ECW content associated with sodium retention and a decreased body cell mass with malnutrition, and we speculated that cell volume might be associated with nutritional status and indicate the reserve capacity for volume overload in patients with fluid volume imbalance [40,41]. In fact, the bioimpedance phase angle, as a measure of nutritional status [42,43], was associated with GNRI levels. Hyperphosphotemia is an independent risk factor for adverse outcomes in patients with CKD [44], and serum phosphorus level depends on protein intake [5]. In this study, the phosphorus level was strongly associated with kidney function rather than protein intake and nutritional status.
This study had several limitations. First, it was a retrospective cohort study conducted at a single center, and the sample size was small. However, detailed information was available on patients’ dietary records and body fluid composition and the follow-up period was relatively long. Second, GNRI has not been established as a consensus indicator of nutritional status in patients with CKD. However, our study found that GNRI was associated with body composition and was predictive of patient prognosis. GNRI was not compared with several other nutritional screening tools, such as Subjective Global Assessment and the Mini Nutritional Assessment Screening Form. These indices, however, entail subjective assessments, which may be affected by the examiner’s experience. In contrast, GNRI is an objective assessment, easily measured in patients with CKD. Third, we did not survey comorbidities, which might be associated nutritional status and adverse outcomes. Finally, the study design made it difficult to clearly differentiate between spontaneous reductions in dietary protein intake and restrictions of dietary protein. However, low dietary protein intake should be interpreted cautiously because of the inclusion in CKD populations of patients with inadequate dietary intake, especially older patients and advanced CKD.

5. Conclusions

This study showed that low dietary protein and calorie intake by subjects at older ages and with lower GFRs were associated with GNRI. GNRI was associated with body composition, all-cause mortality, and cardiovascular disease events, but not with adverse renal outcomes. Restricting protein intake may harm patients with low GNRI, and dietary prescription should be based on nutritional status and inflammatory activities. Improving nutritional status should be a priority in treating patients with any nutrition-related risks.

Supplementary Materials

The following are available online at https://www.mdpi.com/2072-6643/8/10/662/s1, Table S1: Body fluid composition in patients with GNRI ≥ 92 and < 92 at the time of dietary nutrient assessment, Table S2: Demographic and clinical characteristics of patients who did and did not achieve recommended daily protein intake.

Acknowledgments

The authors thank Honma, a registered dietician, for individualized nutritional counseling based on body composition.

Author Contributions

A.K., R.T. and Y.O. designed the study. Y.O. contributed to sample acquisition. A.K. and Y.O. analyzed and interpreted the data. A.A. and K.S. provided scientific advice in their fields of expertise. Each author contributed important intellectual content during manuscript drafting and/or revision and accepts accountability for the overall work by ensuring that questions pertaining to the accuracy or integrity of any portion of the work are appropriately investigated and resolved.

Conflicts of Interest

The authors declare no conflict of interest.

Abbreviations

The following abbreviations are used in this manuscript:
BEEbasal energy expenditure
BIAbioimpedance analysis
BMIbody mass index
CKDchronic kidney disease
CIconfidence interval
Crserum creatinine
ECWextracellular water
eGFRestimated glomerular filtration rate
GNRIgeriatric nutritional risk index
HRhazard ratio
ICWintracellular water
MDRDModification of Diet in Renal Disease
NPC/Nnon-protein calorie to nitrogen
PEWprotein-energy wasting
TBWtotal body water
UNAurea nitrogen appearance
UPCRurinary protein-to-creatinine ratio

References

  1. Kidney Disease: Improving Global Outcomes (KDIGO) CKD Work Group. Chapter 3: Management of Progression and Complications of CKD. Kidney Int. Suppl. 2013, 3, 73–90. [Google Scholar]
  2. Cano, N.; Fiaccadori, E.; Tesinsky, P.; Toigo, G.; Druml, W.; German Society for Nutritional Medicine (DGEM); Kuhlmann, M.; Mann, H.; Horl, W.H.; European Society for Parenteral and Enteral Nutrition (ESPEN). ESPEN guidelines on enteral nutrition: Adult renal failure. Clin. Nutr. 2006, 25, 295–310. [Google Scholar] [CrossRef] [PubMed]
  3. Aparicio, M.; Bellizzi, V.; Chauveau, P.; Cupisti, A.; Ecder, T.; Fouque, D.; Garneata, L.; Lin, S.; Mitch, W.E.; Teplan, V.; et al. KETO acid therapy in predialysis chronic kidney disease patients: Final consensus. J. Ren. Nutr. 2012, 22, S22–S24. [Google Scholar] [CrossRef] [PubMed]
  4. Aparicio, M.; Bellizzi, V.; Chauveau, P.; Cupisti, A.; Ecder, T.; Fouque, D.; Garneata, L.; Lin, S.; Mitch, W.E.; Teplan, V.; et al. Protein-restricted diets plus KETO/AMINO acids—A valid therapeutic approach for chronic kidney disease patients. J. Ren. Nutr. 2012, 22, S1–S21. [Google Scholar] [CrossRef] [PubMed]
  5. Bellizzi, V.; Cupisti, A.; Locatelli, F.; Bolasco, P.; Brunori, G.; Cancarini, G.; Caria, S.; de Nicola, L.; di Iorio, B.R.; di Micco, L.; et al. Low-protein diets for chronic kidney disease patients: The Italian experience. BMC Nephrol. 2016, 17, 77. [Google Scholar] [CrossRef] [PubMed]
  6. Tamakoshi, A.; Yatsuya, H.; Lin, Y.; Tamakoshi, K.; Kondo, T.; Suzuki, S.; Yagyu, K.; Kikuchi, S.; JACC Study Group. Bmi and all-cause mortality among japanese older adults: Findings from the Japan collaborative cohort study. Obesity 2010, 18, 362–369. [Google Scholar] [CrossRef] [PubMed]
  7. Nagai, M.; Kuriyama, S.; Kakizaki, M.; Ohmori-Matsuda, K.; Sugawara, Y.; Sone, T.; Hozawa, A.; Tsuji, I. Effect of age on the association between body mass index and all-cause mortality: The Ohsaki cohort study. J. Epidemiol. 2010, 20, 398–407. [Google Scholar] [CrossRef] [PubMed]
  8. Matsuo, T.; Sairenchi, T.; Iso, H.; Irie, F.; Tanaka, K.; Fukasawa, N.; Ota, H.; Muto, T. Age- and gender-specific bmi in terms of the lowest mortality in Japanese general population. Obesity 2008, 16, 2348–2355. [Google Scholar] [CrossRef] [PubMed]
  9. Kuriyama, S.; Ohmori, K.; Miura, C.; Suzuki, Y.; Nakaya, N.; Fujita, K.; Sato, Y.; Tsubono, Y.; Tsuji, I.; Fukao, A.; et al. Body mass index and mortality in Japan: The MIYAGI cohort study. J. Epidemiol. 2004, 14, S33–S38. [Google Scholar] [CrossRef] [PubMed]
  10. Tsugane, S.; Sasaki, S.; Tsubono, Y. Under- and overweight impact on mortality among middle-aged Japanese men and women: A 10-year follow-up of JPHC study cohort. Int. J. Obes. Relat. Metab. Disord. 2002, 26, 529–537. [Google Scholar] [CrossRef] [PubMed]
  11. Miyazaki, M.; Babazono, A.; Ishii, T.; Sugie, T.; Momose, Y.; Iwahashi, M.; Une, H. Effects of low body mass index and smoking on all-cause mortality among middle-aged and elderly Japanese. J. Epidemiol./Jpn. Epidemiol. Assoc. 2002, 12, 40–44. [Google Scholar] [CrossRef]
  12. Sasazuki, S.; Inoue, M.; Tsuji, I.; Sugawara, Y.; Tamakoshi, A.; Matsuo, K.; Wakai, K.; Nagata, C.; Tanaka, K.; Mizoue, T.; et al. Body mass index and mortality from all causes and major causes in Japanese: Results of a pooled analysis of 7 large-scale cohort studies. J Epidemiol. 2011, 21, 417–430. [Google Scholar] [CrossRef] [PubMed]
  13. Overview of Dietary Reference Intakes for Japanese (2015). Available online: http://www.mhlw.go.jp/file/06-Seisakujouhou-10900000-Kenkoukyoku/Overview.pdf (accessed on 18 October 2016).
  14. Ikizler, T.A.; Cano, N.J.; Franch, H.; Fouque, D.; Himmelfarb, J.; Kalantar-Zadeh, K.; Kuhlmann, M.K.; Stenvinkel, P.; TerWee, P.; Teta, D.; et al. Prevention and treatment of protein energy wasting in chronic kidney disease patients: A consensus statement by the international society of renal nutrition and metabolism. Kidney Int. 2013, 84, 1096–1107. [Google Scholar] [CrossRef] [PubMed]
  15. Bouillanne, O.; Morineau, G.; Dupont, C.; Coulombel, I.; Vincent, J.P.; Nicolis, I.; Benazeth, S.; Cynober, L.; Aussel, C. Geriatric nutritional risk index: A new index for evaluating at-risk elderly medical patients. Am. J. Clin. Nutr. 2005, 82, 777–783. [Google Scholar] [PubMed]
  16. Cereda, E.; Limonta, D.; Pusani, C.; Vanotti, A. Assessing elderly at risk of malnutrition: The new geriatric nutritional risk index versus nutritional risk index. Nutrition 2006, 22, 680–682. [Google Scholar] [CrossRef] [PubMed]
  17. Yamada, K.; Furuya, R.; Takita, T.; Maruyama, Y.; Yamaguchi, Y.; Ohkawa, S.; Kumagai, H. Simplified nutritional screening tools for patients on maintenance hemodialysis. Am. J. Clin. Nutr. 2008, 87, 106–113. [Google Scholar] [PubMed]
  18. Calhoun, D.A.; Jones, D.; Textor, S.; Goff, D.C.; Murphy, T.P.; Toto, R.D.; White, A.; Cushman, W.C.; White, W.; Sica, D.; et al. Resistant hypertension: Diagnosis, evaluation, and treatment. A scientific statement from the American heart association professional education committee of the council for high blood pressure research. Hypertension 2008, 51, 1403–1419. [Google Scholar] [CrossRef] [PubMed]
  19. Chobanian, A.V.; Bakris, G.L.; Black, H.R.; Cushman, W.C.; Green, L.A.; Izzo, J.L., Jr.; Jones, D.W.; Materson, B.J.; Oparil, S.; Wright, J.T., Jr.; et al. The seventh report of the Joint National Committee on prevention, detection, evaluation, and treatment of high blood pressure: The JNC 7 Report. JAMA 2003, 289, 2560–2572. [Google Scholar] [CrossRef] [PubMed]
  20. Zhu, Y.; Pandya, B.J.; Choi, H.K. Prevalence of gout and hyperuricemia in the US general population: The national health and nutrition examination survey 2007–2008. Arthritis Rheum. 2011, 63, 3136–3141. [Google Scholar] [CrossRef] [PubMed]
  21. Matsuo, S.; Imai, E.; Horio, M.; Yasuda, Y.; Tomita, K.; Nitta, K.; Yamagata, K.; Tomino, Y.; Yokoyama, H.; Hishida, A.; et al. Revised equations for estimated GFR from serum creatinine in Japan. Am. J. Kidney Dis. 2009, 53, 982–992. [Google Scholar] [CrossRef] [PubMed] [Green Version]
  22. Harris, J.A.; Benedict, F.G. A biometric study of human basal metabolism. Proc. Natl. Acad. Sci. USA 1918, 4, 370–373. [Google Scholar] [CrossRef] [PubMed]
  23. Cereda, E.; Klersy, C.; Pedrolli, C.; Cameletti, B.; Bonardi, C.; Quarleri, L.; Cappello, S.; Bonoldi, A.; Bonadeo, E.; Caccialanza, R. The geriatric nutritional risk index predicts hospital length of stay and in-hospital weight loss in elderly patients. Clin. Nutr. 2015, 34, 74–78. [Google Scholar] [CrossRef] [PubMed]
  24. Cereda, E.; Pedrolli, C. The geriatric nutritional risk index. Curr. Opin. Clin. Nutr. Metab. Care 2009, 12, 1–7. [Google Scholar] [CrossRef] [PubMed]
  25. Izawa, K.P.; Watanabe, S.; Oka, K.; Mogamiya, T.; Tada, M.; Nakata, S.; Nitobe, S.; Yoshizawa, K.; Hirano, Y.; Osada, N.; et al. Differences in physical performance based on the geriatric nutritional risk index in elderly female cardiac patients. Aging Clin. Exp. Res. 2015, 27, 195–200. [Google Scholar] [CrossRef] [PubMed]
  26. Cha, K.; Brown, E.F.; Wilmore, D.W. A new bioelectrical impedance method for measurement of the erythrocyte sedimentation rate. Physiol. Meas. 1994, 15, 499–508. [Google Scholar] [CrossRef] [PubMed]
  27. Gupta, D.; Lammersfeld, C.A.; Vashi, P.G.; King, J.; Dahlk, S.L.; Grutsch, J.F.; Lis, C.G. Bioelectrical impedance phase angle as a prognostic indicator in breast cancer. BMC Cancer 2008, 8, 249. [Google Scholar] [CrossRef] [PubMed]
  28. Amraoui, F.; Bos, S.; Vogt, L.; van den Born, B.J. Long-term renal outcome in patients with malignant hypertension: A retrospective cohort study. BMC Nephrol. 2012, 13, 71. [Google Scholar] [CrossRef] [PubMed]
  29. Parsa, A.; Kao, W.H.; Xie, D.; Astor, B.C.; Li, M.; Hsu, C.Y.; Feldman, H.I.; Parekh, R.S.; Kusek, J.W.; Greene, T.H.; et al. Apol1 risk variants, race, and progression of chronic kidney disease. N. Engl. J. Med. 2013, 369, 2183–2196. [Google Scholar] [CrossRef] [PubMed]
  30. Fouque, D.; Laville, M. Low protein diets for chronic kidney disease in non diabetic adults. Cochrane Database Syst. Rev. 2006. [Google Scholar] [CrossRef]
  31. Ikizler, T.A.; Greene, J.H.; Wingard, R.L.; Parker, R.A.; Hakim, R.M. Spontaneous dietary protein intake during progression of chronic renal failure. J. Am. Soc. Nephrol. 1995, 6, 1386–1391. [Google Scholar] [PubMed]
  32. Wallace, J.I.; Schwartz, R.S.; LaCroix, A.Z.; Uhlmann, R.F.; Pearlman, R.A. Involuntary weight loss in older outpatients: Incidence and clinical significance. J. Am. Geriatr. Soc. 1995, 43, 329–337. [Google Scholar] [CrossRef] [PubMed]
  33. Herrmann, F.R.; Safran, C.; Levkoff, S.E.; Minaker, K.L. Serum albumin level on admission as a predictor of death, length of stay, and readmission. Arch. Intern. Med. 1992, 152, 125–130. [Google Scholar] [CrossRef] [PubMed]
  34. Owen, W.F., Jr.; Lew, N.L.; Liu, Y.; Lowrie, E.G.; Lazarus, J.M. The urea reduction ratio and serum albumin concentration as predictors of mortality in patients undergoing hemodialysis. N. Engl. J. Med. 1993, 329, 1001–1006. [Google Scholar] [CrossRef] [PubMed]
  35. Agarwal, R.; Bills, J.E.; Light, R.P. Diagnosing obesity by body mass index in chronic kidney disease: An explanation for the “obesity paradox?”. Hypertension 2010, 56, 893–900. [Google Scholar] [CrossRef] [PubMed]
  36. Cooper, B.A.; Penne, E.L.; Bartlett, L.H.; Pollock, C.A. Protein malnutrition and hypoalbuminemia as predictors of vascular events and mortality in ESRD. Am. J. Kidney Dis. 2004, 43, 61–66. [Google Scholar] [CrossRef] [PubMed]
  37. Steinman, T.I. Serum albumin: Its significance in patients with ESRD. Semin. Dial. 2000, 13, 404–408. [Google Scholar] [CrossRef] [PubMed]
  38. Zoccali, C.; Torino, C.; Tripepi, G.; Mallamaci, F. Assessment of obesity in chronic kidney disease: What is the best measure? Curr. Opin. Nephrol. Hypertens. 2012, 21, 641–646. [Google Scholar] [CrossRef] [PubMed]
  39. White, J.V.; Guenter, P.; Jensen, G.; Malone, A.; Schofield, M.; Academy of Nutrition and Dietetics Malnutrition Work Group; A.S.P.E.N. Malnutrition Task Force; A.S.P.E.N. Board of Directors. Consensus Statement: Academy of Nutrition and Dietetics and American Society for Parenteral and Enteral Nutrition: Characteristics Recommended for the Identification and Documentation of Adult Malnutrition (Undernutrition). J. Parenter. Enteral. Nutr. 2012, 36, 275–283. [Google Scholar] [CrossRef] [PubMed]
  40. Ohashi, Y.; Saito, A.; Yamazaki, K.; Tai, R.; Matsukiyo, T.; Aikawa, A.; Sakai, K. Brain natriuretic peptide and body fluid composition in patients with chronic kidney disease: A cross-sectional study to evaluate the relationship between volume overload and malnutrition. Cardiorenal. Med. 2016, 6, 337–346. [Google Scholar] [CrossRef] [PubMed]
  41. Ohashi, Y.; Tai, R.; Aoki, T.; Mizuiri, S.; Ogura, T.; Tanaka, Y.; Okada, T.; Aikawa, A.; Sakai, K. The associations of malnutrition and aging with fluid volume imbalance between intra- and extracellular water in patients with chronic kidney disease. J. Nutr. Health Aging 2015, 19, 986–993. [Google Scholar] [CrossRef] [PubMed]
  42. Lukaski, H.C. Biological indexes considered in the derivation of the bioelectrical impedance analysis. Am. J. Clin. Nutr. 1996, 64, 397S–404S. [Google Scholar] [PubMed]
  43. Beberashvili, I.; Azar, A.; Sinuani, I.; Shapiro, G.; Feldman, L.; Stav, K.; Sandbank, J.; Averbukh, Z. Bioimpedance phase angle predicts muscle function, quality of life and clinical outcome in maintenance hemodialysis patients. Eur. J. Clin. Nutr. 2014, 68, 683–689. [Google Scholar] [CrossRef] [PubMed]
  44. Da, J.; Xie, X.; Wolf, M.; Disthabanchong, S.; Wang, J.; Zha, Y.; Lv, J.; Zhang, L.; Wang, H. Serum phosphorus and progression of CKD and mortality: A meta-analysis of cohort studies. Am. J. Kidney Dis. 2015, 66, 258–265. [Google Scholar] [CrossRef] [PubMed]
Figure 1. Age-specific underweight in patients with a GNRI ≥ 92 and < 92. Abbreviations: GNRI, geriatric nutritional risk index; BMI, body mass index.
Nutrients 08 00662 g001
Figure 2. Body composition in patients with a GNRI ≥ 92 and < 92. Abbreviations: GNRI, geriatric nutritional risk index; ICW, intracellular water; ECW, extracellular water.
Nutrients 08 00662 g002
Figure 3. Age and GFR associated changes in (A) calorie and protein intake and (B) ratio of non-protein calories to nitrogen. Abbreviations: DCI, dietary calorie intake; BEE, basal energy expenditure; eGFR, estimated glomerular filtration rate.
Nutrients 08 00662 g003
Figure 4. Kaplan–Meier analyses of all-cause mortality, cardiovascular events, and renal outcomes in the low and high GNRI groups. Abbreviations: CVD, cardiovascular disease; GNRI, geriatric nutritional risk index.
Nutrients 08 00662 g004
Table 1. Baseline demographic and clinical characteristics in patients with GNRI ≥ 92 and < 92 at the time of dietary nutrient assessment.
Patient CharacteristicsLow or No Nutrition-Related Risk (GNRI ≥ 92) n = 106 (84.1%)Moderate or Severe Nutrition-Related Risk (GNRI < 92) n = 20 (15.9%)p-Value
Age, years62.1 ± 16.369.7 ± 14.30.043
Sex, male, n (%)55 (51.9)10 (50.0)0.88
Time from first visit to the dietary clinic to the day of dietary recording, days1829 ± 16911981 ± 17060.72
Height, cm160 ± 10156 ± 100.09
Weight, kg60 ± 1348 ± 7<0.001
Body mass index, kg/m223.3 ± 3.819.6 ± 2.1<0.001
Underling kidney disease
 Glomerulonephritis, n (%)45 (42.5)7 (35.0)0.94
 Diabetes mellitus, n (%)14 (13.2)4 (20.0)
 Nephrosclerosis, n (%)22 (20.8)4 (20.0)
 Others/Unknown, n (%)25 (23.5)5 (25.0)
Systolic BP, mmHg124 ± 16123 ± 140.85
Diastolic BP, mmHg72 ± 967 ± 110.10
Resistant high blood pressure, n (%)23 (21.7)5 (25.0)0.74
Pulse pressure, mmHg52 ± 1256 ± 130.21
Blood urea nitrogen, mg/dL29 ± 1729 ± 170.87
Serum creatinine, mg/dL1.97 ± 1.441.98 ± 1.340.99
eGFRMDRD, mL/min per 1.73 m240 ± 2736 ± 240.48
GFR categories in KDIGO 2012
 G1 or 2, n (%)26 (24.5)3 (15.0)0.56
 G3a or G3b, n (%)34 (32.1)7 (35.0)
 G4, n (%)23 (21.7)7 (35.0)
 G5, n (%)23 (21.7)3 (15.0)
Serum albumin, mg/dL4.0 ± 0.43.3 ± 0.4<0.001
Total cholesterol, mg/dL193 ± 31189 ± 560.76
Triglyceride, mg/dL140 ± 84120 ± 610.21
Fasting blood glucose, mg/dL 118 ± 36148 ± 480.09
Uric acid > 7.0 mg/dL in males or >6.0 mg/dL in females, n (%)60 (57.1)16 (80.0)0.06
Calcium, mg/dL8.7 ± 0.68.7 ± 0.60.65
Phosphorus, mg/dL3.4 ± 0.73.4 ± 0.60.65
C-reactive protein, mg/dL0.2 ± 0.80.4 ± 0.60.43
Hemoglobin, g/dL12.3 ± 2.011.1 ± 1.50.006
UPCR, g/g Cr0.8 ± 1.31.8 ± 2.10.045
Urea nitrogen appearance, g/kg per day0.84 ± 0.200.89 ± 0.310.53
Abbreviations: GNRI, geriatric nutritional risk index; BP, blood pressure; eGFRMDRD, estimated glomerular filtration rate by the Modification of Diet in Renal Disease method; KDIGO, KIDNEY DISEASE|IMPROVING GLOBAL OUTCOMES; UPCR, urinary protein-to-creatinine ratio.
Table 2. Baseline dietary intake in patients with GNRI ≥ 92 and < 92 at the time of dietary nutrient assessment.
Patients CharacteristicsNo Nutrition-Related Risk (GNRI ≥ 92) n = 106 (84.1%)Nutrition-Related Risk (GNRI < 92) n = 20 (15.9%)p-Value
Sodium intake, mg/day3077 ± 1,2102942 ± 1,1390.65
Sodium intake per BW, mg/kg/day52 ± 1964 ± 260.07
Protein intake, g/day47 ± 1541 ± 150.09
Protein intake per BW, g/kg/day0.80 ± 0.240.87 ± 0.350.37
Protein intake per ideal BW g/standard weight/day0.83 ± 0.260.77 ± 0.290.36
Calorie intake, kcal/day1819 ± 1891763 ± 1290.11
Calorie intake per BW, kcal/kg/day31 ± 538 ± 4<0.001
Calorie intake per ideal BW, kcal/standard weight/day32 ± 333 ± 30.19
Ratio of non-protein calories to nitrogen218 ± 71261 ± 860.043
Basal energy expenditure, kcal1530 ± 2851270 ± 140<0.001
Abbreviations: GNRI, geriatric nutritional risk index; BW, body weight.
Table 3. Hazard risks of GNRI < 92 for all-cause mortality and cardiovascular events.
VariablesHR (95% CI)p-Value
All-cause death
 Unadjusted3.87 (1.62–8.72)0.003
 Age-adjusted3.91 (1.62–8.94)0.003
 Multivariable-adjusted a5.95 (1.94–18.04)0.002
Cardiovascular disease event
 Unadjusted8.26 (2.73–25.84)<0.001
 Age-adjusted13.44 (3.99–50.51)0.001
 Multivariable-adjusted b9.48 (2.47–44.31)<0.001
Abbreviations: GNRI, geriatric nutritional risk index; HR, hazard ratio; CI, confidence interval. a Adjusted for age, diabetes mellitus, C-reactive protein, urinary protein-to-creatinine ratio, ratio of non-protein calorie to nitrogen, hemoglobin concentration, and baseline estimated glomerular filtration rate (A graphic approach (log–log plots) was used to assess the proportionality of HRs. Continuous variables were divided into two groups by their median values. All variables in which HR was estimated satisfied this assumption. If serum albumin concentration or phosphorus levels were used as the dependent variable, results remained similar (data not shown)); b Adjusted for age, diabetes mellitus, resistant high blood pressure, C-reactive protein, urinary protein-to-creatinine ratio, ratio of non-protein calorie to nitrogen, hemoglobin concentrations, and baseline estimated glomerular filtration rate (A graphic approach (log–log plots) were used to assess the proportionality of HRs. Continuous variables were divided into two groups by their median values. All variables in which HR was estimated satisfied this assumption. If serum albumin concentration or phosphorus levels were used as the dependent variable, results remained similar (data not shown)). The time from first visit to the dietary clinic to the day of dietary recording was not associated with the investigated outcomes on univariate analyses. If this interval was used as the dependent variable, the results remained similar (data not shown).
Table 4. Factors independently associated with GNRI < 92.
VariablesUnivariate AnalysisMultivariate Analysis
OR (95% CI)p-ValueOR (95% CI)p-Value
Age, per 10 years of age0.77 (0.54–1.05)0.120.85 (0.57–1.20)0.36
UPCR, g/g Cr0.69 (0.51–0.92)0.010.71 (0.52–0.96)0.03
Uric acid > 7.0 mg/dL in males or >6.0 mg/dL in females2.89 (0.98–10.60)0.052.10 (0.66–8.12)0.21
Ratio of non-protein calorie to nitrogen, per 10 units0.94 (0.88–0.99)0.020.93 (0.87–0.99)0.04
Abbreviations: GNRI, geriatric nutritional risk index; OR, odds ratio; CI, confidence interval; UPCR, urinary protein-to-creatinine ratio.

