A High Rate of Non-Compliance Confounds the Study of Whole Grains and Weight Maintenance in a Randomised Intervention Trial—The Case for Greater Use of Dietary Biomarkers in Nutrition Intervention Studies

Abstract
:1. Introduction
2. Methods
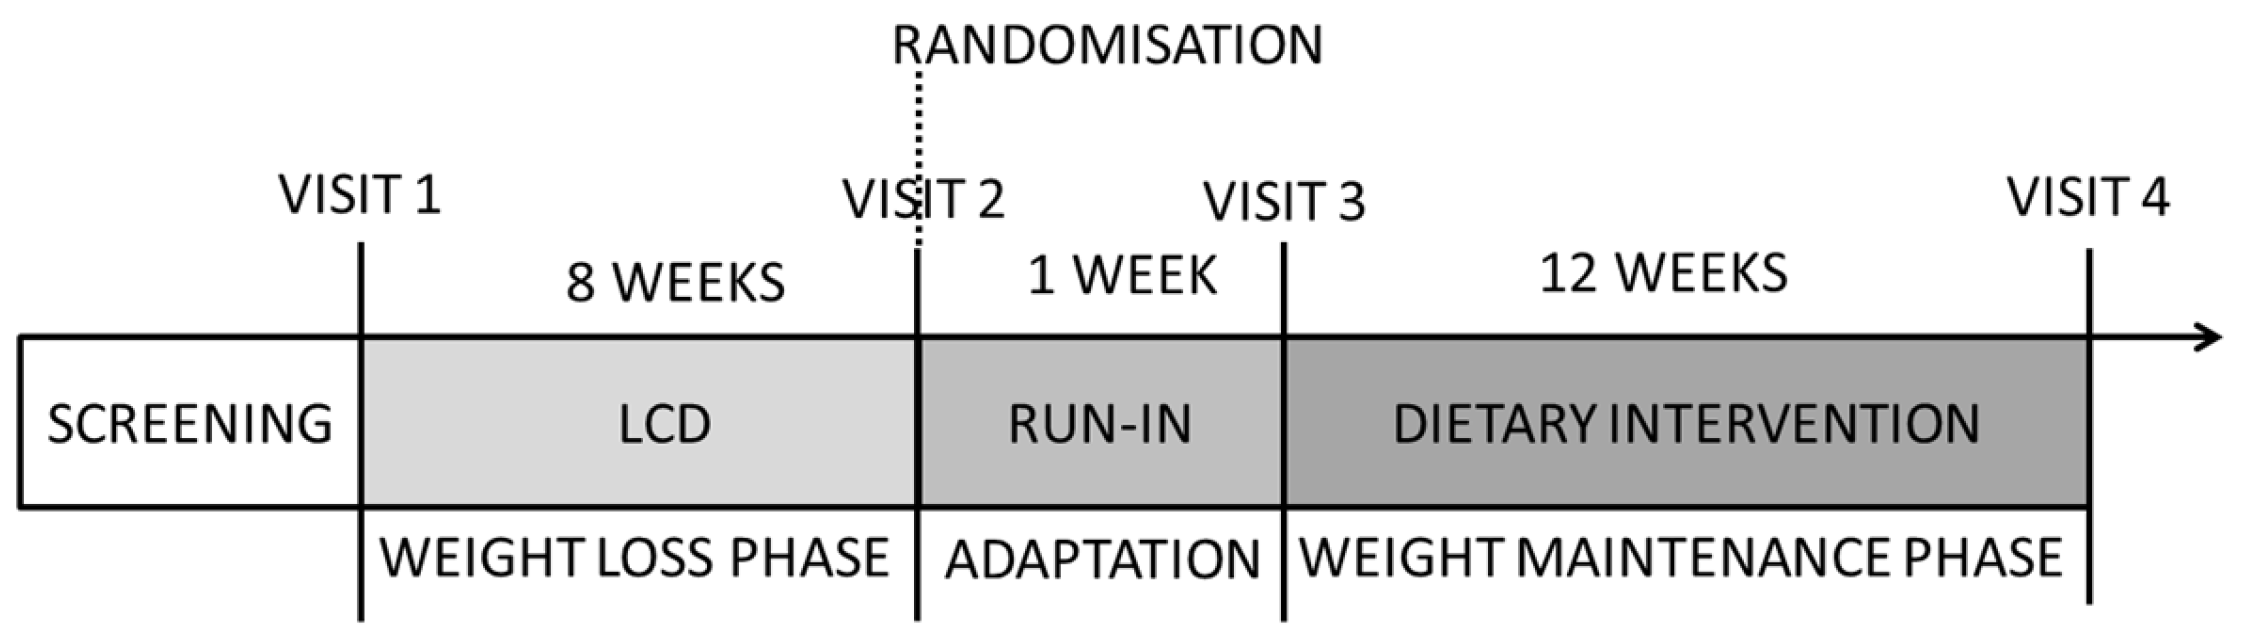
2.1. Study Design
2.2. Participants
2.3. Experimental Diet
2.4. Nutritional Counselling
2.5. Dietary Intake Assessment
2.6. Anthropometric Measurements
2.7. Biochemical Measurements
2.8. Statistical Analyses
3. Results
3.1. Flow of Participants during the Study
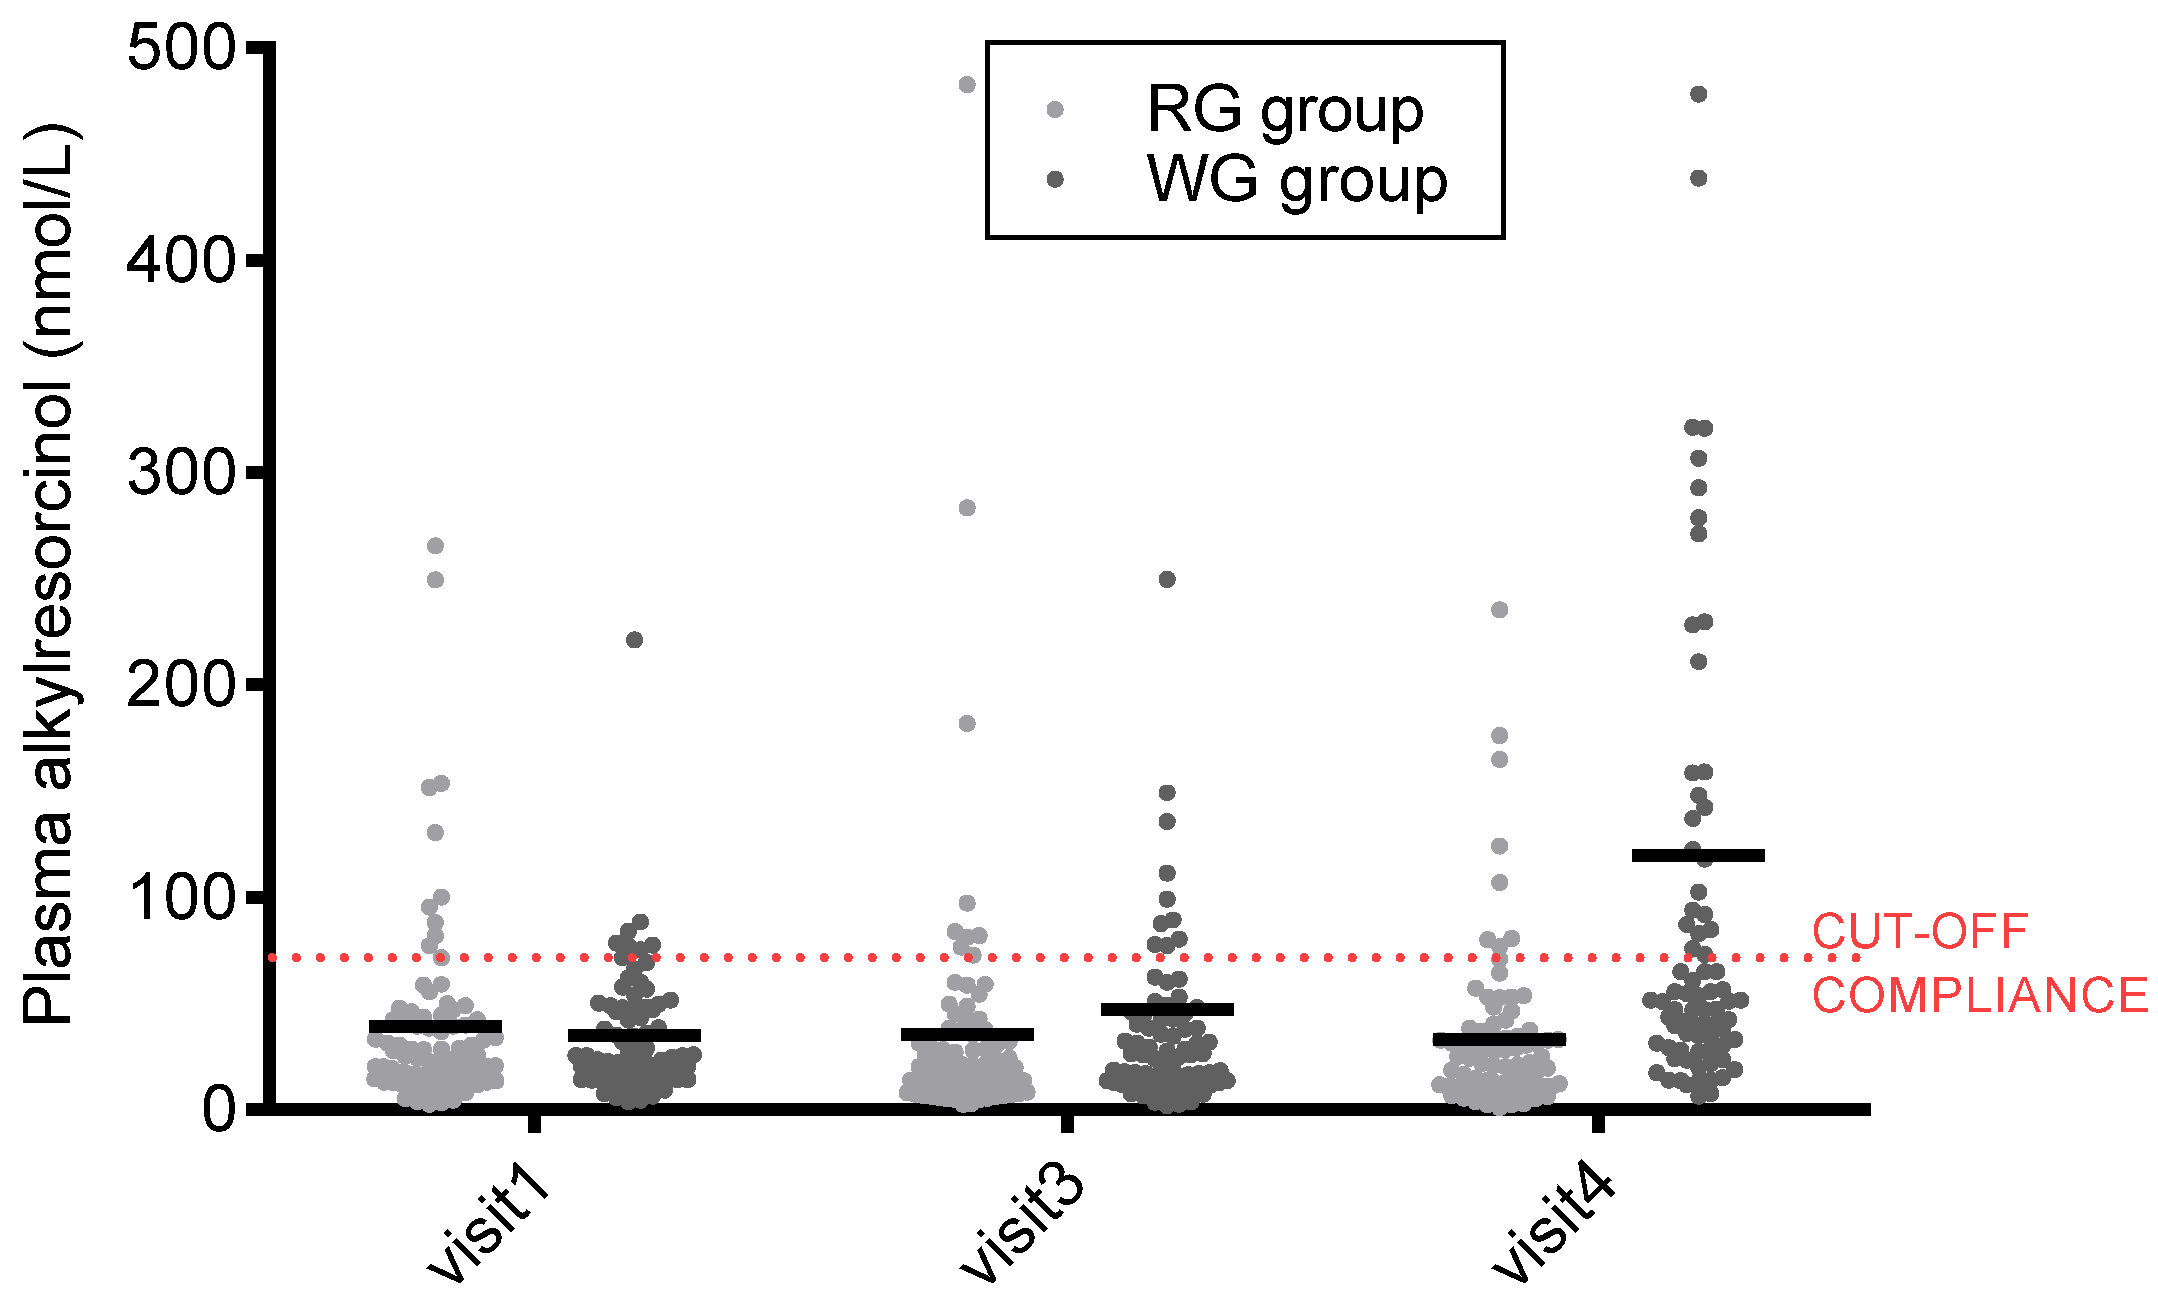
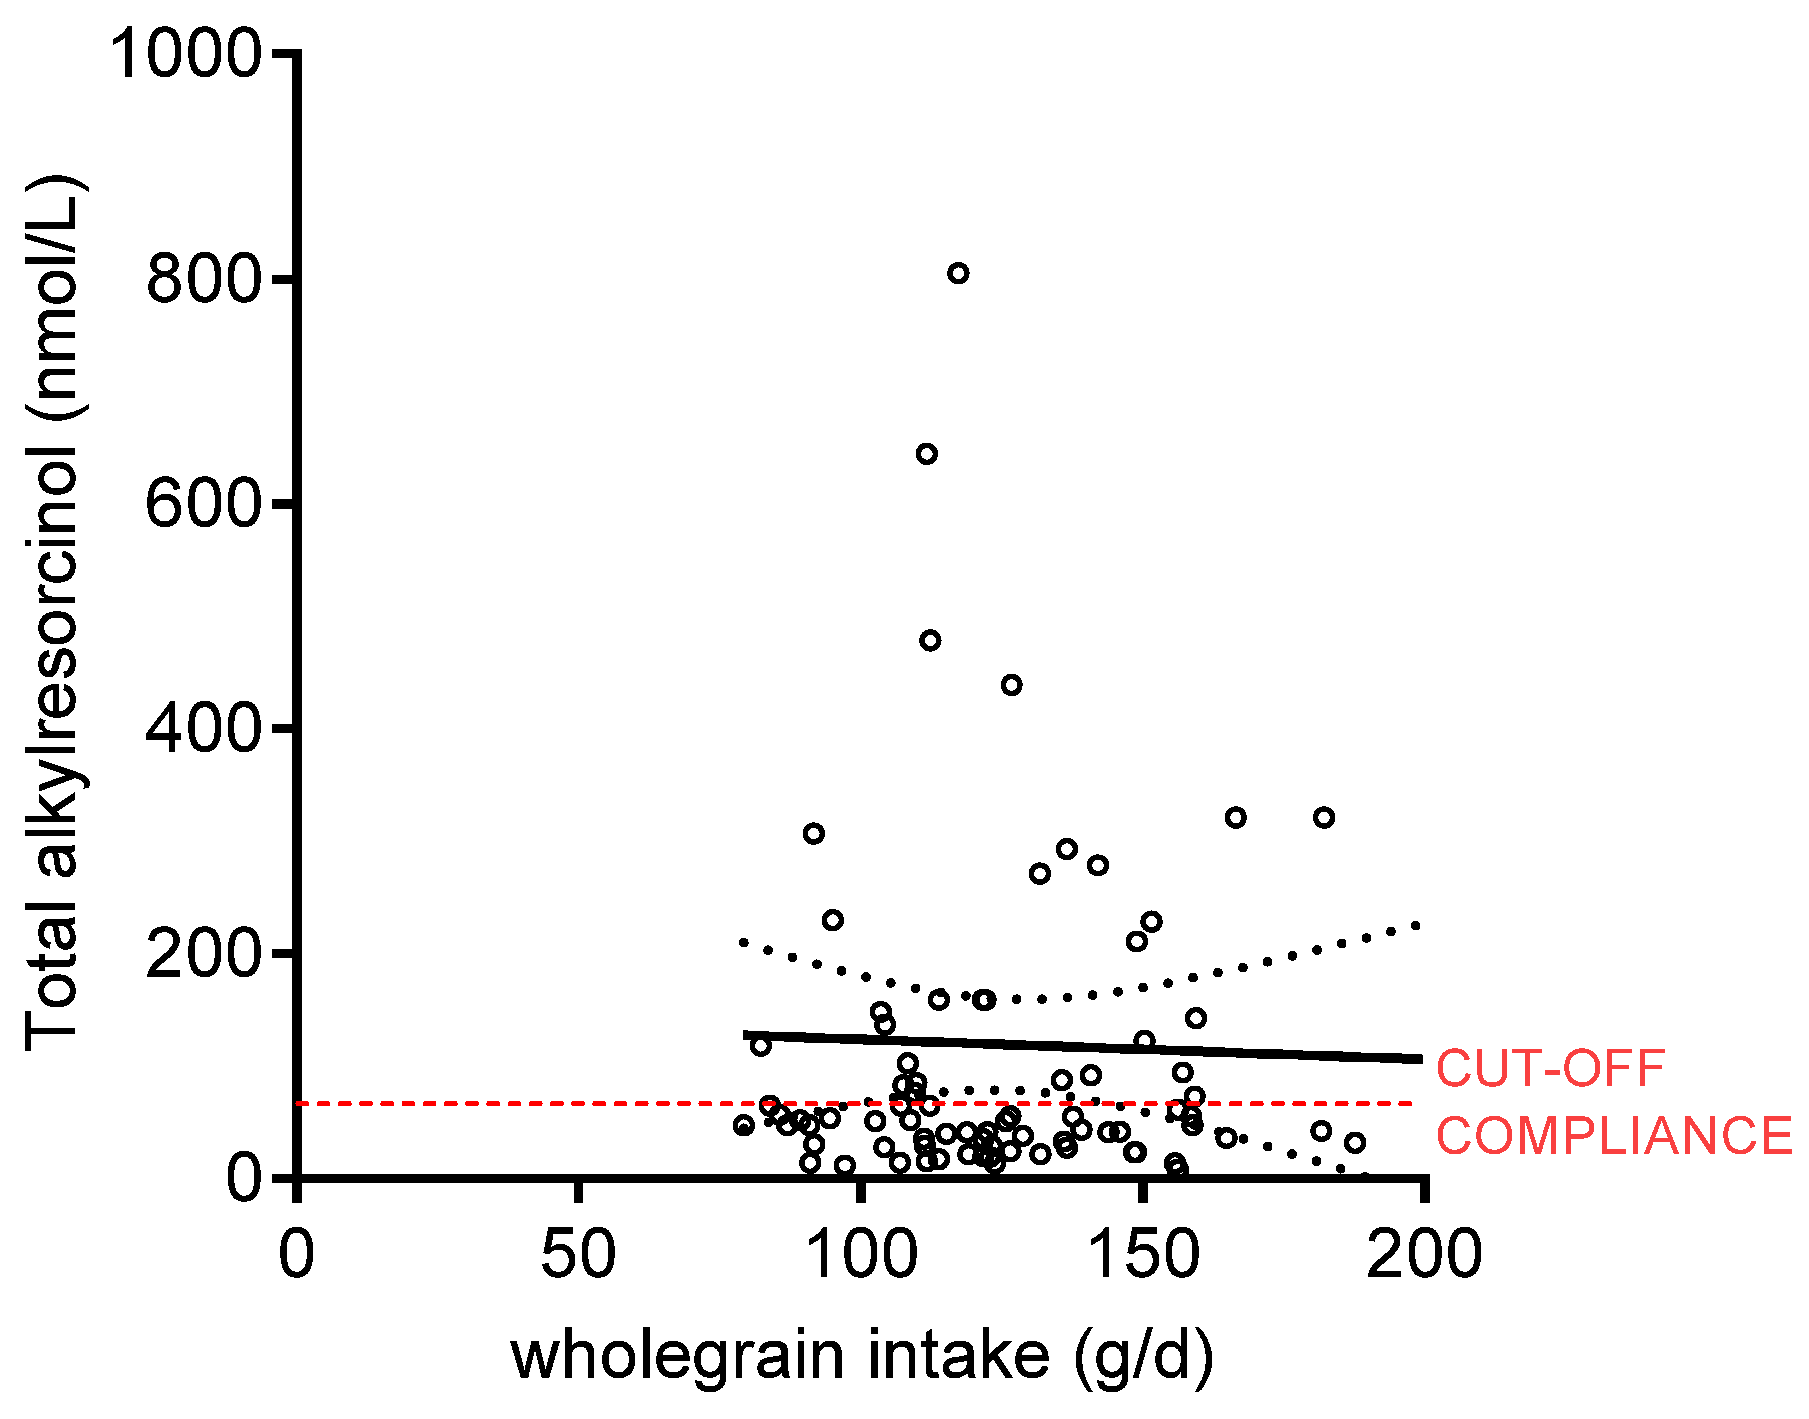
3.2. Dietary Intake and Compliance
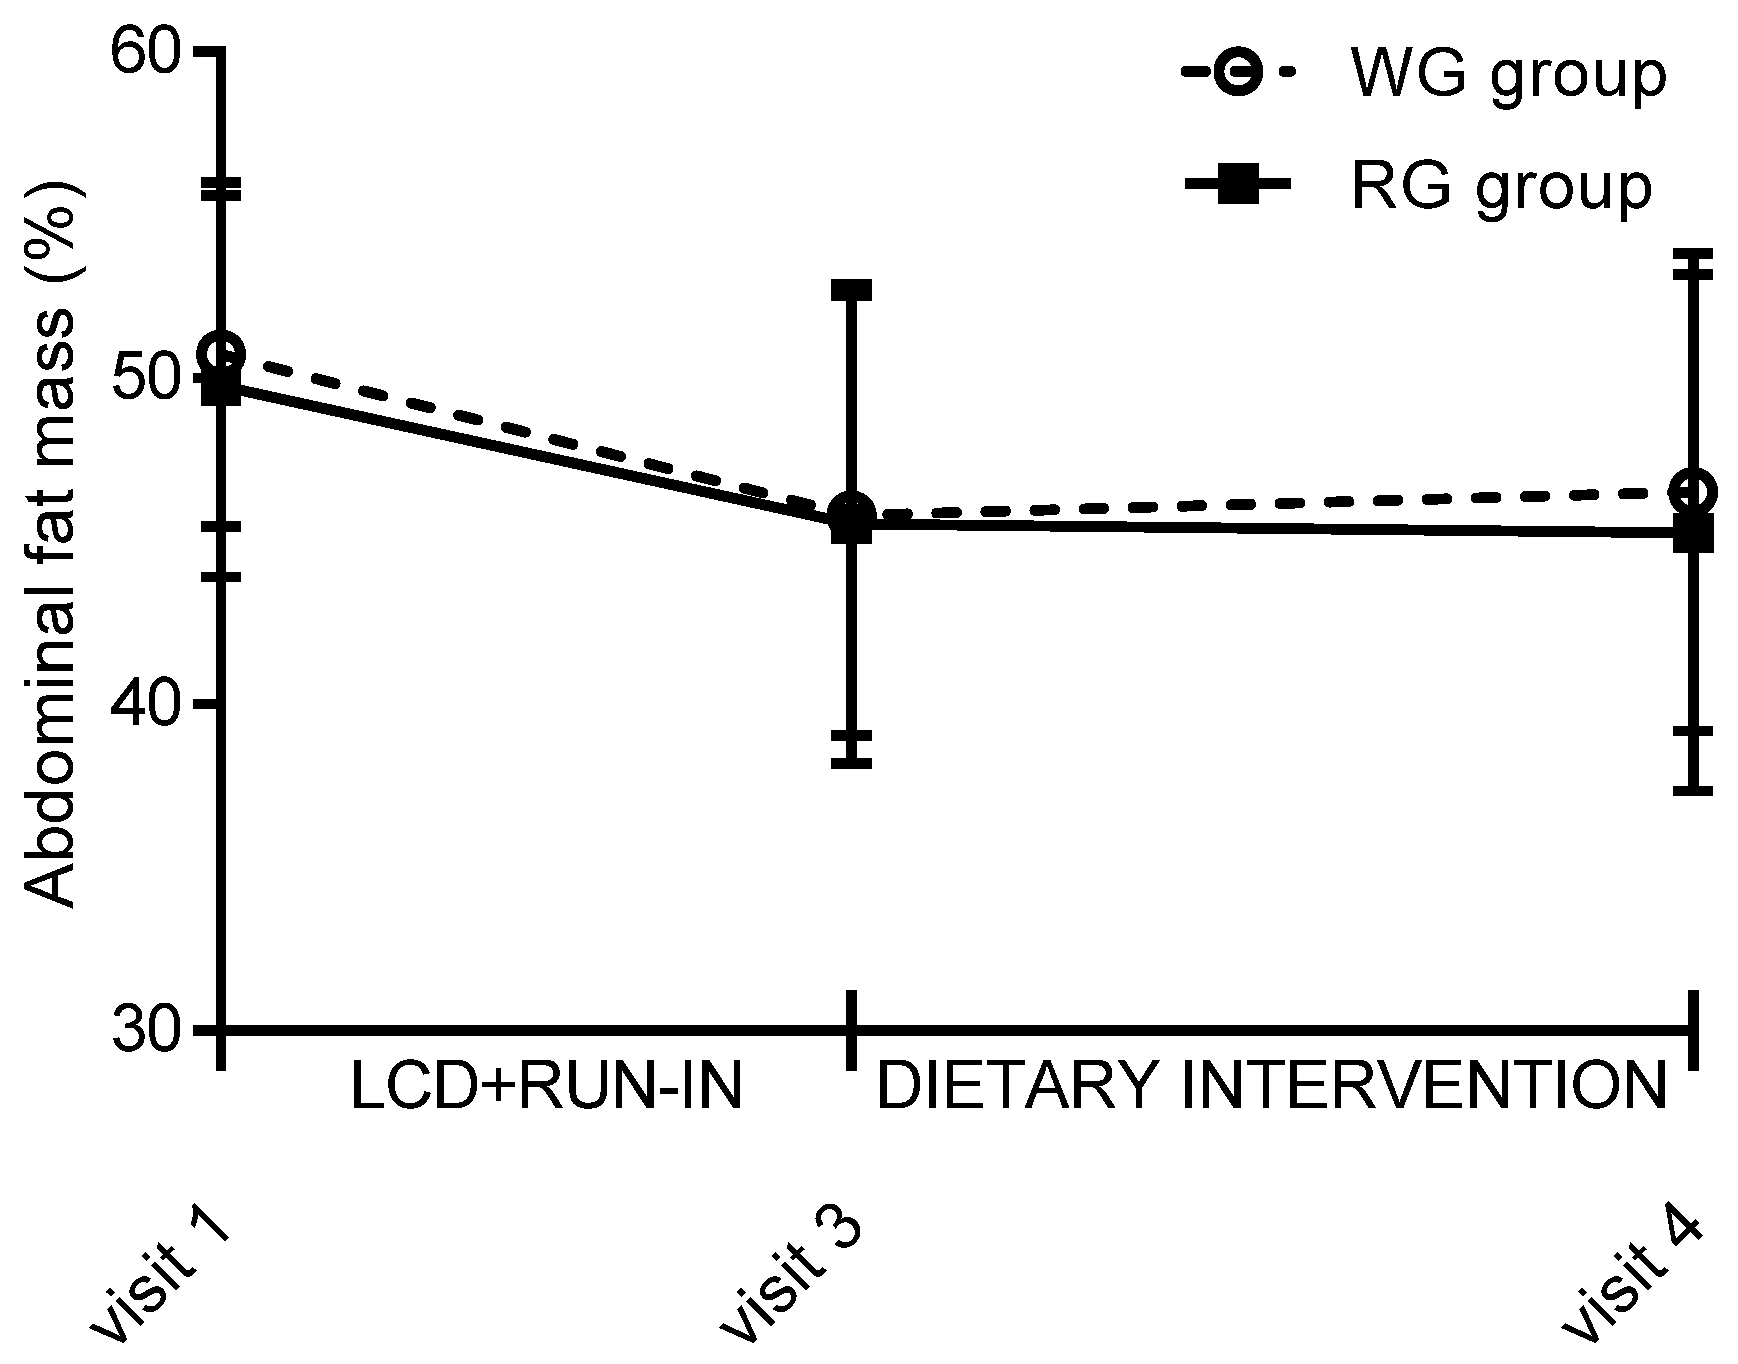
3.3. Anthropometric Measures
3.4. Cardiometabolic Outcomes
4. Discussion
5. Conclusions
Supplementary Materials
Acknowledgments
Author Contributions
Conflicts of Interest
References
- Choumenkovitch, S.F.; McKeown, N.M.; Tovar, A.; Hyatt, R.R.; Kraak, V.I.; Hastings, A.V.; Herzog, J.B.; Economos, C.D. Whole grain consumption is inversely associated with BMI Z-score in rural school-aged children. Public Health Nutr. 2013, 16, 212–218. [Google Scholar] [CrossRef] [PubMed]
- Kyrø, C.; Skeie, G.; Dragsted, L.O.; Christensen, J.; Overvad, K.; Hallmans, G.; Johansson, I.; Lund, E.; Slimani, N.; Johnsen, N.F.; et al. Intake of whole grains in Scandinavia is associated with healthy lifestyle, socio-economic and dietary factors. Public Health Nutr. 2011, 14, 1787–1795. [Google Scholar] [CrossRef] [PubMed]
- O’Neil, C.E.; Zanovec, M.; Cho, S.S.; Nicklas, T.A. Whole grain and fiber consumption are associated with lower body weight measures in US adults: National Health and Nutrition Examination Survey 1999–2004. Nutr. Res. 2010, 30, 815–822. [Google Scholar] [CrossRef] [PubMed]
- Zanovec, M.; O’Neil, C.E.; Cho, S.S.; Kleinman, R.E.; Nicklas, T.A. Relationship between whole grain and fiber consumption and body weight measures among 6- to 18-year-olds. J. Pediatr. 2010, 157, 578–583. [Google Scholar] [CrossRef] [PubMed]
- Mirmiran, P.; Bahadoran, Z.; Golzarand, M.; Shiva, N.; Azizi, F. Association between dietary phytochemical index and 3-year changes in weight, waist circumference and body adiposity index in adults: Tehran Lipid and Glucose study. Nutr. Metab. 2012, 9, 108. [Google Scholar] [CrossRef] [PubMed]
- Ye, E.Q.; Chacko, S.A.; Chou, E.L.; Kugizaki, M.; Liu, S. Greater whole-grain intake is associated with lower risk of type 2 diabetes, cardiovascular disease, and weight gain. J. Nutr. 2012, 142, 1304–1313. [Google Scholar] [CrossRef] [PubMed]
- Mozaffarian, D.; Hao, T.; Rimm, E.B.; Willett, W.C.; Hu, F.B. Changes in diet and lifestyle and long-term weight gain in women and men. N. Engl. J. Med. 2011, 364, 2392–2404. [Google Scholar] [CrossRef] [PubMed]
- Van de Vijver, L.P.L.; van den Bosch, L.M.C.; van den Brandt, P.A.; Goldbohm, R.A. Whole-grain consumption, dietary fibre intake and body mass index in the Netherlands cohort study. Eur. J. Clin. Nutr. 2007, 63, 31–38. [Google Scholar] [CrossRef] [PubMed]
- Lutsey, P.L.; Jacobs, D.R., Jr.; Kori, S.; Mayer-Davis, E.; Shea, S.; Steffen, L.M.; Szklo, M.; Tracy, R. Whole grain intake and its cross-sectional association with obesity, insulin resistance, inflammation, diabetes and subclinical CVD: The MESA Study. Br. J. Nutr. 2007, 98, 397–405. [Google Scholar] [CrossRef] [PubMed]
- Rose, N.; Hosig, K.; Davy, B.; Serrano, E.; Davis, L. Whole-grain intake is associated with body mass index in College Students. J. Nutr. Educ. Behav. 2007, 39, 90–94. [Google Scholar] [CrossRef] [PubMed]
- Sahyoun, N.R.; Jacques, P.F.; Zhang, X.L.; Juan, W.; McKeown, N.M. Whole-grain intake is inversely associated with the metabolic syndrome and mortality in older adults. Am. J. Clin. Nutr. 2006, 83, 124–131. [Google Scholar] [PubMed]
- Steffen, L.M.; Jacobs, D.R., Jr.; Murtaugh, M.A.; Moran, A.; Steinberger, J.; Hong, C.P.; Sinaiko, A.R. Whole grain intake is associated with lower body mass and greater insulin sensitivity among adolescents. Am. J. Epidemiol. 2003, 158, 243–250. [Google Scholar] [CrossRef] [PubMed]
- McKeown, N.M.; Meigs, J.B.; Liu, S.; Wilson, P.W.; Jacques, P.F. Whole-grain intake is favorably associated with metabolic risk factors for type 2 diabetes and cardiovascular disease in the Framingham Offspring Study. Am. J. Clin. Nutr. 2002, 76, 390–398. [Google Scholar] [PubMed]
- Good, C.K.; Holschuh, N.; Albertson, A.M.; Eldridge, A.L. Whole grain consumption and body mass index in adult women: An analysis of NHANES 1999–2000 and the USDA pyramid servings database. J. Am. Coll. Nutr. 2008, 27, 80–87. [Google Scholar] [CrossRef] [PubMed]
- Newby, P.K.; Maras, J.; Bakun, P.; Muller, D.; Ferrucci, L.; Tucker, K.L. Intake of whole grains, refined grains, and cereal fiber measured with 7-d diet records and associations with risk factors for chronic disease. Am. J. Clin. Nutr. 2007, 86, 1745–1753. [Google Scholar] [PubMed]
- Koh-Banerjee, P.; Franz, M.; Sampson, L.; Liu, S.; Jacobs, D.R., Jr.; Spiegelman, D.; Willett, W.; Rimm, E. Changes in whole-grain, bran, and cereal fiber consumption in relation to 8-y weight gain among men. Am. J. Clin. Nutr. 2004, 80, 1237–1245. [Google Scholar] [PubMed]
- Liu, S.; Willett, W.C.; Manson, J.E.; Hu, F.B.; Rosner, B.; Colditz, G. Relation between changes in intakes of dietary fiber and grain products and changes in weight and development of obesity among middle-aged women. Am. J. Clin. Nutr. 2003, 78, 920–927. [Google Scholar] [PubMed]
- Hur, Y.; Reicks, M. Relationship between whole-grain intake, chronic disease risk indicators, and weight status among adolescents in the National Health and Nutrition Examination Survey, 1999–2004. J. Acad. Nutr. Diet. 2012, 112, 46–55. [Google Scholar] [CrossRef] [PubMed]
- Thane, C.W.; Stephen, A.M.; Jebb, S.A. Whole grains and adiposity: Little association among British adults. Eur. J. Clin. Nutr. 2009, 63, 229–237. [Google Scholar] [CrossRef] [PubMed]
- Bazzano, L.A.; Song, Y.; Bubes, V.; Good, C.K.; Manson, J.E.; Liu, S. Dietary intake of whole and refined grain breakfast cereals and weight gain in men. Obes. Res. 2005, 13, 1952–1960. [Google Scholar] [CrossRef] [PubMed]
- Cheng, G.; Karaolis-Danckert, N.; Libuda, L.; Bolzenius, K.; Remer, T.; Buyken, A.E. Relation of dietary glycemic index, glycemic load, and fiber and whole-grain intakes during puberty to the concurrent development of percent body fat and body mass index. Am. J. Epidemiol. 2009, 169, 667–677. [Google Scholar] [CrossRef] [PubMed]
- McKeown, N.M.; Troy, L.M.; Jacques, P.F.; Hoffmann, U.; O’Donnell, C.J.; Fox, C.S. Whole- and refined-grain intakes are differentially associated with abdominal visceral and subcutaneous adiposity in healthy adults: The Framingham Heart Study. Am. J. Clin. Nutr. 2010, 92, 1165–1171. [Google Scholar] [CrossRef] [PubMed]
- Kristensen, M.; Toubro, S.; Jensen, M.G.; Ross, A.B.; Riboldi, G.; Petronio, M.; Bügel, S.; Tetens, I.; Astrup, A. Whole grain compared with refined wheat decreases the percentage of body fat following a 12-week, energy-restricted dietary intervention in postmenopausal women. J. Nutr. 2012, 142, 710–716. [Google Scholar] [CrossRef] [PubMed]
- Katcher, H.I.; Legro, R.S.; Kunselman, A.R.; Gillies, P.J.; Demers, L.M.; Bagshaw, D.M.; Kris-Etherton, P.M. The effects of a whole grain-enriched hypocaloric diet on cardiovascular disease risk factors in men and women with metabolic syndrome. Am. J. Clin. Nutr. 2008, 87, 79–90. [Google Scholar] [PubMed]
- Maki, K.C.; Beiseigel, J.M.; Jonnalagadda, S.S.; Gugger, C.K.; Reeves, M.S.; Farmer, M.V.; Kaden, V.N.; Rains, T.M. Whole-grain ready-to-eat oat cereal, as part of a dietary program for weight loss, reduces low-density lipoprotein cholesterol in adults with overweight and obesity more than a dietary program including low-fiber control foods. J. Am. Diet. Assoc. 2010, 110, 205–214. [Google Scholar] [CrossRef] [PubMed]
- Poulsen, S.K.; Due, A.; Jordy, A.B.; Kiens, B.; Stark, K.D.; Stender, S.; Holst, C.; Astrup, A.; Larsen, T.M. Health effect of the New Nordic Diet in adults with increased waist circumference: A 6-mo randomized controlled trial. Am. J. Clin. Nutr. 2014. [Google Scholar] [CrossRef] [PubMed]
- Melanson, K.J.; Angelopoulos, T.J.; Nguyen, V.T.; Martini, M.; Zukley, L.; Lowndes, J.; Dube, T.J.; Fiutem, J.J.; Yount, B.W.; Rippe, J.M. Consumption of whole-grain cereals during weight loss: Effects on dietary quality, dietary fiber, magnesium, vitamin B-6, and obesity. J. Am. Diet. Assoc. 2006, 106, 1380–1388. [Google Scholar] [CrossRef] [PubMed]
- Pol, K.; Christensen, R.; Bartels, E.M.; Raben, A.; Tetens, I.; Kristensen, M. Whole grain and body weight changes in apparently healthy adults: A systematic review and meta-analysis of randomized controlled studies. Am. J. Clin. Nutr. 2013, 98, 872–884. [Google Scholar] [CrossRef] [PubMed]
- Brownlee, I.A.; Moore, C.; Chatfield, M.; Richardson, D.P.; Ashby, P.; Kuznesof, S.A.; Jebb, S.A.; Seal, C.J. Markers of cardiovascular risk are not changed by increased whole-grain intake: The WHOLEheart study, a randomised, controlled dietary intervention. Br. J. Nutr. 2010, 104, 125–134. [Google Scholar] [CrossRef] [PubMed]
- Crichton, G.E.; Howe, P.R.; Buckley, J.D.; Coates, A.M.; Murphy, K.J.; Bryan, J. Long-term dietary intervention trials: Critical issues and challenges. Trials 2012, 13, 111. [Google Scholar] [CrossRef] [PubMed]
- Desroches, S.; Lapointe, A.; Ratte, S.; Gravel, K.; Legare, F.; Turcotte, S. Interventions to enhance adherence to dietary advice for preventing and managing chronic diseases in adults. Cochrane Database Syst. Rev. (Online) 2013, 2, CD008722. [Google Scholar] [CrossRef] [PubMed]
- Gibson, T.M.; Ferrucci, L.M.; Tangrea, J.A.; Schatzkin, A. Epidemiological and Clinical Studies of Nutrition. Semin. Oncol. 2010, 37, 282–296. [Google Scholar] [CrossRef] [PubMed]
- Kehoe, S.H.; Chheda, P.S.; Sahariah, S.A.; Baird, J.; Fall, C.H.D. Reporting of participant compliance in randomized controlled trials of nutrition supplements during pregnancy. Matern. Child Nutr. 2009, 5, 97–103. [Google Scholar] [CrossRef] [PubMed]
- Ross, A.B. Present status and perspectives on the use of alkylresorcinols as biomarkers of wholegrain wheat and rye intake. J. Nutr. Metab. 2012, 2012, 462967. [Google Scholar] [CrossRef] [PubMed]
- Ross, A.B.; Bourgeois, A.; Macharia, H.N.; Kochhar, S.; Jebb, S.A.; Brownlee, I.A.; Seal, C.J. Plasma alkylresorcinols as a biomarker of whole grain food consumption in a large population—Results from the WHOLEheart intervention study. Am. J. Clin. Nutr. 2012, 95, 204–211. [Google Scholar] [CrossRef] [PubMed]
- Ross, A.B.; Bruce, S.J.; Blondel-Lubrano, A.; Oguey-Araymon, S.; Beaumont, M.; Bourgeois, A.; Nielsen-Moennoz, C.; Vigo, M.; Fay, L.B.; Kochhar, S.; et al. A whole-grain cereal-rich diet increases plasma betaine, and tends to decrease total and LDL-cholesterol compared with a refined-grain diet in healthy subjects. Br. J. Nutr. 2011, 105, 1492–1502. [Google Scholar] [CrossRef] [PubMed]
- Harris Jackson, K.; West, S.G.; Vanden Heuvel, J.P.; Jonnalagadda, S.S.; Ross, A.B.; Hill, A.M.; Grieger, J.A.; Lemieux, S.K.; Kris-Etherton, P.M. Effects of whole and refined grains in a weight-loss diet on markers of metabolic syndrome in individuals with increased waist circumference: A randomized controlled-feeding trial. Am. J. Clin. Nutr. 2014. [Google Scholar] [CrossRef] [PubMed]
- Ross, A.B.; Pineau, N.; Kochhar, S.; Bourgeois, A.; Beaumont, M.; Decarli, B. Validation of a FFQ for estimating whole-grain cereal food intake. Br. J. Nutr. 2009, 102, 1547–1551. [Google Scholar] [CrossRef] [PubMed]
- Van der Kamp, J.W.; Poutanen, K.; Seal, C.J.; Richardson, D.P. The HEALTHGRAIN definition of ‘whole grain’. Food Nutr. Res. 2014. [Google Scholar] [CrossRef] [PubMed]
- Ross, A.B. Analysis of alkylresorcinols in cereal grains and products using ultrahigh-pressure liquid chromatography with fluorescence, ultraviolet, and coulArray electrochemical detection. J. Agric. Food Chem. 2012, 60, 8954–8962. [Google Scholar] [CrossRef] [PubMed]
- Baecke, J.A.; Burema, J.; Frijters, J.E. A short questionnaire for the measurement of habitual physical activity in epidemiological studies. Am. J. Clin. Nutr. 1982, 36, 936–942. [Google Scholar] [PubMed]
- Ross, A.B.; Redeuil, K.; Vigo, M.; Rezzi, S.; Nagy, K. Quantification of alkylresorcinols in human plasma by liquid chromatography/tandem mass spectrometry. Rapid Commun. Mass Spectrom. 2010, 24, 554–560. [Google Scholar] [CrossRef] [PubMed]
- Schisterman, E.F.; Mumford, S.L.; Sjaarda, L.A. Failure to consider the menstrual cycle phase may cause misinterpretation of clinical and research findings of cardiometabolic biomarkers in premenopausal women. Epidemiol. Rev. 2014, 36, 71–82. [Google Scholar] [CrossRef] [PubMed]
- Landberg, R.; Kamal-Eldin, A.; Andersson, S.O.; Johansson, J.E.; Zhang, J.X.; Hallmans, G.; Åman, P. Reproducibility of plasma alkylresorcinols during a 6-week rye intervention study in men with prostate cancer. J. Nutr. 2009, 139, 975–980. [Google Scholar] [CrossRef] [PubMed]
- Marklund, M.; Landberg, R.; Andersson, R.; Åman, P.; Kamal-Eldin, A. Alkylresorcinol metabolism in Swedish adults is affected by factors other than intake of whole-grain wheat and rye. J. Nutr. 2012, 142, 1479–1486. [Google Scholar] [CrossRef] [PubMed]
- Larsen, T.M.; Dalskov, S.M.; van Baak, M.; Jebb, S.A.; Papadaki, A.; Pfeiffer, A.F.; Martinez, J.A.; Handjieva-Darlenska, T.; Kunesova, M.; et al. Diets with high or low protein content and glycemic index for weight-loss maintenance. N. Engl. J. Med. 2010, 363, 2102–2113. [Google Scholar] [CrossRef] [PubMed]
- Bellisle, F.; Hébel, P.; Colin, J.; Reyé, B.; Hopkins, S. Consumption of whole grains in French children, adolescents and adults. Br. J. Nutr. 2014, 112, 1674–1684. [Google Scholar] [CrossRef] [PubMed]
- Lind, M.V.; Madsen, M.L.; Rumessen, J.J.; Vestergaard, H.; Gøbel, R.J.; Hansen, T.; Lauritzen, L.; Pedersen, O.B.; Kristensen, M.; Ross, A.B. Plasma alkylresorcinols reflect gluten intake and distinguish between gluten-rich and gluten-poor diets in a population at risk of metabolic syndrome. J. Nutr. 2016, 146, 1991–1998. [Google Scholar] [CrossRef] [PubMed]
- Ross, A.B.; Kristensen, M.; Seal, C.J.; Jacques, P.; McKeown, N.M. Recommendations for reporting whole-grain intake in observational and intervention studies. Am. J. Clin. Nutr. 2015, 101, 903–907. [Google Scholar] [CrossRef] [PubMed]


| RG Group (n = 88) | WG Group (n = 81) | |||
|---|---|---|---|---|
| Mean | SD | Mean | SD | |
| Age (years) | 35.3 | 8.7 | 36.2 | 10.1 |
| Height (cm) | 164.6 | 6.7 | 163.0 | 6.1 |
| Weight (kg) | 81.5 | 8.1 | 80.2 | 7.2 |
| Body mass index (kg/m2) | 30.1 | 2.0 | 30.2 | 1.9 |
| Total body fat (%) | 44.5 | 4.8 | 45.5 | 4.4 |
| Abdominal body fat (%) | 45.6 | 7.4 | 45.6 | 6.7 |
| Whole-grain intake (g/day) | 13.5 | 29.9 | 13.0 | 25.3 |
| Current smokers (n) | 28 | 20 | ||
| Caucasian/Black/Asian/other (n/n/n/n) | 81/5/1/1 | 76/4/0/1 | ||
| Baseline | During Dietary Intervention | |||||||
|---|---|---|---|---|---|---|---|---|
| RG Group (n 88) | WG Group (n 81) | RG Group (n 88) | WG Group (n 81) | |||||
| Mean | SD | Mean | SD | Mean | SD | Mean | SD | |
| Energy intake (kcal/day) | 1759 | 472 | 1823 | 541 | 1402 | 396 | 1331 | 321 |
| Protein (E%) | 18.0 | 3.5 | 17.2 | 3.7 | 17.4 | 3.3 | 18.2 | 3.5 |
| Fat (E%) | 37.2 | 5.9 | 38.7 | 7.3 | 31.9 | 7.5 | 28.9 * | 5.7 |
| Carbohydrates (E%) | 43.2 | 6.6 | 42.6 | 7.0 | 50.0 | 7.3 | 51.9 | 8.4 |
| Dietary fibre (g/day) | 13.6 | 5.2 | 13.8 | 5.1 | 13.3 | 4.1 | 18.5 * | 5.2 |
| Whole grain intake (g/day) | 13.5 | 29.9 | 13.0 | 25.3 | 0.5 | 2.6 | 124 * | 29 |
| RG Group (n 88) | WG Group (n 81) | |||||||
|---|---|---|---|---|---|---|---|---|
| At Visit 3 | Δ Visit 4–Visit 3 | At Visit 3 | Δ Visit 4–Visit 3 | |||||
| Mean | SD | Mean | SD | Mean | SD | Mean | SD | |
| Systolic blood pressure (mmHg) | 111.2 | 10.0 | 0.2 | 10.0 | 109.8 | 10.2 | 1.0 | 9.3 |
| Diastolic blood pressure (mmHg) | 71.1 | 7.4 | −1.2 | 7.6 | 71.0 | 8.3 | 0.0 | 8.5 |
| Glucose (mmol/L) | 4.78 | 0.41 | −0.05 | 0.35 | 4.79 | 0.39 | −0.07 | 0.49 |
| Insulin (pmol/L) | 61.1 | 36.8 | −1.8 | 32.0 | 55.9 | 29.5 | 1.8 | 28.4 |
| Glycated haemoglobin, HbA1C (%) | 5.34 | 0.29 | 0.02 | 0.20 | 5.29 | 0.31 | 0.04 | 0.17 |
| Total cholesterol (mmol/L) | 4.39 | 0.79 | 0.47 | 0.57 | 4.62 | 0.88 | 0.42 | 0.74 |
| LDL cholesterol (mmol/L) | 2.72 | 0.69 | 0.21 | 0.46 | 2.90 | 0.79 | 0.19 | 0.60 |
| HDL cholesterol (mmol/L) | 1.29 | 0.29 | 0.22 | 0.21 | 1.29 | 0.26 | 0.18 | 0.23 |
| Total triacylglycerol (mmol/L) | 0.86 | 0.36 | 0.08 | 0.37 | 0.95 | 0.45 | 0.09 | 0.40 |
| Leptin (µg/L) | 19.8 | 9.4 | 4.3 | 7.7 | 18.3 | 11.2 | 6.7 | 7.9 |
| Adiponectin (mg/L) | 9.32 | 4.54 | 0.97 | 2.42 | 8.39 | 6.32 | 1.30 | 2.16 |
| High sensitivity C-reactive protein(mg/L) | 3.00 | 3.88 | −0.06 | 2.92 | 3.32 | 6.63 | 0.67 | 7.54 |
| Plasminogen activator inhibtior-1 (mmol/L) | 12.81 | 5.40 | 2.96 | 3.13 | 12.62 | 6.13 | 3.36 | 10.44 |
| Alkylresorcinols (nmol/L) | 35.6 | 62.9 | −2.0 | 70.4 | 47.6 | 109.2 | 71.2 | 199.0 * |
| Refined Grain (n 88) | Whole Grain (n 81) | |||||||
|---|---|---|---|---|---|---|---|---|
| At Visit 3 | Visit 4–Visit 3 | At Visit 3 | Visit 4–Visit 3 | |||||
| Mean | SD | Mean | SD | Mean | SD | Mean | SD | |
| Body weight (kg) | 74.9 | 7.7 | 0.4 | 2.7 | 73.9 | 6.6 | 0.4 | 2.3 |
| Body Mass Index (kg/m2) | 27.6 | 2.0 | 0.14 | 1.0 | 27.8 | 1.9 | 1.8 | 0.9 |
| Total fat mass (%) | 41.1 | 5.5 | −0.2 | 2.9 | 41.7 | 5.0 | 0.4 | 2.3 |
| Abdominal body fat (%) | 45.6 | 7.4 | −0.3 | 3.8 | 45.8 | 6.8 | 0.7 | 3.6 |
| Sagittal abdominal diameter (cm) | 19.5 | 1.7 | 0.1 | 1.2 | 19.3 | 1.7 | 0.3 | 0.9 |
| Waist circumference (cm) | 85.4 | 6.4 | −0.1 | 4.2 | 85.6 | 6.8 | 0.0 | 3.2 |
| Hip circumference (cm) | 107.3 | 6.4 | 0.1 | 2.9 | 107.3 | 5.0 | 0.2 | 2.5 |
© 2017 by the authors; licensee MDPI, Basel, Switzerland. This article is an open access article distributed under the terms and conditions of the Creative Commons Attribution (CC-BY) license (http://creativecommons.org/licenses/by/4.0/).
Share and Cite
Kristensen, M.; Pelletier, X.; Ross, A.B.; Thielecke, F. A High Rate of Non-Compliance Confounds the Study of Whole Grains and Weight Maintenance in a Randomised Intervention Trial—The Case for Greater Use of Dietary Biomarkers in Nutrition Intervention Studies. Nutrients 2017, 9, 55. https://doi.org/10.3390/nu9010055
Kristensen M, Pelletier X, Ross AB, Thielecke F. A High Rate of Non-Compliance Confounds the Study of Whole Grains and Weight Maintenance in a Randomised Intervention Trial—The Case for Greater Use of Dietary Biomarkers in Nutrition Intervention Studies. Nutrients. 2017; 9(1):55. https://doi.org/10.3390/nu9010055
Chicago/Turabian StyleKristensen, Mette, Xavier Pelletier, Alastair B. Ross, and Frank Thielecke. 2017. "A High Rate of Non-Compliance Confounds the Study of Whole Grains and Weight Maintenance in a Randomised Intervention Trial—The Case for Greater Use of Dietary Biomarkers in Nutrition Intervention Studies" Nutrients 9, no. 1: 55. https://doi.org/10.3390/nu9010055
APA StyleKristensen, M., Pelletier, X., Ross, A. B., & Thielecke, F. (2017). A High Rate of Non-Compliance Confounds the Study of Whole Grains and Weight Maintenance in a Randomised Intervention Trial—The Case for Greater Use of Dietary Biomarkers in Nutrition Intervention Studies. Nutrients, 9(1), 55. https://doi.org/10.3390/nu9010055