Prevalence of Pre-Diabetes across Ethnicities: A Review of Impaired Fasting Glucose (IFG) and Impaired Glucose Tolerance (IGT) for Classification of Dysglycaemia


Abstract
:1. Introduction
2. Identifying Individuals with Prediabetes
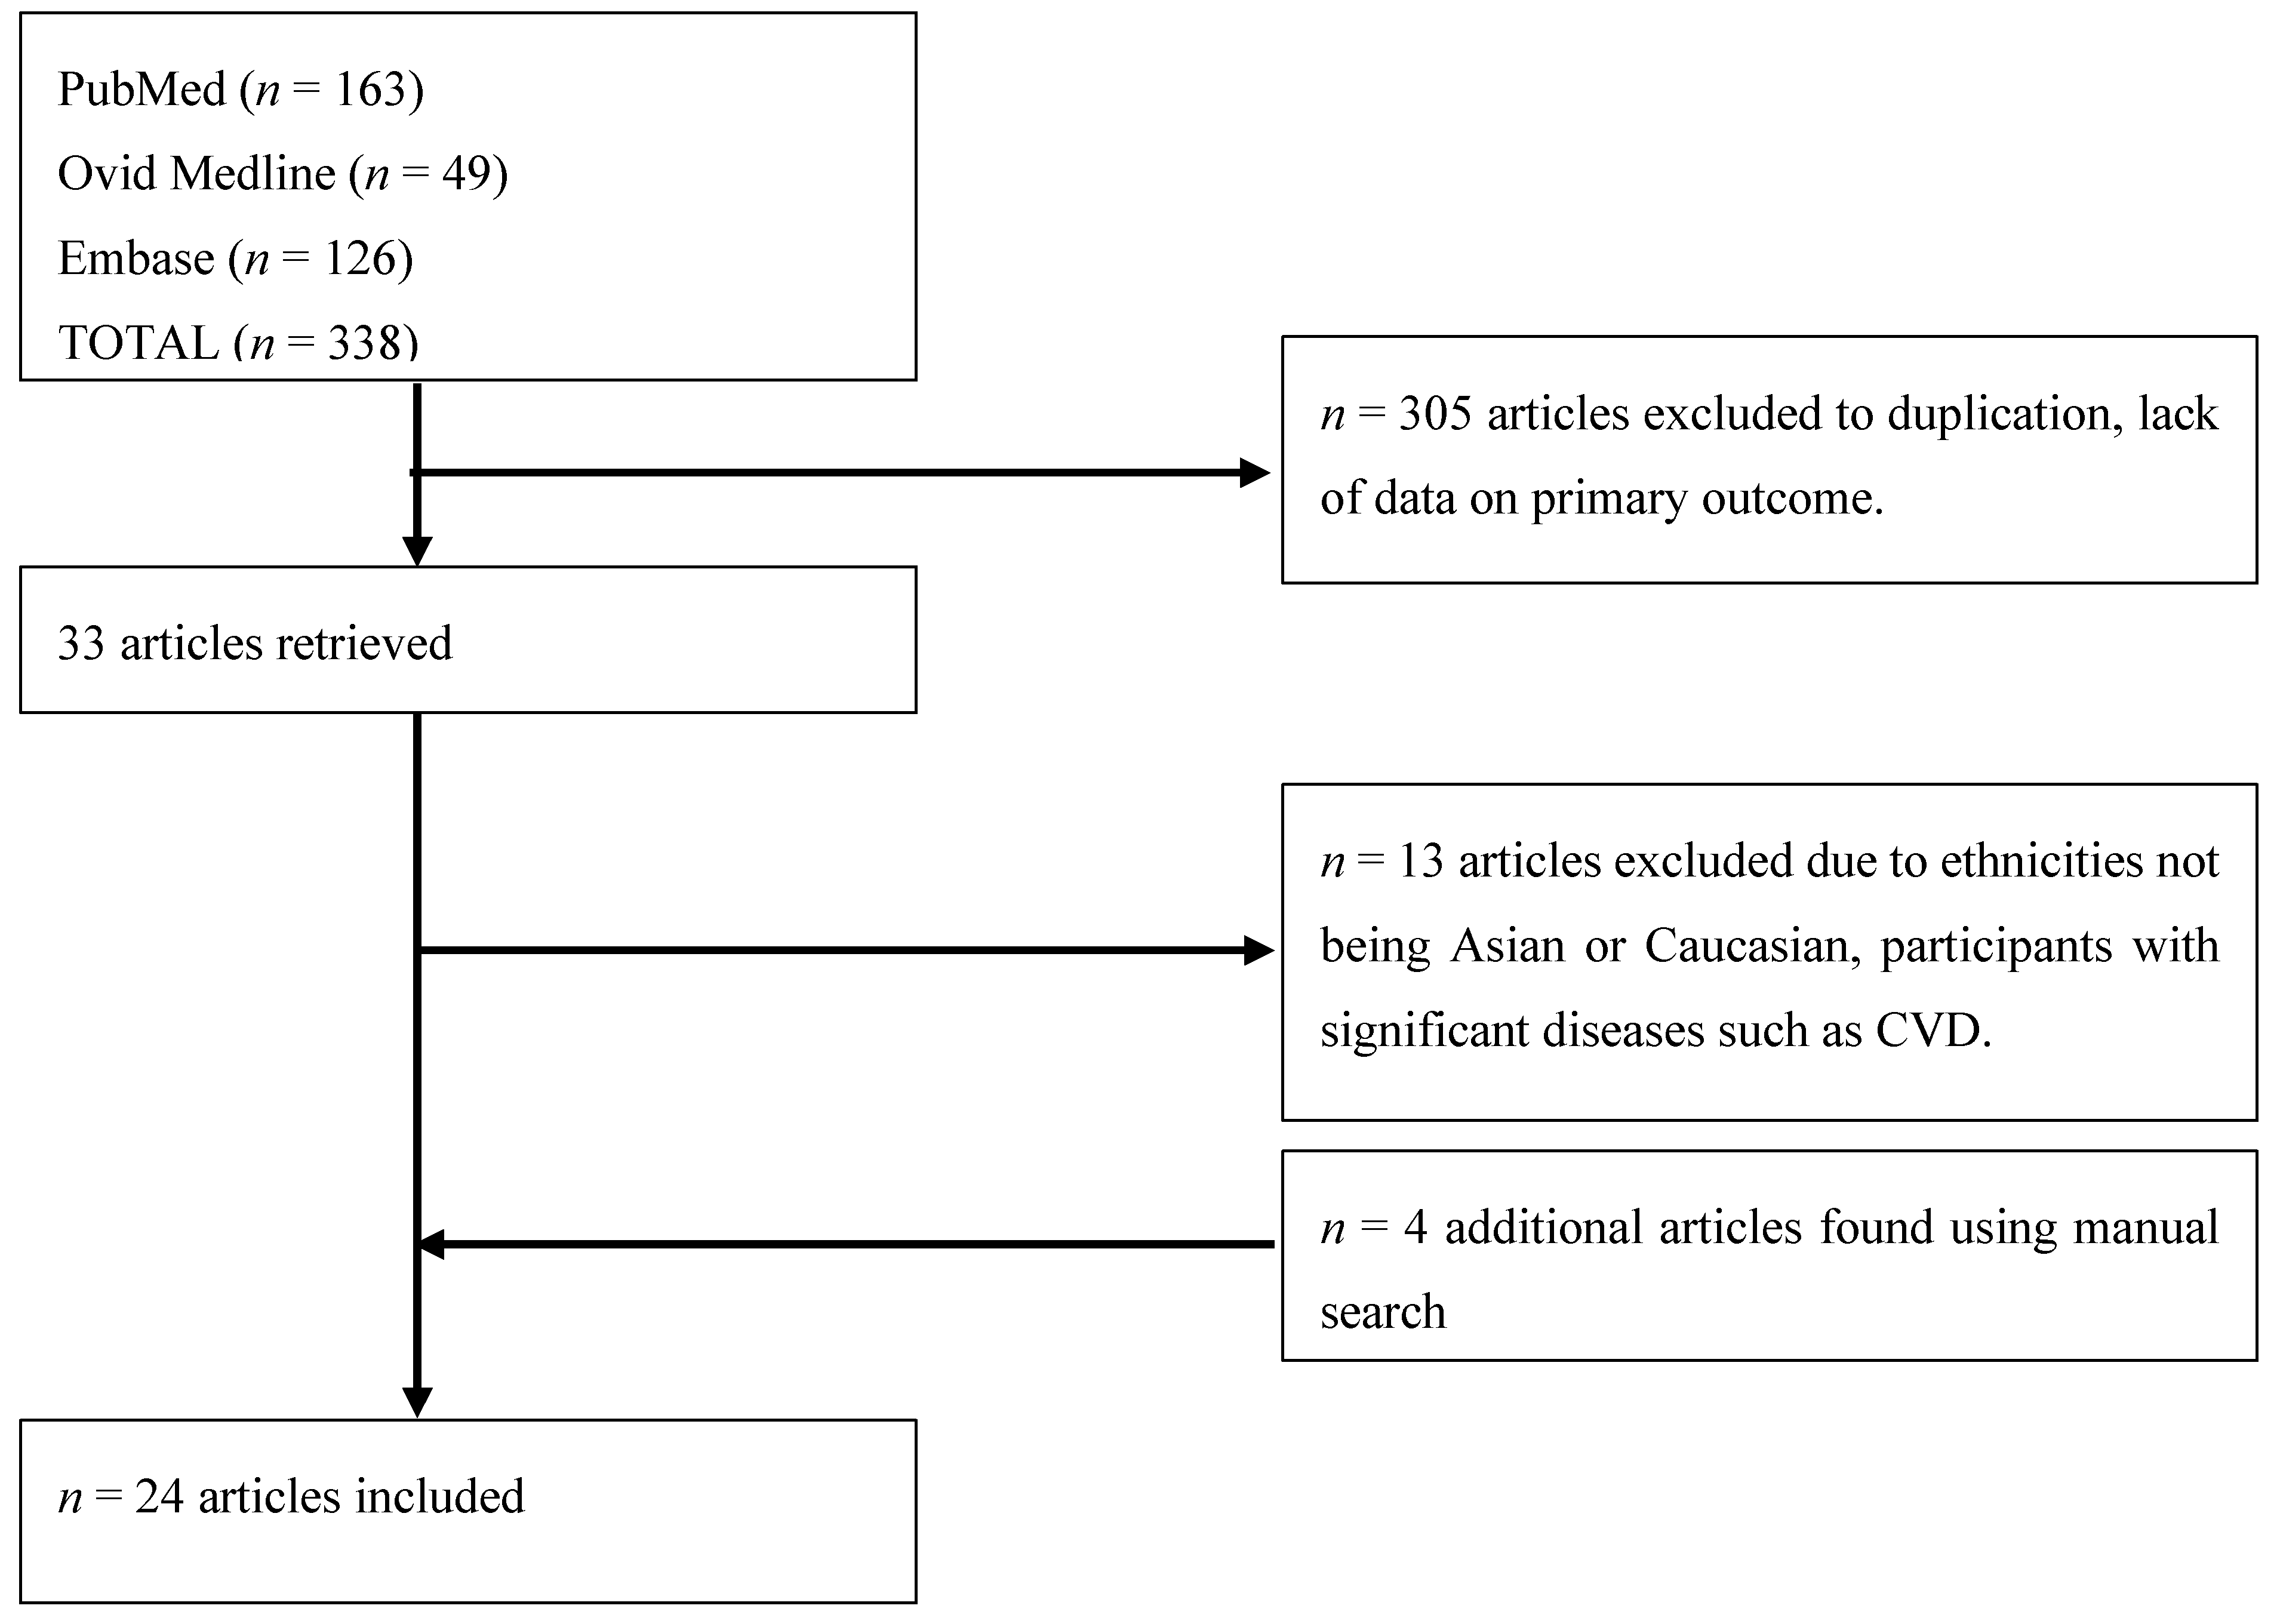
3. Methods
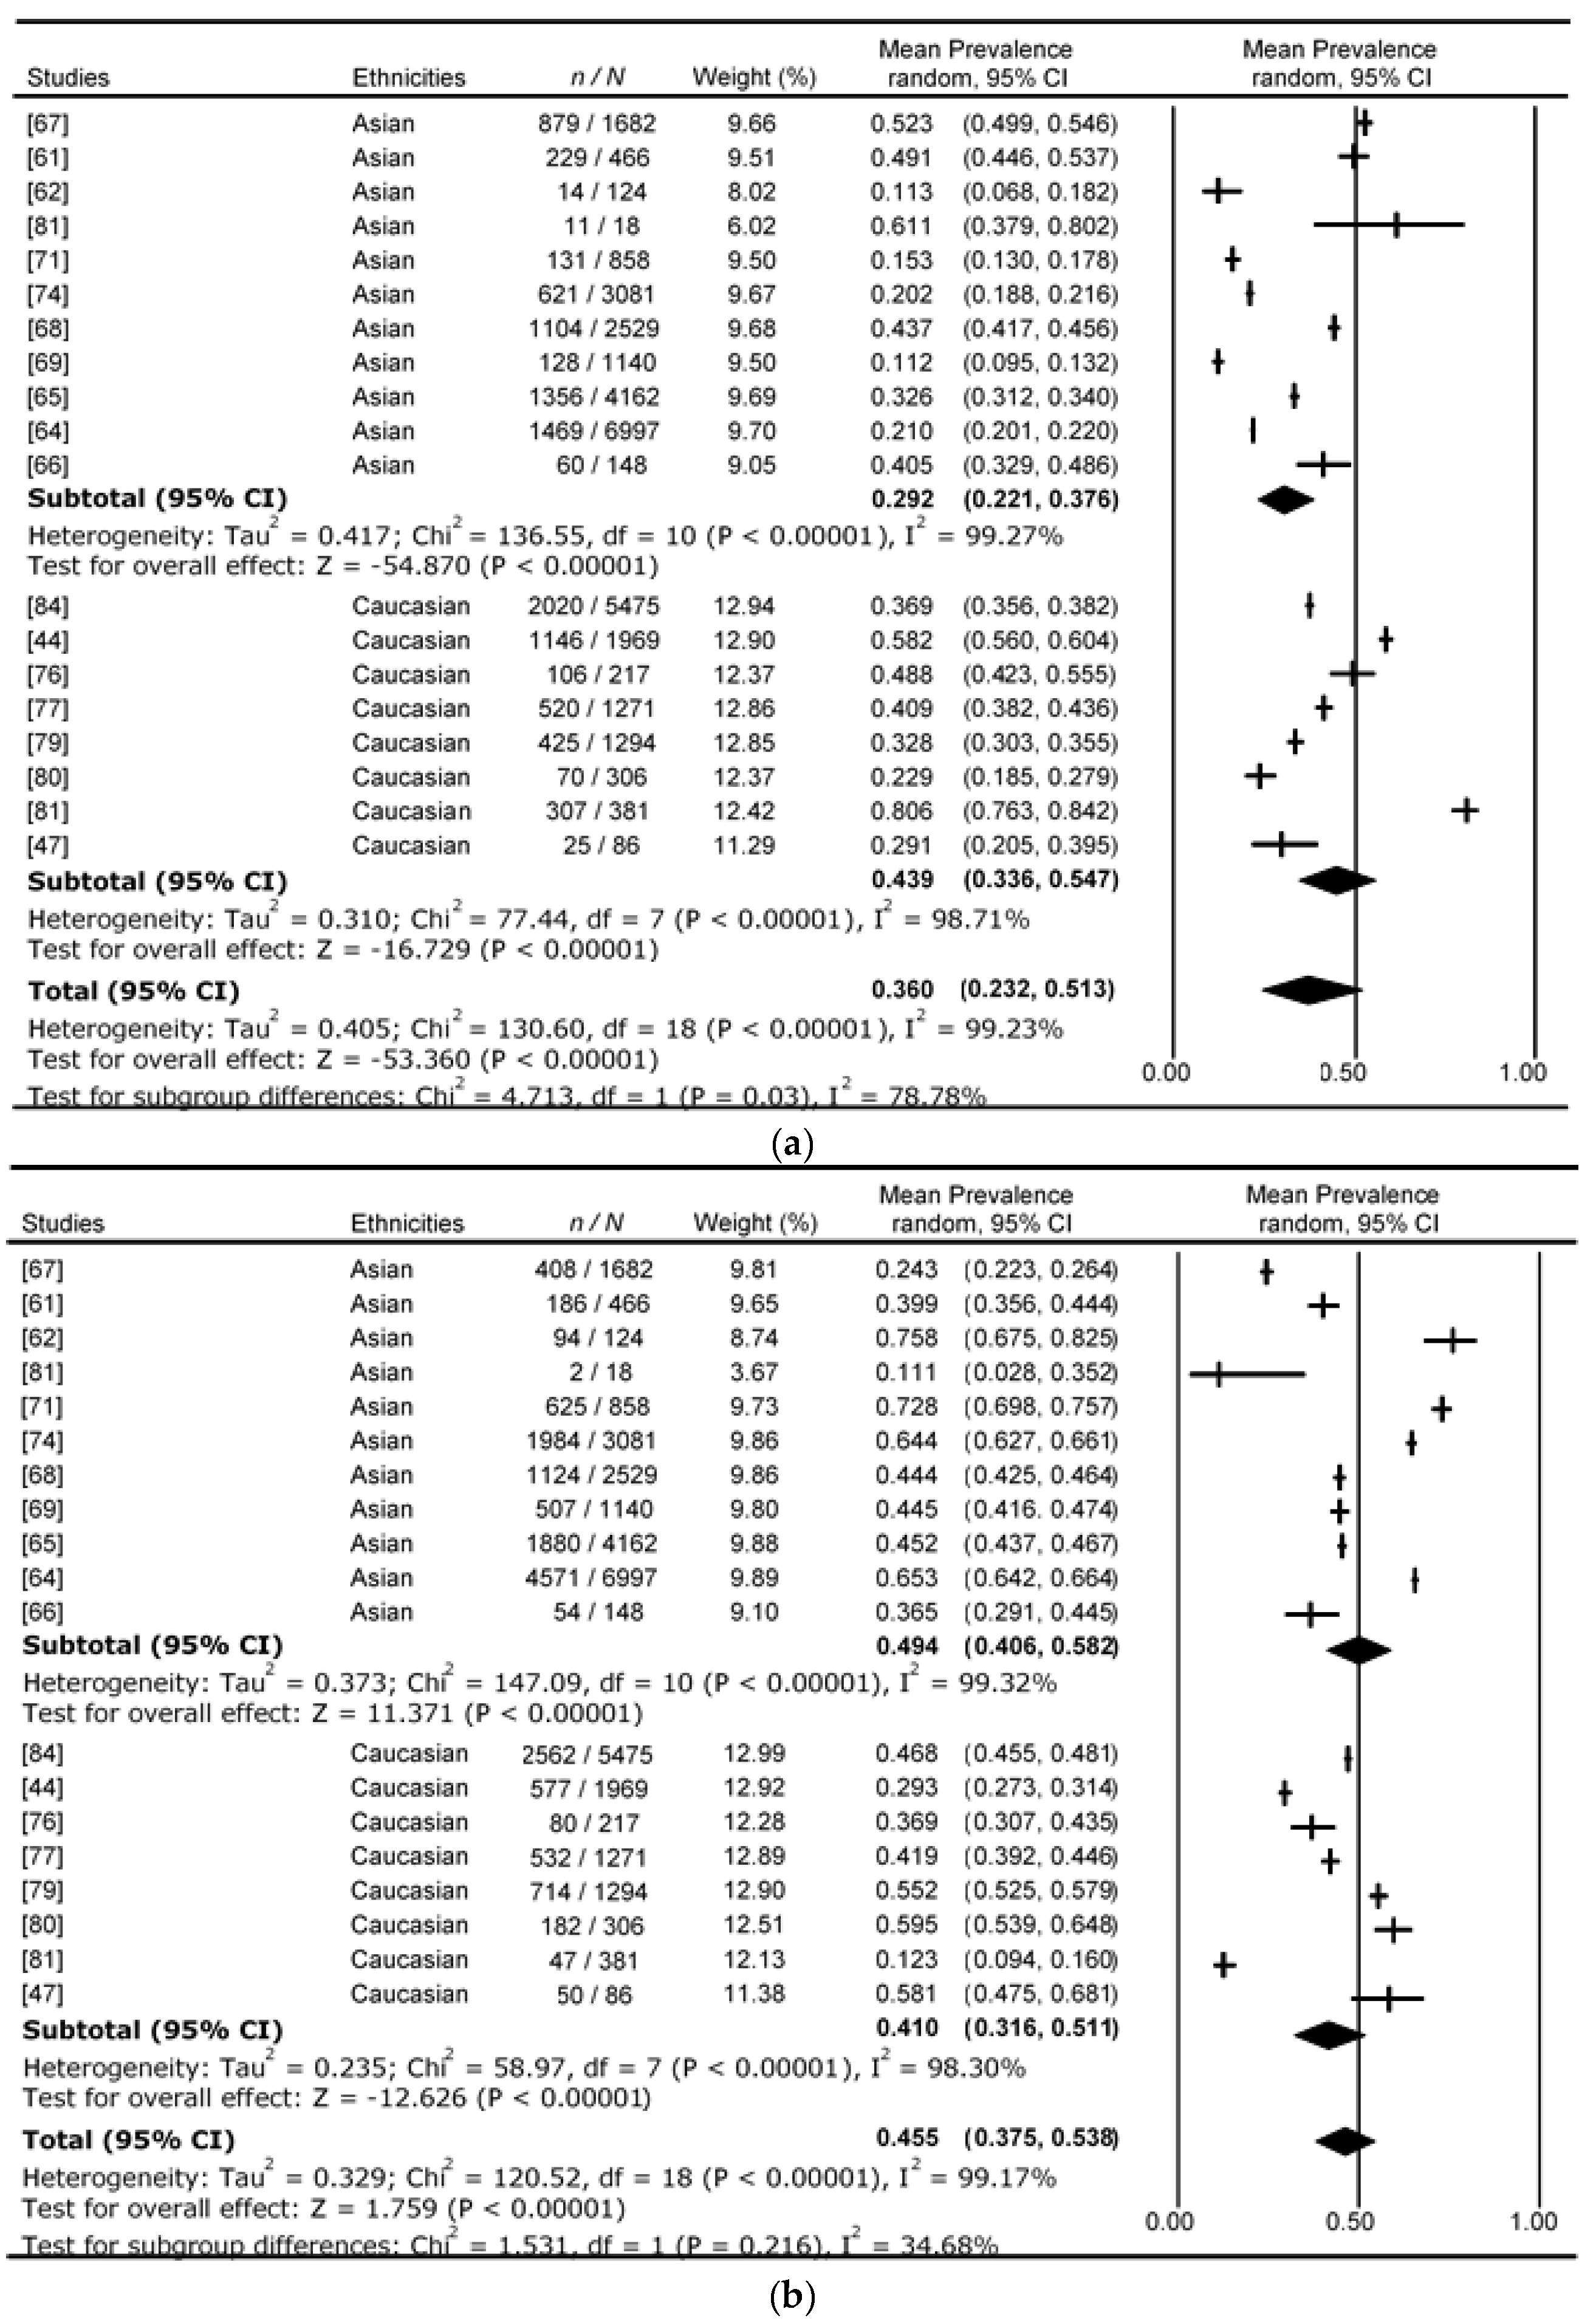
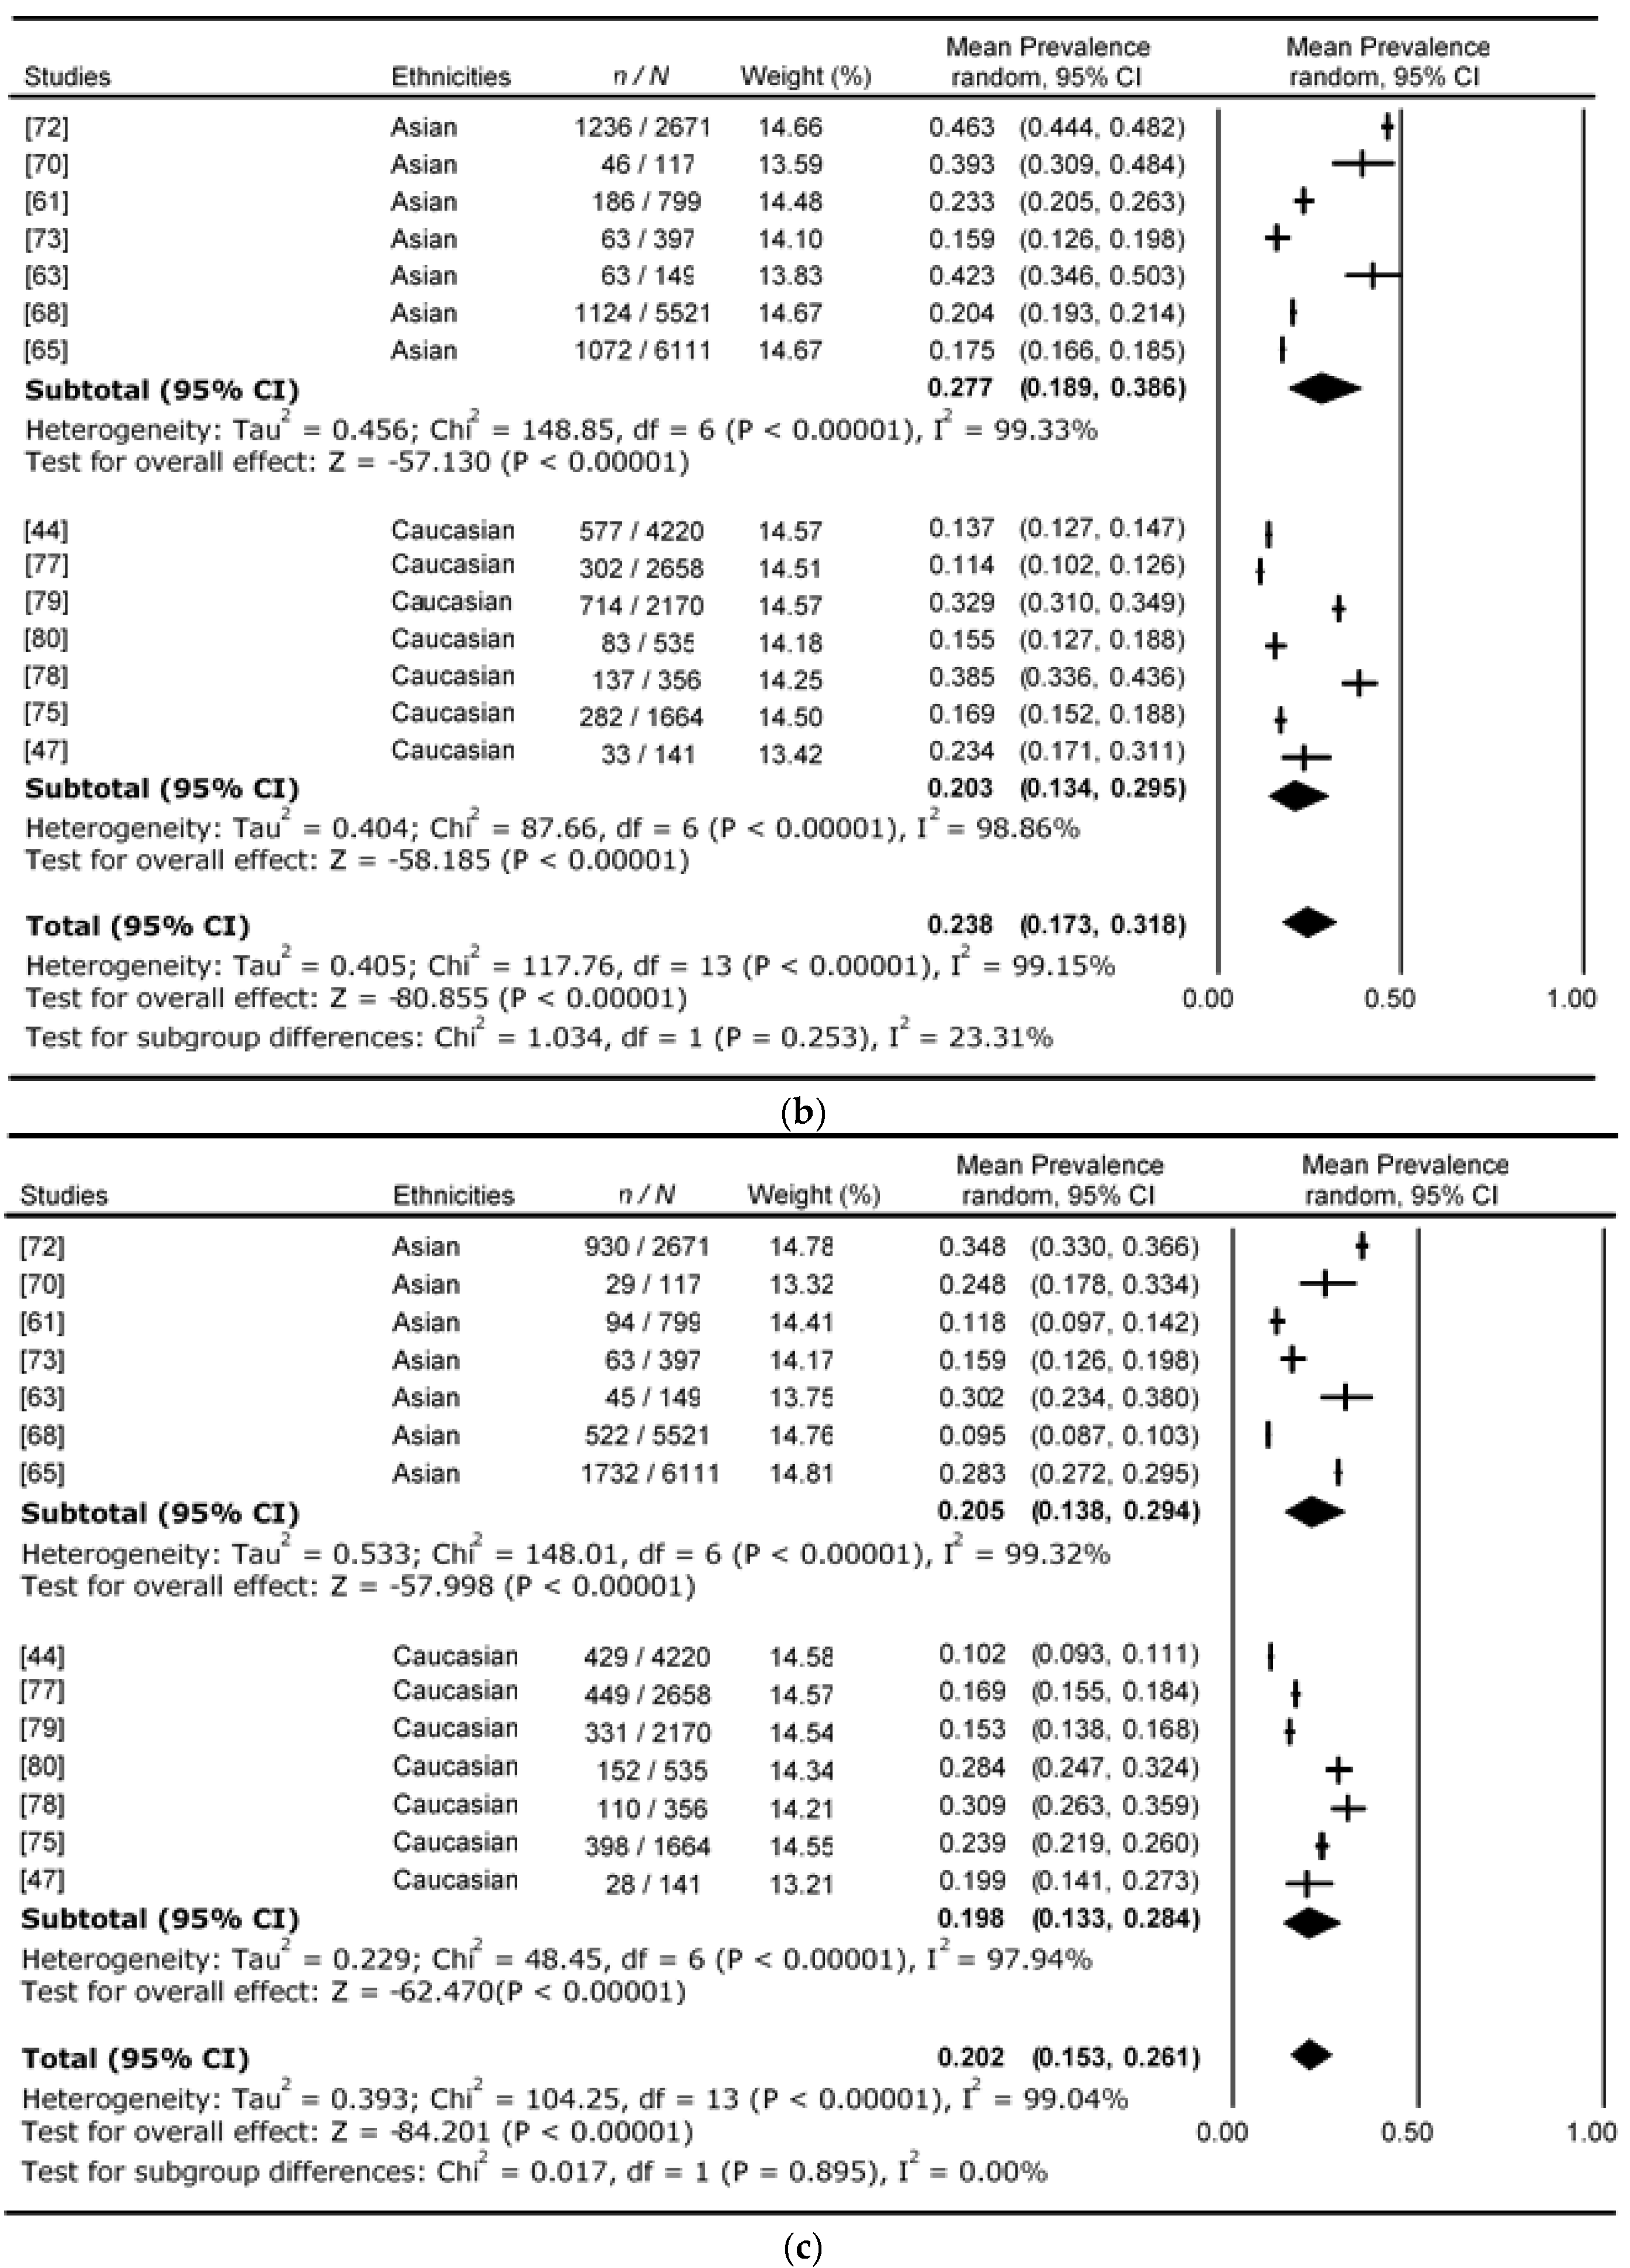
4. Results
5. Discussion
6. Conclusions
Acknowledgments
Author Contributions
Conflicts of Interest
References
- Alberti, K.G.; Zimmet, P.Z. Diabetes: A look to the future. Lancet Diabetes Endocrinol. 2014, 2, e1–e2. [Google Scholar] [CrossRef]
- Zimmet, P.Z.; Magliano, D.J.; Herman, W.H.; Shaw, J.E. Diabetes: A 21st century challenge. Lancet Diabetes Endocrinol. 2014, 2, 56–64. [Google Scholar] [CrossRef]
- Lozano, R.; Naghavi, M.; Foreman, K.; Lim, S.; Shibuya, K.; Aboyans, V.; Abraham, J.; Adair, T.; Aggarwal, R.; Ahn, S.Y.; et al. Global and regional mortality from 235 causes of death for 20 age groups in 1990 and 2010: A systematic analysis for the Global Burden of Disease Study 2010. Lancet 2012, 380, 2095–2128. [Google Scholar] [CrossRef]
- Danaei, G.; Finucane, M.M.; Lu, Y.; Singh, G.M.; Cowan, M.J.; Paciorek, C.J.; Lin, J.K.; Farzadfar, F.; Khang, Y.H.; Stevens, G.A.; et al. National, regional, and global trends in fasting plasma glucose and diabetes prevalence since 1980: Systematic analysis of health examination surveys and epidemiological studies with 370 country-years and 2.7 million participants. Lancet 2011, 378, 31–40. [Google Scholar] [CrossRef]
- Zuo, H.; Shi, Z.; Hussain, A. Prevalence, trends and risk factors for the diabetes epidemic in China: A systematic review and meta-analysis. Diabetes Res. Clin. Pract. 2014, 104, 63–72. [Google Scholar] [CrossRef] [PubMed]
- Yan, S.; Li, J.; Li, S.; Zhang, B.; Du, S.; Gordon-Larsen, P.; Adair, L.; Popkin, B. The expanding burden of cardiometabolic risk in China: The China Health and Nutrition Survey. Obes. Rev. 2012, 13, 810–821. [Google Scholar] [CrossRef] [PubMed]
- Wang, L.; Gao, P.; Zhang, M.; Huang, Z.; Zhang, D.; Deng, Q.; Li, Y.; Zhao, Z.; Qin, X.; Jin, D.; et al. Prevalence and ethnic pattern of diabetes and prediabetes in China in 2013. JAMA 2017, 317, 2515–2523. [Google Scholar] [CrossRef] [PubMed]
- Xu, Y.; Wang, L.; He, J.; Bi, Y.; Li, M.; Wang, T.; Wang, L.; Jiang, Y.; Dai, M.; Lu, J.; et al. Prevalence and control of diabetes in Chinese adults. JAMA 2013, 310, 948–959. [Google Scholar] [CrossRef] [PubMed]
- Shaw, J.E.; Sicree, R.A.; Zimmet, P.Z. Global estimates of the prevalence of diabetes for 2010 and 2030. Diabetes Res. Clin. Pract. 2010, 87, 4–14. [Google Scholar] [CrossRef] [PubMed]
- Nguyen, D.M.; El-Serag, H.B. The epidemiology of obesity. Gastroenterol. Clin. N. Am. 2010, 39, 1–7. [Google Scholar] [CrossRef] [PubMed]
- Ramachandran, A.; Snehalatha, C. Rising burden of obesity in Asia. J. Obes. 2010, 2010. [Google Scholar] [CrossRef] [PubMed]
- Forouhi, N.G.; Wareham, N.J. Epidemiology of diabetes. Medicine 2014, 42, 698–702. [Google Scholar] [CrossRef] [PubMed]
- Ozougwu, J.C.; Obimba, K.C.; Belonwu, C.D.; Unakalamba, C.B. The pathogenesis and pathophysiology of type 1 and type 2 diabetes mellitus. J. Physiol. 2013, 4, 46–57. [Google Scholar] [CrossRef]
- Saponaro, C.; Gaggini, M.; Carli, F.; Gastaldelli, A. The subtle balance between lipolysis and lipogenesis: A critical point in metabolic homeostasis. Nutrients 2015, 7, 9453–9474. [Google Scholar] [CrossRef] [PubMed]
- Akiyama, C. Bridging the gap between two cultures: An analysis on identity attitudes and attachment of Asian Americans. Brief Treat. Crisis Interv. 2008, 8, 251–263. [Google Scholar] [CrossRef]
- Haldar, S.; Chia, S.C.; Henry, C.J. Body composition in Asians and Caucasians: Comparative analyses and influences on cardiometabolic outcomes. Adv. Food Nutr. Res. 2015, 75, 97–154. [Google Scholar] [PubMed]
- Pandit, K.; Goswami, S.; Ghosh, S.; Mukhopadhyay, P.; Chowdhury, S. Metabolic syndrome in South Asians. Indian J. Endocrinol. Metab. 2012, 16, 44–55. [Google Scholar] [CrossRef] [PubMed]
- Ramachandran, A.; Chamukuttan, S.; Shetty, S.A.; Arun, N.; Susairaj, P. Obesity in Asia—Is it different from rest of the world. Diabetes/Metab. Res. Rev. 2012, 28, 47–51. [Google Scholar] [CrossRef] [PubMed]
- Wang, D.; Li, Y.; Lee, S.G.; Wang, L.; Fan, J.; Zhang, G.; Wu, J.; Ji, Y.; Li, S. Ethnic differences in body composition and obesity related risk factors: Study in Chinese and white males living in China. PLoS ONE 2011, 6, e19835. [Google Scholar] [CrossRef] [PubMed] [Green Version]
- Misra, A.; Khurana, L. Obesity-related non-communicable diseases: South Asians vs. White Caucasians. Int. J. Obes. 2011, 35, 167–187. [Google Scholar] [CrossRef] [PubMed]
- Dickinson, S.; Colagiuri, S.; Faramus, E.; Petocz, P.; Brand-Miller, J.C. Postprandial hyperglycemia and insulin sensitivity differ among lean young adults of different ethnicities. J. Nutr. 2002, 132, 2574–2579. [Google Scholar] [PubMed]
- Liew, C.F.; Seah, E.S.; Yeo, K.P.; Lee, K.O.; Wise, S.D. Lean, nondiabetic Asian Indians have decreased insulin sensitivity and insulin clearance, and raised leptin compared to Caucasians and Chinese subjects. Int. J. Obes. 2003, 27, 784–789. [Google Scholar] [CrossRef] [PubMed]
- Zamboni, M.; Rossi, A.P.; Fantin, F.; Budui, S.L.; Zoico, E.; Zamboni, G.A.; Mazzali, G. Predictors of ectopic fat in humans. Curr. Obes. Rep. 2014, 3, 404–413. [Google Scholar] [CrossRef] [PubMed]
- Sattar, N.; Gill, J.M.R. Type 2 diabetes as a disease of ectopic fat? BMC Med. 2014, 12, 123. [Google Scholar] [CrossRef] [PubMed]
- Taylor, R. Type 2 diabetes: Etiology and reversibility. Diabetes Care 2013, 36, 1047–1055. [Google Scholar] [CrossRef] [PubMed]
- Catoi, A.F.; Parvu, A.; Muresan, A.; Busetto, L. Metabolic mechanisms in obesity and type 2 diabetes: Insights from bariatric/metabolic surgery. Obes. Facts 2015, 8, 350–363. [Google Scholar] [CrossRef] [PubMed]
- Kahn, S.E.; Hull, R.L.; Utzschneider, K.M. Mechanisms linking obesity to insulin resistance and type 2 diabetes. Nature 2006, 444, 840–846. [Google Scholar] [CrossRef] [PubMed]
- Cusi, K. The role of adipose tissue and lipotoxicity in the pathogenesis of type 2 diabetes. Curr. Diabetes Rep. 2010, 10, 306–315. [Google Scholar] [CrossRef] [PubMed]
- Sniderman, A.D.; Bhopal, R.; Prabhakaran, D.; Sarrafzadegan, N.; Tchernof, A. Why might South Asians be so susceptible to central obesity and its atherogenic consequences? The adipose tissue overflow hypothesis. Int. J. Epidemiol. 2007, 36, 220–225. [Google Scholar] [CrossRef] [PubMed]
- Torres-Perez, E.; Valero, M.; Garcia-Rodriguez, B.; Gonzalez-Irazabal, Y.; Calmarza, P.; Calvo-Ruata, L.; Ortega, C.; Garcia-Sobreviela, M.P.; Sanz-Paris, A.; Artigas, J.M.; et al. The FAT expandability (FATe) project: Biomarkers to determine the limit of expansion and the complications of obesity. Cardiovasc. Diabetol. 2015, 14, 40. [Google Scholar] [CrossRef] [PubMed]
- Johannsen, D.L.; Tchoukalova, Y.; Tam, C.S.; Covington, J.D.; Xie, W.; Schwarz, J.M.; Bajpeyi, S.; Ravussin, E. Effect of 8 weeks of overfeeding on ectopic fat deposition and insulin sensitivity: Testing the “adipose tissue expandability” hypothesis. Diabetes Care 2014, 37, 2789–2797. [Google Scholar] [CrossRef] [PubMed]
- Kataoka, M.; Venn, B.J.; Williams, S.M.; Te Morenga, L.A.; Heemels, I.M.; Mann, J.I. Glycaemic responses to glucose and rice in people of Chinese and European ethnicity. Diabet. Med. 2013, 30, e101–e107. [Google Scholar] [CrossRef] [PubMed]
- American Diabetes Association. 2. Classification and diagnosis of diabetes. Diabetes Care 2016, 39, S13–S22. [Google Scholar]
- Abdul-Ghani, M.A.; Tripathy, D.; DeFronzo, R.A. Contributions of beta-cell dysfunction and insulin resistance to the pathogenesis of impaired glucose tolerance and impaired fasting glucose. Diabetes Care 2006, 29, 1130–1139. [Google Scholar] [CrossRef] [PubMed]
- Nathan, D.M.; Davidson, M.B.; DeFronzo, R.A.; Heine, R.J.; Henry, R.R.; Pratley, R.; Zinman, B. Impaired fasting glucose and impaired glucose tolerance: Implications for care. Diabetes Care 2007, 30, 753–759. [Google Scholar] [CrossRef] [PubMed]
- Colagiuri, S. Epidemiology of prediabetes. Med. Clin. N. Am. 2011, 95, 299–307. [Google Scholar] [CrossRef] [PubMed]
- Ferrannini, E. Definition of intervention points in prediabetes. Lancet Diabetes Endocrinol. 2014, 2, 667–675. [Google Scholar] [CrossRef]
- Barry, E.; Roberts, S.; Oke, J.; Vijayaraghavan, S.; Normansell, R.; Greenhalgh, T. Efficacy and effectiveness of screen and treat policies in prevention of type 2 diabetes: Systematic review and meta-analysis of screening tests and interventions. BMJ 2017, 356, i6538. [Google Scholar] [CrossRef] [PubMed]
- Sequeira, I.R.; Poppitt, S.D. HbA1c as a marker of prediabetes: A reliable screening tool or not? Insights Nutr. Metabol. 2017, 1, 21–29. [Google Scholar]
- Poppitt, S.D. Hyperglycaemia, pre-diabetes and diabesity: Can we choose who to ‘fast-track’ into diabetes prevention? Curr. Res. Diabetes Obes. 2017, 2, 55590. [Google Scholar]
- Tabak, A.G.; Herder, C.; Rathmann, W.; Brunner, E.J.; Kivimaki, M. Prediabetes: A high-risk state for diabetes development. Lancet 2012, 379, 2279–2290. [Google Scholar] [CrossRef]
- World Health Organization. Definition and Diagnosis of Diabetes Mellitus and Intermediate Hyperglycemia: Report of a WHO/IDF Consultation; World Health Organization: Geneva, Switzerland, 2006. [Google Scholar]
- American Diabetes Association. Diagnosis and classification of diabetes mellitus. Diabetes Care 2010, 33, S62–S69. [Google Scholar]
- Borch-Johnsen, K.; Colagiuri, S.; Balkau, B.; Glumer, C.; Carstensen, B.; Ramachandran, A.; Dong, Y.; Gao, W. Creating a pandemic of prediabetes: The proposed new diagnostic criteria for impaired fasting glycaemia. Diabetologia 2004, 47, 1396–1402. [Google Scholar] [CrossRef] [PubMed]
- Genuth, S. Lowering the criterion for impaired fasting glucose is in order. Diabetes Care 2003, 26, 3331–3332. [Google Scholar] [CrossRef] [PubMed]
- Schriger, D.L.; Lorber, B. Lowering the cut point for impaired fasting glucose: Where is the evidence? Where is the logic? Diabetes Care 2004, 27, 592–601. [Google Scholar] [CrossRef] [PubMed]
- Vaccaro, O.; Riccardi, G. Changing the definition of impaired fasting glucose: Impact on the classification of individuals and risk definition. Diabetes Care 2005, 28, 1786–1788. [Google Scholar] [CrossRef] [PubMed]
- Leiva, E.; Mujica, V.; Orrego, R.; Wehinger, S.; Soto, A.; Icaza, G.; Vasquez, M.; Diaz, L.; Andrews, M.; Arredondo, M. Subjects with impaired fasting glucose: Evolution in a period of 6 years. J. Diabetes Res. 2014, 2014, 710370. [Google Scholar] [CrossRef] [PubMed]
- DECODE Study Group. Is fasting glucose sufficient to define diabetes? Epidemiological data from 20 European studies. Diabetologia 1999, 42, 647–654. [Google Scholar]
- DECODE Study Group. Will new diagnostic criteria for diabetes mellitus change phenotype of patients with diabetes? Reanalysis of European epidemiological data. Br. Med. J. 1998, 317, 371–375. [Google Scholar]
- Block, G.; Azar, K.M.; Romanelli, R.J.; Block, T.J.; Hopkins, D.; Carpenter, H.A.; Dolginsky, M.S.; Hudes, M.L.; Palaniappan, L.P.; Block, C.H. Diabetes prevention and weight loss with a fully automated behavioral intervention by email, web, and mobile phone: A randomized controlled trial among persons with prediabetes. J. Med. Internet Res. 2015, 17, e240. [Google Scholar] [CrossRef] [PubMed]
- de Kreutzenberg, S.V.; Ceolotto, G.; Cattelan, A.; Pagnin, E.; Mazzucato, M.; Garagnani, P.; Borelli, V.; Bacalini, M.G.; Franceschi, C.; Fadini, G.P.; et al. Metformin improves putative longevity effectors in peripheral mononuclear cells from subjects with prediabetes: A randomized controlled trial. Nutr. Metab. Cardiovasc. Dis. 2015, 25, 686–693. [Google Scholar] [CrossRef] [PubMed]
- Hernandez-Alonso, P.; Salas-Salvado, J.; Baldrich-Mora, M.; Juanola-Falgarona, M.; Bullo, M. Beneficial effect of pistachio consumption on glucose metabolism, insulin resistance, inflammation, and related metabolic risk markers: A randomized clinical trial. Diabetes Care 2014, 37, 3098–3105. [Google Scholar] [CrossRef] [PubMed]
- Liu, W.Y.; Lu, D.J.; Du, X.M.; Sun, J.Q.; Ge, J.; Wang, R.W.; Wang, R.; Zou, J.; Xu, C.; Ren, J.; et al. Effect of aerobic exercise and low carbohydrate diet on pre-diabetic non-alcoholic fatty liver disease in postmenopausal women and middle aged men—The role of gut microbiota composition: Study protocol for the AELC randomized controlled trial. BMC Public Health 2014, 14, 48. [Google Scholar] [CrossRef] [PubMed] [Green Version]
- Marinik, E.L.; Kelleher, S.; Savla, J.; Winett, R.A.; Davy, B.M. The Resist Diabetes trial: Rationale, design, and methods of a hybrid efficacy/effectiveness intervention trial for resistance training maintenance to improve glucose homeostasis in older prediabetic adults. Contemp. Clin. Trials 2014, 37, 19–32. [Google Scholar] [CrossRef] [PubMed]
- Parker, A.R.; Byham-Gray, L.; Denmark, R.; Winkle, P.J. The effect of medical nutrition therapy by a registered dietitian nutritionist in patients with prediabetes participating in a randomized controlled clinical research trial. J. Acad. Nutr. Diet. 2014, 114, 1739–1748. [Google Scholar] [CrossRef] [PubMed]
- Perez, A.; Alos, V.A.; Scanlan, A.; Maia, C.M.; Davey, A.; Whitaker, R.C.; Foster, G.D.; Ackermann, R.T.; O’Brien, M.J. The rationale, design, and baseline characteristics of PREVENT-DM: A community-based comparative effectiveness trial of lifestyle intervention and metformin among Latinas with prediabetes. Contemp. Clin. Trials 2015, 45, 320–327. [Google Scholar] [CrossRef] [PubMed]
- Perreault, L.; Temprosa, M.; Mather, K.J.; Horton, E.; Kitabchi, A.; Larkin, M.; Montez, M.G.; Thayer, D.; Orchard, T.J.; Hamman, R.F.; et al. Regression from prediabetes to normal glucose regulation is associated with reduction in cardiovascular risk: Results from the Diabetes Prevention Program outcomes study. Diabetes Care 2014, 37, 2622–2631. [Google Scholar] [CrossRef] [PubMed]
- Ramirez, C.E.; Nian, H.; Yu, C.; Gamboa, J.L.; Luther, J.M.; Brown, N.J.; Shibao, C.A. Treatment with sildenafil improves insulin sensitivity in prediabetes: A randomized, controlled trial. J. Clin. Endocrinol. Metab. 2015, 100, 4533–4540. [Google Scholar] [CrossRef] [PubMed]
- Rasekhi, H.; Karandish, M.; Jalali, M.T.; Mohammad-Shahi, M.; Zarei, M.; Saki, A.; Shahbazian, H. The effect of vitamin K1 supplementation on sensitivity and insulin resistance via osteocalcin in prediabetic women: A double-blind randomized controlled clinical trial. Eur. J. Clin. Nutr. 2015, 69, 891–895. [Google Scholar] [CrossRef] [PubMed]
- Dong, Y.H.; Gao, W.G.; Nan, H.R.; for the Qingdao Epidemiology Study Group. The prevalence of diabetes and the risk factor in Chinese population in Qingdao city. 18th International Diabetes Federation Congress, Paris, France, 24–29 August 2003. Diabetes Metab. 2003, 29, 4S21. [Google Scholar]
- Ko, G.T.; Chan, J.C.; Woo, J.; Cockram, C.S. Use of the 1997 American Diabetes Association diagnostic criteria for diabetes in a Hong Kong Chinese population. Diabetes Care 1998, 21, 2094–2097. [Google Scholar] [CrossRef] [PubMed]
- Liu, W.; Hua, L.; Liu, W.F.; Song, H.L.; Dai, X.W.; Yang, J.K. The prevalence of glucose metabolism disturbances in Chinese Muslims and possible risk factors: A study from northwest China. Arq. Bras. Endocrinol. Metabol. 2014, 58, 715–723. [Google Scholar] [CrossRef] [PubMed]
- Yang, W.; Lu, J.; Weng, J.; Jia, W.; Ji, L.; Xiao, J.; Shan, Z.; Liu, J.; Tian, H.; Ji, Q.; et al. Prevalence of diabetes among men and women in China. N. Engl. J. Med. 2010, 362, 1090–1101. [Google Scholar] [CrossRef] [PubMed]
- Yang, Z.J.; Yang, W.Y.; Xiao, J.Z.; Li, G.W.; Wang, Y. Impact of lowering the cut-point for impaired fasting glucose on the distribution of impaired glucose regulation subcategories in Chinese adult population. Zhonghua Yi Xue Za Zhi 2004, 84, 1773–1776. [Google Scholar] [PubMed]
- Zhuang, Q.; Wu, L.; Lu, Y.; Du, J.; Guo, G. Awareness and intervention status of prediabetes among Chinese adults: Implications from a community-based investigation. Int. J. Clin. Exp. Med. 2015, 8, 4480–4486. [Google Scholar] [PubMed]
- Anjana, R.M.; Pradeepa, R.; Deepa, M.; Datta, M.; Sudha, V.; Unnikrishnan, R.; Bhansali, A.; Joshi, S.R.; Joshi, P.P.; Yajnik, C.S.; et al. Prevalence of diabetes and prediabetes (impaired fasting glucose and/or impaired glucose tolerance) in urban and rural India: Phase I results of the Indian Council of Medical Research-INdia DIABetes (ICMR-INDIAB) study. Diabetologia 2011, 54, 3022–3027. [Google Scholar] [CrossRef] [PubMed]
- Ramachandran, A.; Snehalatha, C.; Kapur, A.; Vijay, V.; Mohan, V.; Das, A.K.; Rao, P.V.; Yajnik, C.S.; Prasanna Kumar, K.M.; Nair, J.D. High prevalence of diabetes and impaired glucose tolerance in India: National Urban Diabetes Survey. Diabetologia 2001, 44, 1094–1101. [Google Scholar] [CrossRef] [PubMed]
- Sadikot, S.M.; Nigam, A.; Das, S.; Bajaj, S.; Zargar, A.H.; Prasannakumar, K.M.; Sosale, A.; Munichoodappa, C.; Seshiah, V.; Singh, S.K.; et al. Comparing the ADA 1997 and the WHO 1999 criteria: Prevalence of Diabetes in India Study (PODIS). Diabetes Res. Clin. Pract. 2004, 66, 309–315. [Google Scholar] [CrossRef] [PubMed]
- Chew, W.F.; Rokiah, P.; Chan, S.P.; Chee, W.S.; Lee, L.F.; Chan, Y.M. Prevalence of glucose intolerance, and associated antenatal and historical risk factors among Malaysian women with a history of gestational diabetes mellitus. Singap. Med. J. 2012, 53, 814–820. [Google Scholar]
- Mustafa, N.; Kamarudin, N.A.; Ismail, A.A.; Khir, A.S.; Ismail, I.S.; Musa, K.I.; Kadir, K.A.; Yaacob, N.A.; Ali, O.; Isa, S.H.; et al. Prevalence of abnormal glucose tolerance and risk factors in urban and rural Malaysia. Diabetes Care 2011, 34, 1362–1364. [Google Scholar] [CrossRef] [PubMed]
- Aekplakorn, W.; Tantayotai, V.; Numsangkul, S.; Sripho, W.; Tatsato, N.; Burapasiriwat, T.; Pipatsart, R.; Sansom, P.; Luckanajantachote, P.; Chawarokorn, P.; et al. Detecting prediabetes and diabetes: Agreement between fasting plasma glucose and oral glucose tolerance test in Thai adults. J. Diabetes Res. 2015, 2015, 396505. [Google Scholar] [CrossRef] [PubMed]
- Lee, J.E.; Jung, S.C.; Jung, G.H.; Ha, S.W.; Kim, B.W.; Chae, S.C.; Park, W.H.; Lim, J.S.; Yang, J.H.; Kam, S.; et al. Prevalence of diabetes mellitus and prediabetes in Dalseong-gun, Daegu City, Korea. Diabetes Metab. J. 2011, 35, 255–263. [Google Scholar] [CrossRef] [PubMed]
- Qiao, Q.; Nakagami, T.; Tuomilehto, J.; Borch-Johnsen, K.; Balkau, B.; Iwamoto, Y.; Tajima, N. Comparison of the fasting and the 2-h glucose criteria for diabetes in different Asian cohorts. Diabetologia 2000, 43, 1470–1475. [Google Scholar] [CrossRef] [PubMed]
- Tamayo, T.; Schipf, S.; Meisinger, C.; Schunk, M.; Maier, W.; Herder, C.; Roden, M.; Nauck, M.; Peters, A.; Volzke, H.; et al. Regional differences of undiagnosed type 2 diabetes and prediabetes prevalence are not explained by known risk factors. PLoS ONE 2014, 9, e113154. [Google Scholar] [CrossRef] [PubMed]
- de Vegt, F.; Dekker, J.M.; Jager, A.; Hienkens, E.; Kostense, P.J.; Stehouwer, C.D.; Nijpels, G.; Bouter, L.M.; Heine, R.J. Relation of impaired fasting and postload glucose with incident type 2 diabetes in a Dutch population: The Hoorn Study. JAMA 2001, 285, 2109–2113. [Google Scholar] [CrossRef] [PubMed] [Green Version]
- Glumer, C.; Jorgensen, T.; Borch-Johnsen, K. Prevalences of diabetes and impaired glucose regulation in a Danish population: The Inter99 study. Diabetes Care 2003, 26, 2335–2340. [Google Scholar] [CrossRef] [PubMed]
- Marini, M.A.; Succurro, E.; Castaldo, E.; Cufone, S.; Arturi, F.; Sciacqua, A.; Lauro, R.; Hribal, M.L.; Perticone, F.; Sesti, G. Cardiometabolic risk profiles and carotid atherosclerosis in individuals with prediabetes identified by fasting glucose, postchallenge glucose, and hemoglobin A1c criteria. Diabetes Care 2012, 35, 1144–1149. [Google Scholar] [CrossRef] [PubMed] [Green Version]
- Harris, M.I.; Flegal, K.M.; Cowie, C.C.; Eberhardt, M.S.; Goldstein, D.E.; Little, R.R.; Wiedmeyer, H.M.; Byrd-Holt, D.D. Prevalence of diabetes, impaired fasting glucose, and impaired glucose tolerance in U.S. adults. The Third National Health and Nutrition Examination Survey, 1988–1994. Diabetes Care 1998, 21, 518–524. [Google Scholar] [CrossRef] [PubMed]
- Karve, A.; Hayward, R.A. Prevalence, diagnosis, and treatment of impaired fasting glucose and impaired glucose tolerance in nondiabetic U.S. adults. Diabetes Care 2010, 33, 2355–2359. [Google Scholar] [CrossRef] [PubMed]
- Metcalf, P.A.; Scragg, R.K. Comparison of WHO and ADA criteria for diagnosis of glucose status in adults. Diabetes Res. Clin. Pract. 2000, 49, 169–180. [Google Scholar] [CrossRef]
- Begg, C.B.; Mazumdar, M. Operating characteristics of a rank correlation test for publication bias. Biometrics 1994, 50, 1088–1099. [Google Scholar] [CrossRef] [PubMed]
- Egger, M.; Smith, G.D.; Schneider, M.; Minder, C. Bias in meta-analysis detected by a simple, graphical test. Br. Med. J. 1997, 315, 629–634. [Google Scholar] [CrossRef]
- Balkau, B. The DECODE study. Diabetes epidemiology: Collaborative analysis of diagnostic criteria in Europe. Diabetes Metab. 2000, 26, 282–286. [Google Scholar] [PubMed]
- Kim, S.H.; Shim, W.S.; Kim, E.A.; Kim, E.J.; Lee, S.H.; Hong, S.B.; Kim, Y.S.; Park, S.G.; Leem, J.H.; Lee, H.J.; et al. The effect of lowering the threshold for diagnosis of impaired fasting glucose. Yonsei Med. J. 2008, 49, 217–223. [Google Scholar] [CrossRef] [PubMed]
- Sesti, G.; Andreozzi, F.; Bonadonna, R.C.; De Mattia, G.; Leonetti, F.; Luzi, L.; Marini, M.A.; Natali, A.; Vettor, R.; Bonora, E. Impact of lowering the criterion for impaired fasting glucose on identification of individuals with insulin resistance. The GISIR database. Diabetes Metab. Res. Rev. 2008, 24, 130–136. [Google Scholar] [CrossRef] [PubMed]
- Andreozzi, F.; Succurro, E.; Mancuso, M.R.; Perticone, M.; Sciacqua, A.; Perticone, F.; Sesti, G. Metabolic and cardiovascular risk factors in subjects with impaired fasting glucose: The 100 versus 110 mg/dL threshold. Diabetes Metab. Res. Rev. 2007, 23, 547–550. [Google Scholar] [CrossRef] [PubMed]
- Phillips, L.S.; Weintraub, W.S.; Ziemer, D.C.; Kolm, P.; Foster, J.K.; Vaccarino, V.; Rhee, M.K.; Budhwani, R.K.; Caudle, J.M. All pre-diabetes is not the same: Metabolic and vascular risks of impaired fasting glucose at 100 versus 110 mg/dL: The Screening for Impaired Glucose Tolerance study 1 (SIGT 1). Diabetes Care 2006, 29, 1405–1407. [Google Scholar] [CrossRef] [PubMed]
- Davidson, M.B.; Landsman, P.B.; Alexander, C.M. Lowering the criterion for impaired fasting glucose will not provide clinical benefit. Diabetes Care 2003, 26, 3329–3330. [Google Scholar] [CrossRef] [PubMed]
- Perreault, L.; Bergman, B.C.; Playdon, M.C.; Dalla Man, C.; Cobelli, C.; Eckel, R.H. Impaired fasting glucose with or without impaired glucose tolerance: Progressive or parallel states of prediabetes? Am J. Physiol. Endocrinol. Metab. 2008, 295, E428–E435. [Google Scholar] [CrossRef] [PubMed]
- DeFronzo, R.A.; Tripathy, D. Skeletal muscle insulin resistance is the primary defect in type 2 diabetes. Diabetes Care 2009, 32, S157–S163. [Google Scholar] [CrossRef] [PubMed]
- Taylor, R. Insulin resistance and type 2 diabetes. Diabetes 2012, 61, 778–779. [Google Scholar] [CrossRef] [PubMed]
- WHO Expert Consultation. Appropriate body-mass index for Asian populations and its implications for policy and intervention strategies. Lancet 2004, 363, 157–163. [Google Scholar]
- Thomas, E.L.; Parkinson, J.R.; Frost, G.S.; Goldstone, A.P.; Dore, C.J.; McCarthy, J.P.; Collins, A.L.; Fitzpatrick, J.A.; Durighel, G.; Taylor-Robinson, S.D.; et al. The missing risk: MRI and MRS Phenotyping of abdominal adiposity and ectopic fat. Obesity (Silver Spring) 2012, 20, 76–87. [Google Scholar] [CrossRef] [PubMed]
- Ahmed, M. Non-alcoholic fatty liver disease in 2015. World J. Hepatol. 2015, 7, 1450–1459. [Google Scholar] [CrossRef] [PubMed]
- Masarone, M.; Federico, A.; Abenavoli, L.; Loguercio, C.; Persico, M. Non alcoholic fatty liver: Epidemiology and natural history. Rev. Recent Clin. Trials 2014, 9, 126–133. [Google Scholar] [CrossRef] [PubMed]
- Ranasinghe, C.D.; Ranasinghe, P.; Jayawardena, R.; Misra, A. Physical activity patterns among South-Asian adults: A systematic review. Int. J. Behav. Nutr. Phys. Act. 2013, 10, 116. [Google Scholar] [CrossRef] [PubMed]
- Balkau, B.; Mhamdi, L.; Oppert, J.M.; Nolan, J.; Golay, A.; Porcellati, F.; Laakso, M.; Ferrannini, E. Physical activity and insulin sensitivity: The RISC study. Diabetes 2008, 57, 2613–2618. [Google Scholar] [CrossRef] [PubMed]
- Turcotte, L.P.; Fisher, J.S. Skeletal muscle insulin resistance: Roles of fatty acid metabolism and exercise. Phys. Ther. 2008, 88, 1279–1296. [Google Scholar] [CrossRef] [PubMed]
- Egger, G.; Dixon, J. Beyond obesity and lifestyle: A review of 21st century chronic disease determinants. BioMed Res. Int. 2014, 2014, 731685. [Google Scholar] [CrossRef] [PubMed]
- Tan, V.M.; Lee, Y.S.; Venkataraman, K.; Khoo, E.Y.; Tai, E.S.; Chong, Y.S.; Gluckman, P.; Leow, M.K.; Khoo, C.M. Ethnic differences in insulin sensitivity and beta-cell function among Asian men. Nutr. Diabetes 2015, 5, e173. [Google Scholar] [CrossRef] [PubMed]
- Xu, S.; Ming, J.; Yang, C.; Gao, B.; Wan, Y.; Xing, Y.; Zhang, L.; Ji, Q. Urban, semi-urban and rural difference in the prevalence of metabolic syndrome in Shaanxi province, Northwestern China: A population-based survey. BMC Public Health 2014, 14, 104. [Google Scholar] [CrossRef] [PubMed]


| Classification | FPG Range for IFG (mmol/L) | 2 h Glucose at OGTT Range for IGT (mmol/L) |
|---|---|---|
| WHO1999 [42] | 6.1–6.9 | 7.8–11.0 |
| ADA2003 [43] | 5.6–6.9 | 7.8–11.0 |
| Studies | Ethnicity | Mean Age (Years) | Mean BMI (kg/m2) | Total Number of Prediabetes (n) | i-IFG | i-IGT | IFG & IGT |
|---|---|---|---|---|---|---|---|
| Harris et al., 1998 [79] | Caucasian | 56 | 27.8 | 1294 | 32.88% | 55.16% | 11.96% |
| Balkau et al., 2000 [84] | Caucasian | - | - | 5475 | 36.89% | 46.79% | 16.31% |
| Metcalf et al., 2000 [81] | Caucasian | - | - | 381 | 80.58% | 12.34% | 7.09% |
| de Vegt et al., 2001 [76] | Caucasian | - | - | 217 | 48.85% | 36.87% | 14.29% |
| Glumer et al., 2003 [77] | Caucasian | 49 | 28.4 | 1271 | 40.91% | 41.86% | 17.23% |
| Borch-Johnsen et al., 2004 [44] | Caucasian | 49 | 26.0 | 1969 | 58.21% | 29.29% | 12.50% |
| Vaccaro et al., 2005 [47] | Caucasian | - | - | 86 | 29.07% | 58.14% | 12.79% |
| Karve et al., 2010 [80] | Caucasian | 49 | 30.7 | 306 | 22.73% | 59.60% | 17.68% |
| Ko et al., 1998 [62] | Asian | 38 | 23.3 | 124 | 11.29% | 75.81% | 12.90% |
| Metcalf et al., 2000 [81] | Asian | - | - | 18 | 61.11% | 11.11% | 27.78% |
| Qiao et al., 2000 [74] | Asian | 53 | 23.8 | 3081 | 20.16% | 64.39% | 15.45% |
| Ramachandran et al., 2001 [68] | Asian | 49 | 23.1 | 2529 | 43.65% | 44.44% | 11.90% |
| Dong et al., 2003 [61] | Asian | 54 | 26.4 | 466 | 49.22% | 39.92% | 10.85% |
| Sadikot et al., 2004 [69] | Asian | - | - | 1140 | 11.23% | 44.47% | 44.30% |
| Yang et al., 2004 [65] | Asian | - | - | 4162 | 32.57% | 45.18% | 22.25% |
| Yang et al., 2010 [64] | Asian | 51 | 25.3 | 6997 | 20.99% | 65.33% | 13.68% |
| Anjana et al., 2011 [67] | Asian | - | - | 1682 | 52.26% | 24.24% | 23.50% |
| Mustafa et al., 2011 [71] | Asian | 50 | 26.9 | 858 | 15.27% | 72.84% | 11.89% |
| Zhuang et al., 2015 [66] | Asian | 52 | 23.8 | 148 | 40.54% | 36.49% | 22.97% |
| TOTAL | 32,204 |
| Studies | Ethnicity | Mean Age (Years) | Mean BMI (kg/m2) | Total Number of Prediabetes (n) | i-IFG | i-IGT | IFG & IGT |
|---|---|---|---|---|---|---|---|
| Harris et al., 1998 [79] | Caucasian | 56 | 27.8 | 2170 | 51.86% | 32.90% | 15.24% |
| Glumer et al., 2003 [77] | Caucasian | 47 | 27.0 | 2658 | 71.75% | 11.36% | 16.89% |
| Borch-Johnsen et al., 2004 [44] | Caucasian | 49 | 26.0 | 4220 | 76.17% | 13.67% | 10.17% |
| Vaccaro et al., 2005 [47] | Caucasian | - | - | 141 | 56.74% | 23.40% | 19.86% |
| Karve et al., 2010 [80] | Caucasian | 49 | 30.7 | 535 | 56.07% | 15.61% | 28.32% |
| Marini et al., 2012 [78] | Caucasian | 52 | 30.6 | 356 | 30.62% | 38.48% | 30.90% |
| Tamayo et al., 2014 [75] | Caucasian | 55 | 27.7 | 1664 | 59.13% | 16.95% | 23.92% |
| Ramachandran et al., 2001 [68] | Asian | 40 | 23.1 | 5521 | 70.18% | 20.36% | 9.45% |
| Dong et al., 2003 [61] | Asian | 54 | 26.4 | 799 | 64.93% | 23.30% | 11.76% |
| Yang et al., 2004 [65] | Asian | - | - | 6111 | 54.11% | 17.55% | 28.34% |
| Lee et al., 2011 [73] | Asian | - | - | 397 | 68.26% | 15.87% | 15.87% |
| Chew et al., 2012 [70] | Asian | 39 | 26.9 | 117 | 35.90% | 39.32% | 24.79% |
| Liu et al., 2014 [63] | Asian | 60 | 23.7 | 149 | 27.52% | 42.28% | 30.20% |
| Aekplakorn et al., 2015 [72] | Asian | 51 | 26.2 | 2671 | 18.91% | 46.27% | 34.82% |
| TOTAL | 27,112 |
© 2017 by the authors. Licensee MDPI, Basel, Switzerland. This article is an open access article distributed under the terms and conditions of the Creative Commons Attribution (CC BY) license (http://creativecommons.org/licenses/by/4.0/).
Share and Cite
Yip, W.C.Y.; Sequeira, I.R.; Plank, L.D.; Poppitt, S.D. Prevalence of Pre-Diabetes across Ethnicities: A Review of Impaired Fasting Glucose (IFG) and Impaired Glucose Tolerance (IGT) for Classification of Dysglycaemia. Nutrients 2017, 9, 1273. https://doi.org/10.3390/nu9111273
Yip WCY, Sequeira IR, Plank LD, Poppitt SD. Prevalence of Pre-Diabetes across Ethnicities: A Review of Impaired Fasting Glucose (IFG) and Impaired Glucose Tolerance (IGT) for Classification of Dysglycaemia. Nutrients. 2017; 9(11):1273. https://doi.org/10.3390/nu9111273
Chicago/Turabian StyleYip, Wilson C. Y., Ivana R. Sequeira, Lindsay D. Plank, and Sally D. Poppitt. 2017. "Prevalence of Pre-Diabetes across Ethnicities: A Review of Impaired Fasting Glucose (IFG) and Impaired Glucose Tolerance (IGT) for Classification of Dysglycaemia" Nutrients 9, no. 11: 1273. https://doi.org/10.3390/nu9111273