Effect on Insulin, Glucose and Lipids in Overweight/Obese Australian Adults of 12 Months Consumption of Two Different Fibre Supplements in a Randomised Trial


Abstract
:1. Introduction
2. Materials and Methods
2.1. Subjects
2.2. Study Design
2.3. Anthropometry and Body Composition
2.4. Diet and Physical Activity
2.5. Measurements of Lipids, Glucose and Insulin Levels
2.6. Statistical Analysis
3. Results
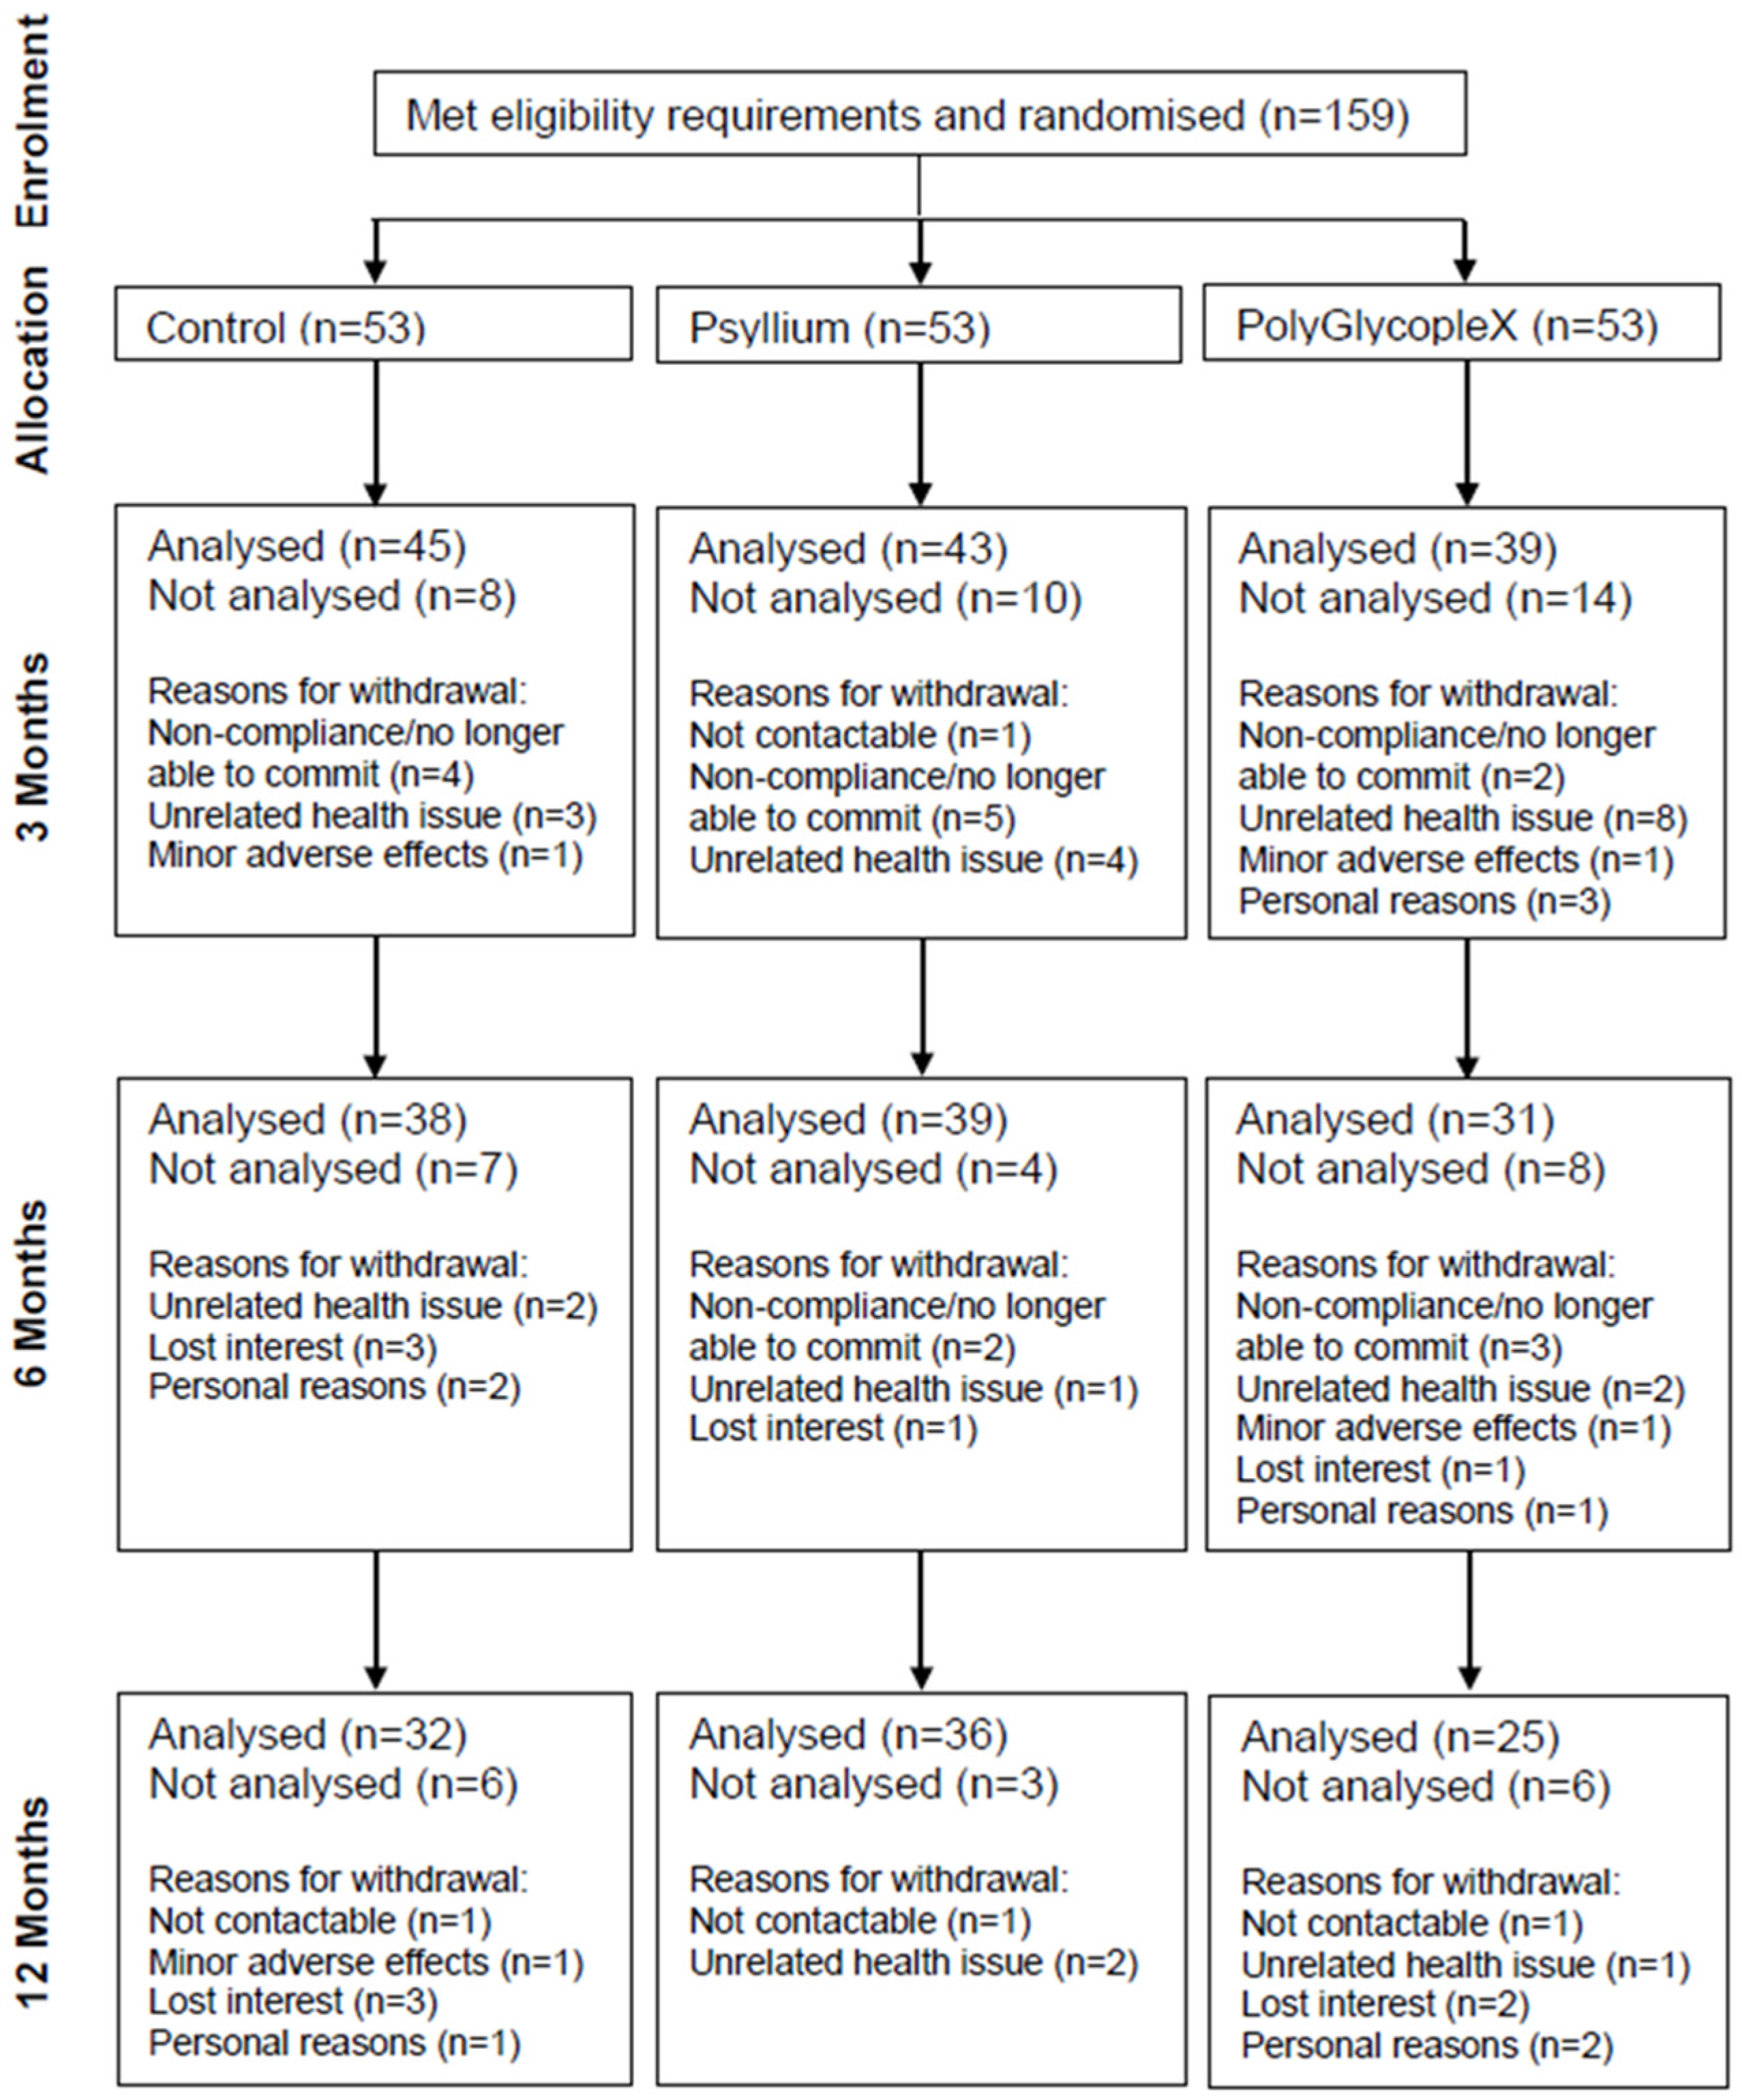
3.1. Participants
3.2. Baseline Characteristics
3.3. Diet
3.4. Physical Activity
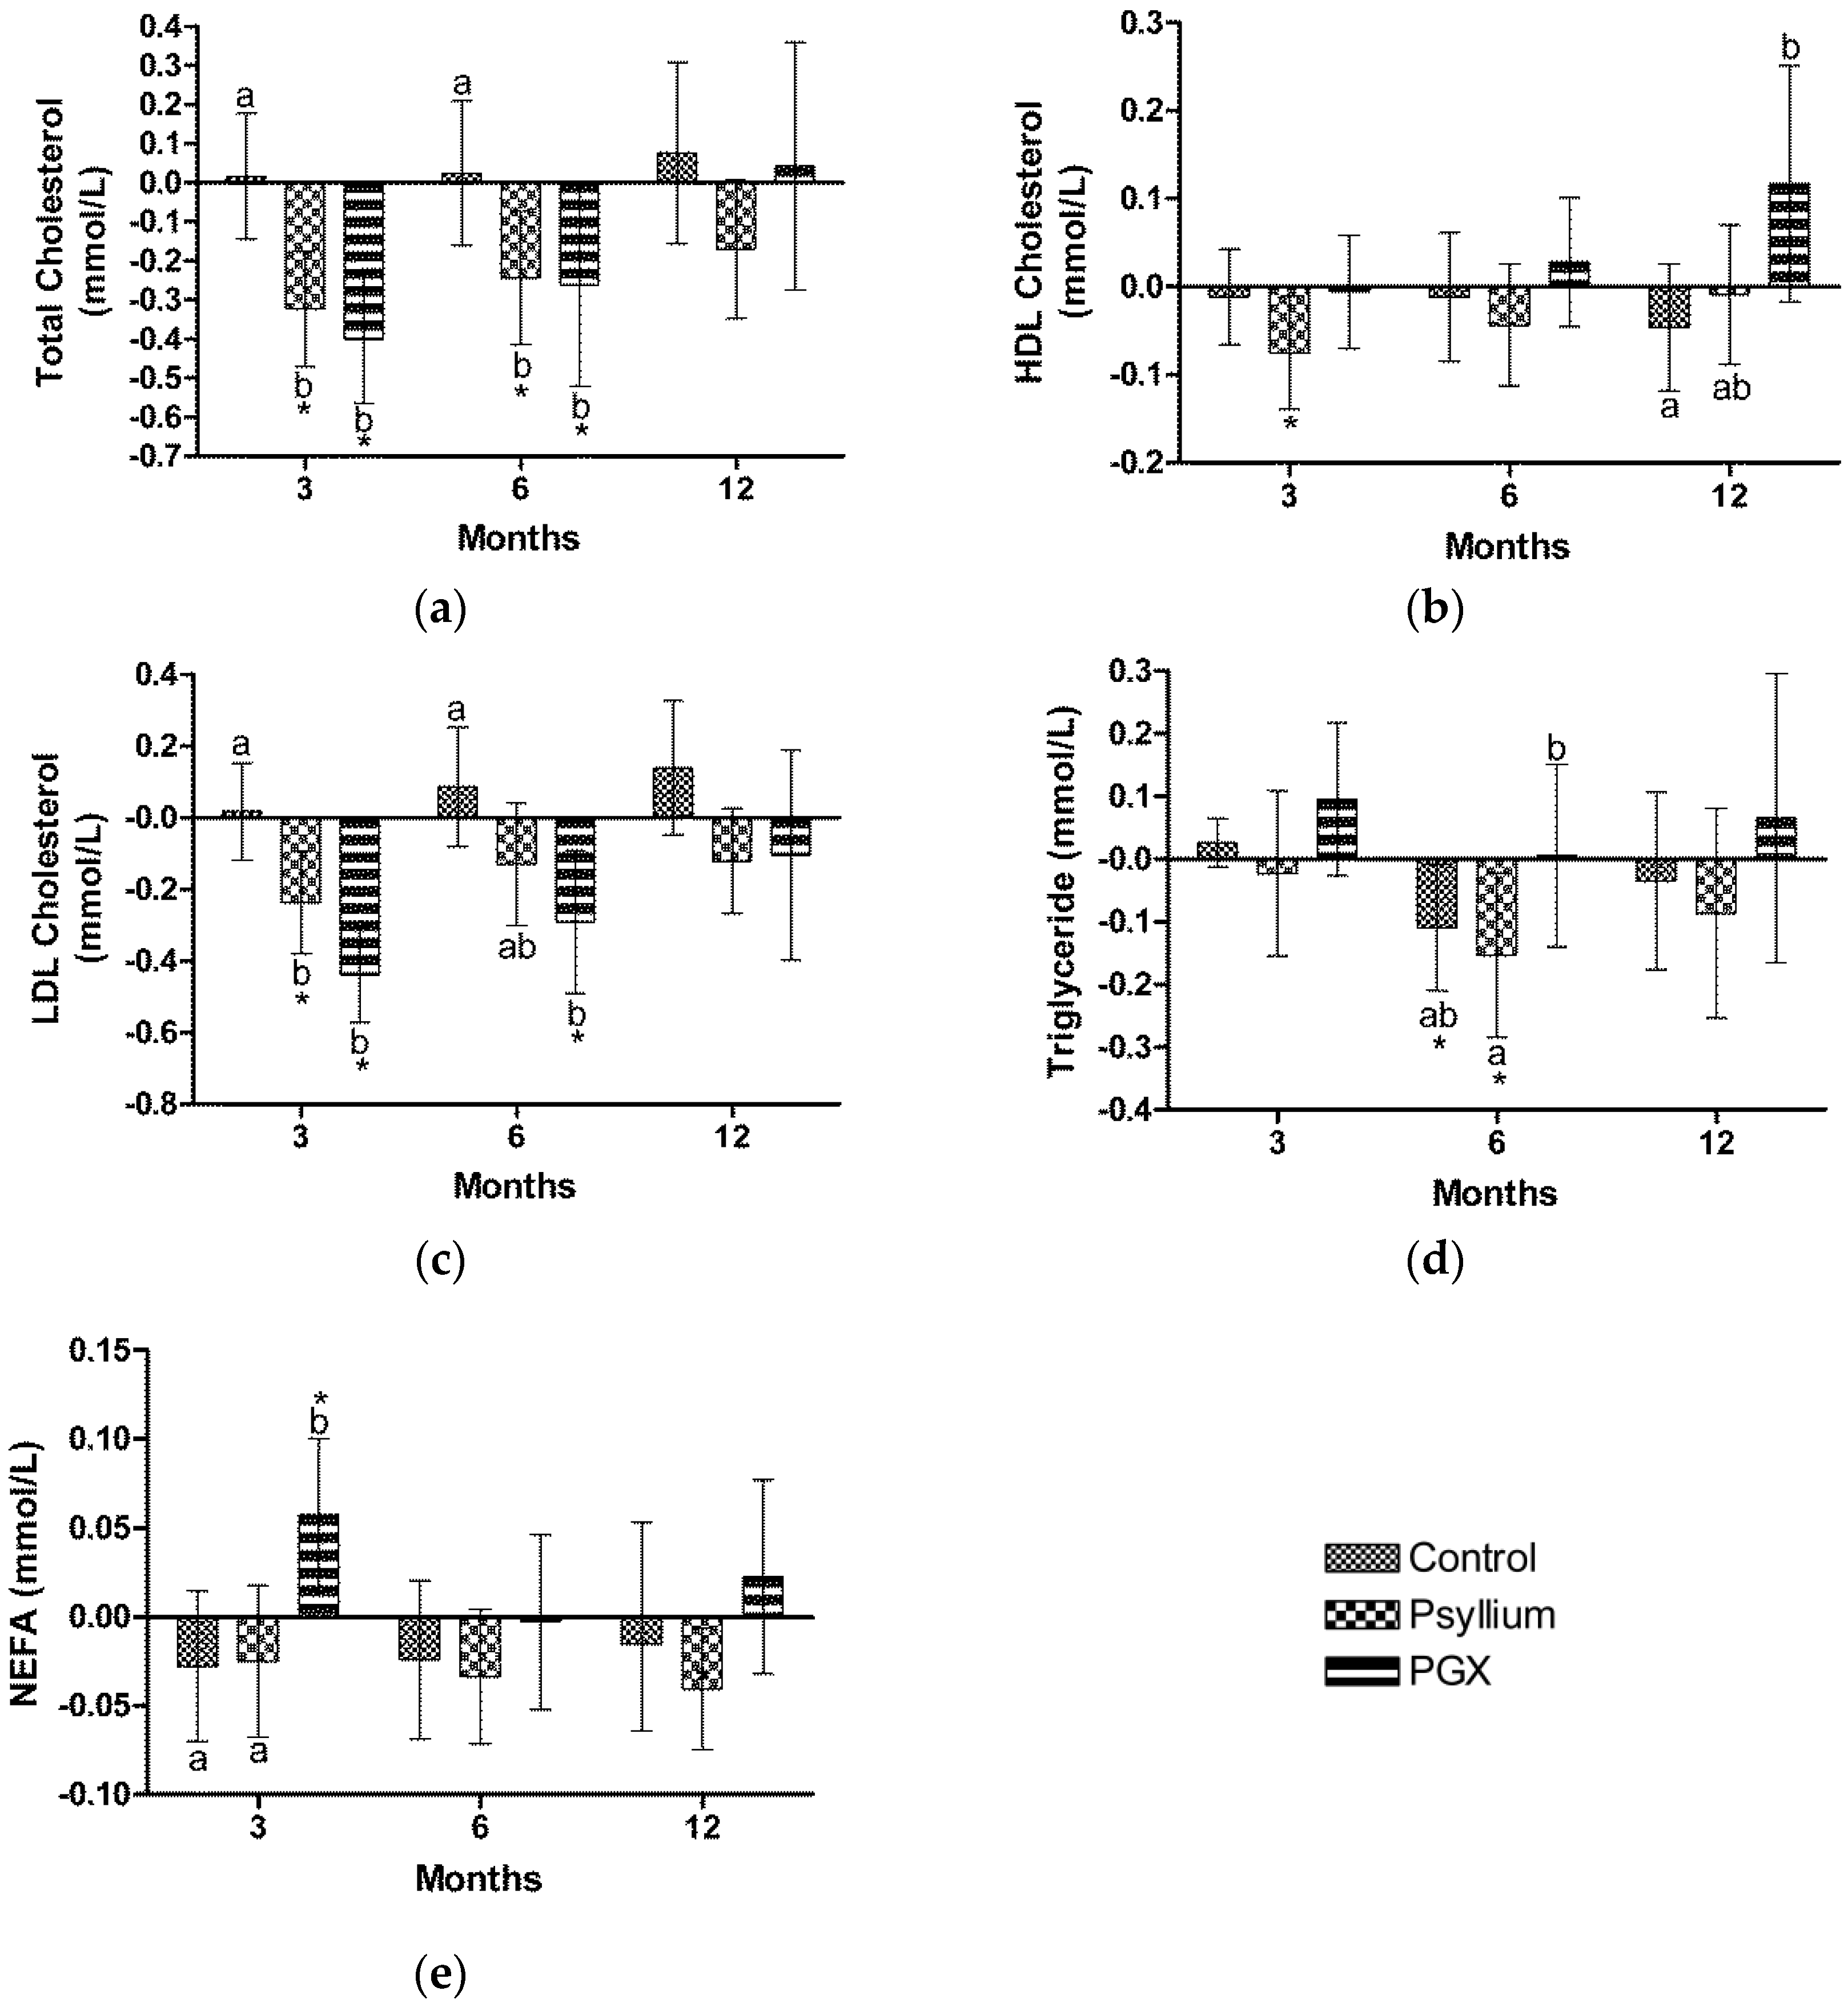
3.5. Lipids
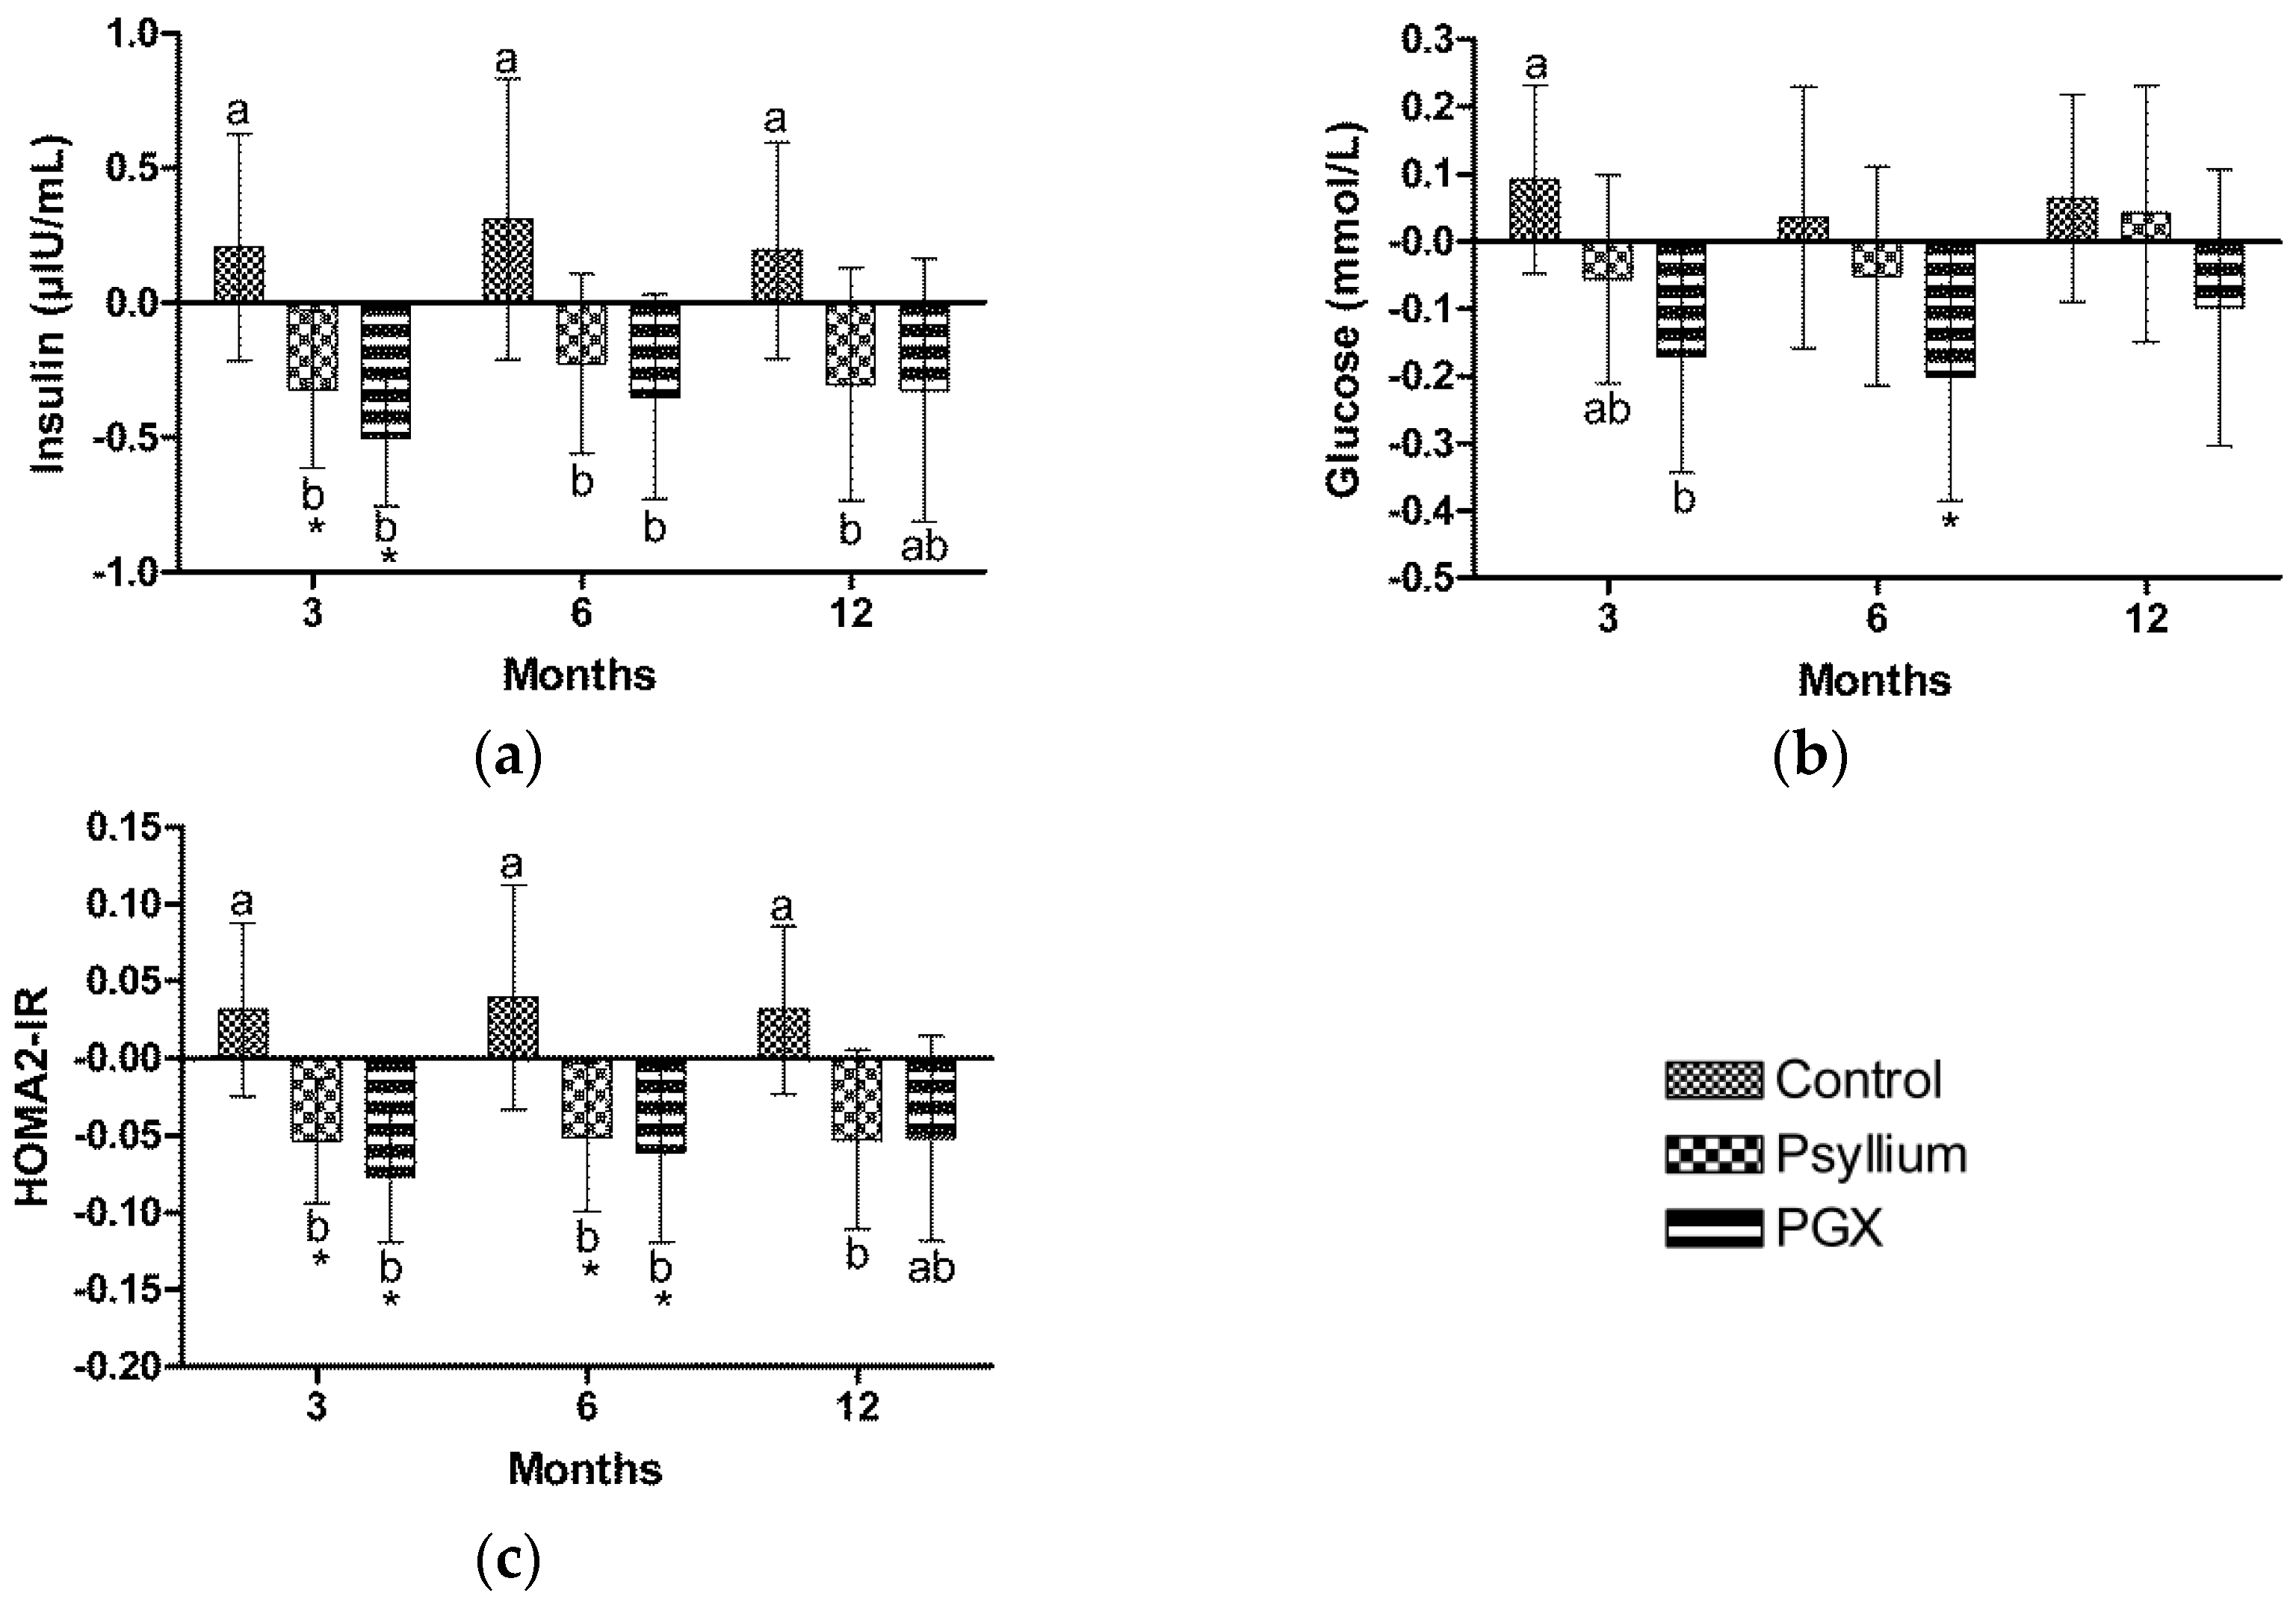
3.6. Insulin
3.7. Glucose
3.8. Homeostasis Model Assessment of Insulin Resistance
3.9. Adverse Events
4. Discussion
5. Conclusions
Supplementary Materials
Acknowledgments
Author Contributions
Conflicts of Interest
References
- Du, H.; van der, A.D.L.; Boshuizen, H.C.; Forouhi, N.G.; Wareham, N.J.; Halkjaer, J.; Tjonneland, A.; Overvad, K.; Jakobsen, M.U.; Boeing, H.; et al. Dietary fiber and subsequent changes in body weight and waist circumference in European men and women. Am. J. Clin. Nutr. 2010, 91, 329–336. [Google Scholar] [CrossRef] [PubMed]
- Newby, P.K.; Maras, J.; Bakun, P.; Muller, D.; Ferrucci, L.; Tucker, K.L. Intake of whole grains, refined grains, and cereal fiber measured with 7-D diet records and associations with risk factors for chronic disease. Am. J. Clin. Nutr. 2007, 86, 1745–1753. [Google Scholar] [PubMed]
- National Health and Medical Research Council. Australian Dietary Guidelines; National Health and Medical Research Council: Canberra, Australia, 2013.
- Wu, H.; Dwyer, K.M.; Fan, Z.; Shircore, A.; Fan, J.; Dwyer, J.H. Dietary fiber and progression of atherosclerosis: The Los Angeles Atherosclerosis Study. Am. J. Clin. Nutr. 2003, 78, 1085–1091. [Google Scholar] [PubMed]
- Lairon, D. Macronutrient intake and modulation on chylomicron production and clearance. Atheroscler. Suppl. 2008, 9, 45–48. [Google Scholar] [CrossRef] [PubMed]
- Kan, H.; Stevens, J.; Heiss, G.; Klein, R.; Rose, K.M.; London, S.J. Dietary fiber intake and retinal vascular caliber in the atherosclerosis risk in communities study. Am. J. Clin. Nutr. 2007, 86, 1626–1632. [Google Scholar] [PubMed]
- Lairon, D.; Arnault, N.; Bertrais, S.; Planells, R.; Clero, E.; Hercberg, S.; Boutron-Ruault, M.C. Dietary fiber intake and risk factors for cardiovascular disease in French adults. Am. J. Clin. Nutr. 2005, 82, 1185–1194. [Google Scholar] [PubMed]
- Venn, B.J.; Mann, J.I. Cereal grains, legumes and diabetes. Eur. J. Clin. Nutr. 2004, 58, 1443–1461. [Google Scholar] [CrossRef] [PubMed]
- Weickert, M.O.; Pfeiffer, A.F. Metabolic effects of dietary fiber consumption and prevention of diabetes. J. Nutr. 2008, 138, 439–442. [Google Scholar] [PubMed]
- McKeown, N.M.; Meigs, J.B.; Liu, S.; Wilson, P.W.; Jacques, P.F. Whole-grain intake is favorably associated with metabolic risk factors for type 2 diabetes and cardiovascular disease in the Framingham Offspring Study. Am. J. Clin. Nutr. 2002, 76, 390–398. [Google Scholar] [PubMed]
- Pittler, M.H.; Ernst, E. Guar gum for body weight reduction: Meta-analysis of randomized trials. Am. J. Med. 2001, 110, 724–730. [Google Scholar] [CrossRef]
- Brown, L.; Rosner, B.; Willett, W.W.; Sacks, F.M. Cholesterol-lowering effects of dietary fiber: A meta-analysis. Am. J. Clin. Nutr. 1999, 69, 30–42. [Google Scholar] [PubMed]
- Ludwig, D.S.; Pereira, M.A.; Kroenke, C.H.; Hilner, J.E.; Van Horn, L.; Slattery, M.L.; Jacobs, D.R., Jr. Dietary fiber, weight gain, and cardiovascular disease risk factors in young adults. JAMA 1999, 282, 1539–1546. [Google Scholar] [CrossRef] [PubMed]
- Clemens, R.; Kranz, S.; Mobley, A.; Nicklas, R.; Raimondi, M.; Rodriguez, J.; Slavin, J.; Jacobs, D.J. Filling America’s Fiber Intake Gap: Summary of a Roundtable to Probe Realistic Solutions with a Focus on Grain-Based Foods. J. Nutr. 2012, 142, 1390S–1401S. [Google Scholar] [CrossRef] [PubMed]
- US Department of Agriculture; US Department of Health and Human Services. Dietary Guidelines for Americans; US Government Printing Office: Washington, DC, USA, 2005.
- Marlett, J.A.; McBurney, M.I.; Slavin, J.L. Position of the American Dietetic Association: Health implications of dietary fiber. J. Am. Diet. Assoc. 2002, 102, 993–1000. [Google Scholar] [CrossRef]
- Carabin, I.G.; Lyon, M.R.; Wood, S.; Pelletier, X.; Donazzolo, Y.; Burdock, G.A. Supplementation of the diet with the functional fiber PolyGlycoplex is well tolerated by healthy subjects in a clinical trial. Nutr. J. 2009, 8, 9. [Google Scholar] [CrossRef] [PubMed]
- Lyon, M.R.; Reichert, R.G. The effect of a novel viscous polysaccharide along with lifestyle changes on short-term weight loss and associated risk factors in overweight and obese adults: an observational retrospective clinical program analysis. Altern. Med. Rev. 2010, 15, 68–75. [Google Scholar] [PubMed]
- Food and Nutrition Board of the Institute of Medicine of the National Academies. Dietary, functional, and total fiber. In Dietary Reference Intakes for Energy, Carbohydrate, Fiber, Fat, Fatty Acids, Cholesterol, Protein, and Amino Acids; Spears, G.E., Ed.; The National Academies Press: Washington, DC, USA, 2005; pp. 339–421. [Google Scholar]
- Jenkins, A.L.; Kacinik, V.; Lyon, M.; Wolever, T.M. Effect of adding the novel fiber, PGX®, to commonly consumed foods on glycemic response, glycemic index and GRIP: A simple and effective strategy for reducing post prandial blood glucose levels—A randomized, controlled trial. Nutr. J. 2010, 9, 58. [Google Scholar] [CrossRef] [PubMed]
- Reimer, R.A.; Pelletier, X.; Carabin, I.G.; Lyon, M.; Gahler, R.; Parnell, J.A.; Wood, S. Increased plasma PYY levels following supplementation with the functional fiber PolyGlycopleX in healthy adults. Eur. J. Clin. Nutr. 2010, 64, 1186–1191. [Google Scholar] [CrossRef] [PubMed]
- Pal, S.; Khossousi, A.; Binns, C.; Dhaliwal, S.; Ellis, V. The effect of a fibre supplement compared to a healthy diet on body composition, lipids, glucose, insulin and other metabolic syndrome risk factors in overweight and obese individuals. Br. J. Nutr. 2011, 105, 90–100. [Google Scholar] [CrossRef] [PubMed]
- Ziai, S.; Larijani, B.; Akhoondzadeh, S.; Fakhrzadeh, H.; Dastpak, A.; Bandarian, F.; Rezai, A.; Badi, H.; Emami, T. Psyllium decreased serum glucose and glycosylated hemoglobin significantly in diabetic outpatients. J. Ethnopharmacol. 2005, 102, 202–207. [Google Scholar] [CrossRef] [PubMed]
- Karhunen, L.; Juvonen, K.; Flander, S.; Liukkonen, K.; Lahteenmaki, L.; Siloaho, M.; Laaksonen, D.; Herzig, K.; Uusitupa, M.; Poutanen, K. A psyllium fiber-enriched meal strongly attenuates postprandial gastrointestinal peptide release in healthy young adults. J. Nutr. 2010, 140, 737–744. [Google Scholar] [CrossRef] [PubMed]
- Anderson, J.; Allgood, L.; Lawrence, A.; Altringer, L.; Jerdack, G.; Hengehold, D.; Morel, J. Cholesterol-lowering effects of psyllium intake adjuctive to diet therapy in men and women with hypercholesterolemia: Meta-analysis of 8 controlled trials. Am. J. Clin. Nutr. 2000, 71, 472–479. [Google Scholar] [PubMed]
- Rodriguez-Moran, M.; Guerrero-Romero, F.; Lazcano-Burciaga, G. Lipid- and glucose-lowering efficacy of Plantago. Psyllium in type II diabetes. J. Diabetes Complic. 1998, 12, 273–278. [Google Scholar] [CrossRef]
- Vuksan, V.; Jenkins, A.L.; Rogovik, A.L.; Fairgrieve, C.; Jovanovski, E.; Leiter, L. Viscosity rather than quantity of dietary fibre predicts cholesterol-lowering effect in healthy individuals. Br. J. Nutr. 2011, 106, 1349–1352. [Google Scholar] [CrossRef] [PubMed]
- Tai, E.; Fok, A.; Chu, R.; Tan, C. A study to assess the effect of dietary supplementation with soluble fibre (Minolest) on lipid levels in normal subjects with hypercholesterolaemia. Ann. Acad. Med. Singapore 1999, 28, 209–213. [Google Scholar] [PubMed]
- Turnbull, W.; Thomas, H. The effect of a Plantago ovata seed containing preparation on appetite variables, nutrient and energy intake. Int. J. Obes. Relat. Metab. Disord. 1995, 19, 338–342. [Google Scholar] [PubMed]
- Delargy, H.; O’Sullivan, K.; Fletcher, R.; Blundell, J. Effects of amount and type of dietary fibre (soluble and insoluble) on short-term control of appetite. Int. J. Food Sci. Nutr. 1997, 48, 67–77. [Google Scholar] [CrossRef] [PubMed]
- Pal, S.; Radavelli-Bagatini, S. Effects of psyllium on metabolic syndrome risk factors. Obes. Rev. 2012, 13, 1034–1047. [Google Scholar] [CrossRef] [PubMed]
- Khossousi, A.; Binns, C.W.; Dhaliwal, S.S.; Pal, S. The acute effects of psyllium on postprandial lipaemia and thermogenesis in overweight and obese men. Br. J. Nutr. 2008, 99, 1068–1075. [Google Scholar] [CrossRef] [PubMed]
- Gibb, R.; McRorie, J.; Russel, D.; Hasselblad, V.; D’Alessio, D. Psyllium fiber improves glycemic control proportional to loss of glycemic control: A meta-analysis of data in euglycemic subjects, patients at risk of type 2 diabetes mellitus, and patients being treated for type 2 diabetes mellitus. Am. J. Clin. Nutr. 2015, 102, 1604–1614. [Google Scholar] [CrossRef] [PubMed]
- US Pharmacopeia. Food Chemicals Codex (FCC), 9th ed.; US Pharmacopeia: Rockville, MD, USA, 2015. [Google Scholar]
- Pal, S.; Ellis, V.; Dhaliwal, S. Effects of whey protein isolate on body composition, lipids, insulin and glucose in overweight and obese individuals. Br. J. Nutr. 2010, 104, 716–723. [Google Scholar] [CrossRef] [PubMed]
- Bairaktari, E.; Hatzidimou, K.; Tzallas, C.; Vini, M.; Katsaraki, A.; Tselepis, A.; Elisaf, M.; Tsolas, O. Estimation of LDL cholesterol based on the Friedewald formula and on apo B levels. Clin. Biochem. 2000, 33, 549–555. [Google Scholar] [CrossRef]
- Wallace, T.M.; Levy, J.C.; Matthews, D.R. Use and abuse of HOMA modeling. Diabetes Care 2004, 27, 1487–1495. [Google Scholar] [CrossRef] [PubMed]
- Reimer, R.A.; Yamaguchi, H.; Eller, L.K.; Lyon, M.R.; Gahler, R.J.; Kacinik, V.; Juneja, P.; Wood, S. Changes in visceral adiposity and serum cholesterol with a novel viscous polysaccharide in Japanese adults with abdominal obesity. Obesity 2013, 21, E379–E387. [Google Scholar] [PubMed]
- Bernstein, A.; Titgemeier, B.; Kirkpatrick, K.; Golubic, M.; Roizen, M. Major cereal grain fibers and psyllium in relation to cardiovascular health. Nutrients 2013, 5, 1471–1487. [Google Scholar] [CrossRef] [PubMed]
- Grover, G.J.; Koetzner, L.; Wicks, J.; Gahler, R.J.; Lyon, M.R.; Reimer, R.A.; Wood, S. Effects of the soluble fiber complex PolyGlycopleX® on glucose homeostasis and body weight in young Zucker diabetic rats. Front. Pharmacol. 2011, 2, 47. [Google Scholar] [CrossRef] [PubMed]
- Brand-Miller, J.C.; Atkinson, F.S.; Gahler, R.J.; Kacinik, V.; Lyon, M.R.; Wood, S. Effects of PGX, a novel functional fibre, on acute and delayed postprandial glycaemia. Eur. J. Clin. Nutr. 2010, 64, 1488–1493. [Google Scholar] [CrossRef] [PubMed]
- Solah, V.A.; Brand-Miller, J.C.; Atkinson, F.S.; Gahler, R.J.; Kacinik, V.; Lyon, M.R.; Wood, S. Dose-response effect of a novel functional fibre, PolyGlycopleX®, PGX®, on satiety. Appetite 2014, 77C, 72–76. [Google Scholar] [CrossRef] [PubMed]
- Vuksan, V.; Panahi, S.; Lyon, M.; Rogovik, A.L.; Jenkins, A.L.; Leiter, L.A. Viscosity of fiber preloads affects food intake in adolescents. Nutr. Metab. Cardiovasc. Dis. 2009, 19, 498–503. [Google Scholar] [CrossRef] [PubMed]
- Yong, M.; Solah, V.; Johnson, S.; Meng, X.; Kerr, D.; James, A.; Fenton, H.; Gahler, R.J.; Wood, S. Effects of a viscous-fibre supplemented evening meal and the following un-supplemented breakfast on post-prandial satiety responses in healthy women. Physiol. Behav. 2016, 154, 34–39. [Google Scholar] [CrossRef] [PubMed]
- Kacinik, V.; Lyon, M.R.; Purnama, M.; Reimer, R.A.; Gahler, R.J.; Green, T.J.; Wood, S. Effect of PGX, a novel functional fibre supplement, on subjective ratings of appetite in overweight and obese women consuming a 3-day structured, low-calorie diet. Nutr. Diab. 2011, 1, e22. [Google Scholar] [CrossRef] [PubMed]
- Pal, S.; Ho, S.; Gahler, R.; Wood, S. Effect on body weight and composition in overweight/obese Australian adults over 12 months consumption of two different types of fiber supplementation in a randomized trial. Nutr. Metab. 2016, 13, 82. [Google Scholar] [CrossRef] [PubMed]
- Matulka, R.A.; Lyon, M.R.; Wood, S.; Ann Marone, P.; Merkel, D.J.; Burdock, G.A. The safety of PolyGlycopleX (PGX) as shown in a 90-day rodent feeding study. Nutr. J. 2009, 8, 1. [Google Scholar] [CrossRef] [PubMed]


| Control (n = 45) | PSY (n = 43) | PGX (n = 39) | p | |
|---|---|---|---|---|
| Gender (Male/Female) | 24/21 | 15/28 | 15/24 | |
| Age (year) | 49.82 ± 11.75 | 49.93 ± 11.04 | 47.87 ± 12.08 | |
| Height (cm) | 171.68 ± 10.04 | 169.16 ± 10.52 | 169.76 ± 10.51 | |
| Weight (kg) | 94.69 ± 17.05 | 91.17 ± 14.74 | 96.24 ± 18.02 | 0.365 |
| BMI (kg/m2) | 32.01 ± 4.2 | 31.74 ± 3.22 | 33.25 ± 4.3 | 0.189 |
| Waist (cm) | 103.12 ± 11.02 | 101.17 ± 9.76 | 105.97 ± 12.72 | 0.154 |
| Hip (cm) | 112.87 ± 9.04 | 114.63 ± 8.63 | 115.71 ± 9.37 | 0.414 |
| Waist Hip Ratio | 0.91 ± 0.08 | 0.88 ± 0.08 | 0.92 ± 0.1 | 0.158 |
| TC (mmol/L) | 5 ± 0.85 | 4.93 ± 1.06 | 5.02 ± 0.85 | 0.904 |
| HDL (mmol/L) | 1.33 ± 0.37 | 1.36 ± 0.38 | 1.28 ± 0.26 | 0.563 |
| LDL (mmol/L) | 3.02 ± 0.87 | 3.04 ± 0.96 | 3.2 ± 0.77 | 0.592 |
| TG (mmol/L) | 1.44 ± 1.12 | 1.18 ± 0.67 | 1.2 ± 0.56 | 0.269 |
| Insulin (μIU/mL) | 6.11 ± 1.43 | 5.87 ± 1.64 | 6.56 ± 1.94 | 0.172 |
| Glucose (mmol/L) | 4.94 ± 0.73 | 4.79 ± 0.52 | 4.99 ± 0.56 | 0.302 |
| Variable | 3 Months | n | P | 6 Months | n | P | 12 Months | n | p | |
|---|---|---|---|---|---|---|---|---|---|---|
| Energy (kJ/day) | CTR | 9013.1 ± 223.6 a | 39 | 0.641 | 8803.3 ± 282.9 a | 34 | 0.928 | 8218 ± 295.4 a | 31 | 0.111 |
| PSY | 7272.3 ± 218 b | 41 | <0.001 | 7539.2 ± 278.8 b | 35 | <0.001 | 7657.1 ± 277.9 a,b | 35 | 0.001 | |
| PGX | 7556.3 ± 243.1 b | 33 | 0.001 | 7453.7 ± 323.5 b | 26 | 0.009 | 7315.3 ± 342.4 b | 23 | 0.012 | |
| CHO (g/day) | CTR | 212.6 ± 7.7 a | 39 | 0.827 | 213.4 ± 10 a | 34 | 0.787 | 200.5 ± 8.4 | 31 | 0.212 |
| PSY | 181 ± 7.5 b | 41 | 0.002 | 164.7 ± 9.8 b | 35 | 0.002 | 183.9 ± 7.9 | 35 | 0.015 | |
| PGX | 175.3 ± 8.4 b | 33 | 0.003 | 177.2 ± 11.4 b | 26 | 0.032 | 176.3 ± 9.7 | 23 | 0.012 | |
| Fat (g/day) | CTR | 83.8 ± 3.2 a | 39 | 0.907 | 82.3 ± 4.3 a | 34 | 0.887 | 73 ± 4 | 31 | 0.066 |
| PSY | 66.9 ± 3.1 b | 41 | <0.001 | 72.9 ± 4.2 a,b | 35 | 0.147 | 73 ± 3.8 | 35 | 0.070 | |
| PGX | 72.2 ± 3.4 b | 33 | 0.055 | 69.1 ± 4.9 b | 26 | 0.047 | 66 ± 4.7 | 23 | 0.020 | |
| Total Fibre (g/day) | CTR | 24.2 ±1.2 a | 39 | 0.599 | 22.1 ± 1 a | 34 | 0.790 | 21.6 ± 1.3 a | 31 | 0.613 |
| PSY | 36.4 ± 1.2 b | 41 | <0.001 | 35.1 ± 0.9 b | 35 | <0.001 | 36.6 ± 1.3 b | 35 | <0.001 | |
| PGX | 36.6 ± 1.3 b | 33 | <0.001 | 34.1 ± 1.1 b | 26 | <0.001 | 36.1 ± 1.6 b | 23 | <0.001 |
| 3 Months | Mean Change | n | P | 6 Months | Mean Change | n | P | 12 Months | Mean Change | n | p | |
|---|---|---|---|---|---|---|---|---|---|---|---|---|
| CTR | 2802.4 ± 449.3 | −130.5 | 29 | 0.837 | 2868.2 ± 454.7 | −141.2 | 32 | 0.823 | 3294.5 ± 525.6 | 415.4 | 30 | 0.569 |
| PSY | 2933 ± 443.6 | 620.8 | 30 | 0.345 | 3009.3 ± 433.2 | 187 | 35 | 0.876 | 2879.1 ± 497.8 | 609.6 | 33 | 0.526 |
| PGX | 2181.7 ± 470.6 | 751.3 | 27 | 0.254 | 2681.1 ± 495.5 | 328.2 | 27 | 0.711 | 2684.9 ± 619.1 | 194.3 | 22 | 0.886 |
© 2017 by the authors. Licensee MDPI, Basel, Switzerland. This article is an open access article distributed under the terms and conditions of the Creative Commons Attribution (CC BY) license ( http://creativecommons.org/licenses/by/4.0/).
Share and Cite
Pal, S.; Ho, S.; Gahler, R.J.; Wood, S. Effect on Insulin, Glucose and Lipids in Overweight/Obese Australian Adults of 12 Months Consumption of Two Different Fibre Supplements in a Randomised Trial. Nutrients 2017, 9, 91. https://doi.org/10.3390/nu9020091
Pal S, Ho S, Gahler RJ, Wood S. Effect on Insulin, Glucose and Lipids in Overweight/Obese Australian Adults of 12 Months Consumption of Two Different Fibre Supplements in a Randomised Trial. Nutrients. 2017; 9(2):91. https://doi.org/10.3390/nu9020091
Chicago/Turabian StylePal, Sebely, Suleen Ho, Roland J. Gahler, and Simon Wood. 2017. "Effect on Insulin, Glucose and Lipids in Overweight/Obese Australian Adults of 12 Months Consumption of Two Different Fibre Supplements in a Randomised Trial" Nutrients 9, no. 2: 91. https://doi.org/10.3390/nu9020091