Mechanisms of Iron Uptake from Ferric Phosphate Nanoparticles in Human Intestinal Caco-2 Cells

 ,
,
Abstract
:
1. Introduction
2. Materials and Methods
2.1. NP-FePO4 Treatments: Sonication
2.2. NP-FePO4 Treatments: In Vitro Simulated Gastrointestinal (GI) Digestion
2.3. Transmission Electron Microscopy (TEM)
2.4. Centrifugal Disc Sedimentation
2.5. Dynamic Light Scattering (DLS)
2.6. Caco-2 Cell Culture
2.7. Supernatant Iron during In Vitro Gastric Digestion
2.8. Measurement of Iron Uptake into Caco-2 Cells
2.9. Chemical Inhibitors Targeting Iron Uptake
2.10. siRNA Knockdown of DMT1 in Intestinal Epithelial Cells
2.11. RT-PCR
2.12. Statistical Analysis
3. Results
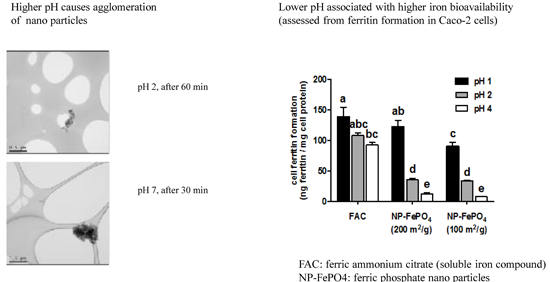
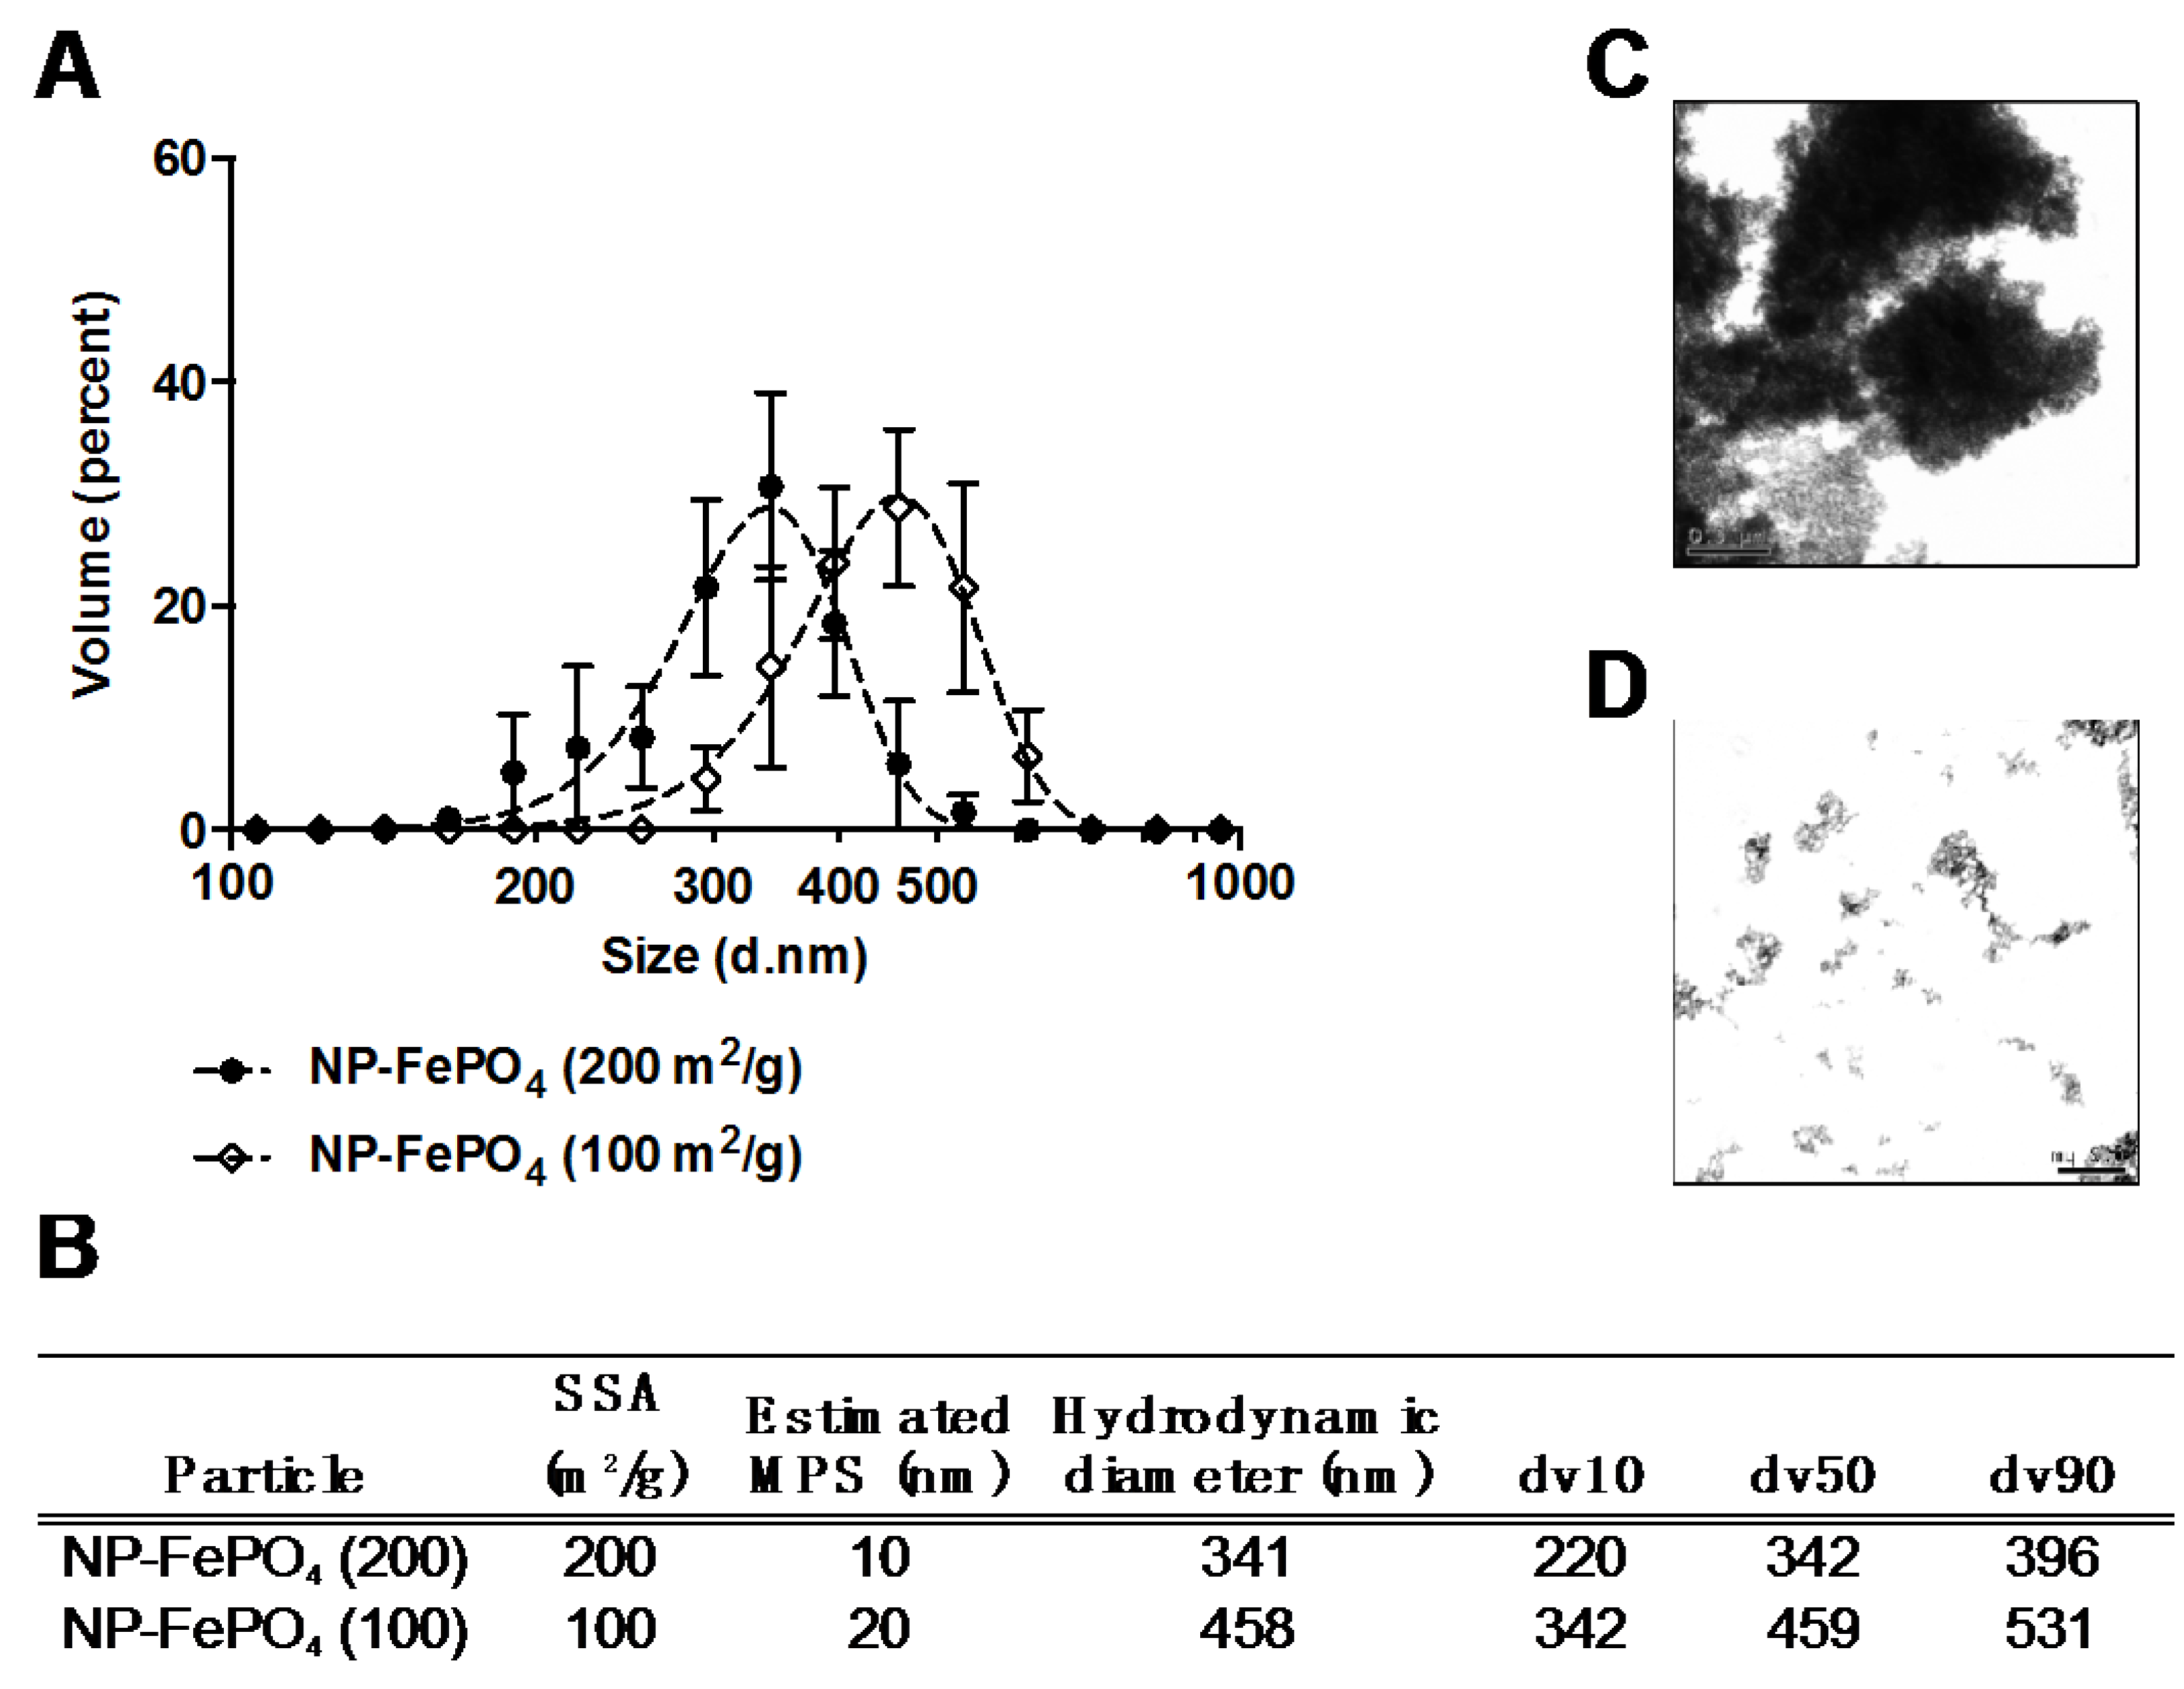
3.1. Particle Size
3.1.1. Characterization of Sonicated NP-FePO4
3.1.2. In Vitro Simulated GI Digested NP-FePO4 (200)
3.2. Cell Culture Experiments
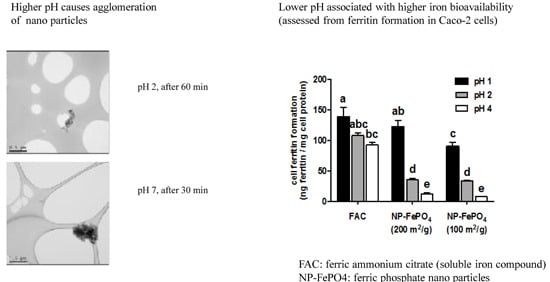
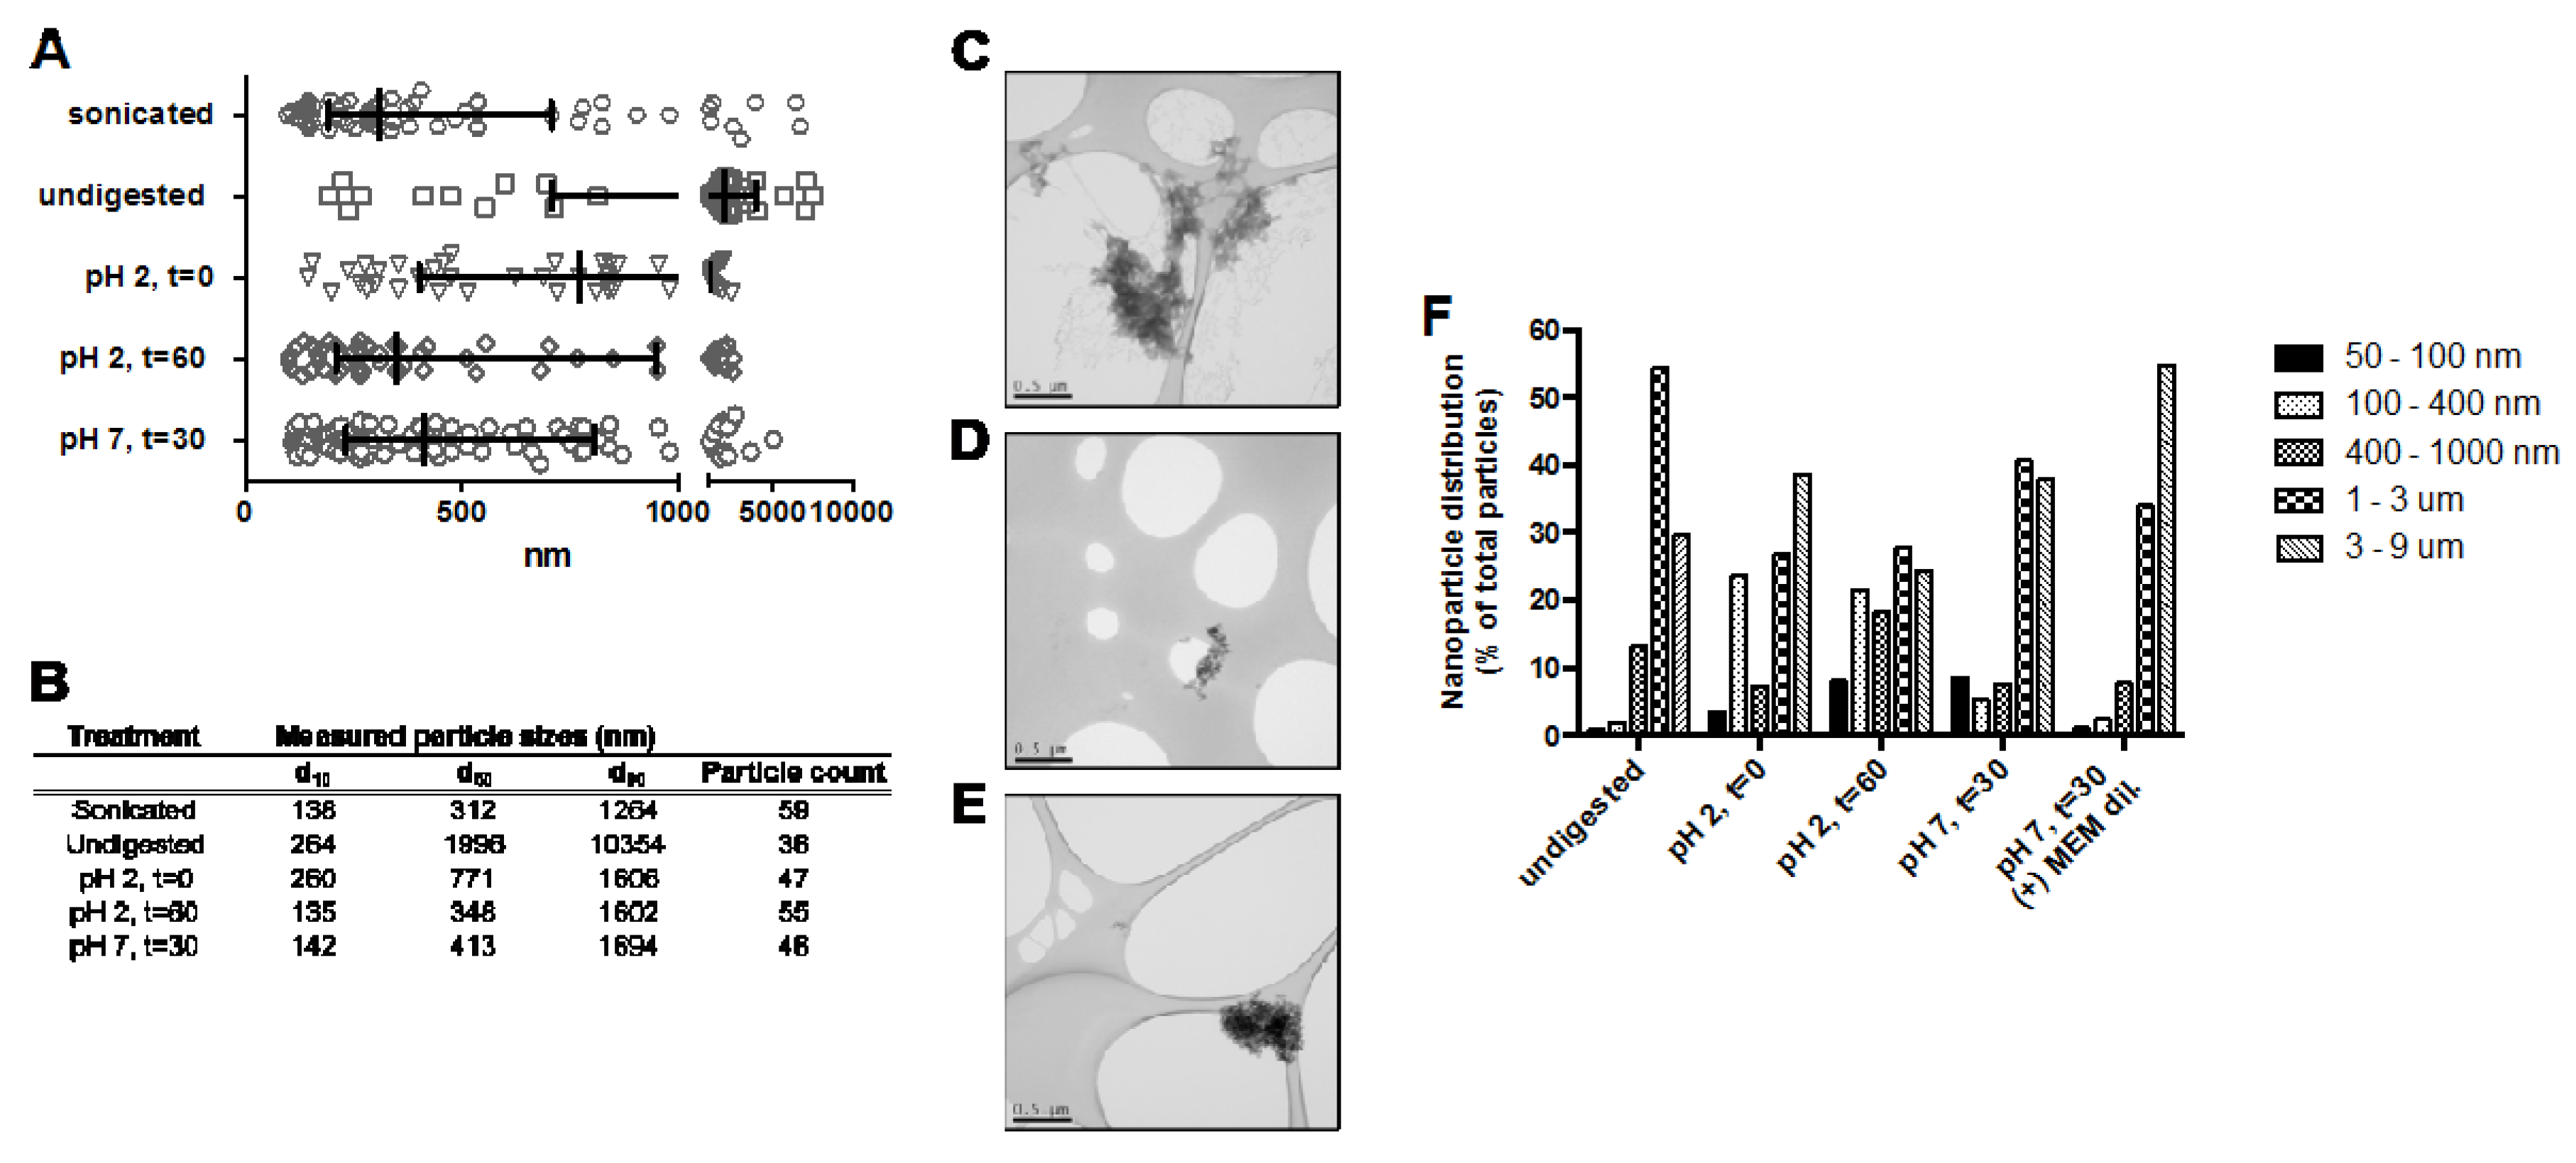
3.2.1. Effect of Gastric pH and Time on Supernatant Iron and Uptake into Caco-2 Cells
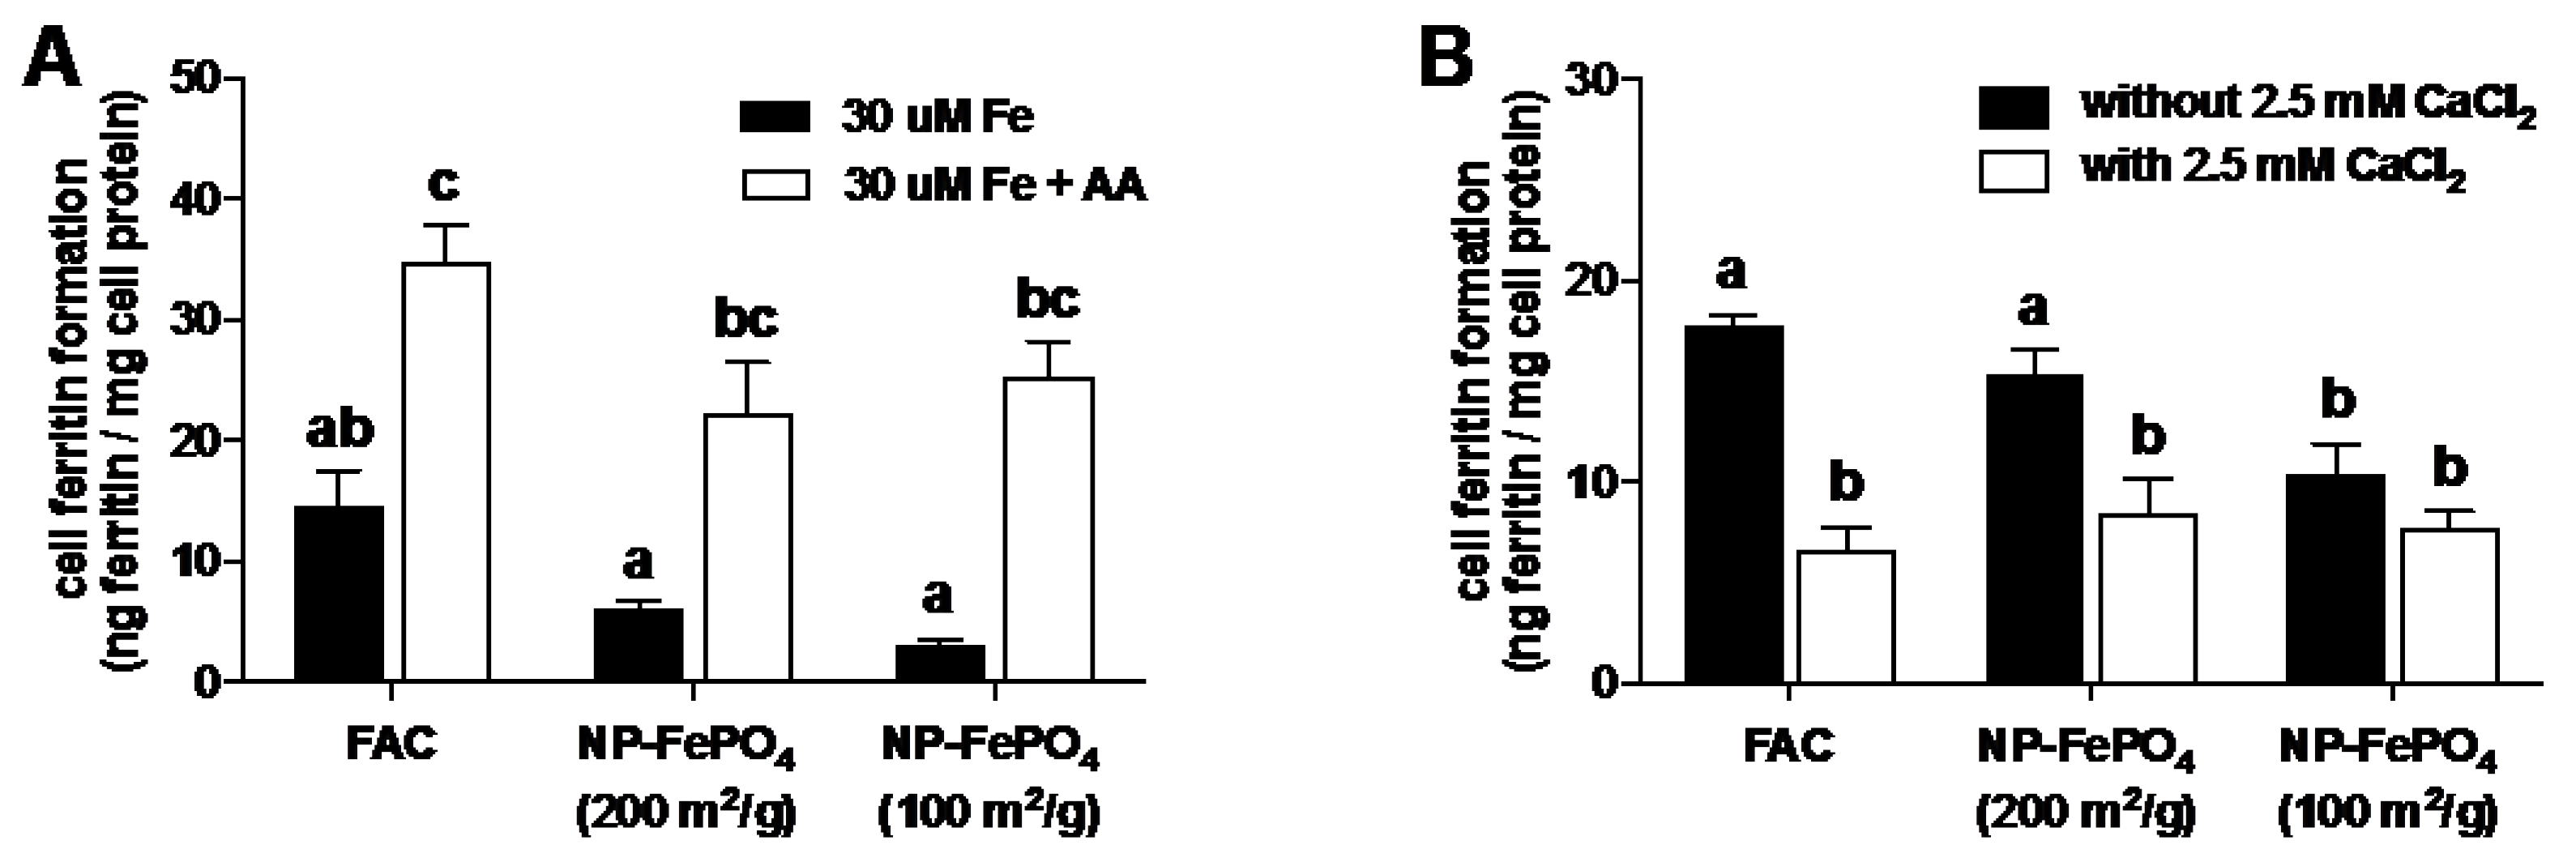
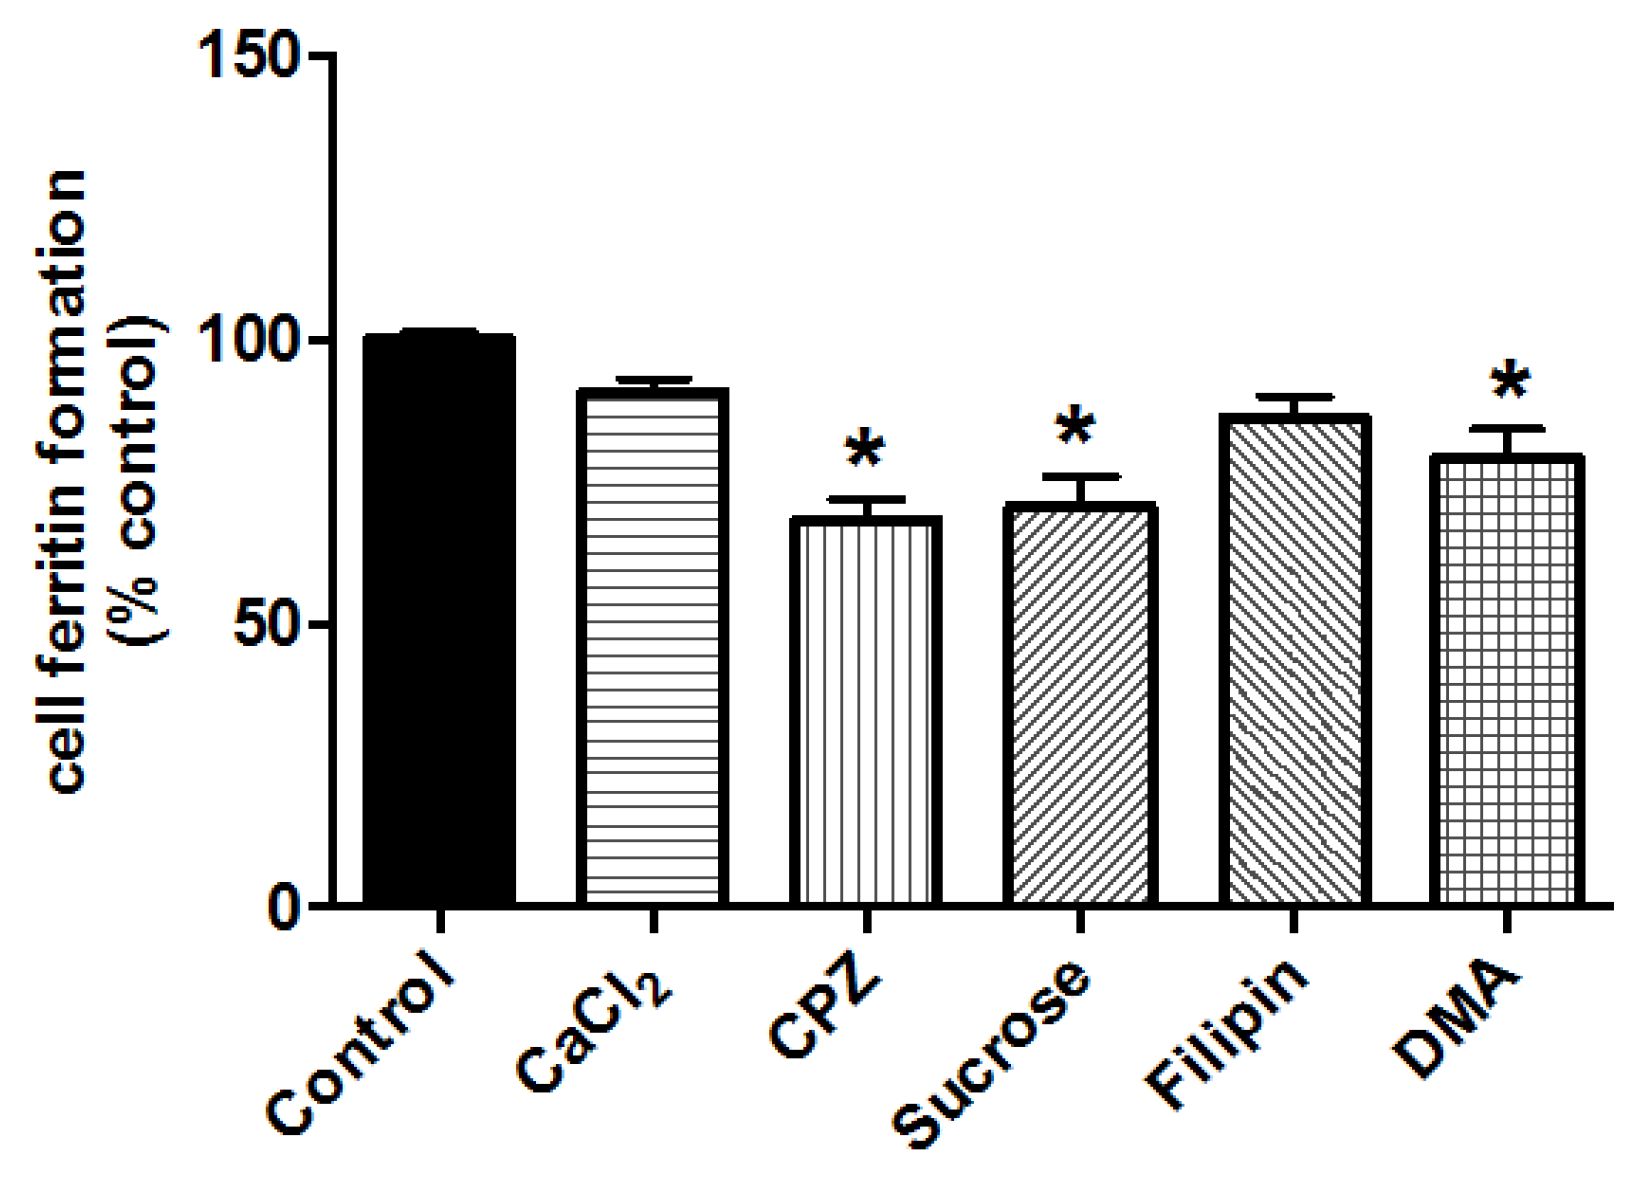
3.2.2. Effect of AA and Calcium on Iron Uptake in Caco-2 Cells
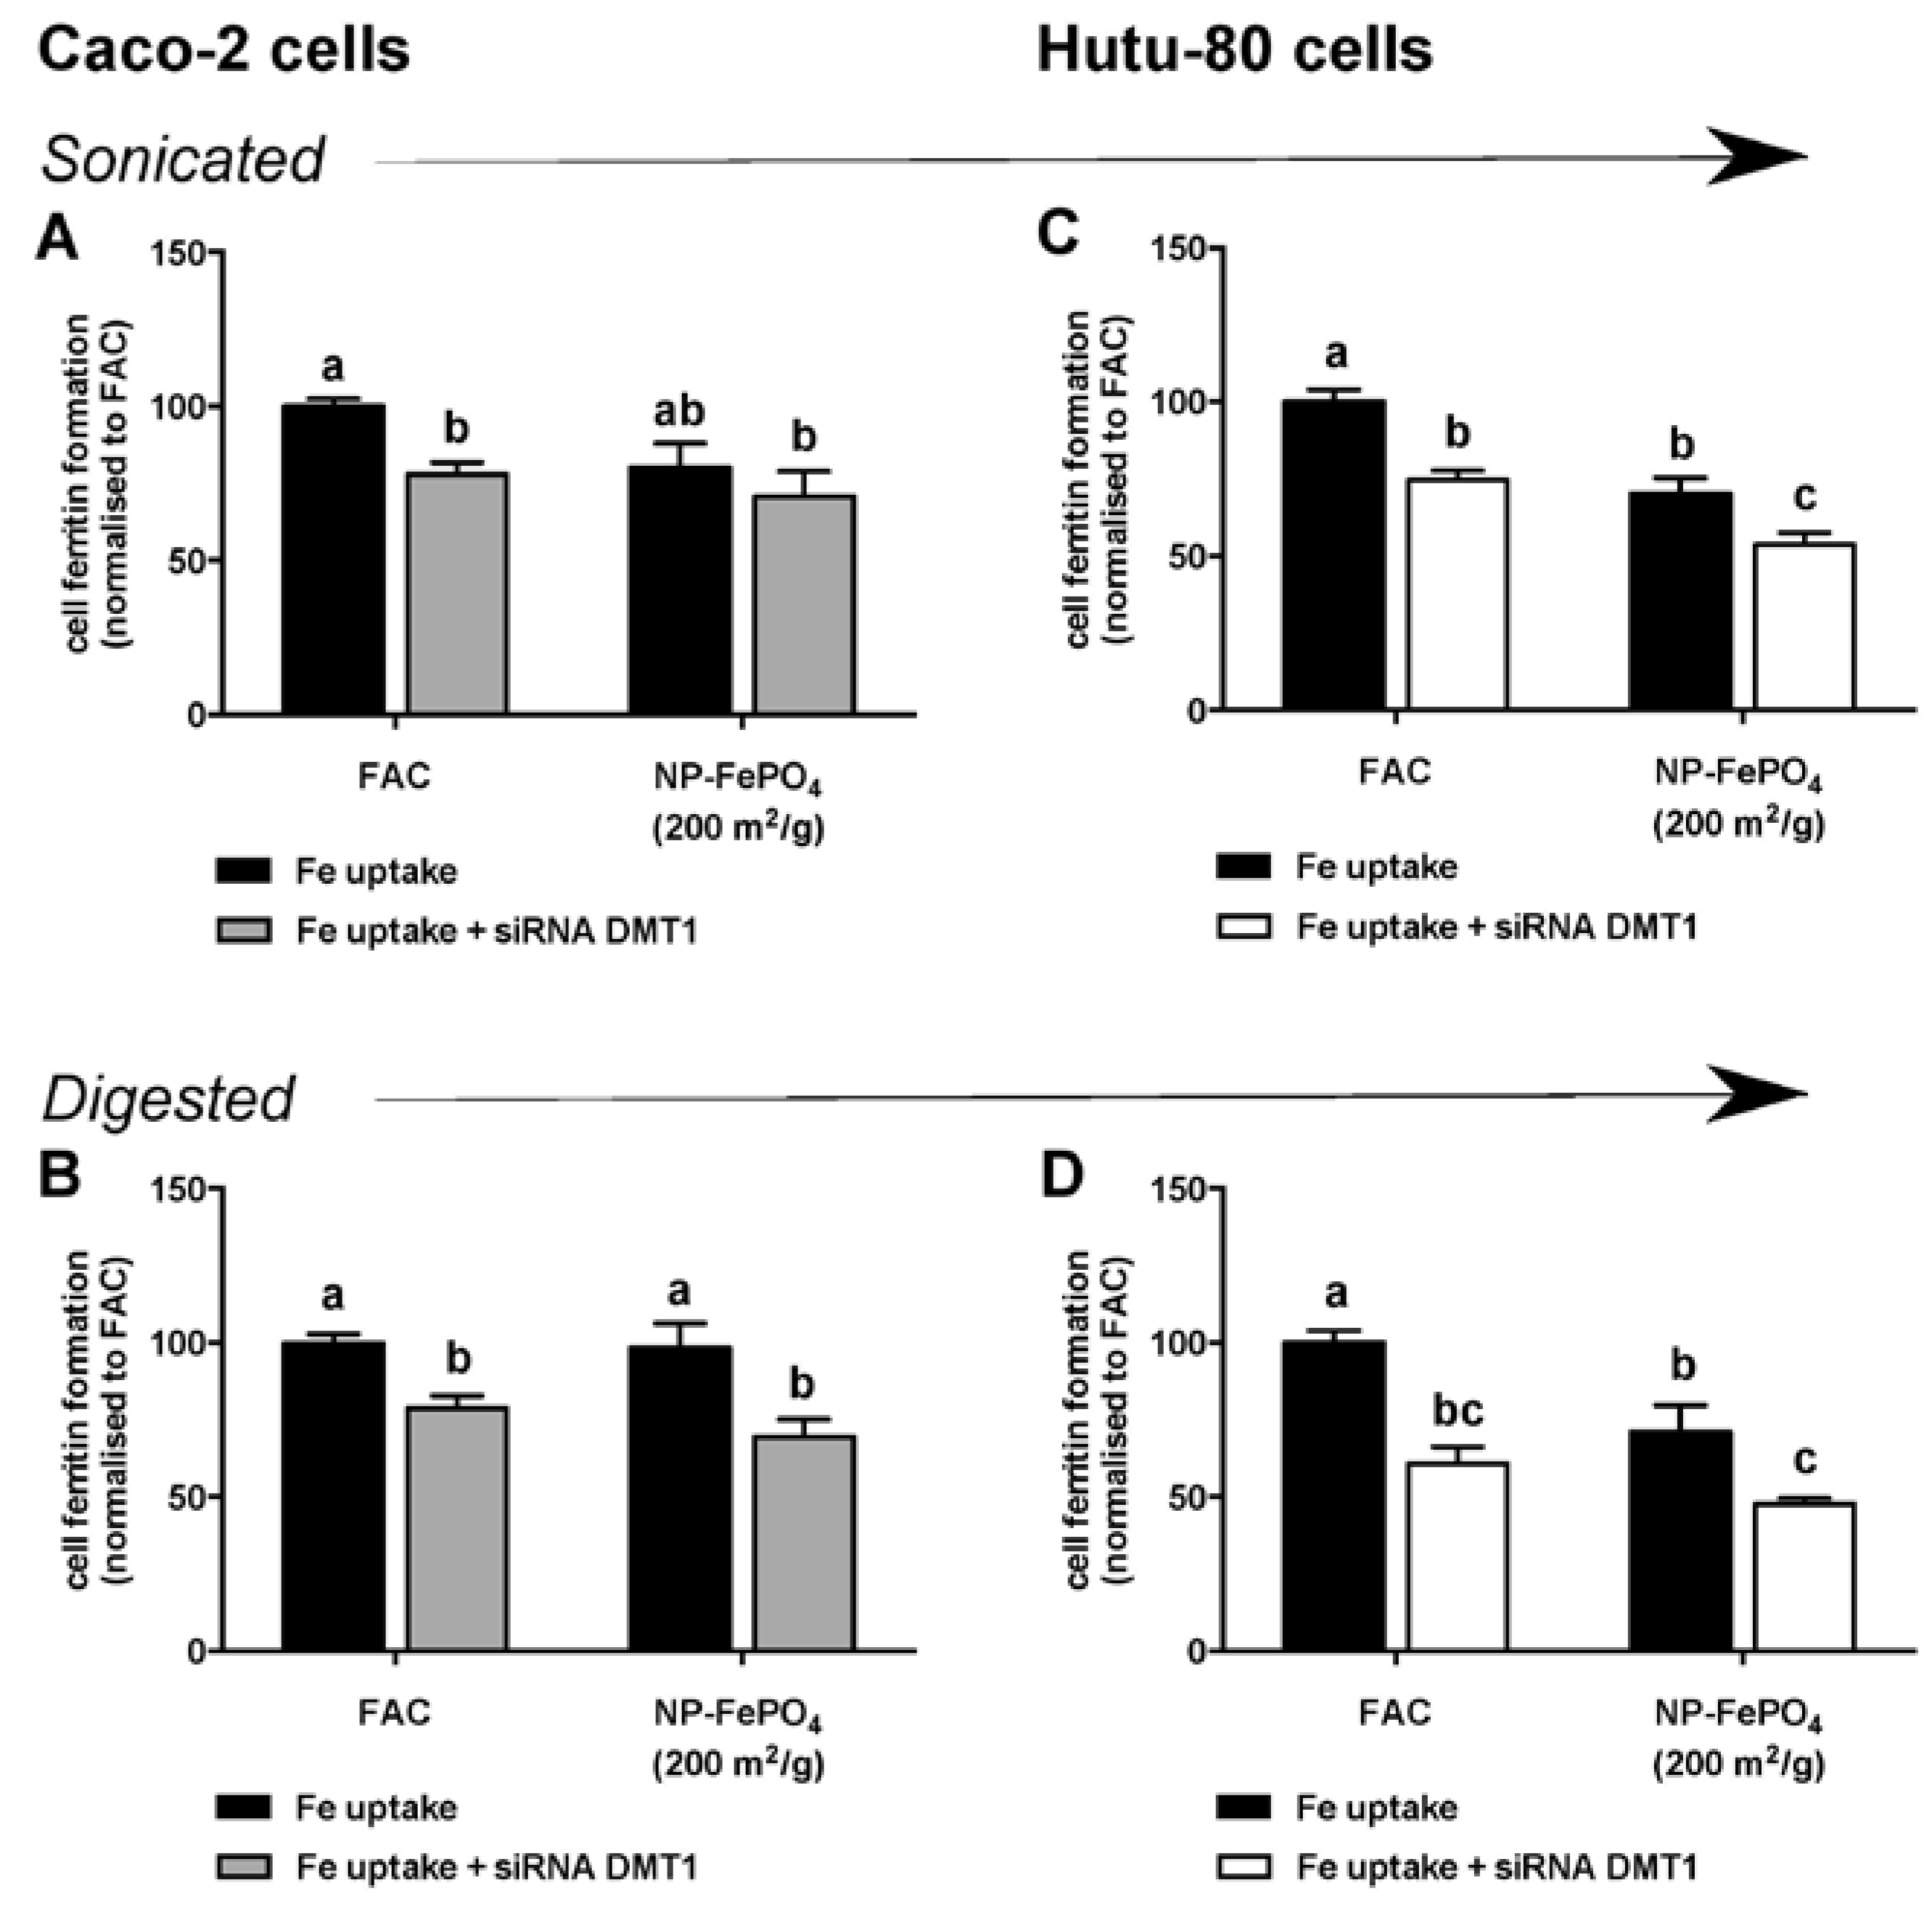
3.2.3. Effect of siRNA-Mediated Knockdown of DMT1 in Caco-2 and Hutu-80 Cells
4. Discussion
5. Conclusions
Supplementary Materials
Acknowledgments
Author Contributions
Conflicts of Interest
References
- Zimmermann, M.B.; Hurrell, R.F. Nutritional iron deficiency. Lancet 2007, 370, 511–520. [Google Scholar] [CrossRef]
- Hurrell, R.F. Preventing iron deficiency through food fortification. Nutr. Rev. 1997, 55, 210–222. [Google Scholar] [CrossRef] [PubMed]
- World Health Organization. Iron Deficiency Anaemia: Assessment, Prevention and Control: A Guide for Programme Managers; WHO: Geneva, Switzerland, 2001. [Google Scholar]
- Forbes, A.L.; Arnaud, M.; Chichester, C.; Cook, J.; Harrison, B.; Hurrell, R.; Kahn, S.; Morris, E.; Tanner, J.; Whittaker, P. Comparison of in vitro, animal, and clinical determinations of iron bioavailability: International nutritional anemia consultative group task force report on iron bioavailability. Am. J. Clin. Nutr. 1989, 49, 225–238. [Google Scholar] [PubMed]
- Hurrell, R.F. Fortification: Overcoming technical and practical barriers. J. Nutr. 2002, 132, 806S–812S. [Google Scholar] [PubMed]
- Hoppe, M.; Hulthén, L.; Hallberg, L. The relative bioavailability in humans of elemental iron powders for use in food fortification. Eur. J. Nutr. 2006, 45, 37–44. [Google Scholar] [CrossRef] [PubMed]
- Harrison, B.; Pla, G.; Clark, G.; Fritz, J. Selection of iron sources for cereal enrichment. Cereal Chem. 1976, 53, 78–84. [Google Scholar]
- Rohner, F.; Ernst, F.O.; Arnold, M.; Hilbe, M.; Biebinger, R.; Ehrensperger, F.; Pratsinis, S.E.; Langhans, W.; Hurrell, R.F.; Zimmermann, M.B. Synthesis, characterization, and bioavailability in rats of ferric phosphate nanoparticles. J. Nutr. 2007, 137, 614–619. [Google Scholar] [PubMed]
- Hurrell, R.F. Bioavailability of iron. Eur. J. Clin. Nutr. 1997, 51, S4–S8. [Google Scholar] [PubMed]
- Sharp, P.; Srai, S.K. Molecular mechanisms involved in intestinal iron absorption. World J. Gastroenterol. 2007, 13, 4716–4724. [Google Scholar] [CrossRef] [PubMed]
- Reddy, M.B.; Cook, J.D. Assessment of dietary determinants of nonheme-iron absorption in humans and rats. Am. J. Clin. Nutr. 1991, 54, 723–728. [Google Scholar] [PubMed]
- Hilty, F.M.; Arnold, M.; Hilbe, M.; Teleki, A.; Knijnenburg, J.T.; Ehrensperger, F.; Hurrell, R.F.; Pratsinis, S.E.; Langhans, W.; Zimmermann, M.B. Iron from nanocompounds containing iron and zinc is highly bioavailable in rats without tissue accumulation. Nat. Nanotechnol. 2010, 5, 374–380. [Google Scholar] [CrossRef] [PubMed]
- Glahn, R.P.; Lee, O.A.; Yeung, A.; Goldman, M.I.; Miller, D.D. Caco-2 cell ferritin formation predicts nonradiolabeled food iron availability in an in vitro digestion/caco-2 cell culture model. J. Nutr. 1998, 128, 1555–1561. [Google Scholar] [PubMed]
- Glahn, R.P.; Wortley, G.M.; South, P.K.; Miller, D.D. Inhibition of iron uptake by phytic acid, tannic acid, and zncl2: Studies using an in vitro digestion/caco-2 cell model. J. Agric. Food Chem. 2002, 50, 390–395. [Google Scholar] [CrossRef] [PubMed]
- Eagling, T.; Wawer, A.A.; Shewry, P.R.; Zhao, F.-J.; Fairweather-Tait, S.J. Iron bioavailability in two commercial cultivars of wheat: Comparison between wholegrain and white flour and the effects of nicotianamine and 2′-deoxymugineic acid on iron uptake into caco-2 cells. J. Agric. Food Chem. 2014, 62, 10320–10325. [Google Scholar] [CrossRef] [PubMed]
- Gerloff, K.; Pereira, D.I.; Faria, N.; Boots, A.W.; Kolling, J.; Förster, I.; Albrecht, C.; Powell, J.J.; Schins, R.P. Influence of simulated gastrointestinal conditions on particle-induced cytotoxicity and interleukin-8 regulation in differentiated and undifferentiated caco-2 cells. Nanotoxicology 2013, 7, 353–366. [Google Scholar] [CrossRef] [PubMed]
- Swain, J.H.; Newman, S.M.; Hunt, J.R. Bioavailability of elemental iron powders to rats is less than bakery-grade ferrous sulfate and predicted by iron solubility and particle surface area. J. Nutr. 2003, 133, 3546–3552. [Google Scholar] [PubMed]
- Wang, X.; Ghio, A.J.; Yang, F.; Dolan, K.G.; Garrick, M.D.; Piantadosi, C.A. Iron uptake and nramp2/dmt1/dct1 in human bronchial epithelial cells. Am. J. Physiol. Lung Cell Mol. Physiol. 2002, 282, L987–L995. [Google Scholar] [CrossRef] [PubMed]
- Tulpule, K.; Robinson, S.R.; Bishop, G.M.; Dringen, R. Uptake of ferrous iron by cultured rat astrocytes. J. Neurosci. Res. 2010, 88, 563–571. [Google Scholar] [CrossRef] [PubMed]
- Thompson, B.A.; Sharp, P.A.; Elliott, R.; Fairweather-Tait, S.J. Inhibitory effect of calcium on non-heme iron absorption may be related to translocation of dmt-1 at the apical membrane of enterocytes. J. Agric. Food Chem. 2010, 58, 8414–8417. [Google Scholar] [CrossRef] [PubMed]
- Arredondo, M.; Kloosterman, J.; Núñez, S.; Segovia, F.; Candia, V.; Flores, S.; Le Blanc, S.; Olivares, M.; Pizarro, F. Heme iron uptake by caco-2 cells is a saturable, temperature sensitive and modulated by extracellular ph and potassium. Biol. Trace Element Res. 2008, 125, 109–119. [Google Scholar] [CrossRef] [PubMed]
- San Martin, C.D.; Garri, C.; Pizarro, F.; Walter, T.; Theil, E.C.; Núñez, M.T. Caco-2 intestinal epithelial cells absorb soybean ferritin by μ2 (ap2)-dependent endocytosis. J. Nutr. 2008, 138, 659–666. [Google Scholar] [PubMed]
- Kalgaonkar, S.; Lönnerdal, B. Receptor-mediated uptake of ferritin-bound iron by human intestinal caco-2 cells. J. Nutr. Biochem. 2009, 20, 304–311. [Google Scholar] [CrossRef] [PubMed]
- Bourseau-Guilmain, E.; Griveau, A.; Benoit, J.-P.; Garcion, E. The importance of the stem cell marker prominin-1/cd133 in the uptake of transferrin and in iron metabolism in human colon cancer caco-2 cells. PLoS ONE 2011, 6, e25515. [Google Scholar] [CrossRef] [PubMed]
- Krieger, S.E.; Kim, C.; Zhang, L.; Marjomaki, V.; Bergelson, J.M. Echovirus 1 entry into polarized caco-2 cells depends on dynamin, cholesterol, and cellular factors associated with macropinocytosis. J. Virol. 2013, 87, 8884–8895. [Google Scholar] [CrossRef] [PubMed]
- Pereira, D.I.; Mergler, B.I.; Faria, N.; Bruggraber, S.F.; Aslam, M.F.; Poots, L.K.; Prassmayer, L.; Lönnerdal, B.; Brown, A.P.; Powell, J.J. Caco-2 cell acquisition of dietary iron (iii) invokes a nanoparticulate endocytic pathway. PLoS ONE 2013, 8, e81250. [Google Scholar] [CrossRef] [PubMed]
- Latunde-Dada, G.O.; Pereira, D.I.; Tempest, B.; Ilyas, H.; Flynn, A.C.; Aslam, M.F.; Simpson, R.J.; Powell, J.J. A nanoparticulate ferritin-core mimetic is well taken up by hutu 80 duodenal cells and its absorption in mice is regulated by body iron. J. Nutr. 2014, 144, 1896–1902. [Google Scholar] [CrossRef] [PubMed]
- Livak, K.J.; Schmittgen, T.D. Analysis of relative gene expression data using real-time quantitative pcr and the 2−(delta delta c(t)) method. Methods 2001, 25, 402–408. [Google Scholar] [CrossRef] [PubMed]
- Motzok, I.; Pennell, M.; Davies, M.; Ross, H. Effect of particle size on the biological availability of reduced iron. J. Assoc. Off. Anal. Chem. 1975, 58, 99–103. [Google Scholar] [PubMed]
- Lynch, S.R. The impact of iron fortification on nutritional anaemia. Best Pract. Res. Clin. Haematol. 2005, 18, 333–346. [Google Scholar] [CrossRef] [PubMed]
- Fidler, M.C.; Walczyk, T.; Davidsson, L.; Zeder, C.; Sakaguchi, N.; Juneja, L.R.; Hurrell, R.F. A micronised, dispersible ferric pyrophosphate with high relative bioavailability in man. Br. J. Nutr. 2004, 91, 107–112. [Google Scholar] [CrossRef] [PubMed]
- Wegmüller, R.; Camara, F.; Zimmermann, M.B.; Adou, P.; Hurrell, R.F. Salt dual-fortified with iodine and micronized ground ferric pyrophosphate affects iron status but not hemoglobin in children in cote d'ivoire. J. Nutr. 2006, 136, 1814–1820. [Google Scholar] [PubMed]
- Moretti, D.; Zimmermann, M.B.; Muthayya, S.; Thankachan, P.; Lee, T.-C.; Kurpad, A.V.; Hurrell, R.F. Extruded rice fortified with micronized ground ferric pyrophosphate reduces iron deficiency in indian schoolchildren: A double-blind randomized controlled trial. Am. J. Clin. Nutr. 2006, 84, 822–829. [Google Scholar] [PubMed]
- Roe, M.A.; Collings, R.; Hoogewerff, J.; Fairweather-Tait, S.J. Relative bioavailability of micronized, dispersible ferric pyrophosphate added to an apple juice drink. Eur. J. Nutr. 2009, 48, 115–119. [Google Scholar] [CrossRef] [PubMed]
- Nel, A.; Xia, T.; Mädler, L.; Li, N. Toxic potential of materials at the nanolevel. Science 2006, 311, 622–627. [Google Scholar] [CrossRef] [PubMed]
- Des Rieux, A.; Ragnarsson, E.G.; Gullberg, E.; Préat, V.; Schneider, Y.-J.; Artursson, P. Transport of nanoparticles across an in vitro model of the human intestinal follicle associated epithelium. Eur. J. Pharm. Sci. 2005, 25, 455–465. [Google Scholar] [CrossRef] [PubMed]
- Abbott, L.C.; Maynard, A.D. Exposure assessment approaches for engineered nanomaterials. Risk Anal. 2010, 30, 1634–1644. [Google Scholar] [CrossRef] [PubMed]
- Fröhlich, E. The role of surface charge in cellular uptake and cytotoxicity of medical nanoparticles. Int. J. Nanomed. 2012, 7, 5577–5591. [Google Scholar] [CrossRef] [PubMed]
- Wawer, A.A.; Sharp, P.A.; Perez-Moral, N.; Fairweather-Tait, S.J. Evidence for an enhancing effect of alginate on iron availability in caco-2 cells. J. Agric. Food Chem. 2012, 60, 11318–11322. [Google Scholar] [CrossRef] [PubMed]
- Au, A.P.; Reddy, M.B. Caco-2 cells can be used to assess human iron bioavailability from a semipurified meal. J. Nutr. 2000, 130, 1329–1334. [Google Scholar] [PubMed]
- Yun, S.; Habicht, J.-P.; Miller, D.D.; Glahn, R.P. An in vitro digestion/caco-2 cell culture system accurately predicts the effects of ascorbic acid and polyphenolic compounds on iron bioavailability in humans. J. Nutr. 2004, 134, 2717–2721. [Google Scholar] [PubMed]
- Lynch; B.; Campbell, L. A comparison of physical properties, screening procedures and a human efficacy trial for predicting the bioavailability of commercial elemental iron powders used for food fortification. Int. J. Vitam. Nutr. Res. 2007, 77, 107–124. [Google Scholar] [CrossRef] [PubMed]
- Arredondo, M.; Salvat, V.; Pizarro, F.; Olivares, M. Smaller iron particle size improves bioavailability of hydrogen-reduced iron–fortified bread. Nutr. Res. 2006, 26, 235–239. [Google Scholar] [CrossRef]
- He, W.-L.; Feng, Y.; Li, X.-L.; Yang, X.-E. Comparison of iron uptake from reduced iron powder and feso4 using the caco-2 cell model: Effects of ascorbic acid, phytic acid, and ph. J. Agric. Food Chem. 2008, 56, 2637–2642. [Google Scholar] [CrossRef] [PubMed]
- Wortley, G.; Leusner, S.; Good, C.; Gugger, E.; Glahn, R. Iron availability of a fortified processed wheat cereal: A comparison of fourteen iron forms using an in vitro digestion/human colonic adenocarcinoma (caco-2) cell model. Br. J. Nutr. 2005, 93, 65–71. [Google Scholar] [CrossRef] [PubMed]
- Yeung, C.K.; Miller, D.D.; Cheng, Z.; Glahn, R.E. Bioavailability of elemental iron powders in bread assessed with an in vitro digestion/caco-2 cell culture model. J. Food Sci. 2005, 70, S199–S203. [Google Scholar] [CrossRef]
- Conrad, M.E.; Umbreit, J.N. Iron absorption and transport—An update. Am. J. Hematol. 2000, 64, 287–298. [Google Scholar] [CrossRef]
- Kararli, T.T. Comparison of the gastrointestinal anatomy, physiology, and biochemistry of humans and commonly used laboratory animals. Biopharm. Drug Dispos. 1995, 16, 351–380. [Google Scholar] [CrossRef] [PubMed]
- McConnell, E.L.; Basit, A.W.; Murdan, S. Measurements of rat and mouse gastrointestinal ph, fluid and lymphoid tissue, and implications for in-vivo experiments. J. Pharm. Pharmacol. 2008, 60, 63–70. [Google Scholar] [CrossRef] [PubMed]
- Des Rieux, A.; Fievez, V.; Théate, I.; Mast, J.; Préat, V.; Schneider, Y.-J. An improved in vitro model of human intestinal follicle-associated epithelium to study nanoparticle transport by m cells. Eur. J. Pharm. Sci. 2007, 30, 380–391. [Google Scholar] [CrossRef] [PubMed]
- Jahn, M.R.; Nawroth, T.; Fütterer, S.; Wolfrum, U.; Kolb, U.; Langguth, P. Iron oxide/hydroxide nanoparticles with negatively charged shells show increased uptake in caco-2 cells. Mol. Pharmacol. 2012, 9, 1628–1637. [Google Scholar] [CrossRef] [PubMed]
- Antileo, E.; Garri, C.; Tapia, V.; Muñoz, J.P.; Chiong, M.; Nualart, F.; Lavandero, S.; Fernández, J.; Núñez, M.T. Endocytic pathway of exogenous iron-loaded ferritin in intestinal epithelial (Caco-2) cells. Am. J. Physiol.-Gastrointest. Liver Physiol. 2013, 304, G655–G661. [Google Scholar] [CrossRef] [PubMed]
- Mahler, G.J.; Shuler, M.L.; Glahn, R.P. Characterization of caco-2 and ht29-mtx cocultures in an in vitro digestion/cell culture model used to predict iron bioavailability. J. Nutr. Biochem. 2009, 20, 494–502. [Google Scholar] [CrossRef] [PubMed]
- Mahler, G.J.; Esch, M.B.; Tako, E.; Southard, T.L.; Archer, S.D.; Glahn, R.P.; Shuler, M.L. Oral exposure to polystyrene nanoparticles affects iron absorption. Nat. Nanotechnol. 2012, 7, 264–271. [Google Scholar] [CrossRef] [PubMed]
- World Health Organization; Allen, L.H.; De Benoist, B.; Dary, O.; Hurrell, R. Guidelines on Food Fortification with Micronutrients; World Health Organization: Geneva, Switzerland, 2006. [Google Scholar]


© 2017 by the authors. Licensee MDPI, Basel, Switzerland. This article is an open access article distributed under the terms and conditions of the Creative Commons Attribution (CC BY) license (http://creativecommons.org/licenses/by/4.0/).
Share and Cite
Perfecto, A.; Elgy, C.; Valsami-Jones, E.; Sharp, P.; Hilty, F.; Fairweather-Tait, S. Mechanisms of Iron Uptake from Ferric Phosphate Nanoparticles in Human Intestinal Caco-2 Cells. Nutrients 2017, 9, 359. https://doi.org/10.3390/nu9040359
Perfecto A, Elgy C, Valsami-Jones E, Sharp P, Hilty F, Fairweather-Tait S. Mechanisms of Iron Uptake from Ferric Phosphate Nanoparticles in Human Intestinal Caco-2 Cells. Nutrients. 2017; 9(4):359. https://doi.org/10.3390/nu9040359
Chicago/Turabian StylePerfecto, Antonio, Christine Elgy, Eugenia Valsami-Jones, Paul Sharp, Florentine Hilty, and Susan Fairweather-Tait. 2017. "Mechanisms of Iron Uptake from Ferric Phosphate Nanoparticles in Human Intestinal Caco-2 Cells" Nutrients 9, no. 4: 359. https://doi.org/10.3390/nu9040359