Butyrate Reduces HFD-Induced Adipocyte Hypertrophy and Metabolic Risk Factors in Obese LDLr-/-.Leiden Mice

 , ,
, ,
Abstract
:1. Introduction
2. Materials and Methods
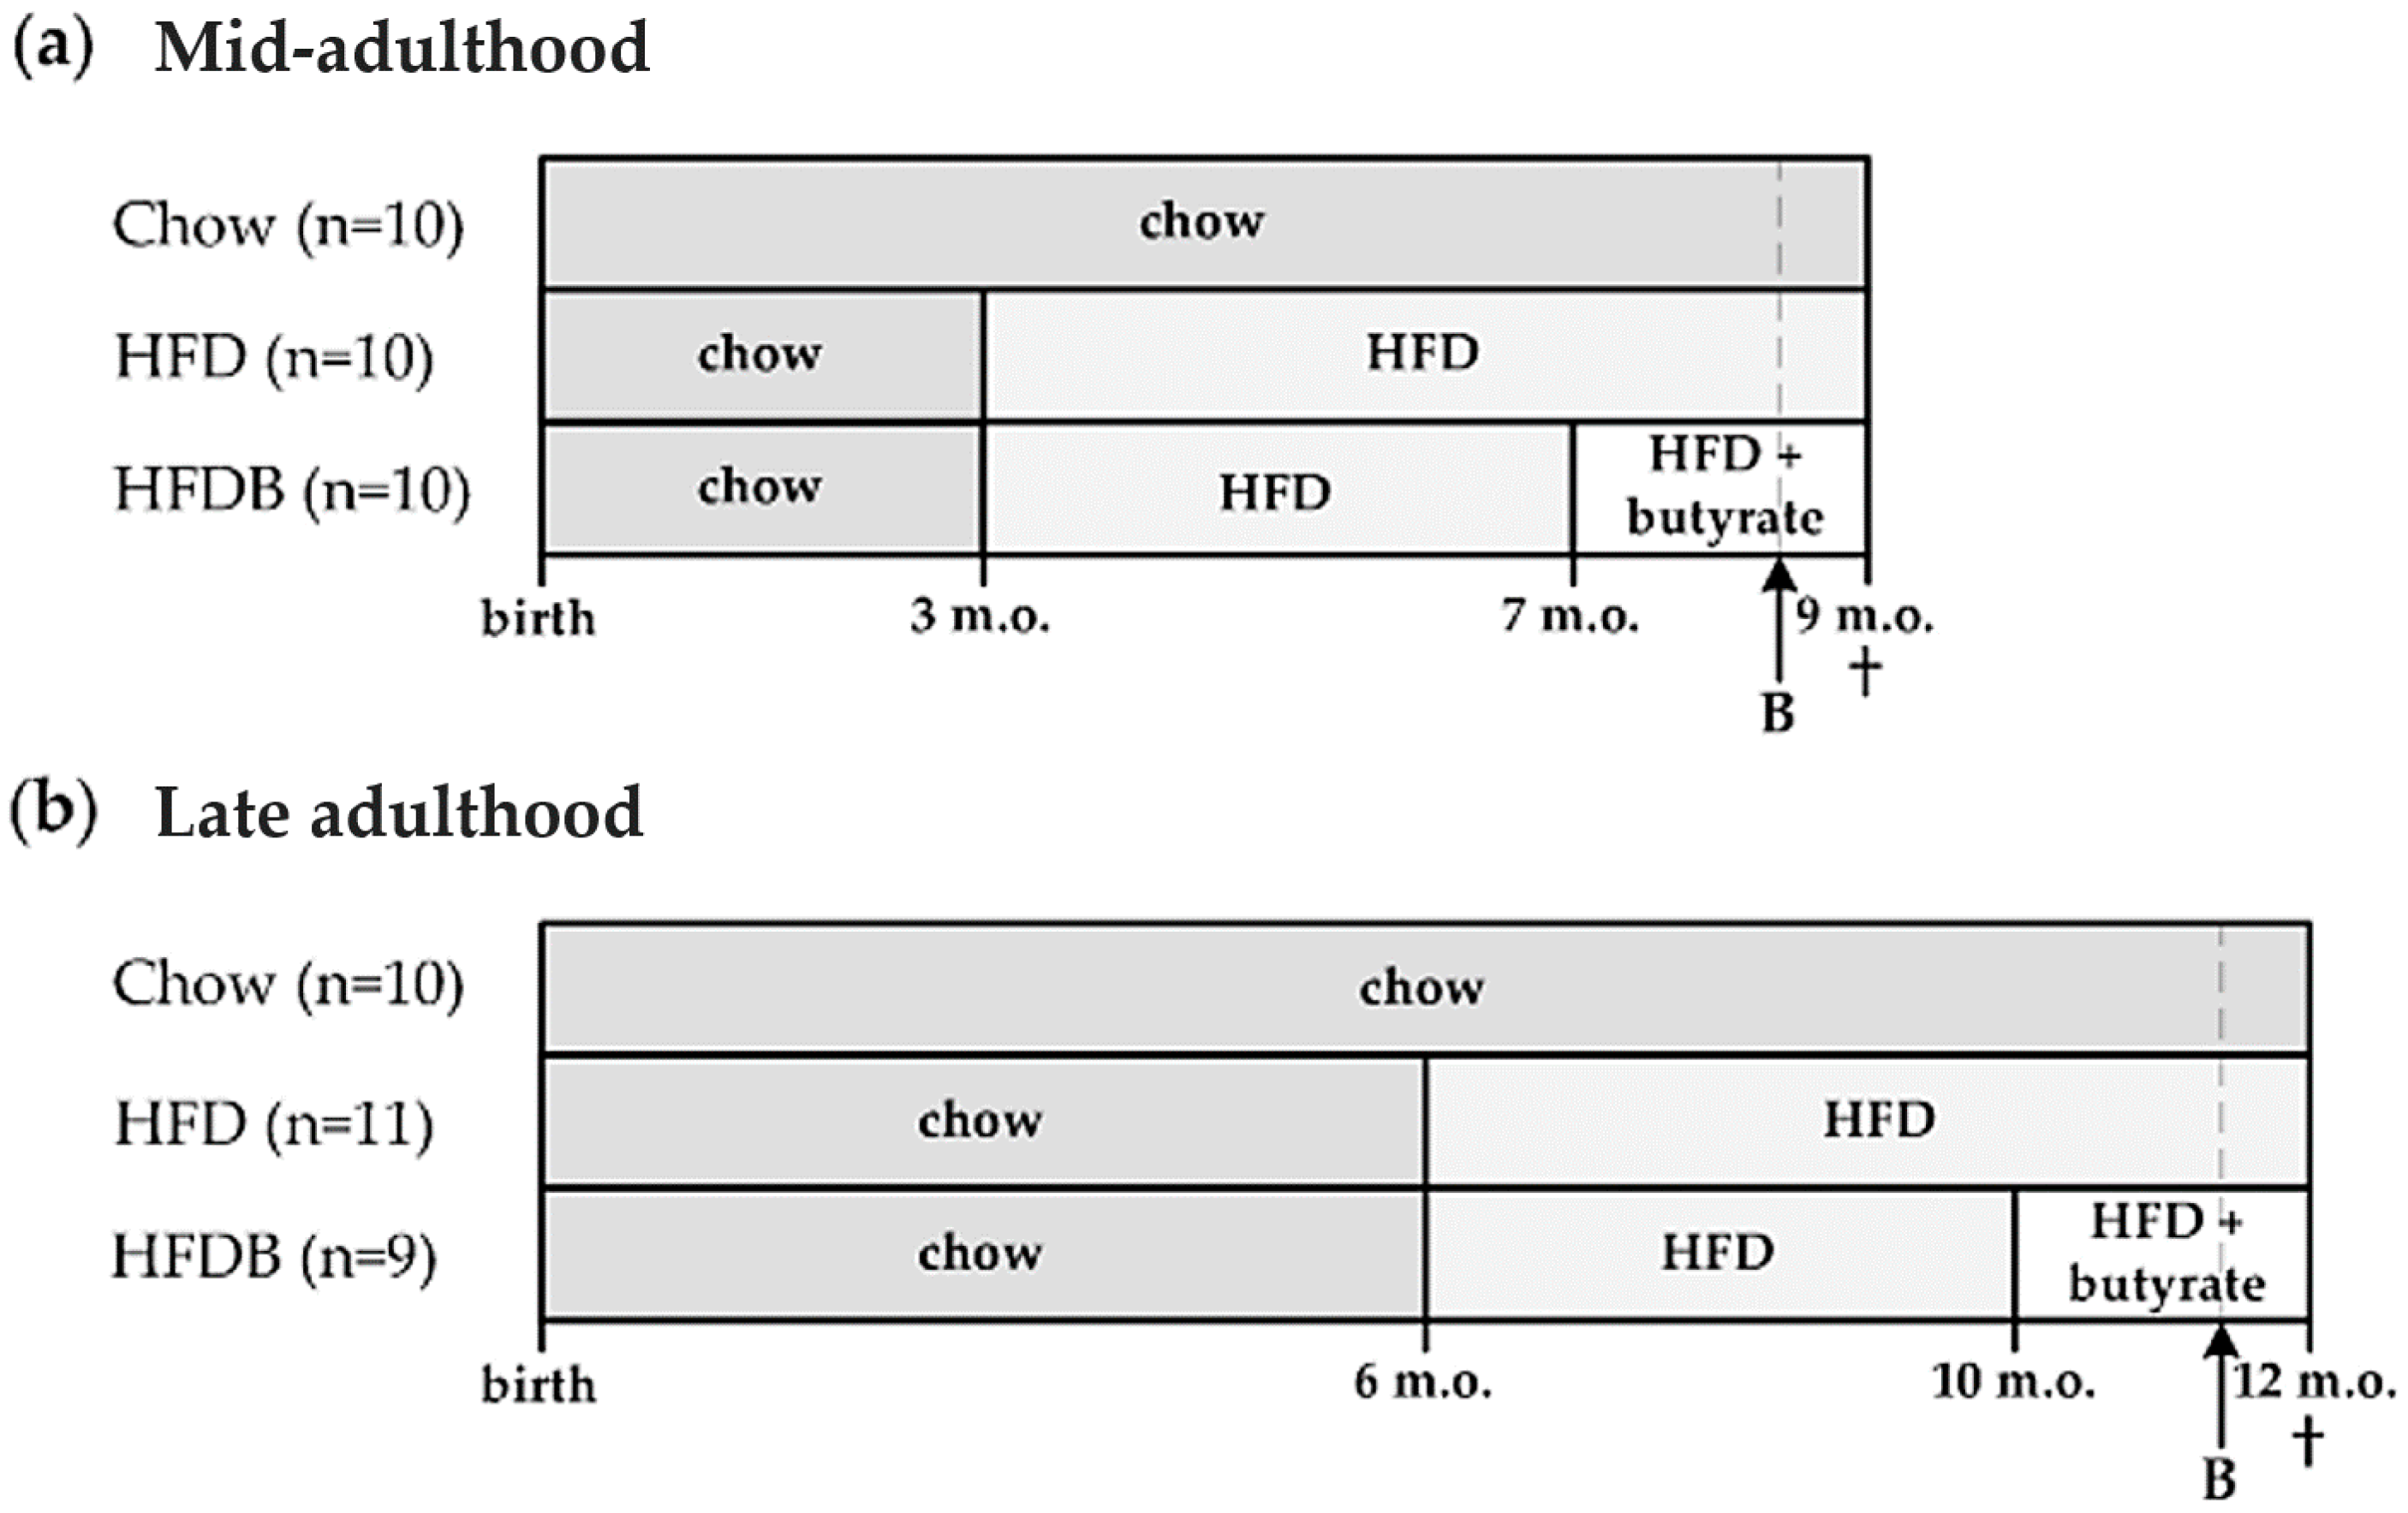
2.1. Animals and Diets
2.2. Plasma Analyses
2.3. (Immuno)histochemistry
2.4. Statistical Analyses
3. Results
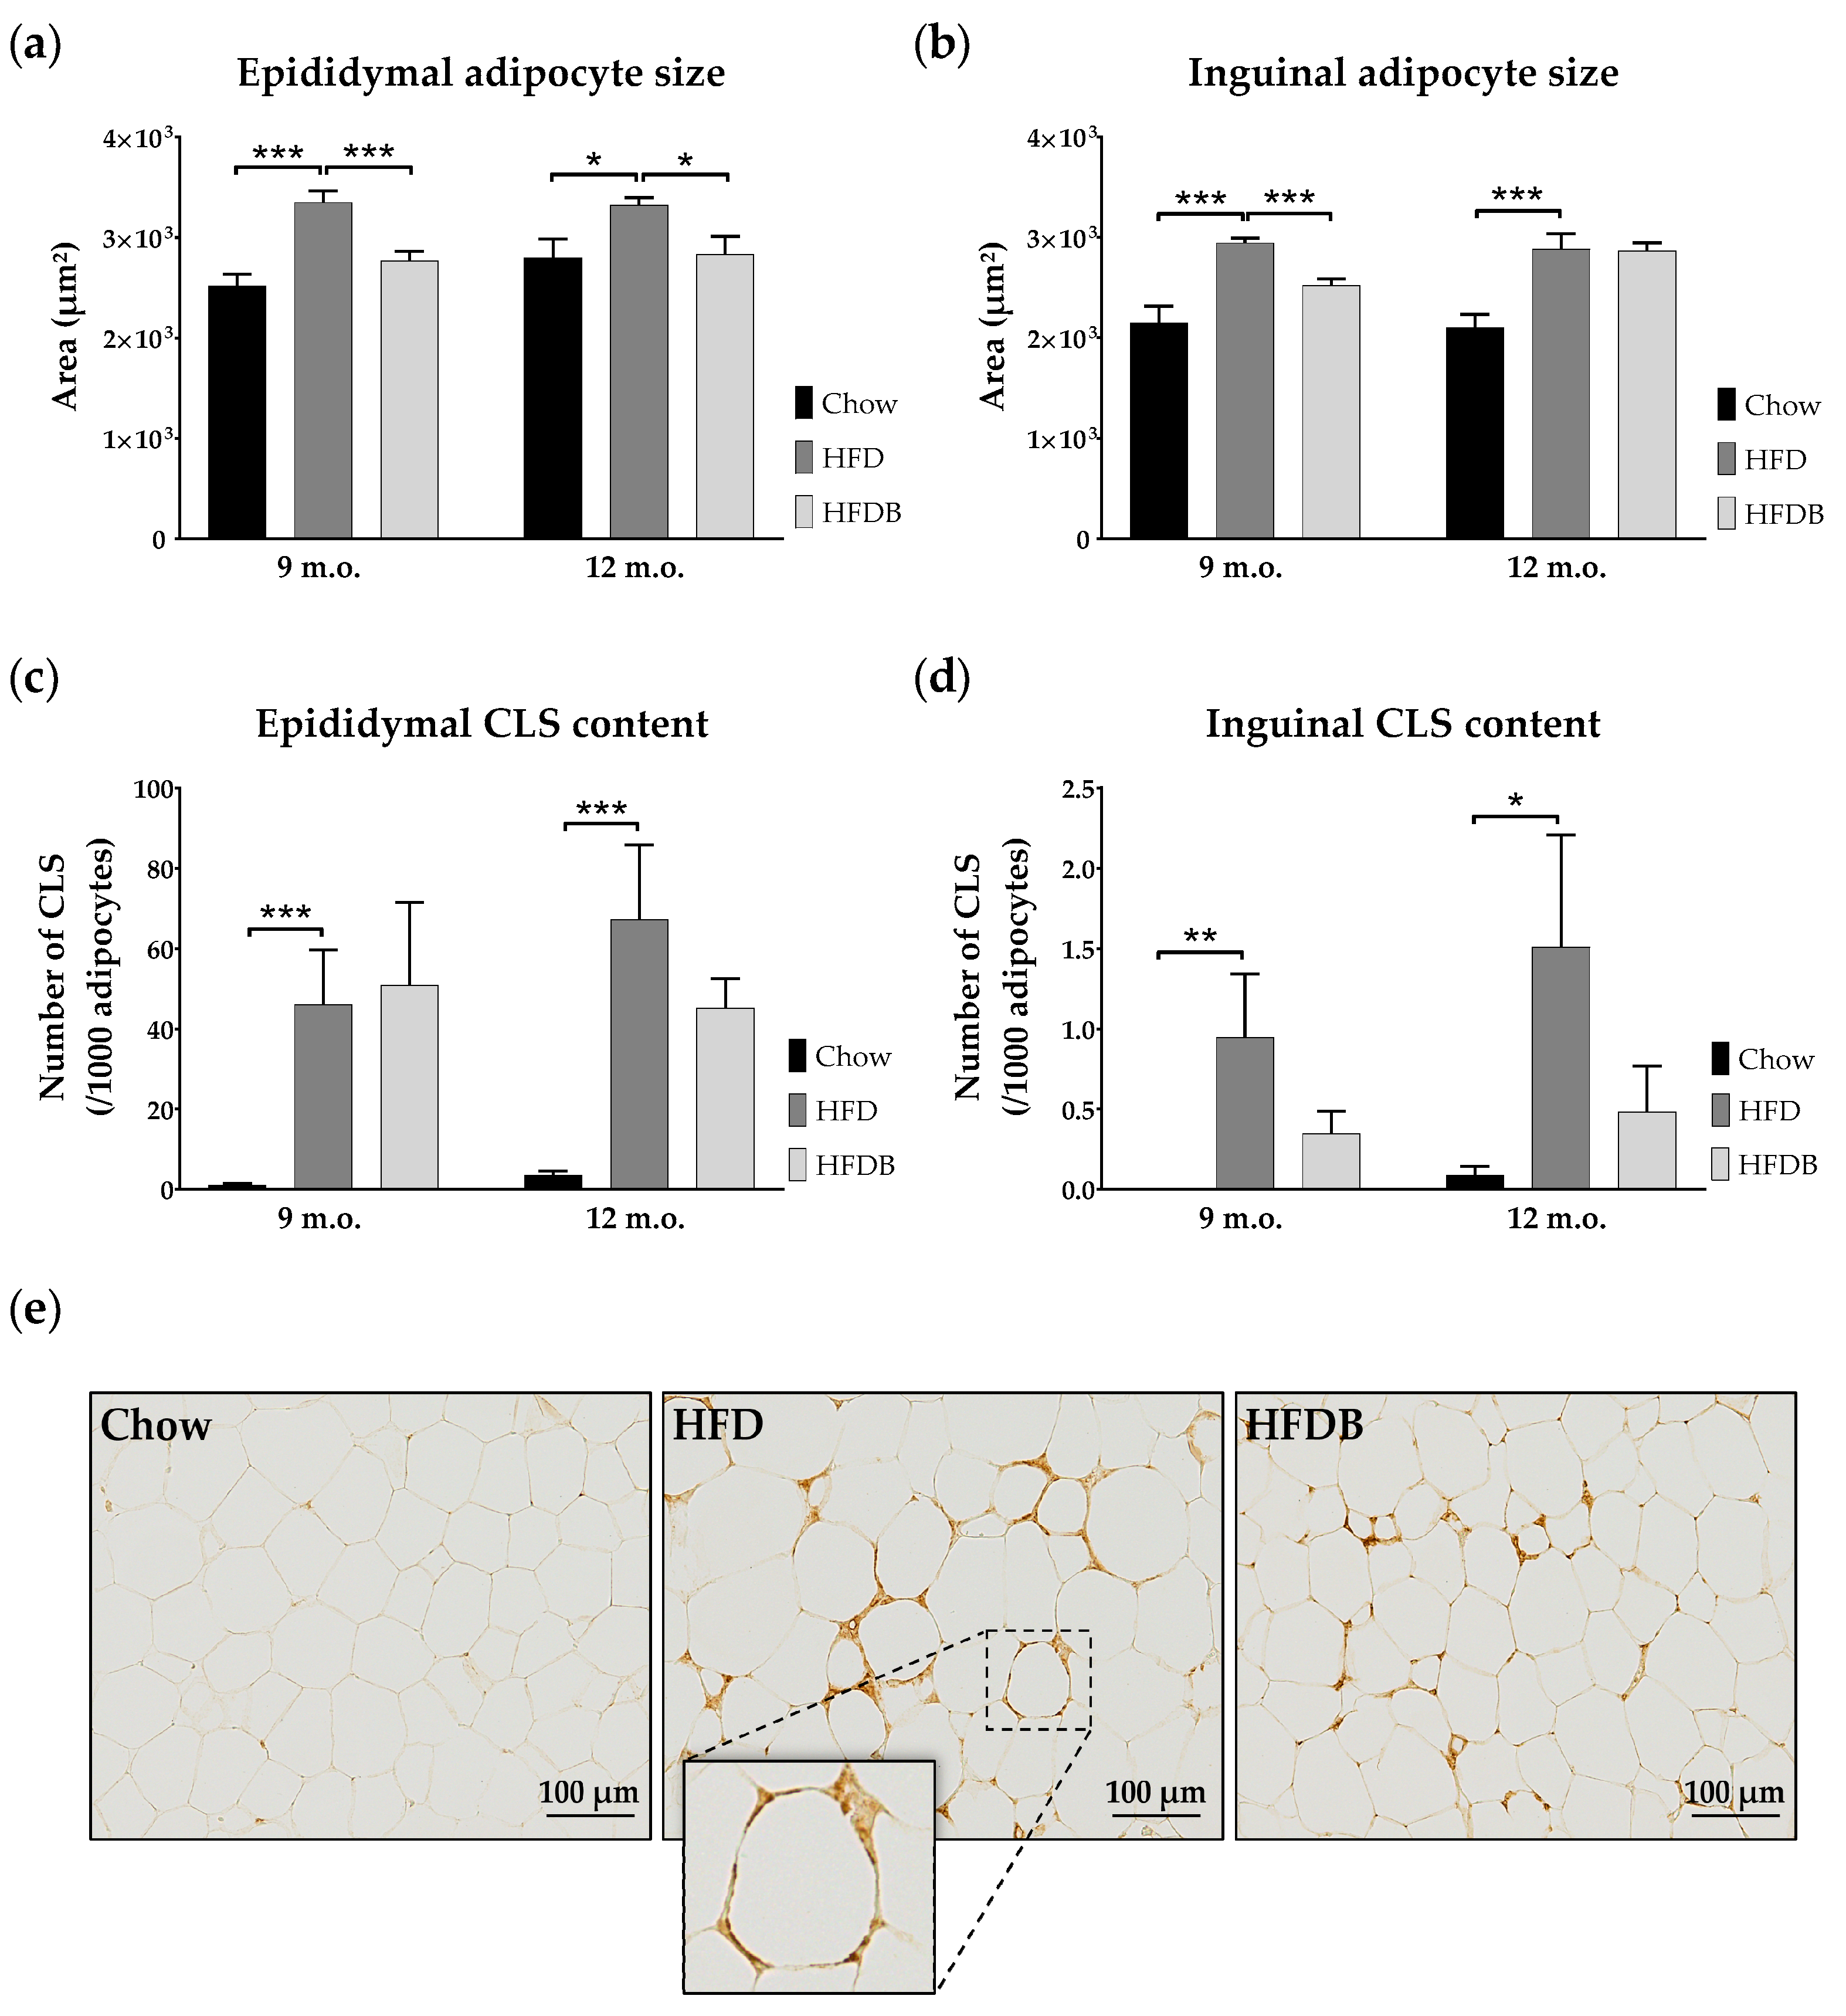
3.1. Adipocyte Size
3.2. Inflammation in Adipose Tissue and Liver
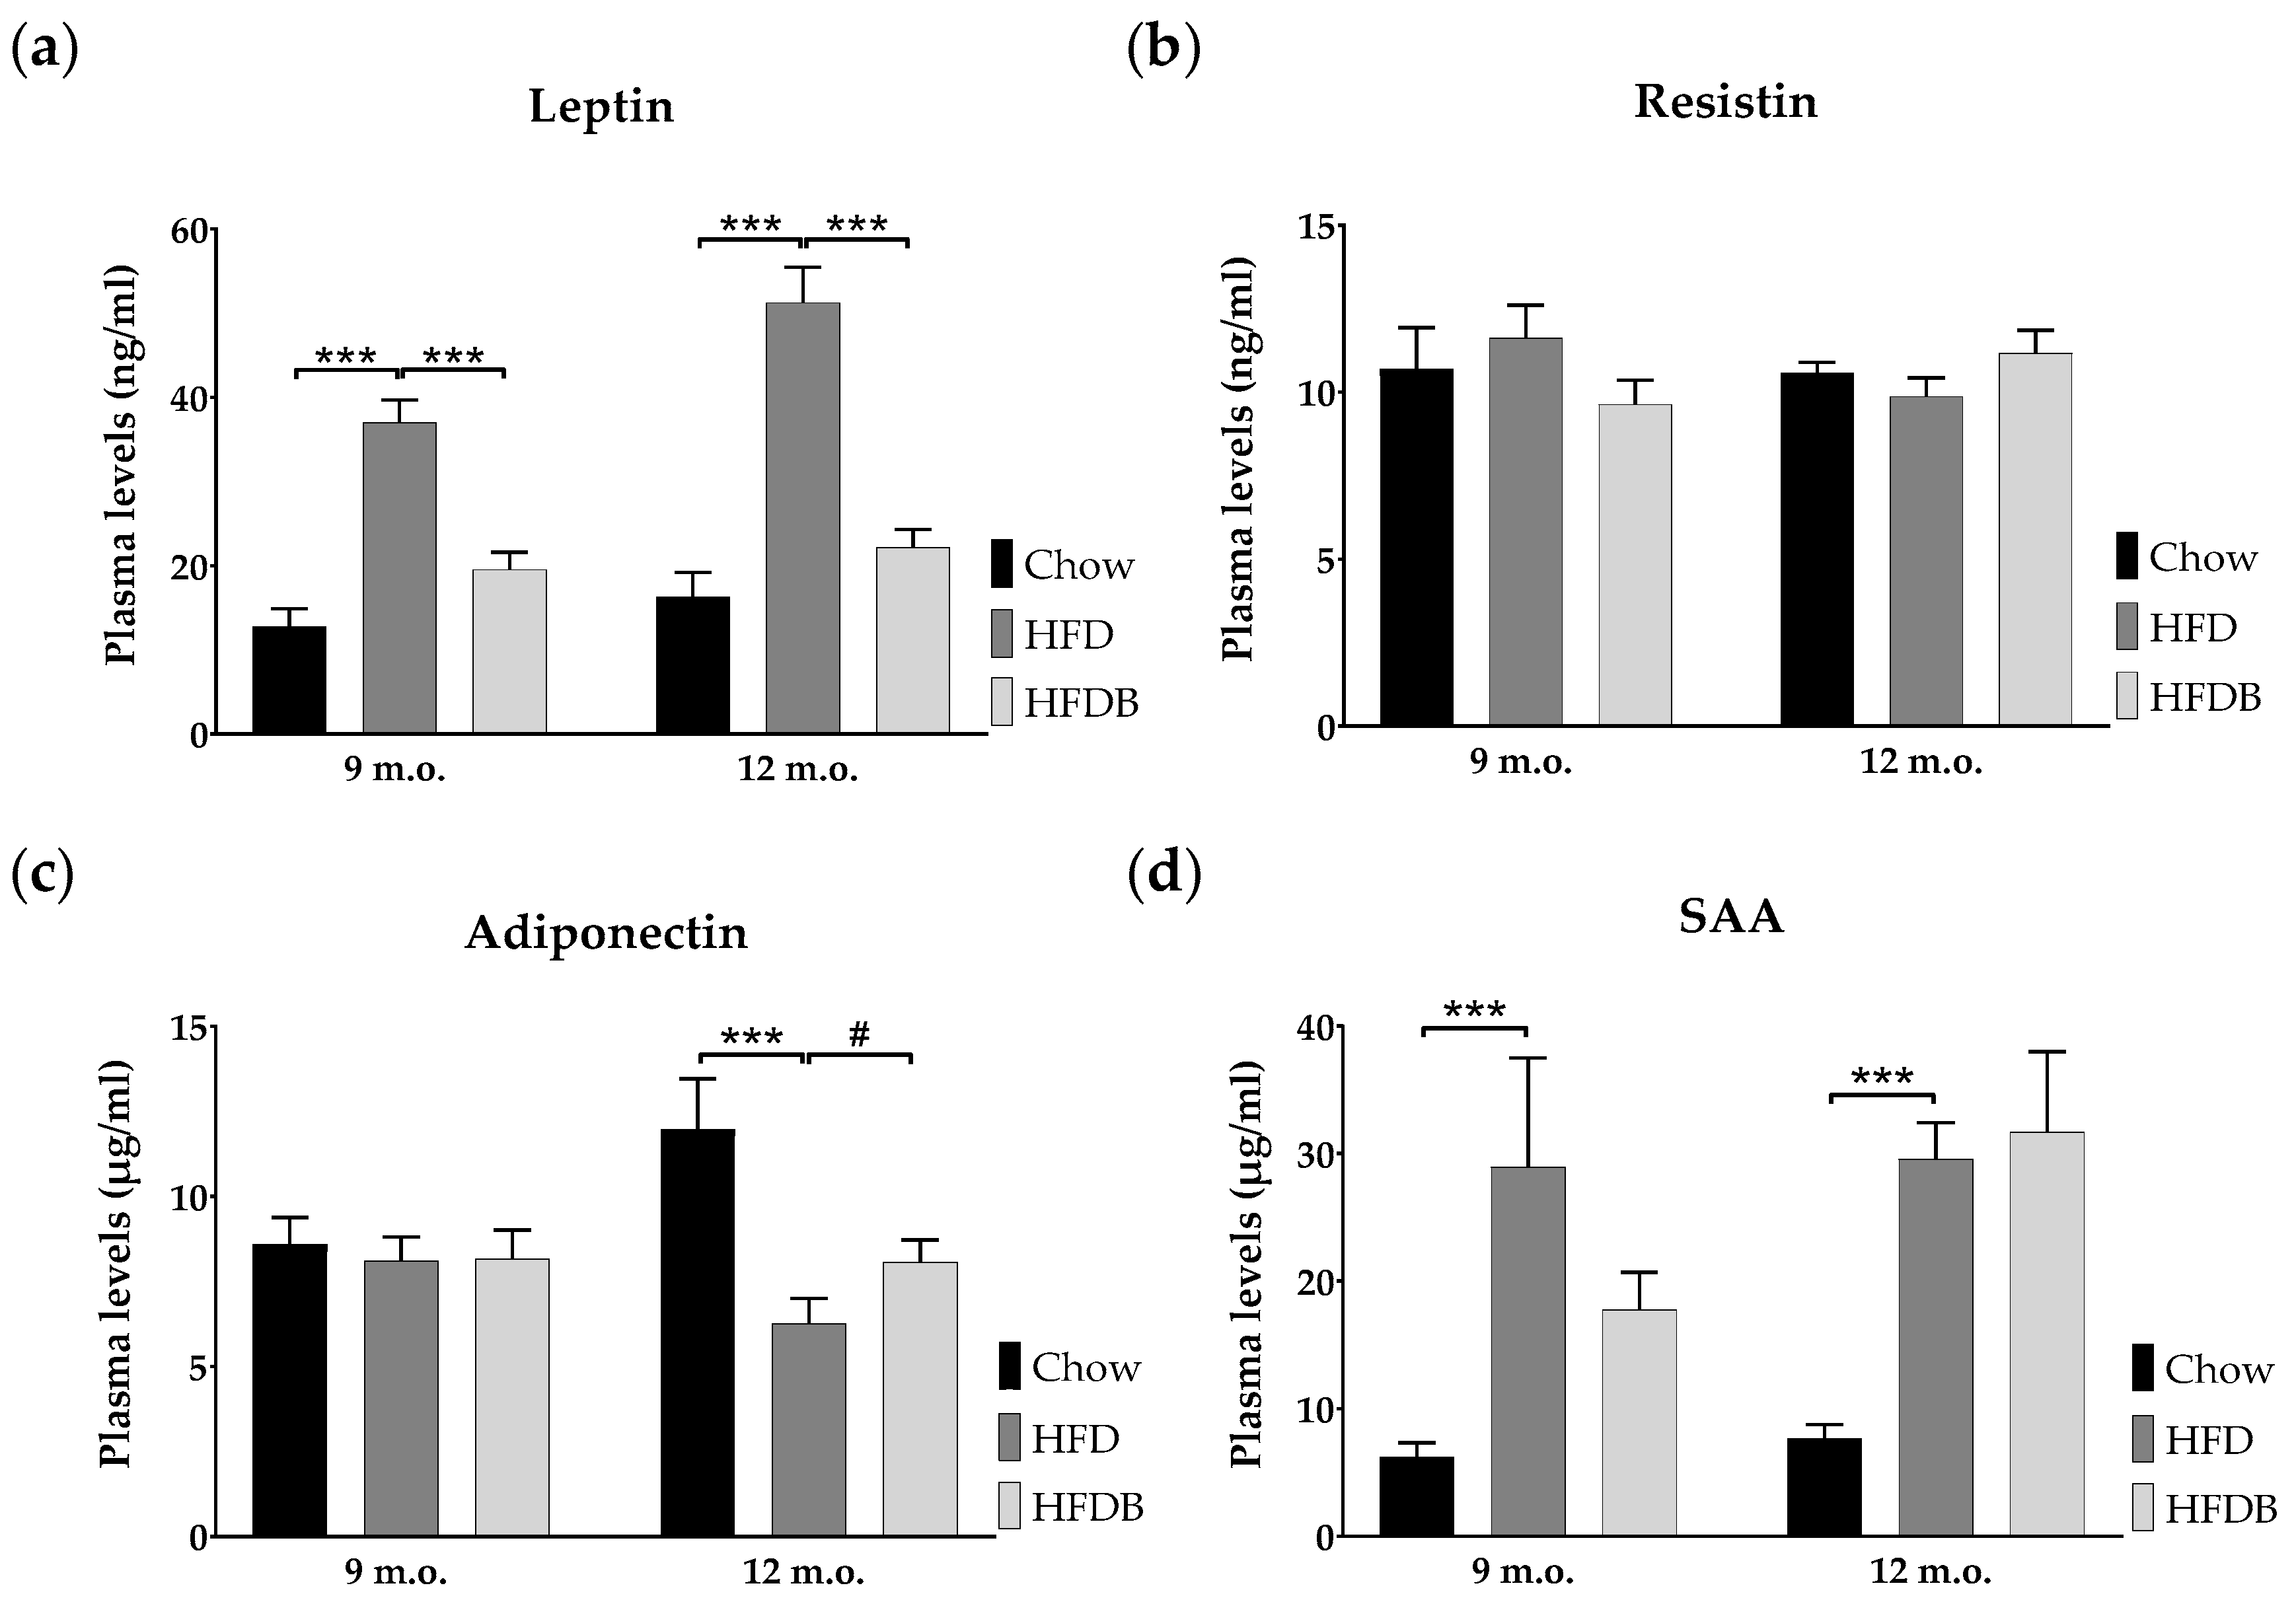
3.3. Adipokine Plasma Levels
4. Discussion
5. Conclusions
Acknowledgments
Author Contributions
Conflicts of Interest
References
- World Health Organization. Fact Sheet 311: Obesity and Overweight. 2016. Available online: http://www.who.int/mediacentre/factsheets/fs311/en/ (accessed on 28 February 2017).
- Diabetes UK. Facts and Stats. 2016. Available online: https://www.diabetes.org.uk/Documents/Position%20statements/DiabetesUK_Facts_Stats_Oct16.pdf (accessed on 27 February 2017).
- Hamman, R.F.; Wing, R.R.; Edelstein, S.L.; Lachin, J.M.; Bray, G.A.; Delahanty, L.; Hoskin, M.; Kriska, A.M.; Mayer-Davis, E.J.; Pi-Sunyer, X. Effect of weight loss with lifestyle intervention on risk of diabetes. Diabetes Care 2006, 29, 2102–2107. [Google Scholar] [CrossRef] [PubMed]
- Molnar, D. The prevalence of the metabolic syndrome and type 2 diabetes mellitus in children and adolescents. Int. J. Obes. 2004, 28, S70–S74. [Google Scholar] [CrossRef] [PubMed]
- Schwartz, M.S.; Chadha, A. Type 2 diabetes mellitus in childhood: Obesity and insulin resistance. J. Am. Osteopath. Assoc. 2008, 108, 518–524. [Google Scholar] [PubMed]
- Wabitsch, M.; Hauner, H.; Hertrampf, M.; Muche, R.; Hay, B.; Mayer, H.; Kratzer, W.; Debatin, K.; Heinze, E. Type ii diabetes mellitus and impaired glucose regulation in caucasian children and adolescents with obesity living in germany. Int. J. Obes. 2004, 28, 307–313. [Google Scholar] [CrossRef] [PubMed]
- Pérez, L.M.; Pareja-Galeano, H.; Sanchis-Gomar, F.; Emanuele, E.; Lucia, A.; Gálvez, B.G. ‘Adipaging’: Ageing and obesity share biological hallmarks related to a dysfunctional adipose tissue. J. Physiol. 2016, 594, 3187–3207. [Google Scholar] [CrossRef] [PubMed]
- Fink, R.I.; Kolterman, O.G.; Griffin, J.; Olefsky, J.M. Mechanisms of insulin resistance in aging. J. Clin. Investig. 1983, 71, 1523. [Google Scholar] [CrossRef] [PubMed]
- Inzucchi, S.E.; Bergenstal, R.M.; Buse, J.B.; Diamant, M.; Ferrannini, E.; Nauck, M.; Peters, A.L.; Tsapas, A.; Wender, R.; Matthews, D.R. Management of hyperglycemia in type 2 diabetes: A patient-centered approach. Diabetes Care 2012, 35, 1364–1379. [Google Scholar] [CrossRef] [PubMed]
- Arvanitakis, Z.; Wilson, R.S.; Bienias, J.L.; Evans, D.A.; Bennett, D.A. Diabetes mellitus and risk of alzheimer disease and decline in cognitive function. Arch. Neurol. 2004, 61, 661–666. [Google Scholar] [CrossRef] [PubMed]
- Jung, U.J.; Choi, M.S. Obesity and its metabolic complications: The role of adipokines and the relationship between obesity, inflammation, insulin resistance, dyslipidemia and nonalcoholic fatty liver disease. Int. J. Mol. Sci. 2014, 15, 6184–6223. [Google Scholar] [CrossRef] [PubMed]
- Cinti, S.; Mitchell, G.; Barbatelli, G.; Murano, I.; Ceresi, E.; Faloia, E.; Wang, S.; Fortier, M.; Greenberg, A.S.; Obin, M.S. Adipocyte death defines macrophage localization and function in adipose tissue of obese mice and humans. J. Lipid Res. 2005, 46, 2347–2355. [Google Scholar] [CrossRef] [PubMed]
- Olefsky, J.M.; Glass, C.K. Macrophages, inflammation, and insulin resistance. Annu. Rev. Physiol. 2010, 72, 219–246. [Google Scholar] [CrossRef] [PubMed]
- Poitou, C.; Divoux, A.; Faty, A.; Tordjman, J.; Hugol, D.; Aissat, A.; Keophiphath, M.; Henegar, C.; Commans, S.; Clément, K. Role of serum amyloid a in adipocyte-macrophage cross talk and adipocyte cholesterol efflux. J. Clin. Endocrinol. Metab. 2009, 94, 1810–1817. [Google Scholar] [CrossRef] [PubMed]
- Skurk, T.; Alberti-Huber, C.; Herder, C.; Hauner, H. Relationship between adipocyte size and adipokine expression and secretion. J. Clin. Endocrinol. Metab. 2007, 92, 1023–1033. [Google Scholar] [CrossRef] [PubMed]
- Bays, H.E.; González-Campoy, J.M.; Bray, G.A.; Kitabchi, A.E.; Bergman, D.A.; Schorr, A.B.; Rodbard, H.W.; Henry, R.R. Pathogenic potential of adipose tissue and metabolic consequences of adipocyte hypertrophy and increased visceral adiposity. Expert Rev. Cardiovasc. Ther. 2008, 6, 343–368. [Google Scholar] [CrossRef] [PubMed]
- Canfora, E.E.; Jocken, J.W.; Blaak, E.E. Short-chain fatty acids in control of body weight and insulin sensitivity. Nat. Rev. Endocrinol. 2015, 11, 577. [Google Scholar] [CrossRef] [PubMed]
- Arnoldussen, I.A.; Wiesmann, M.; Pelgrim, C.E.; Wielemaker, E.M.; van Duyvenvoorde, W.; Santos, P.A.; Verschuren, L.; Keijser, B.J.; Heerschap, A.; Kleemann, R.; et al. Butyrate restores hfd induced adaptations in brain function and metabolism in mid-adult obese mice. Int. J. Obes. 2017, 41, 935–944. [Google Scholar] [CrossRef] [PubMed]
- Khan, S.; Jena, G. The role of butyrate, a histone deacetylase inhibitor in diabetes mellitus: Experimental evidence for therapeutic intervention. Epigenomics 2015, 7, 669–680. [Google Scholar] [CrossRef] [PubMed]
- Weickert, M.O.; Möhlig, M.; Schöfl, C.; Arafat, A.M.; Otto, B.; Viehoff, H.; Koebnick, C.; Kohl, A.; Spranger, J.; Pfeiffer, A.F. Cereal fiber improves whole-body insulin sensitivity in overweight and obese women. Diabetes Care 2006, 29, 775–780. [Google Scholar] [CrossRef] [PubMed]
- Weickert, M.O.; Pfeiffer, A.F. Metabolic effects of dietary fiber consumption and prevention of diabetes. J. Nutr. 2008, 138, 439–442. [Google Scholar] [PubMed]
- Marlett, J.A.; McBurney, M.I.; Slavin, J.L. Position of the american dietetic association: Health implications of dietary fiber. J. Am. Diet. Assoc. 2002, 102, 993–1000. [Google Scholar] [CrossRef]
- Elli, M.; Colombo, O.; Tagliabue, A. A common core microbiota between obese individuals and their lean relatives? Evaluation of the predisposition to obesity on the basis of the fecal microflora profile. Med. Hypotheses 2010, 75, 350–352. [Google Scholar] [CrossRef] [PubMed]
- Qin, J.; Li, Y.; Cai, Z.; Li, S.; Zhu, J.; Zhang, F.; Liang, S.; Zhang, W.; Guan, Y.; Shen, D. A metagenome-wide association study of gut microbiota in type 2 diabetes. Nature 2012, 490, 55–60. [Google Scholar] [CrossRef] [PubMed]
- Kivipelto, M.; Ngandu, T.; Fratiglioni, L.; Viitanen, M.; Kåreholt, I.; Winblad, B.; Helkala, E.L.; Tuomilehto, J.; Soininen, H.; Nissinen, A. Obesity and vascular risk factors at midlife and the risk of dementia and alzheimer disease. Arch. Neurol. 2005, 62, 1556–1560. [Google Scholar] [CrossRef] [PubMed]
- Boitard, C.; Etchamendy, N.; Sauvant, J.; Aubert, A.; Tronel, S.; Marighetto, A.; Layé, S.; Ferreira, G. Juvenile, but not adult exposure to high-fat diet impairs relational memory and hippocampal neurogenesis in mice. Hippocampus 2012, 22, 2095–2100. [Google Scholar] [CrossRef] [PubMed]
- Emmerzaal, T.L.; Kiliaan, A.J.; Gustafson, D.R. 2003–2013: A decade of body mass index, alzheimer’s disease, and dementia. J. Alzheimers Dis. 2015, 43, 739–755. [Google Scholar] [PubMed]
- Ma, Y.; Wang, W.; Zhang, J.; Lu, Y.; Wu, W.; Yan, H.; Wang, Y. Hyperlipidemia and atherosclerotic lesion development in ldlr-deficient mice on a long-term high-fat diet. PLoS ONE 2012, 7, e35835. [Google Scholar] [CrossRef] [PubMed]
- Radonjic, M.; Wielinga, P.Y.; Wopereis, S.; Kelder, T.; Goelela, V.S.; Verschuren, L.; Toet, K.; van Duyvenvoorde, W.; Stroeve, J.H.; Cnubben, N. Differential effects of drug interventions and dietary lifestyle in developing type 2 diabetes and complications: A systems biology analysis in ldlr−/− mice. PLoS ONE 2013, 8, e56122. [Google Scholar] [CrossRef] [PubMed]
- Morrison, M.C.; Mulder, P.; Salic, K.; Verheij, J.; Liang, W.; Van Duyvenvoorde, W.; Menke, A.; Kooistra, T.; Kleemann, R.; Wielinga, P. Intervention with a caspase-1 inhibitor reduces obesity-associated hyperinsulinemia, non-alcoholic steatohepatitis and hepatic fibrosis in ldlr-/-.Leiden mice. Int. J. Obes. 2016, 40, 1416–1423. [Google Scholar] [CrossRef] [PubMed]
- Kilkenny, C.; Browne, W.J.; Cuthill, I.C.; Emerson, M.; Altman, D.G. Improving bioscience research reporting: The arrive guidelines for reporting animal research. PLoS Biol. 2010, 8, e1000412. [Google Scholar] [CrossRef] [PubMed]
- Gesta, S.; Tseng, Y.-H.; Kahn, C.R. Developmental origin of fat: Tracking obesity to its source. Cell 2007, 131, 242–256. [Google Scholar] [CrossRef] [PubMed]
- Caesar, R.; Manieri, M.; Kelder, T.; Boekschoten, M.; Evelo, C.; Müller, M.; Kooistra, T.; Cinti, S.; Kleemann, R.; Drevon, C.A. A combined transcriptomics and lipidomics analysis of subcutaneous, epididymal and mesenteric adipose tissue reveals marked functional differences. PLoS ONE 2010, 5, e11525. [Google Scholar] [CrossRef] [PubMed]
- Wielinga, P.Y.; Harthoorn, L.F.; Verschuren, L.; Schoemaker, M.H.; Jouni, Z.E.; van Tol, E.A.; Kleemann, R.; Kooistra, T. Arachidonic acid/docosahexaenoic acid-supplemented diet in early life reduces body weight gain, plasma lipids, and adiposity in later life in apoe* 3leiden mice. Mol. Nutr. Food Res. 2012, 56, 1081–1089. [Google Scholar] [CrossRef] [PubMed]
- Carpenter, A.E.; Jones, T.R.; Lamprecht, M.R.; Clarke, C.; Kang, I.H.; Friman, O.; Guertin, D.A.; Chang, J.H.; Lindquist, R.A.; Moffat, J. Cellprofiler: Image analysis software for identifying and quantifying cell phenotypes. Genome Biol. 2006, 7, R100. [Google Scholar] [CrossRef] [PubMed]
- Sommer, C.; Straehle, C.; Koethe, U.; Hamprecht, F.A. Ilastik: Interactive learning and segmentation toolkit. In Proceedings of the 2011 IEEE International Symposium on Biomedical Imaging: From Nano to Macro, Chicago, IL, USA, 30 March–2 April 2011; pp. 230–233. [Google Scholar]
- Arnoldussen, I.A.; Zerbi, V.; Wiesmann, M.; Noordman, R.H.; Bolijn, S.; Mutsaers, M.P.; Dederen, P.J.; Kleemann, R.; Kooistra, T.; van Tol, E.A. Early intake of long-chain polyunsaturated fatty acids preserves brain structure and function in diet-induced obesity. J. Nutr. Biochem. 2016, 30, 177–188. [Google Scholar] [CrossRef] [PubMed]
- Gao, Z.; Yin, J.; Zhang, J.; Ward, R.E.; Martin, R.J.; Lefevre, M.; Cefalu, W.T.; Ye, J. Butyrate improves insulin sensitivity and increases energy expenditure in mice. Diabetes 2009, 58, 1509–1517. [Google Scholar] [CrossRef] [PubMed]
- Jakobsdottir, G.; Xu, J.; Molin, G.; Ahrne, S.; Nyman, M. High-fat diet reduces the formation of butyrate, but increases succinate, inflammation, liver fat and cholesterol in rats, while dietary fibre counteracts these effects. PLoS ONE 2013, 8, e80476. [Google Scholar] [CrossRef] [PubMed]
- Bocarsly, M.E.; Fasolino, M.; Kane, G.A.; LaMarca, E.A.; Kirschen, G.W.; Karatsoreos, I.N.; McEwen, B.S.; Gould, E. Obesity diminishes synaptic markers, alters microglial morphology, and impairs cognitive function. Proc. Natl. Acad. Sci. USA 2015, 112, 15731–15736. [Google Scholar] [CrossRef] [PubMed]
- Lin, H.V.; Frassetto, A.; Kowalik, E.J., Jr.; Nawrocki, A.R.; Lu, M.M.; Kosinski, J.R.; Hubert, J.A.; Szeto, D.; Yao, X.; Forrest, G. Butyrate and propionate protect against diet-induced obesity and regulate gut hormones via free fatty acid receptor 3-independent mechanisms. PLoS ONE 2012, 7, e35240. [Google Scholar] [CrossRef] [PubMed]
- Bondolfi, L.; Ermini, F.; Long, J.M.; Ingram, D.K.; Jucker, M. Impact of age and caloric restriction on neurogenesis in the dentate gyrus of c57bl/6 mice. Neurobiol. Aging 2004, 25, 333–340. [Google Scholar] [CrossRef]
- Den Besten, G.; Bleeker, A.; Gerding, A.; van Eunen, K.; Havinga, R.; van Dijk, T.H.; Oosterveer, M.H.; Jonker, J.W.; Groen, A.K.; Reijngoud, D.J. Short-chain fatty acids protect against high-fat diet–induced obesity via a pparγ-dependent switch from lipogenesis to fat oxidation. Diabetes 2015, 64, 2398–2408. [Google Scholar] [CrossRef] [PubMed]
- Mulder, P.; van den Hoek, A.M.; Kleemann, R. The ccr2 inhibitor propagermanium attenuates diet-induced insulin resistance, adipose tissue inflammation and non-alcoholic steatohepatitis. PLoS ONE 2017, 12, e0169740. [Google Scholar] [CrossRef] [PubMed]
- Wang, Y.; Rimm, E.B.; Stampfer, M.J.; Willett, W.C.; Hu, F.B. Comparison of abdominal adiposity and overall obesity in predicting risk of type 2 diabetes among men. Am. J. Clin. Nutr. 2005, 81, 555–563. [Google Scholar] [PubMed]
- Hammarstedt, A.; Graham, T.E.; Kahn, B.B. Adipose tissue dysregulation and reduced insulin sensitivity in non-obese individuals with enlarged abdominal adipose cells. Diabetol. Metab. Syndr. 2012, 4, 42. [Google Scholar] [CrossRef] [PubMed]
- Gabriely, I.; Ma, X.H.; Yang, X.M.; Atzmon, G.; Rajala, M.W.; Berg, A.H.; Scherer, P.; Rossetti, L.; Barzilai, N. Removal of visceral fat prevents insulin resistance and glucose intolerance of aging. Diabetes 2002, 51, 2951–2958. [Google Scholar] [CrossRef] [PubMed]
- Barzilai, N.; She, L.; Liu, B.Q.; Vuguin, P.; Cohen, P.; Wang, J.; Rossetti, L. Surgical removal of visceral fat reverses hepatic insulin resistance. Diabetes 1999, 48, 94–98. [Google Scholar] [CrossRef] [PubMed]
- Arner, P. Obesity and the adipocyte. Regional adipocity in man. J. Endocrinol. 1997, 155, 191–192. [Google Scholar] [CrossRef] [PubMed]
- Tan, G.D.; Goossens, G.H.; Humphreys, S.M.; Vidal, H.; Karpe, F. Upper and lower body adipose tissue function: A direct comparison of fat mobilization in humans. Obes. Res. 2004, 12, 114–118. [Google Scholar] [CrossRef] [PubMed]
- Khan, S.; Jena, G. Sodium butyrate reduces insulin-resistance, fat accumulation and dyslipidemia in type-2 diabetic rat: A comparative study with metformin. Chem. Biol. Interact. 2016, 254, 124–134. [Google Scholar] [CrossRef] [PubMed]
- Mooradian, A.D. Dyslipidemia in type 2 diabetes mellitus. Nat. Clin. Pract. Endocrinol. Metab. 2009, 5, 150–159. [Google Scholar] [CrossRef] [PubMed]
- Den Besten, G.; van Eunen, K.; Groen, A.K.; Venema, K.; Reijngoud, D.J.; Bakker, B.M. The role of short-chain fatty acids in the interplay between diet, gut microbiota, and host energy metabolism. J. Lipid Res. 2013, 54, 2325–2340. [Google Scholar] [CrossRef] [PubMed]
- Camp, H.S.; Ren, D.; Leff, T. Adipogenesis and fat-cell function in obesity and diabetes. Trends Mol. Med. 2002, 8, 442–447. [Google Scholar] [CrossRef]
- Mulder, P.; Morrison, M.C.; Verschuren, L.; Liang, W.; van Bockel, J.H.; Kooistra, T.; Wielinga, P.Y.; Kleemann, R. Reduction of obesity-associated white adipose tissue inflammation by rosiglitazone is associated with reduced non-alcoholic fatty liver disease in ldlr-deficient mice. Sci. Rep. 2016, 6, 31542. [Google Scholar] [CrossRef] [PubMed]
- Morrison, M.C.; Kleemann, R. Role of macrophage migration inhibitory factor in obesity, insulin resistance, type 2 diabetes, and associated hepatic co-morbidities: A comprehensive review of human and rodent studies. Front. Immunol. 2015, 6, 308. [Google Scholar] [CrossRef] [PubMed]
- Mulder, P.; Morrison, M.C.; Wielinga, P.Y.; van Duyvenvoorde, W.; Kooistra, T.; Kleemann, R. Surgical removal of inflamed epididymal white adipose tissue attenuates the development of non-alcoholic steatohepatitis in obesity. Int. J. Obes. 2016, 40, 675–684. [Google Scholar] [CrossRef] [PubMed]
- Liang, W.; Tonini, G.; Mulder, P.; Kelder, T.; van Erk, M.; van den Hoek, A.M.; Mariman, R.; Wielinga, P.Y.; Baccini, M.; Kooistra, T.; et al. Coordinated and interactive expression of genes of lipid metabolism and inflammation in adipose tissue and liver during metabolic overload. PLoS ONE 2013, 8, e75290. [Google Scholar] [CrossRef] [PubMed]
- Xu, H.; Barnes, G.T.; Yang, Q.; Tan, G.; Yang, D.; Chou, C.J.; Sole, J.; Nichols, A.; Ross, J.S.; Tartaglia, L.A. Chronic inflammation in fat plays a crucial role in the development of obesity-related insulin resistance. J. Clin. Investig. 2003, 112, 1821–1830. [Google Scholar] [CrossRef] [PubMed]
- Hajer, G.R.; van Haeften, T.W.; Visseren, F.L. Adipose tissue dysfunction in obesity, diabetes, and vascular diseases. Eur. Heart J. 2008, 29, 2959–2971. [Google Scholar] [CrossRef] [PubMed]
- Antuna-Puente, B.; Feve, B.; Fellahi, S.; Bastard, J.P. Adipokines: The missing link between insulin resistance and obesity. Diabetes Metab. 2008, 34, 2–11. [Google Scholar] [CrossRef] [PubMed]
- Loffreda, S.; Yang, S.; Lin, H.; Karp, C.; Brengman, M.; Wang, D.; Klein, A.; Bulkley, G.; Bao, C.; Noble, P. Leptin regulates proinflammatory immune responses. FASEB J. 1998, 12, 57–65. [Google Scholar] [PubMed]
- De Oliveira, E.M.; Ascar, T.P.; Silva, J.C.; Sandri, S.; Migliorini, S.; Fock, R.A.; Campa, A. Serum amyloid a links endotoxaemia to weight gain and insulin resistance in mice. Diabetologia 2016, 59, 1760–1768. [Google Scholar] [CrossRef] [PubMed]
- Ahlin, S.; Olsson, M.; Olsson, B.; Svensson, P.A.; Sjöholm, K. No evidence for a role of adipose tissue-derived serum amyloid a in the development of insulin resistance or obesity-related inflammation in hsaa1+/− transgenic mice. PLoS ONE 2013, 8, e72204. [Google Scholar] [CrossRef] [PubMed]
- Den Hartigh, L.J.; Wang, S.; Goodspeed, L.; Ding, Y.; Averill, M.; Subramanian, S.; Wietecha, T.; O’Brien, K.D.; Chait, A. Deletion of serum amyloid a3 improves high fat high sucrose diet-induced adipose tissue inflammation and hyperlipidemia in female mice. PLoS ONE 2014, 9, e108564. [Google Scholar] [CrossRef] [PubMed]
- Leinonen, E.; Hurt-Camejo, E.; Wiklund, O.; Hultén, L.M.; Hiukka, A.; Taskinen, M.R. Insulin resistance and adiposity correlate with acute-phase reaction and soluble cell adhesion molecules in type 2 diabetes. Atherosclerosis 2003, 166, 387–394. [Google Scholar] [CrossRef]
- Yamauchi, T.; Kamon, J.; Minokoshi, Y.A.; Ito, Y.; Waki, H.; Uchida, S.; Yamashita, S.; Noda, M.; Kita, S.; Ueki, K. Adiponectin stimulates glucose utilization and fatty-acid oxidation by activating amp-activated protein kinase. Nat. Med. 2002, 8, 1288–1295. [Google Scholar] [CrossRef] [PubMed]


| Adipocyte Numbers Per 106 μm2 (Mean ± SEM) | ||||
|---|---|---|---|---|
| Epididymal | ||||
| Chow vs. HFD | mid | 468 ± 34 vs. 376 ± 31 | 0.05 < p < 0.08 | F(1,18) = 3.95 |
| late | 452 ± 40 vs. 410 ± 21 | p = 0.02 | F(1,18) = 6.54 | |
| HFD vs. HFDB | mid | 376 ± 31 vs. 496 ± 35 | ns | |
| late | 410 ± 21 vs. 481 ± 47 | ns | ||
| Inguinal | ||||
| Chow vs. HFD | mid | 665 ± 59 vs. 449 ± 16 | p < 0.01 | F(1,18) = 12.61 |
| late | 659 ± 44 vs. 474 ± 41 | p < 0.01 | F(1,19) = 9.54 | |
| HFD vs. HFDB | mid | 449 ± 16 vs. 522 ± 15 | p < 0.01 | F(1,18) = 11.27 |
| late | 474 ± 41 vs. 446 ± 18 | ns | ||
| BW | Chol | Trigl | eAS | iAS | eCLS | iCLS | Leptin | SAA | ||||||||
|---|---|---|---|---|---|---|---|---|---|---|---|---|---|---|---|---|
| BW | x | |||||||||||||||
| Chol | 0.80 R | + | x | |||||||||||||
| Trigl | 0.58 R | + | 0.69 R | + | x | |||||||||||
| eAS | 0.53 R | + | 0.64 R | + | 0.57 R | + | x | |||||||||
| iAS | 0.55 R | + | 0.57 R | + | 0.37 R | + | NE | x | ||||||||
| eCLS | 0.53 τb | + | 0.49 τb | + | 0.15 τb | + | 0.24 τb | + | NE | x | ||||||
| iCLS | 0.31 τb | + | 0.29 τb | + | 0.10 τb | + | NE | 0.37 τb | + | NE | x | |||||
| Leptin | 0.78 R | + | 0.87 R | + | 0.62 R | + | 0.76 R | + | 0.67 R | + | 0.52 τb | + | 0.37 τb | + | x | |
| SAA | 0.56 τb | + | 0.50 τb | + | 0.13 τb | + | 0.17 τb | + | 0.24 τb | + | 0.69 τb | + | 0.28 τb | + | NE | x |
| BW | Insulin | Chol | Trigl | eAS | iAS | eCLS | iCLS | LI | Leptin | Adi | SAA | ||||||||||
|---|---|---|---|---|---|---|---|---|---|---|---|---|---|---|---|---|---|---|---|---|---|
| BW | x | ||||||||||||||||||||
| Insulin | 0.66 R | + | x | ||||||||||||||||||
| Chol | 0.87 R | + | 0.66 R | + | x | ||||||||||||||||
| Trigl | 0.79 R | + | 0.77 R | + | 0.81 R | + | x | ||||||||||||||
| eAS | 0.52 R | + | 0.49 R | + | 0.57 R | + | 0.53 R | + | x | ||||||||||||
| iAS | 0.47 R | + | 0.31 R | + | 0.54 R | + | 0.50 R | + | NE | x | |||||||||||
| eCLS | 0.43 τb | + | 0.30 τb | + | 0.55 τb | + | 0.34 τb | + | 0.23 τb | + | NE | x | |||||||||
| iCLS | 0.45 τb | + | 0.21 τb | + | 0.38 τb | + | 0.33 τb | + | NE | 0.37 τb | + | NE | x | ||||||||
| LI | 0.41 τb | + | 0.33 τb | + | 0.45 τb | + | 0.30 τb | + | 0.15 τb | + | 0.22 τb | + | 0.57 τb | + | 0.21 τb | + | x | ||||
| Leptin | 0.88 R | + | 0.69 R | + | 0.91 R | + | 0.87 R | + | 0.65 R | + | 0.64 R | + | 0.49 τb | + | 0.41 τb | + | 0.46 τb | + | x | ||
| Adi | 0.56 R | − | 0.48 R | − | 0.68 R | − | 0.47 R | − | 0.25 R | − | 0.25 R | − | 0.19 τb | − | 0.30 τb | − | 0.28 τb | − | NE | x | |
| SAA | 0.42 τb | + | 0.29 τb | + | 0.57 τb | + | 0.46 τb | + | 0.19 τb | + | 0.53 τb | + | 0.58 τb | + | 0.30 τb | + | 0.44 τb | + | NE | NE | x |
© 2017 by the authors. Licensee MDPI, Basel, Switzerland. This article is an open access article distributed under the terms and conditions of the Creative Commons Attribution (CC BY) license (http://creativecommons.org/licenses/by/4.0/).
Share and Cite
Pelgrim, C.E.; Franx, B.A.A.; Snabel, J.; Kleemann, R.; Arnoldussen, I.A.C.; Kiliaan, A.J. Butyrate Reduces HFD-Induced Adipocyte Hypertrophy and Metabolic Risk Factors in Obese LDLr-/-.Leiden Mice. Nutrients 2017, 9, 714. https://doi.org/10.3390/nu9070714
Pelgrim CE, Franx BAA, Snabel J, Kleemann R, Arnoldussen IAC, Kiliaan AJ. Butyrate Reduces HFD-Induced Adipocyte Hypertrophy and Metabolic Risk Factors in Obese LDLr-/-.Leiden Mice. Nutrients. 2017; 9(7):714. https://doi.org/10.3390/nu9070714
Chicago/Turabian StylePelgrim, Charlotte E., Bart A. A. Franx, Jessica Snabel, Robert Kleemann, Ilse A. C. Arnoldussen, and Amanda J. Kiliaan. 2017. "Butyrate Reduces HFD-Induced Adipocyte Hypertrophy and Metabolic Risk Factors in Obese LDLr-/-.Leiden Mice" Nutrients 9, no. 7: 714. https://doi.org/10.3390/nu9070714