Correction: Grieger, J.A.; et al.: Comparing the Nutritional Impact of Dietary Strategies to Reduce Discretionary Choice Intake in the Australian Adult Population: A Simulation Modelling Study. Nutrients 2017, 9, 442


Abstract
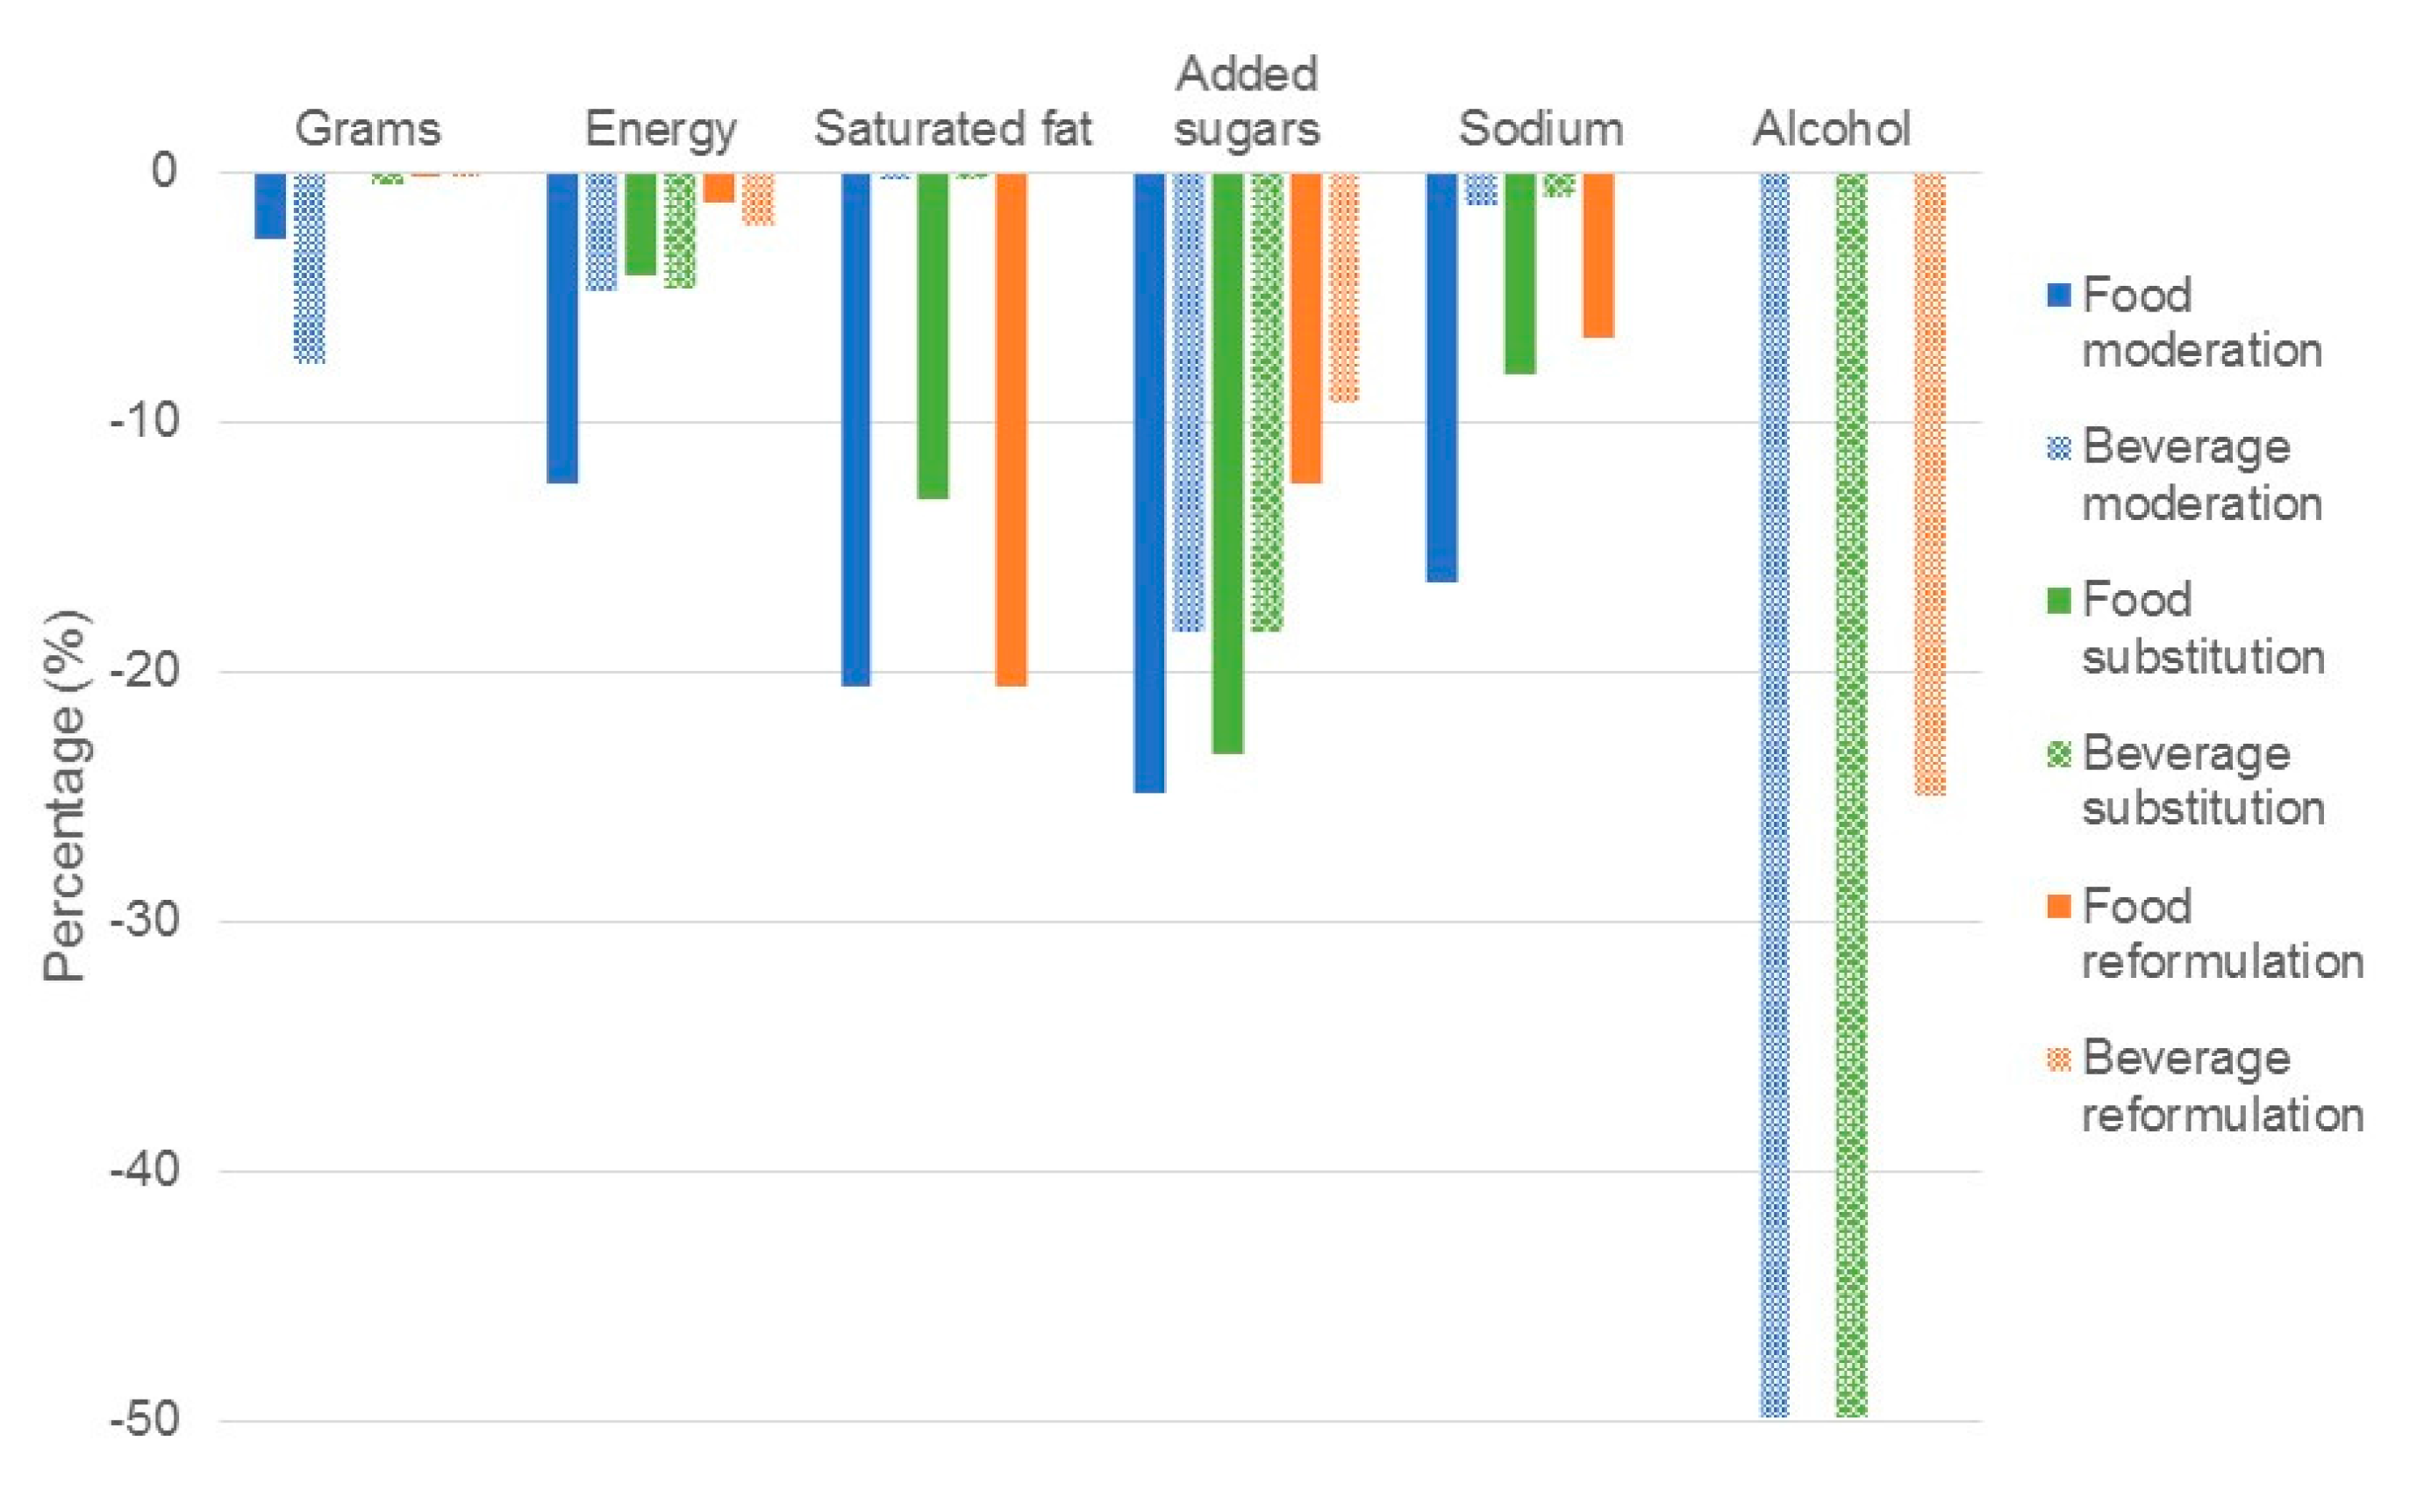
Results
Supplementary Materials
Conflicts of Interest
Reference
- Grieger, J.A.; Johnson, B.J.; Wycherley, T.P.; Golley, R.K. Comparing the Nutritional Impact of Dietary Strategies to Reduce Discretionary Choice Intake in the Australian Adult Population: A Simulation Modelling Study. Nutrients 2017, 9, 442. [Google Scholar] [CrossRef] [PubMed]


| Moderation of All Discretionary Foods by 50% | Moderation of All Discretionary Beverages by 50% | Replacement of All Discretionary Foods with All Core Foods 2 | Replacement of Discretionary Beverages with Water, or Fruit and Vegetable Juices 3 | Reformulate All Discretionary Foods 4 | Reformulate All Discretionary Beverages 5 | |
|---|---|---|---|---|---|---|
| Grams (g) | 3248.3 | 3080.9 | 3384.7 | 3320.8 | 3331.2 | 3329.5 |
| Energy (kJ) | 7610.8 | 8276 | 8341.1 | 8291.9 | 8592.2 | 8513.9 |
| Saturated fat (g) (%E 1) | 22.0 (10.9%) | 27.6 (12.6%) | 24.1 (10.9%) | 27.6 (12.5%) | 22.0 (9.6%) | 27.7 (12.3) |
| Added sugars (g) (%E) | 38.0 (8.4%) | 41.3 (8.4%) | 38.8 (7.8%) | 41.3 (8.3%) | 44.3 (8.6%) | 46.0 (9.0) |
| Sodium (mg) | 2032.1 | 2399.7 | 2233.9 | 2407.3 | 2271.2 | 2429.8 |
| Alcohol (g) (%E) | 14.4 (5.5%) | 7.2 (2.6%) | 14.4 (5.0%) | 7.2 (2.6%) | 14.4 (4.9%) | 10.8 (3.7) |
© 2017 by the authors. Licensee MDPI, Basel, Switzerland. This article is an open access article distributed under the terms and conditions of the Creative Commons Attribution (CC BY) license (http://creativecommons.org/licenses/by/4.0/).
Share and Cite
Grieger, J.A.; Johnson, B.J.; Wycherley, T.P.; Golley, R.K. Correction: Grieger, J.A.; et al.: Comparing the Nutritional Impact of Dietary Strategies to Reduce Discretionary Choice Intake in the Australian Adult Population: A Simulation Modelling Study. Nutrients 2017, 9, 442. Nutrients 2017, 9, 851. https://doi.org/10.3390/nu9080851
Grieger JA, Johnson BJ, Wycherley TP, Golley RK. Correction: Grieger, J.A.; et al.: Comparing the Nutritional Impact of Dietary Strategies to Reduce Discretionary Choice Intake in the Australian Adult Population: A Simulation Modelling Study. Nutrients 2017, 9, 442. Nutrients. 2017; 9(8):851. https://doi.org/10.3390/nu9080851
Chicago/Turabian StyleGrieger, Jessica A., Brittany J. Johnson, Thomas P. Wycherley, and Rebecca K. Golley. 2017. "Correction: Grieger, J.A.; et al.: Comparing the Nutritional Impact of Dietary Strategies to Reduce Discretionary Choice Intake in the Australian Adult Population: A Simulation Modelling Study. Nutrients 2017, 9, 442" Nutrients 9, no. 8: 851. https://doi.org/10.3390/nu9080851