Mycotoxin Co-Occurrence in Michigan Harvested Maize Grain


1
Department of Plant, Soil and Microbial Sciences, Michigan State University, East Lansing, MI 48824, USA
2
Ridgetown Campus, University of Guelph, Ridgetown, ON NOP 2CO, Canada
*
Author to whom correspondence should be addressed.
Toxins 2022, 14(7), 431; https://doi.org/10.3390/toxins14070431
Submission received: 16 April 2022
/
Revised: 9 June 2022
/
Accepted: 10 June 2022
/
Published: 24 June 2022
(This article belongs to the Collection Understanding Mycotoxin Occurrence in Food and Feed Chains)
Abstract
:Mycotoxins are secondary metabolites produced by fungi that, depending on the type and exposure levels, can be a threat to human and animal health. When multiple mycotoxins occur together, their risk effects on human and animal health can be additive or synergistic. Little information is known about the specific types of mycotoxins or their co-occurrence in the state of Michigan and the Great Lakes region of the United States. To understand the types, incidences, severities, and frequency of co-occurrence of mycotoxins in maize grain (Zea mays L.), samples were collected from across Michigan over two years and analyzed for 20 different mycotoxins. Every sample was contaminated with at least four and six mycotoxins in 2017 and 2018, respectively. Incidence and severity of each mycotoxin varied by year and across locations. Correlations were found between mycotoxins, particularly mycotoxins produced by Fusarium spp. Environmental differences at each location played a role in which mycotoxins were present and at what levels. Overall, data from this study demonstrated that mycotoxin co-occurrence occurs at high levels in Michigan, especially with mycotoxins produced by Fusarium spp., such as deoxynivalenol.
Key Contribution: Multiple mycotoxin contamination is present throughout Michigan and likely throughout the Great Lakes Region. Certain mycotoxins were found to be correlated with one another, particularly ones produced by Fusarium spp. Additionally, mycotoxins varied by location, these locations had differing environmental conditions.
1. Introduction
Mycotoxins are secondary metabolites produced by filamentous fungi, particularly in the genera Alternaria, Aspergillus, Fusarium, or Penicillium [1,2]. These toxins can be harmful to both humans and animals. Acute, short-term exposure can lead to varied effects depending on the type of mycotoxin present [3]. Although acute exposure is important, grain with high levels of mycotoxin usually does not enter the channel of trade. More often, undetected chronic exposure to low doses of mycotoxins is found. This chronic exposure can lead to reduced weight gain, diminished productivity, and increased susceptibility to infections in animals [3].
In maize grain (Zea mays L.), mycotoxin contamination in the field occurs through fungal ear rot infections. In many cases, ear infections occur when fungal spores land on maize silks and grow down into the ear or when spores enter through damage from insects or birds. Because mycotoxin-producing fungi may produce more than one type of mycotoxin, and grain can become infected with multiple fungal species at a time, it is important to understand the frequency of mycotoxin co-occurrence [1]. When mycotoxins co-occur, they can interact and have antagonistic, additive, less than additive, or synergistic effects [1]. However, information on incidence, severity, and effects of contamination with co-occurring mycotoxin is lacking in maize grain, especially in the Great Lakes Region of the United States (U.S.).
Although there are thousands of mycotoxins currently identified, only a few are regulated for food and animal feed across the world. These regulated mycotoxins are aflatoxins, ochratoxin A, zearalenone (ZEN), fumonisins, and select trichothecenes, including deoxynivalenol (DON), HT-2, and T-2 toxins [4,5]. Although these mycotoxins are considered the most important for human and animal health and safety, masked and other emerging mycotoxin are also becoming important. Masked mycotoxins such as deoxynivalnol-3-β-glucoside (D3G) are biologically modified metabolites conjugated by plant defense mechanisms [6]. Emerging mycotoxins are a group of mycotoxins with no current regulations that are very chemically diverse from one another [4]. Masked and emerging mycotoxins are important, as they may interact with regulated mycotoxins present in maize grain.
To reduce the incidence and occurrence of mycotoxins entering grain markets, the U.S. and other countries set limits on mycotoxins in grain sold in the marketplace. The U.S. Food and Drug Administration (FDA) has set action levels for aflatoxins and advisory levels for DON and fumonisins [7,8,9]. As a result, these mycotoxins are regularly assessed in food and feed. Outside of the U.S., all countries with mycotoxin regulations have limits for aflatoxin B1 or the total aflatoxin level in food and/or feed [10]. Examples of other mycotoxins regulated in various countries include aflatoxin M1, diacetoxyscirpenol (DIAS), T-2 toxin (T-2), HT-2 toxin (HT-2), and ZEN (Table 1) [10]. Limited information is available on their frequency in the U.S. maize supply because their occurrence is not monitored.
Because many fungal infections occur during the time of silking, when fungal spores land on the silks, germinate, and propagate into the developing ear [11], environmental conditions around the time of silking and ear development are important in determining mycotoxin accumulation and co-occurrence in harvested grain. Fungal infections can also occur though other modes of entry, such as though wounds caused by ear-feeding insects such as western bean cutworm (Striacosta albicosta) [12], potentially leading to an increase in mycotoxin concentrations in maize grain [13,14,15].

Table 1.
Complete list of mycotoxins tested along with abbreviations, fungal species that produce specific mycotoxin, and regulatory limits worldwide for each mycotoxin across crops.
Table 1.
Complete list of mycotoxins tested along with abbreviations, fungal species that produce specific mycotoxin, and regulatory limits worldwide for each mycotoxin across crops.
| Mycotoxin | Abbreviation | Produced by: | Regulations |
|---|---|---|---|
| Aflatoxin | AB1 | Aspergillus flavus, A. parasiticus, and A. nominus [16] | Food |
| Aflatoxin B1: 61 countries; 1 μg kg−1 to 20 μg kg−1 [17] | |||
| Total Aflatoxins: 76 countries; 0 μg kg−1 to 35 μg kg−1 [17] | |||
| Feed | |||
| Aflatoxin B1: 39 countries; 5 μg kg−1 to 50 μg kg−1 [17] | |||
| Total Aflatoxins: 21 countries; 5 μg kg−1 to 50 μg kg−1 [17] | |||
| Beauvericin | BEA | Beauveria bassiana and Fusarium spp. [18,19,20] | |
| Diacetoxyscirpenol | DIAS | Fusarium spp. esp. F. poae, F. equiseti, F. sambucinum, and F. sporotrichioides [20,21] | |
| Deoxynivalenol | DON | Fusarium graminearum and F.culmorum [20] | 37 countries; 300 μg kg−1 to 2000 μg kg−1 [17] |
| deoxynivalenol 3-β-D -glucoside | D3G | Fusarium spp. [22] | |
| 15-acetyl-deoxynivalenol | 15-ADON | Fusarium graminearum and F. culmorum [20] | |
| 3-acetyl-deoxynivalenol | 3-ADON | Fusarium graminearum and F. culmorum [20] | |
| Enniatin A | ENNA | Fusarium spp. [18] | |
| Enniatin A1 | ENNA1 | Fusarium spp. [18] | |
| Enniatin B | ENNB | Fusarium spp. [18] | |
| Enniatin B1 | ENNB1 | Fusarium spp. [18] | |
| Fumonisin B1 | FB1 | Fusarium spp. [20,23] | Total Fumonisins: 6 countries; 1000 μg kg−1 to 3000 μg kg−1 [17] |
| Fumonisin B2 | FB2 | Fusarium spp. [20,23] | |
| Fumonisin B3 | FB3 | Fusarium spp. [20,23] | |
| Fusarenon-X | FUSX | Fusarium spp. [24] | |
| HT-2 Toxin | HT-2 | Fusarium spp. esp. F. sporotrichioides, F. acuminatum, and F. poae [20] | T-2 + HT-2: EU; 15 μg kg−1 to 2000 μg kg−1 [25] |
| Moniliformin | MON | Fusarium spp. esp. F. subglutinans, F. groliferatum, F. avenaceum, and F. tricinctum [18,20] | |
| Nivalenol | NIV | Fusarium cerealis, F. poae, F. graminearum, and F. culmorum [20,24] | |
| T-2 Toxin | T-2 | Fusarium spp. esp. F. sporotrichioides, F. acuminatum, and F. poae [20] | T-2 + HT-2: China, Iran, Canada, EU; 15 μg kg−1 to 2000 μg kg−1 [25] |
| Zearalenone | ZEN | Fusarium spp. esp. F. graminearum, F. culmorum, F. cerealis, F. equiseti, F. crookwellense, and F. semitectum [20,26] | 16 countries; 50 μg kg−1 to 1000 μg kg−1 [17] |
Due to limited information available on multiple mycotoxins in maize grain in Michigan and across the Great Lakes Region, the objectives of this study were to determine the type of mycotoxins present in Michigan maize, their level, and frequency of occurrence and co-occurrence with one another in relation to environmental variability.
2. Results
Mycotoxins tested included aflatoxin, beauvericin (BEA), DIAS, DON, D3G, 15-acetyl-deoxynivalenol (15-ADON), 3-acetyl-deoxynivalenol (3-ADON), enniatin A (ENNA), enniatinA1 (ENNA1), enniatin B (ENNB), enniatin B1 (ENNB1), fumonisin B1 (FB1), fumonisin B2 (FB2), fumonisin B3 (FB3), fusarenon-X, HT-2, moniliformin (MON), nivalenol, T-2, and ZEN. Out of the mycotoxins tested, four toxins were not found in either year: aflatoxin, diacetoxyscirpenol, fusarenon-X, and nivalenol.
2.1. Frequency of Mycotoxin Co-Occurrence
Co-contamination by multiple mycotoxins was found to be highly prevalent in Michigan maize grain. Contamination with more than one mycotoxin was observed in all samples tested. Out of the 20 mycotoxins tested, each sample in the study was contaminated with at least four different mycotoxins in 2017 and six different mycotoxins in 2018. The maximum number of contaminates per sample was 12 in 2017 and 14 in 2018. The average number of individual mycotoxin contaminates per sample was 8.4 in 2017 and 10.0 in 2018 (Figure 1).
2.2. Mycotoxin Incidence and Severity
Results from this study indicate that the overall incidence of mycotoxin contamination in Michigan is relatively high (Table 2 and Table 3). Several mycotoxins had particularly high incidences, showing up in a large number of samples tested. In 2017, DON, ENNA, ENNB, FB1, and FB2 were found in more than 80% of samples tested, whereas BEA, DON, D3G, 15-ADON, FB1, FB2, FB3, and ZEN were found in greater than 80% of samples in 2018.
2.2.1. Mycotoxin Correlations
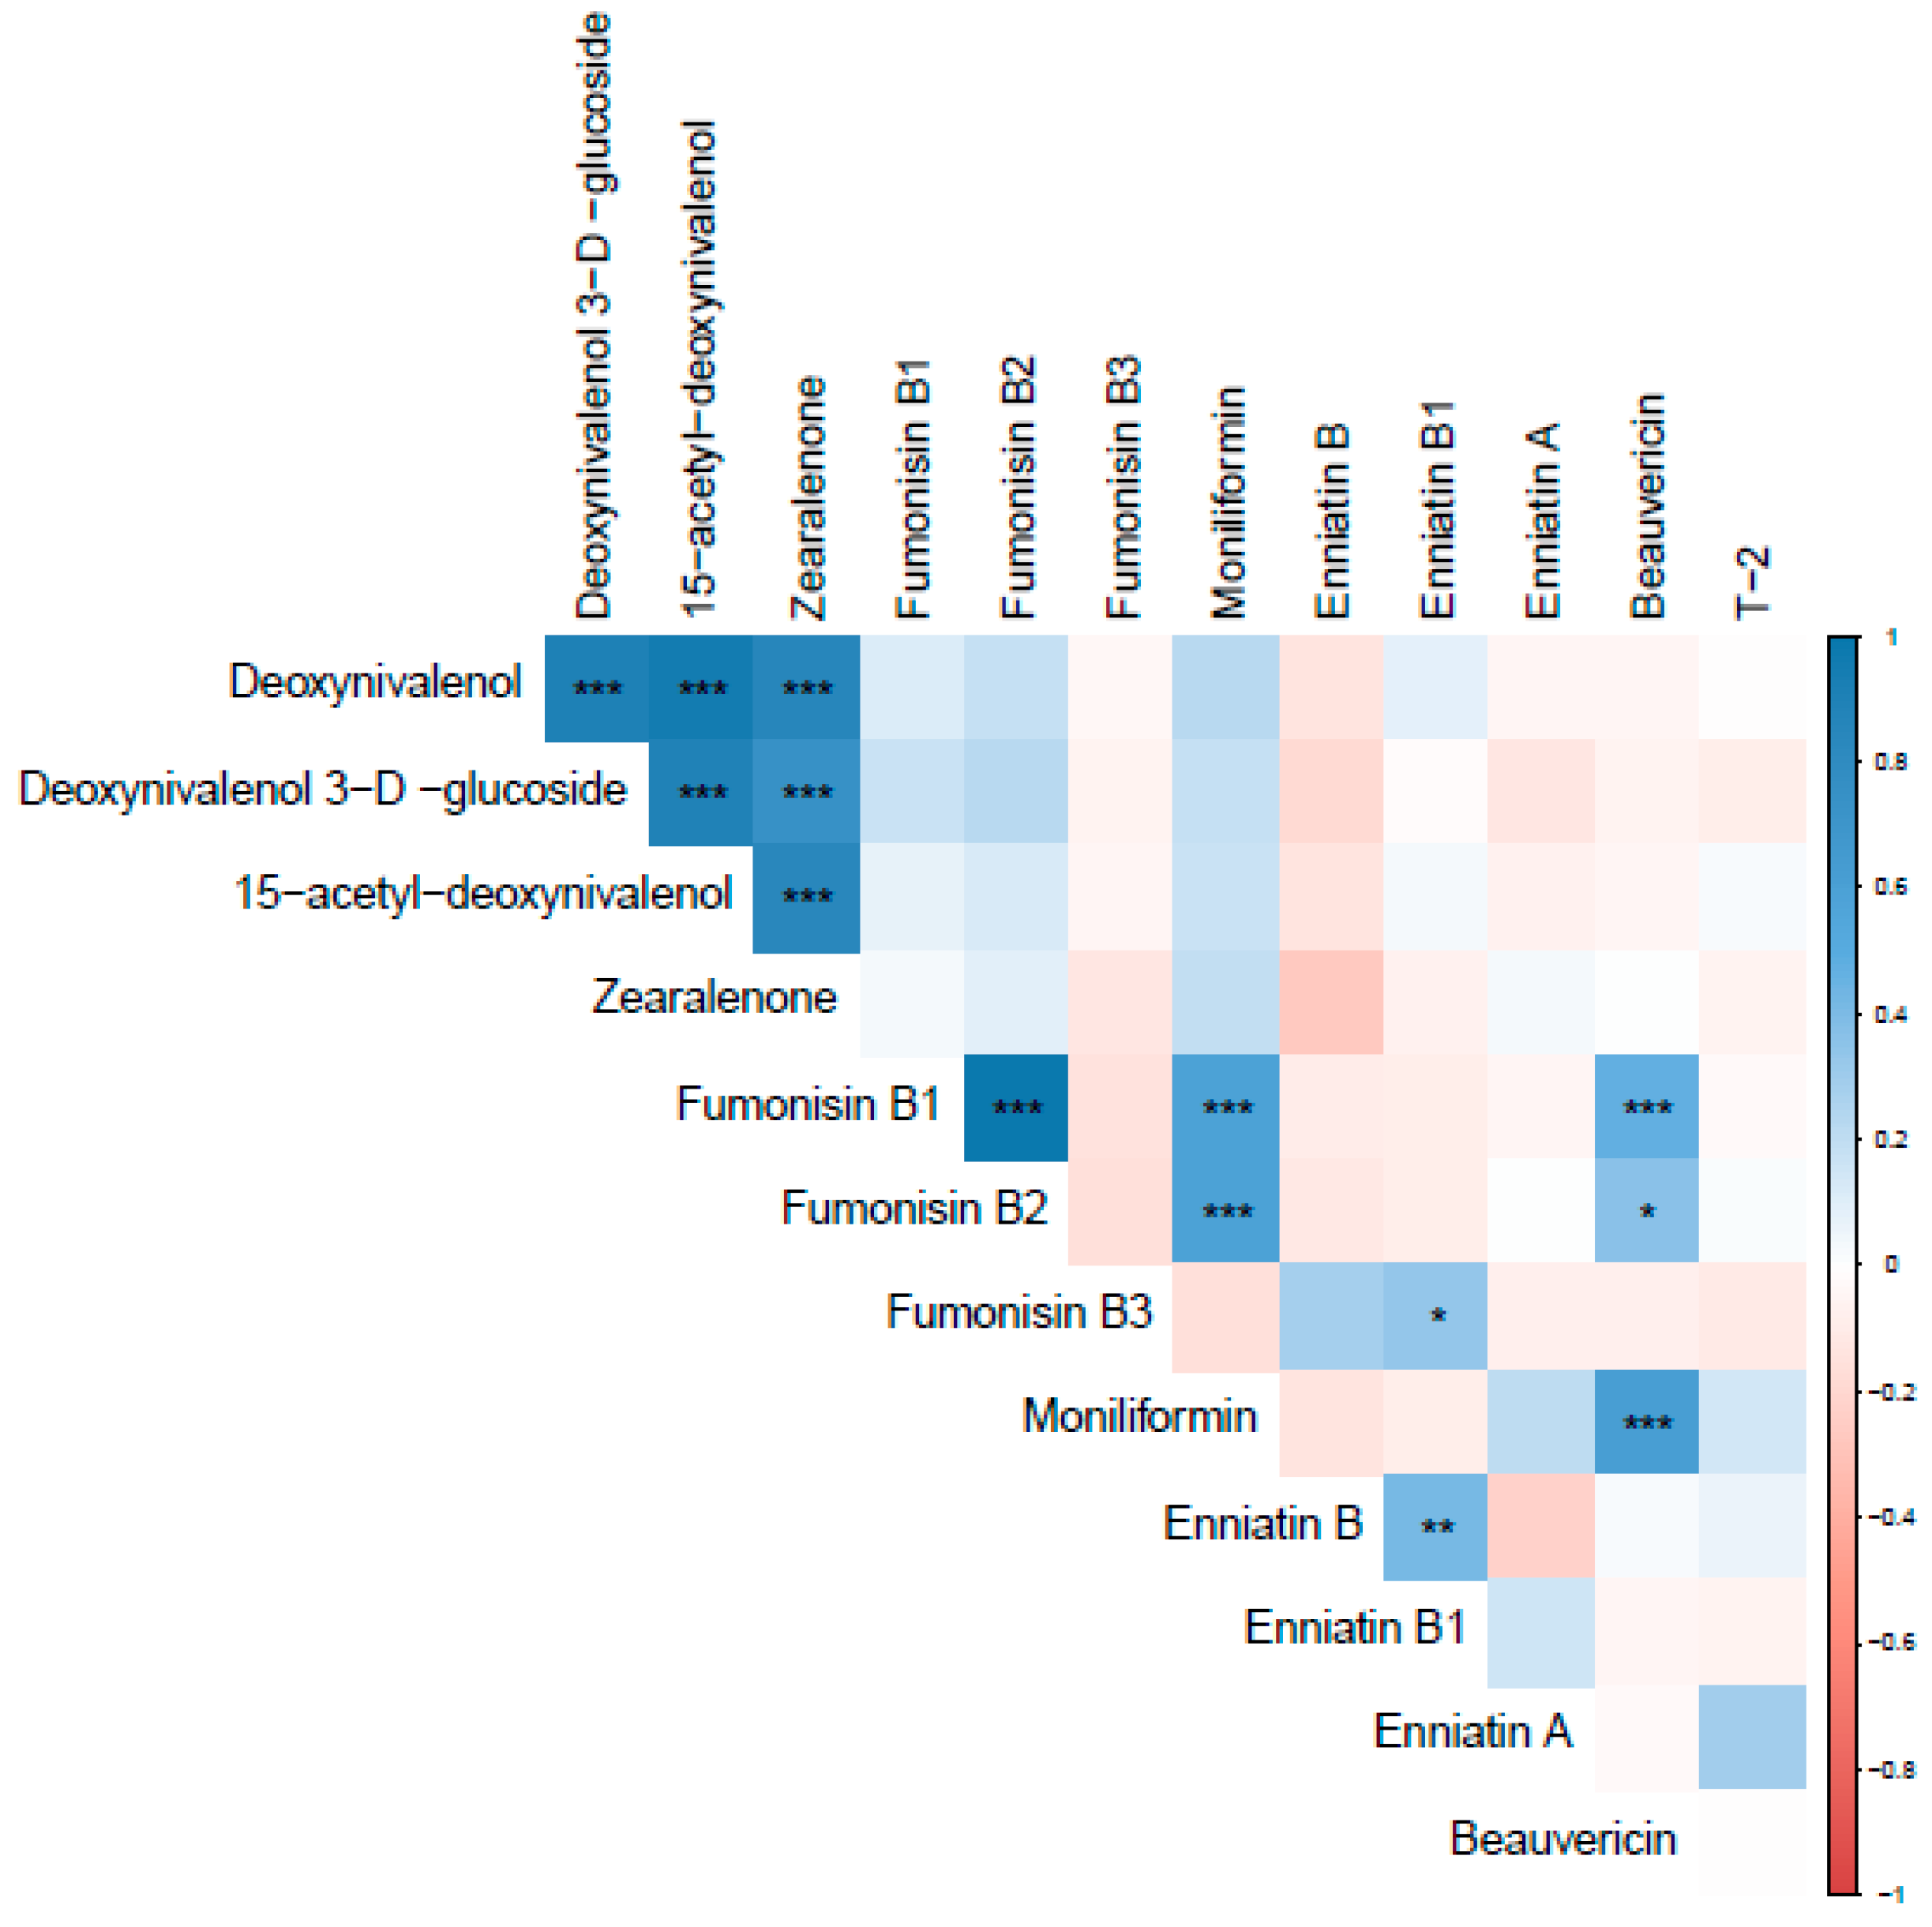
Various mycotoxins were found to be correlated in both 2017 and 2018. In 2017, DON was strongly correlated with D3G, 15-ADON, and ZEN (r = 0.90, 0.95, and 0.86, respectively). Fumonisin B1 and FB2 were also found to be strongly correlated (r = 0.99). A moderate correlation was found between MON and FB1, FB2, and BEA (r = 0.60, 0.59, and 0.62, respectively) (Figure 2).
In 2018, more correlations were found between mycotoxins (Figure 3). Strong correlations were found between DON and D3G (r = 0.80) and DON and 15-ADON (0.96). A moderately strong correlation was found between DON and 3-ADON (0.77). Moderate correlations were found between DON and ZEN, FB1, FB2, FB3, MON, and BEA (r = 0.53, 0.47, 0.47, 0.46, 0.43, respectively). Strong correlations were found between FB1 and FB2 (r = 0.99) and FB1 and FB3 (r = 0.99). All three fumonisins (FB1, FB2, and FB3) had strong correlations with MON (r = 0.73, 0.67, and 0.67, respectively). Beauvericin was also found to have a strong correlation with FB1, FB2, FB3, and MON (r = 0.78, 0.77, 0.77, and 0.85, respectively). Enniatin B1 was found to be strongly correlated with ENNB, ENNA, and ENNA1 (r = 0.84, 0.99, and 0.99, respectively). Further, in 2018, a strong correlation was found between HT-2 and T-2 (r = 0.87).
2.2.2. Specific Mycotoxins
Many of the mycotoxins commonly found in the study were produced by F. graminearum. Deoxynivalenol was the most commonly occurring mycotoxin in the study, with 93% of samples contaminated in 2017 (Table 2) and 100% contaminated in 2018 (Table 3). Additionally, DON was found at a high quantity in many of the samples, and average DON values in both 2017 and 2018 were greater than 1000 µg kg−1. Deoxynivalenol was found over 1000 µg kg−1 in 42% of samples in 2017 and 80% of samples in 2018. It was also found to be over 5000 µg kg−1 in 2% of samples in 2017 but 38% of samples in 2018. Deoxynivalenol 3-β-D-glycoside is considered a masked mycotoxin and was present in a high number of samples, with 73% and 100% of samples contaminated in 2017 (Table 2) and 2018, respectively (Table 3). The mycotoxins 15-ADON and 3-ADON are derivatives of DON [20]. The mycotoxin 15-ADON was found in both 2017 and 2018, while 3-ADON was only found in 2018. Zearalenone, also produced by F. graminearum, was found in 69% of samples in 2017 and 100% of samples in 2018. At least 16 countries have ZEN regulations in place with limits for ZEN in maize and other cereals ranging from 50 to 1000 µg kg−1 [26]. In 2017, 36% of samples were over 50 µg kg−1, and 7% were over 1000 µg kg−1. During the 2018 growing season, 64% were over 50 µg kg−1, while 16% were over 1000 µg kg−1.
The fumonisins, namely FB1, FB2, and FB,3 are regulated in the U.S. as the total concentration of all three analogs [9]. One sample in the study was over the FDA limit of 20,000 µg kg−1 for total fumonisin concentration for swine [9]. This sample was from Huron in 2018 and had a total fumonisin concentration of 82,236 µg kg−1. The fumonisins FB1, FB2, and FB3 are often found occurring together [27]. Contamination of samples by all three analogs, FB1, FB2, and FB3, was found in both years. All three analogs were found in 56 and 89% of samples in 2017 and 2018, respectively. Moniliformin was found in both years of the study though with higher incidences and concentrations in 2018 compared to 2019.
T-2 and HT-2 toxins are not regulated in the U.S. In 2017, only T-2 was found in samples, while in 2018, both T-2 and HT-2 were present. Certain countries regulate T-2 toxin individually, while others regulate the total concentration of T-2 and HT-2. The European Union’s lowest limit for T-2 and HT-2 is 15 µg kg−1 [25]. In both 2017 and 2018, only 9% of samples were found to be above 15 µg kg−1.
The enniatins and BEA are structurally related mycotoxins [28]. BEA was found most often across the two years with 78% contamination in 2017 (Table 2) and 100% contamination in 2018 (Table 3). In 2017, higher levels of enniatins were found compared to 2018. Across both years ENNA and ENNB were found at higher levels than ENNA1 and ENNB1. In 2017, total enniatin concentration of ENNA, ENNA1, ENNB, and ENNB1 ranged between 0.1 and 1.36 µg kg−1, with 100% of the samples having enniatins present. In 2018, total enniatin concentration ranged between less than the LOD to 59.40 µg kg−1, with 27% of the samples having enniatins present.
2.3. Variability across Locations
In 2017, DON, D3G, ZEN, and ENNA levels varied significantly by location (Table 4). Washtenaw had the highest DON levels but was not significantly different from Cass, Allegan, Branch, or Montcalm. Likewise, D3G followed a similar pattern as DON, with Washtenaw having the highest levels of D3G but not different from Allegan, Cass, and Branch. The mycotoxin ENNA was found at all nine sites, with Saginaw, Washtenaw, and Ingham having the highest levels of ENNA. Zearalenone was found to be the highest in Washtenaw, while only very low levels were found in Huron, Ingham, Mason, Montcalm, and Saginaw.
In 2018, DON, D3G, HT-2, and T-2 varied significantly by location (Table 5). Huron had the highest DON levels but was not significantly different from Ingham, Mason, Montcalm, or Saginaw. In addition, D3G levels were found to be the highest in Saginaw and lowest in Branch and Washtenaw. Significantly higher levels of T-2 were found in Huron than all other locations. HT-2 only occurred in two out of nine locations in 2018.
2.4. Environmental Conditions
In 2017, average temperatures in July varied across the state, with some locations experiencing higher than average temperatures, while others were lower than average (Table 6). During the last half of August and early September, temperatures across the state were generally cooler than normal. This resulted in lower than normal temperature at all locations in August. Average September temperatures were higher than normal at all locations except Branch. This increase in temperature in September can mostly be attributed to higher than normal temperatures across the state during the last part of the month. Rainfall was greater than normal in Mason in July 2017. Besides this exception, rainfall was lower than normal at all other locations between July and September. Though many of the months were lower than normal, there was still great variability in rainfall between locations. July through September precipitation totals ranged between 75.6 mm and 200 mm (Table 6).
Environmental conditions also varied between locations in 2018. At the majority of locations, temperatures trended higher in 2018 throughout most of July and August compared to 2017. These July and August temperatures were greater than the 30-year average at all locations except Montcalm. Average temperatures in September were higher than the 30-year average at all locations. Temperatures in September trended lower at the end of the month when compared to 2017. Precipitation levels were generally higher in 2018 compared to 2017. July through September precipitation totals ranged between 158 mm and 326 mm in 2018. Rainfall was lower than normal at all locations in July and higher than normal at all locations in August. In September, precipitation was higher than normal in Ingham, Mason, and Montcalm, while all other locations had lower rainfall than normal. Overall, July through September precipitation was higher than normal in Mason, Montcalm, and Saginaw and lower than normal at all other locations (Table 6).
2.5. Western Bean Cutworm Incidence
Western bean cutworm incidence was calculated for each of the locations in 2017 and 2018. Western bean cutworm incidence in 2017 was significantly higher in Washtenaw compared to all other locations. In 2018, there were no locations that were statistically different from one another (Table 7).
3. Discussion
Many different types of mycotoxins were found across the state of Michigan in this study. Not only was the incidence of these mycotoxins high, but the concentration of mycotoxin contamination was also high in certain scenarios. Moreover, the levels of mycotoxin co-occurrence were found to be high across the two years of study.
High levels of multiple mycotoxin contamination were shown to occur in this study, with all samples testing positive for at least four different mycotoxins. Results from a worldwide mycotoxin survey between 2009 and 2011 found that North, Central, and South America had 40% of finished feed samples testing positive for contamination from multiple mycotoxins using ELISA or HPLC testing for aflatoxins, ZEN, DON, fumonisins, and ochratoxins [29]. Studies from maize in Tanzania reported that 87% of samples were contaminated with more than one mycotoxin when tested using HPLC/TOFMS [30]. Based on this information, multiple mycotoxin co-occurrence seems to be common in maize and other feedstuffs across many geographic areas, including the U.S. Great Lakes Region.
Both the incidence and severity of mycotoxins influence the levels of contamination. The mycotoxins DON, BEA, FB1, D3G, ZEN, FB2, and FB3 were all found in greater than 80% of the samples surveyed across the two years of the study. This is similar to findings from a neighboring region (Ontario, Canada), Belgium, as well as a seven-year mycotoxin survey in the U.S. where mycotoxins with the highest incidence were DON, FB1, and ZEN [31,32,33]. Mycotoxins found in these studies are produced mostly by Fusarium spp. [20,23,26], indicating that mycotoxin production by Fusarium spp. in maize grain may be a common issue in the temperate zone. In this study, aflatoxin was not found in any sample, indicating that aflatoxins are not currently an issue in the Great Lakes Region. Aflatoxins were also found to be absent in a farm survey conducted in Northern Europe [34]. Rate of mycotoxin production can also vary with the fungal genera and within strains of a fungal species [3].
Correlations between mycotoxins was also found in both years of the study. Many of the mycotoxins found to be correlated with one another are produced by Fusarium spp., including DON, its derivatives, ZEN, the fumonisins, MON, and BEA. Correlations between the three fumonisin analogs were also found in the study. These data indicated that mycotoxins produced by a fungal species or different species of the same genus (Fusarium) are often found occurring together. Similar correlations were observed in mycotoxin surveys carried out in the U.S. and Italy [33,35]. These correlations may help in determining when mycotoxins could co-occur.
Understanding the role of environmental factors on ear rot occurrence and associated mycotoxin accumulation is important in efforts to reduce the co-contamination of mycotoxins [36]. Infection through maize silks is an important point of entry for many ear rot causing fungal pathogens [12]. Environmental conditions before, during, and after the silking period are important for fungal infection [12]. Differences in environmental conditions around silking between years and locations may factor into which mycotoxins are present and at what concentrations. At the study locations, 2018 trended hotter throughout the majority of the seasons and locations. In addition, precipitation was higher around silking in August 2018. Between locations, weather patterns were variable around silking times, which may have caused mycotoxins to vary by location as various fungal species prefer specific environmental conditions. Knowing the weather patterns around and following silking can help growers in predicting which mycotoxins may be present in their fields and at what concentrations as each fungal species may favor different weather conditions. Further research is needed in developing predictive models that can assess risk and estimate level of mycotoxin co-occurrence in maize grain based on regional environmental conditions.
In addition, western bean cutworm damage to ears allows for the entry of the fungal pathogen [12]. In 2017, Washtenaw had significantly higher western bean cutworm damage than all other locations. Washtenaw also had the highest concentrations of DON, D3G, ZEN, and ENNA though not significantly different from some other locations. These data showed that the increase in western bean cutworm incidence may lead to an increase in fungal infection, resulting in increased DON and other mycotoxin contamination of maize grain.
Overall, this study has determined that multiple mycotoxin contamination is present at high levels in Michigan and likely throughout the Great Lakes Region just as it has been shown to be present in other areas of the world. Toxins not regularly tested for in the U.S. are present in maize grain, which may be affected by environmental conditions. A broader survey should be conducted to increase knowledge of the occurrence of multiple mycotoxin contamination in maize grain throughout the varied growing environments found in the U.S. corn belt. Moreover, these findings emphasize the importance of research into the effects of mycotoxin co-occurrence on human and animal health. Though concentrations of some detected mycotoxins were low, these should be taken into consideration due to the possible synergistic or additive effects with other mycotoxins occurring in maize grain.
4. Materials and Methods
Samples were obtained from a larger experiment at nine locations in Michigan in each of the 2017 and 2018 growing seasons [37] for a total of 18 unique environments (Figure 4). Locations were selected to represent the variability of environmental conditions across Michigan. Locations generally had loam or sandy loam soils except Mason 2017 and Washtenaw 2018, which had loamy sand complexes. Branch, Cass, and Mason were under irrigation, while all others were non-irrigated. Most plots were in fields following soybean (Glycine max (L.) Merr.) except Huron 2017 and 2018, Branch 2018, Cass 2018, Montcalm 2018, and Washtenaw 2018, which all followed maize. Mason 2017 followed carrots with a rye cover. All plots were planted on commercial farms, and all fungal infection was from natural sources. Plots were planted with a four-row Almaco packet planter (Almaco, Nevada, IA, USA) with row spacing of 0.76 m. Plots measured 6.71 m by 3.05 m with 0.91 m alleyways between plots. Plots were planted between 10 May and 29 May in 2017 and between 9 May and 13 June in 2018. The center two rows of each plot were used for data collection, with the outer two rows acting as a buffer. Average population at locations ranged between 77,219 and 85,586 plants per hectare. Plots were managed according to grower standards for the area. One location (Cass 2018) received a blanket application of Delaro (prothioconazole and trifloxystrobin, Bayer®, Research Triangle Park, NC, USA) fungicide via center-pivot irrigation system at 365.56 mL ha−1. Delaro is not labeled for the control of ear rots or mycotoxins in maize grain. No other locations in the study were treated with a fungicide.
At each location, samples were collected from one hybrid typical to Michigan growers. The hybrid selected was rated 2600 growing degree days to black layer. This hybrid was chosen because it had “average” tolerance to Gibberella ear rot, Aspergillus ear rot, and Fusarium ear rot as rated by the seed company. The Bt trait package included Lepidoptera proteins Cry1A.105, Cry1Ab2, and Cry1F, which provide protection against several ear-feeding Lepidoptera insects. This includes black cutworm (Agrotis ipsilon), corn earworm (Helicoverpa zea), European corn borer (Ostrinia nubilalis), fall armyworm (Spodoptera frugiperda), and stalk borer (Papaipema nebris) [38]. Western bean cutworm, the most important ear-feeding insect in Michigan was not controlled by the Bt protein in the hybrid used.
Sample collection at each location occurred in five replicated plots, resulting in 90 samples across the nine locations and two years of study period. For each plot, ten consecutive ears from each of the middle two rows were hand-harvested for a total of 20 ears per plot once kernels reached physiological maturity [39]. Husks were removed, and ears were rated for western bean cutworm incidence, calculated as the percentage of the 20 ears that were damaged by the insect. Ears were then shelled using a Haban Husker-Sheller (Haban Manufacturing, Co., Racine, WI, USA). Shelled kernels from the 20 ears were combined and mixed thoroughly, and a 500 g representative sample was then taken. This sample was ground using a cyclone sample mill (UDY Corporation, Fort Collins, CO, USA) with a 1 mm screen, and a 50 g subsample was submitted for mycotoxin analysis.
Samples were tested for 20 different mycotoxins (Table 1). All mycotoxin detection and quantification, except FB3 and Aflatoxin B1, was performed using an Ionics EP 10 + modified API 365 triple quadrupole mass spectrometer (LC-MS/MS; AB SCIEX, Concord, ON, CA.) system equipped with an electrospray ionization source, in positive and negative polarity, at the University of Guelph, Ridgetown Campus, Ontario, Canada following the method described in [40]. The optimized LC-ESI–MS/MS parameters for FB3 (retention time: 13.02 min) were 706.6 mass-to-charge ratio (m/z) for precursor ion (declustering potential: 130 V) and 336.3 m/z (quantifier ion; collision energy: 56 V; cell exit potential: 30 V) and 318.5 m/z (qualifier ion; collision energy: 47 V; cell exit potential: 45 V) for product ions. For aflatoxin B1 (retention time: 9.0 min), parameters were 312.9 mass-to-charge ratio (m/z) for precursor ion (declustering potential: 127 V) and 284.9 m/z (quantifier ion; collision energy: 32 V; cell exit potential: 17 V) and 241.1 m/z (qualifier ion; collision energy: 50 V; cell exit potential: 17 V) for product ions. Recovery test was performed in triplicate, as previously described, by spiking 5 g of blank ground maize samples at two concentrations (50.0 and 100.0 ng/g). Mean recovery value for FB3 and aflatoxin B1 was 97.7% ± 4.5% (s.d.) and 98.1 ± 6.5% with a LOD of 5.8 and 10.2 n/g, respectively. All values lower than the LOD were considered negative reads. Positive detection rates for various mycotoxins at each location are presented in Supplementary Tables S1 and S2 for 2017 and 2018, respectively.
Mycotoxin data were analyzed using PROC GLIMMIX in SAS software (SAS Institute Inc., version 9.4, Cary, NC, USA) at a p-value of 0.05. Data analysis was conducted separately by year due to large environmental differences between 2017 and 2018 growing seasons. Location was considered a fixed effect and replication as a random effect in the model. Locations were considered significantly different at p < 0.05, and all pairwise comparisons were made using the lsmeans statement with Tukey’s adjustment. Standard deviation for toxins that were different between locations are presented in Supplementary Tables S3 and S4 for 2017 and 2018, respectively.
Supplementary Materials
The following supporting information can be downloaded at: https://www.mdpi.com/article/10.3390/toxins14070431/s1. Table S1. Positive detection rates for beauvericin (BEA), deoxynivalenol (DON), deoxynivalenol 3-β-D-glucoside (D3G), 15-acetyl-deoxynivalenol (15-ADON), enniatin A (ENNA), enniatin B (ENNB), enniatin B1 (ENNB1), fumonisin B1 (FB1), fumonisin B2 (FB2), fumonisin B3 (FB3), Moniliformin (MON), T-2, and Zearalenone (ZEN) at all locations in 2017; Table S2: Positive detection rates for beauvericin (BEA), deoxynivalenol (DON), deoxynivalenol 3-β-D-glucoside (D3G), 15-acetyl-deoxynivalenol (15-ADON), 3-acetyl-deoxynivalenol (3-ADON), enniatin A (ENNA), enniatin A1 (ENNA1), enniatin B (ENNB), enniatin B1 (ENNB1), fumonisin B1 (FB1), fumonisin B2 (FB2), fumonisin B3 (FB3), Moniliformin (MON), HT-2, T-2, and Zearalenone (ZEN) at all locations in 2018; Table S3: Standard deviation of deoxynivalenol (DON), deoxynivalenol 3-β-D-glucoside (D3G), HT-2 toxin (HT-2), and T-2 toxin (T-2) contamination levels at all locations in 2017; all other toxins tested did not vary by location. * indicates locations under irrigation; Table S4: Standard deviation of deoxynivalenol (DON), deoxynivalenol 3-β-D-glucoside (D3G), HT-2 toxin (HT-2), and T-2 toxin (T-2) contamination levels at all locations in 2018; all other toxins tested did not vary by location. * indicates locations under irrigation.
Author Contributions
Conceptualization, K.F., M.I.C. and M.P.S.; data curation, K.F.; formal analysis, K.F.; funding acquisition, M.P.S.; investigation, K.F., V.L.-R. and M.P.S.; methodology, K.F., V.L.-R. and M.P.S.; project administration, M.P.S.; resources, M.P.S.; supervision, M.P.S.; validation, K.F.; writing—original draft, K.F.; writing—review and editing, M.I.C., V.L.-R. and M.P.S. All authors have read and agreed to the published version of the manuscript.
Funding
This research was funded by Michigan State University AgBioResearch and Corn Marketing Program of Michigan.
Institutional Review Board Statement
Not applicable.
Informed Consent Statement
Not applicable.
Data Availability Statement
Not applicable.
Acknowledgments
The authors would like to thank William Widdicombe and Lori Williams for their support in field work, Bayer for the donation of the seed, undergraduate workers for their hours of field labor, and the farmer cooperators for the use of their land.
Conflicts of Interest
The authors declare no conflict of interest.
References
- Grenier, B.; Oswald, I.P. Mycotoxin co-contamination of food and feed: Meta-analysis of publications describing toxicological interactions. World Mycotoxin J. 2011, 4, 285–313. [Google Scholar] [CrossRef]
- Lee, H.B.; Patriarca, A.; Magan, N. Alternaria in Food: Ecophysiology, Mycotoxin Production and Toxicology (volum 43, p. 93, 2015). Mycobiology 2015, 43, 371. [Google Scholar] [CrossRef] [PubMed] [Green Version]
- Fink-Gremmels, J. Mycotoxins: Their implications for human and animal health. Vet. Q. 1999, 21, 115–120. [Google Scholar] [CrossRef]
- Kovalsky, P.; Kos, G.; Nährer, K.; Schwab, C.; Jenkins, T.; Schatzmayr, G.; Sulyok, M.; Krska, R. Co-Occurrence of Regulated, Masked and Emerging Mycotoxins and Secondary Metabolites in Finished Feed and Maize—An Extensive Survey. Toxins 2016, 8, 363. [Google Scholar] [CrossRef] [PubMed] [Green Version]
- Smith, M.-C.; Madec, S.; Coton, E.; Hymery, N. Natural Co-Occurrence of Mycotoxins in Foods and Feeds and Their in vitro Combined Toxicological Effects. Toxins 2016, 8, 94. [Google Scholar] [CrossRef] [PubMed]
- Zhang, Z.; Nie, D.; Fan, K.; Yang, J.; Guo, W.; Meng, J.; Zhao, Z.; Han, Z. A systematic review of plant-conjugated masked mycotoxins: Occurrence, toxicology, and metabolism. Crit. Rev. Food Sci. Nutr. 2019, 60, 1523–1537. [Google Scholar] [CrossRef] [PubMed]
- FDA. Guidance for Industry and FDA: Advisory Levels for Deoxynivalenol (DON) in Finished Wheat Products for Human Consumption and Grains and Grain By-Products Used for Animal Feed; FDA: Silver Spring, MD, USA, 2010.
- Action Levels for Aflatoxins in Animal Food: Compliance Policy Guide; FDA: Silver Spring, MD, USA, 2019.
- Guidance for Industry: Fumonisin Levels in Human and Animal Feeds; FDA: Silver Spring, MD, USA, 2001.
- Van Egmond, H.P.; Schothorst, R.C.; Jonker, M.A. Regulations relating to mycotoxins in food. Anal. Bioanal. Chem. 2007, 389, 147–157. [Google Scholar] [CrossRef] [PubMed] [Green Version]
- Miller, S.S.; Reid, L.M.; Harris, L.J. Colonization of maize silks by Fusarium graminearum, the causative organism of gibberella ear rot. Can. J. Bot. Rev. Can. Bot. 2007, 85, 369–376. [Google Scholar] [CrossRef]
- Munkvold, G.P. Epidemiology of Fusarium Diseases and their Mycotoxins in Maize Ears. Eur. J. Plant Pathol. 2003, 109, 705–713. [Google Scholar] [CrossRef]
- Parker, N.S.; Anderson, N.R.; Richmond, D.S.; Long, E.Y.; Wise, K.A.; Krupke, C.H. Larval western bean cutworm feeding damage encourages the development of Gibberella ear rot on field corn. Pest Manag. Sci. 2016, 73, 546–553. [Google Scholar] [CrossRef] [PubMed]
- Smith, J.; Limay-Rios, V.; Hooker, D.C.; Schaafsma, A.W. Fusarium graminearum Mycotoxins in Maize Associated with Striacosta albicosta (Lepidoptera: Noctuidae) Injury. J. Econ. Entomol. 2018, 111, 1227–1242. [Google Scholar] [CrossRef] [PubMed]
- Bowers, E.; Hellmich, R.; Munkvold, G. Vip3Aa and Cry1Ab proteins in maize reduce Fusarium ear rot and fumonisins by deterring kernel injury from multiple Lepidopteran pests. World Mycotoxin J. 2013, 6, 127–135. [Google Scholar] [CrossRef] [Green Version]
- Puschner, B. Mycotoxins. Vet. Clin. North Am. Small Anim. Pract. 2002, 32, 409. [Google Scholar] [CrossRef]
- Van Egmond, H.P.; Jonker, M. Worldwide Regulations for Mycotoxins in Food and Feed in 2003; Food and Agriculture Organization of the United Nations: Rome, Italy, 2004. [Google Scholar]
- Jestoi, M. Emerging Fusarium-mycotoxins fusaproliferin, beauvericin, enniatins, and moniliformin—A review. Crit. Rev. Food Sci. Nutr. 2008, 48, 21–49. [Google Scholar] [CrossRef] [PubMed]
- Wang, Q.; Xu, L. Beauvericin, a Bioactive Compound Produced by Fungi: A Short Review. Molecules 2012, 17, 2367–2377. [Google Scholar] [CrossRef] [PubMed]
- Logrieco, A.F.; Mule, G.; Moretti, A.; Bottalico, A. Toxigenic Fusarium Species and Mycotoxins Associated with Maize Ear Rot in Europe. Eur. J. Plant Pathol. 2002, 108, 597–609. [Google Scholar] [CrossRef]
- Mirocha, C.J.; Pathre, S.V.; Schauerhamer, B.; Christensen, C.M. Natural occurrence of Fusarium toxins in feedstuff. Appl. Environ. Microbiol. 1976, 32, 553–556. [Google Scholar] [CrossRef] [PubMed] [Green Version]
- Nagl, V.; Woechtl, B.; Schwartz-Zimmermann, H.E.; Hennig-Pauka, I.; Moll, W.-D.; Adam, G.; Berthiller, F. Metabolism of the masked mycotoxin deoxynivalenol-3-glucoside in pigs. Toxicol. Lett. 2014, 229, 190–197. [Google Scholar] [CrossRef] [Green Version]
- Marín, S.; Magan, N.; Ramos, A.J.; Sanchis, V. Fumonisin-Producing Strains of Fusarium: A Review of Their Ecophysiology. J. Food Prot. 2004, 67, 1792–1805. [Google Scholar] [CrossRef]
- Pronk, M.; Schothorst, R.; Van Egmond, H. Toxicology and Occurrence of Nivalenol, Fusarenon X, Diacetoxyscirpenol, Neosolaniol and 3-and 15-Acetyldeoxynivalenol; A Review of Six Trichothecenes; National Institute for Public Health and the Environment: Utrecht, The Netherlands, 2002.
- Adhikari, M.; Negi, B.; Kaushik, N.; Adhikari, A.; Al-Khedhairy, A.; Kaushik, N.K.; Choi, E.H. T-2 mycotoxin: Toxicological effects and decontamination strategies. Oncotarget 2017, 8, 33933–33952. [Google Scholar] [CrossRef] [PubMed] [Green Version]
- Zinedine, A.; Soriano, J.M.; Moltó, J.C.; Mañes, J. Review on the toxicity, occurrence, metabolism, detoxification, regulations and intake of zearalenone: An oestrogenic mycotoxin. Food Chem. Toxicol. 2007, 45, 1–18. [Google Scholar] [CrossRef] [PubMed]
- Murphy, P.A.; Rice, L.G.; Ross, P.F. Fumonisin-b1, fumonisin-b2, and fumonisin-b3 content of iowa, wisconsin, and illinois corn and corn screenings. J. Agric. Food Chem. 1993, 41, 263–266. [Google Scholar] [CrossRef]
- Liuzzi, V.C.; Mirabelli, V.; Cimmarusti, M.T.; Haidukowski, M.; Leslie, J.F.; Logrieco, A.F.; Caliandro, R.; Fanelli, F.; Mulè, G. Enniatin and Beauvericin Biosynthesis in Fusarium Species: Production Profiles and Structural Determinant Prediction. Toxins 2017, 9, 45. [Google Scholar] [CrossRef] [PubMed] [Green Version]
- Rodrigues, I.; Naehrer, K. A Three-Year Survey on the Worldwide Occurrence of Mycotoxins in Feedstuffs and Feed. Toxins 2012, 4, 663–675. [Google Scholar] [CrossRef]
- Karimla, A.; Ortiz, J.; Kimanya, M.; Haesaert, G.; Donoso, S.; Tiisekwa, B.; De Meulenaer, B. Multiple mycotoxin co-occurrence in maize grown in three agro-ecological zones of Tanzania. Food Control 2015, 54, 208–215. [Google Scholar]
- Schaafsma, A.W.; Limay-Rios, V.; Tamburic-Illincic, L. Mycotoxins and Fusarium species associated with maize ear rot in Ontario, Canada. Cereal Res. Commun. 2008, 36, 525–527. [Google Scholar]
- Vandicke, J.; De Visschere, K.; Ameye, M.; Croubels, S.; De Saeger, S.; Audenaert, K.; Haesaert, G. Multi-Mycotoxin Contamination of Maize Silages in Flanders, Belgium: Monitoring Mycotoxin Levels from Seed to Feed. Toxins 2021, 13, 202. [Google Scholar] [CrossRef]
- Weaver, A.C.; Weaver, D.M.; Adams, N.; Yiannikouris, A. Co-Occurence of 35 Mycotoxins: A Seven-Year Survey of Corn Grain and Corn Silage in United States. Toxins 2021, 13, 516. [Google Scholar] [CrossRef]
- Manni, K.; Rämö, S.; Franco, M.; Rinne, M.; Huuskonen, A. Occurrence of Mycotoxins in Grass and Whole-Crop Cereal Silages—A Farm Survey. Agriculture 2022, 12, 398. [Google Scholar] [CrossRef]
- Gallo, A.; Ghilardelli, F.; Atzori, A.; Zara, S.; Novak, B.; Faas, J.; Fancello, F. Co-Occurrence of Regulated and Emerging Mycotoxins in Corn Silage: Relationships with Fermentation Quality and Bacterial Communities. Toxins 2021, 13, 232. [Google Scholar] [CrossRef]
- Khodaei, D.; Javanmardi, F.; Khaneghah, A.M. The Global Overview of the Occurence of mycotoxins in cereals: A three-year survey. Curr. Opin. Food Sci. 2021, 39, 36–42. [Google Scholar] [CrossRef]
- Fusilier, K.M. Integrated Mycotoxin Management Strategies in Maize Grain; Michigan State University: East Lansing, MI, USA, 2019. [Google Scholar]
- DiFonzo, C.; Porter, P. The Handy Bt Trait Table for U.S. Corn Production. 2022. Available online: https://www.texasinsects.org/bt-corn-trait-table.html (accessed on 15 April 2022).
- Abendroth, L.J.; Elmore, R.W.; Boyer, M.J.; Marlay, S.K. Corn Growth and Development; Iowa State University Extension: Beardshear Hall, IA, USA, 2011. [Google Scholar]
- Limay-Rios, V.; Schaafsma, A.W. Effect of Prothioconazole Application Timing on Fusarium Mycotoxin Content in Maize Grain. J. Agric. Food Chem. 2018, 66, 4809–4819. [Google Scholar] [CrossRef] [PubMed]
Figure 1.
Distribution of multiple mycotoxin occurrence in 45 samples in each of nine locations throughout Michigan during 2017 (a) and 2018 (b) growing seasons. Bars indicate the percentage of samples with a certain number of mycotoxins present. Samples were tested for 20 different mycotoxins.
Figure 1.
Distribution of multiple mycotoxin occurrence in 45 samples in each of nine locations throughout Michigan during 2017 (a) and 2018 (b) growing seasons. Bars indicate the percentage of samples with a certain number of mycotoxins present. Samples were tested for 20 different mycotoxins.
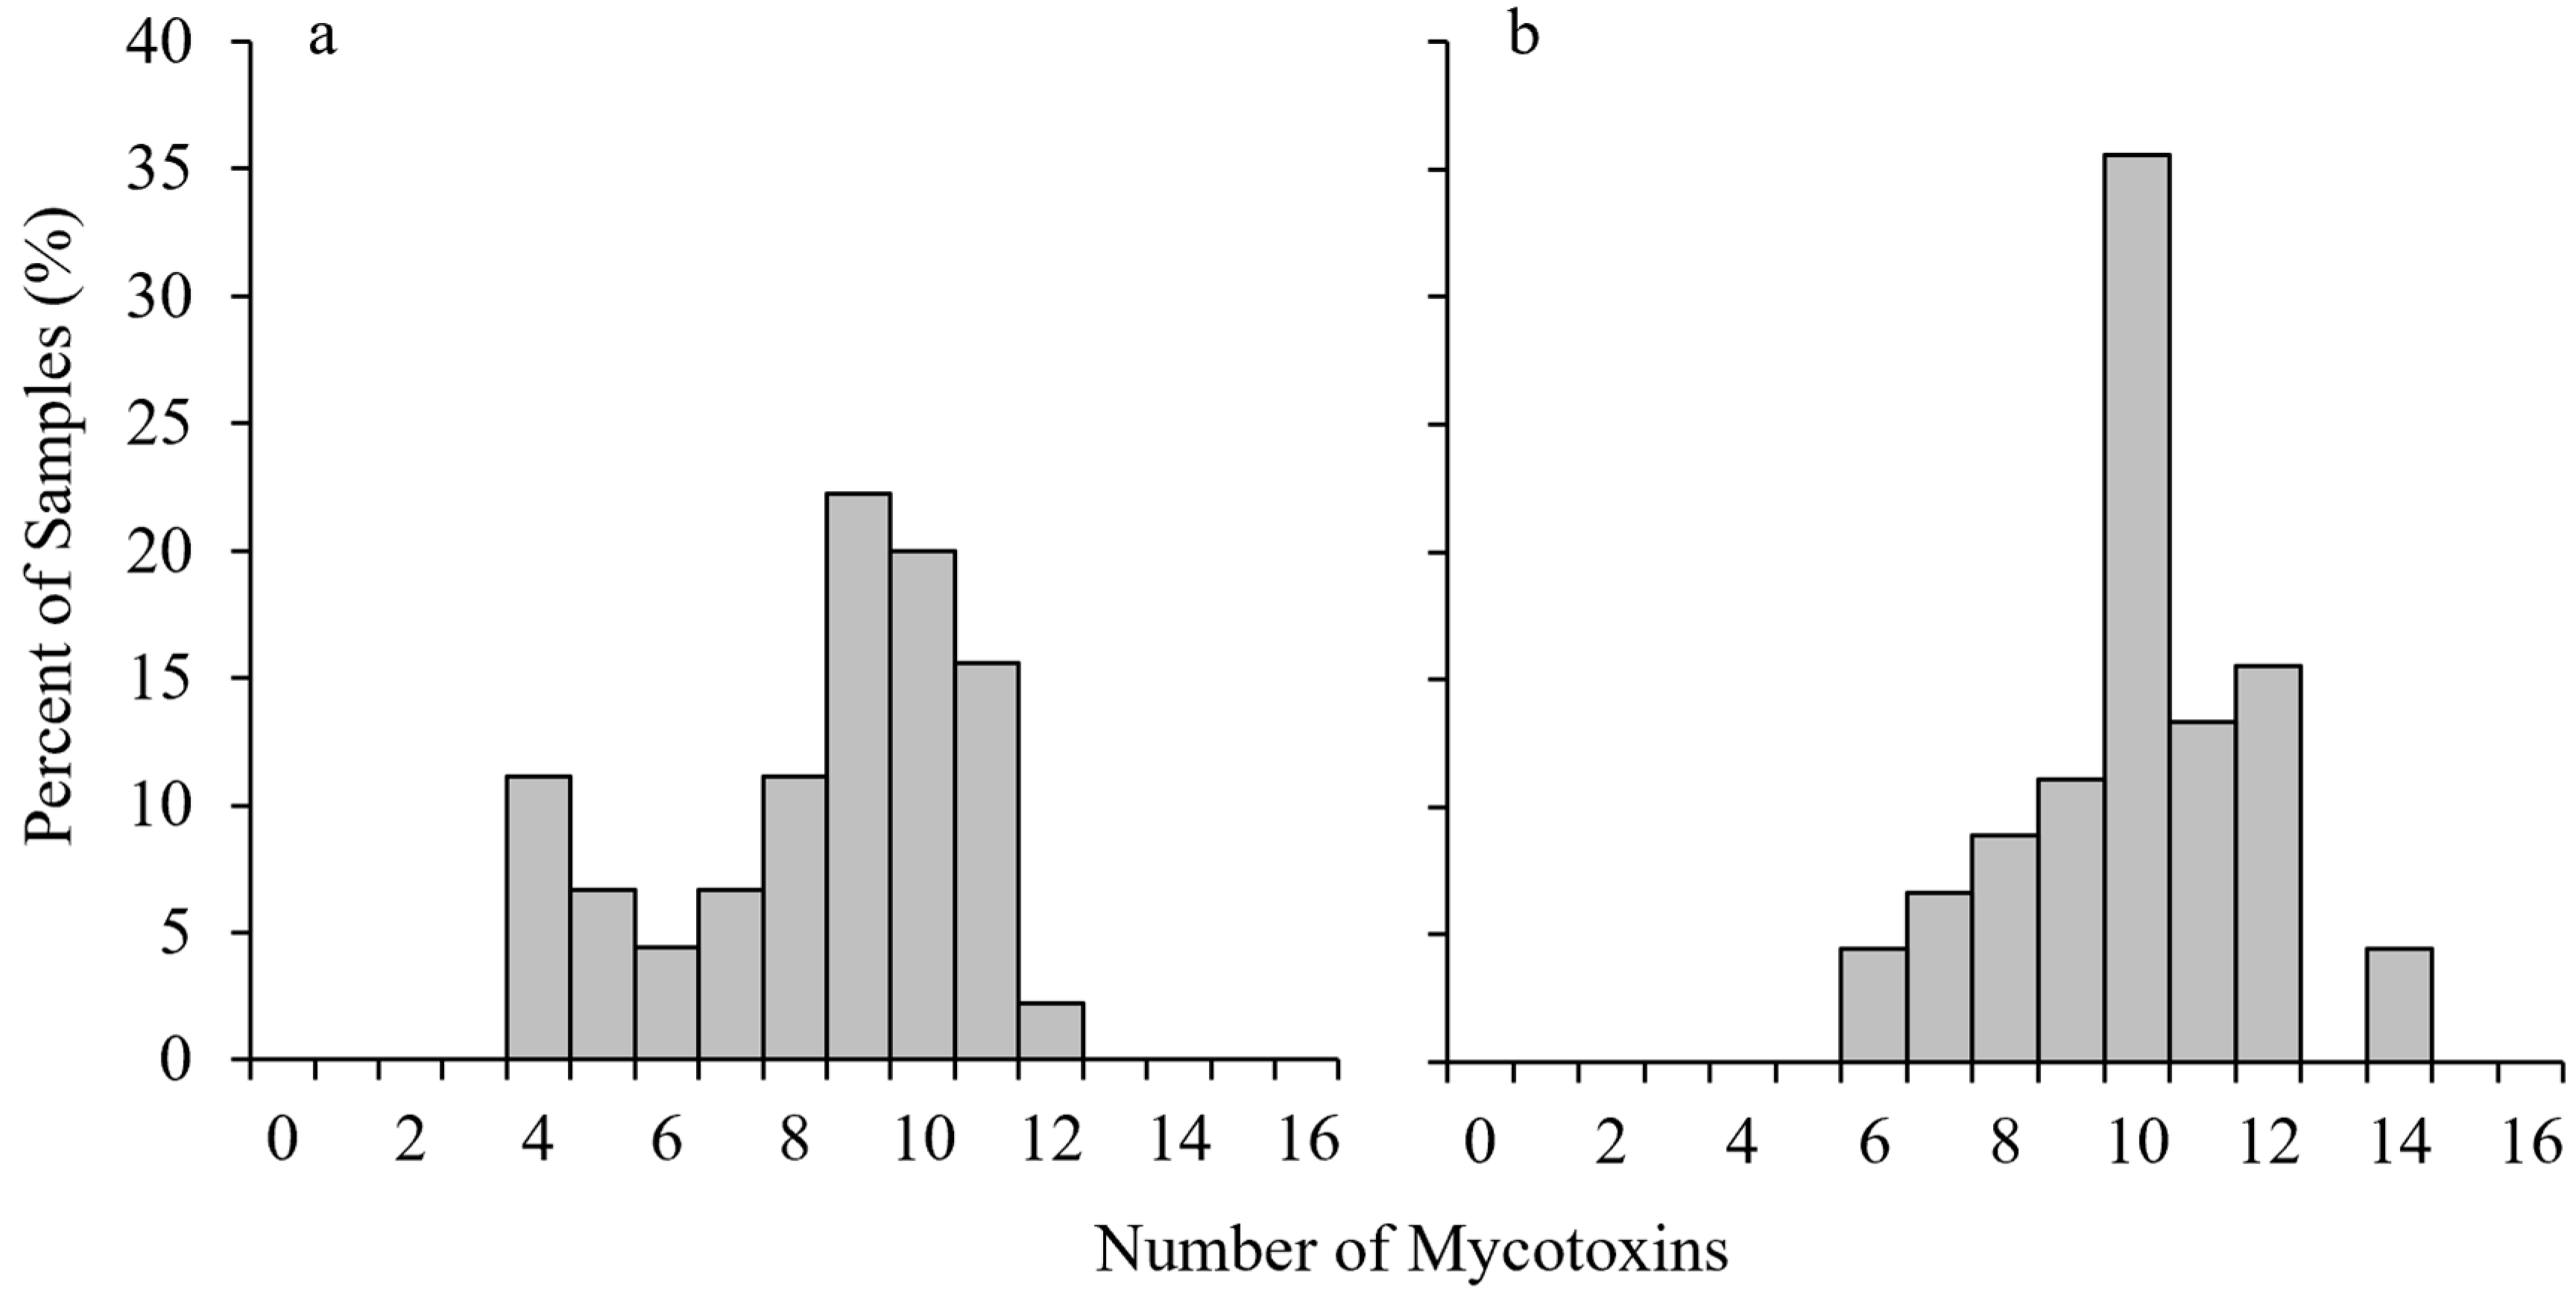
Figure 2.
Pearson’s correlation coefficient for mycotoxins in 2017 samples. ***, **, and * represent p-values of 0.001, 0.01, and 0.05, respectively. Blue colors indicate positive correlations, while red indicates negative correlations.
Figure 2.
Pearson’s correlation coefficient for mycotoxins in 2017 samples. ***, **, and * represent p-values of 0.001, 0.01, and 0.05, respectively. Blue colors indicate positive correlations, while red indicates negative correlations.

Figure 3.
Pearson’s correlation coefficient for mycotoxins in 2018 samples. ***, **, and * represent p-values of 0.001, 0.01, and 0.05, respectively. Blue colors indicate positive correlations, while red indicates negative correlations.
Figure 3.
Pearson’s correlation coefficient for mycotoxins in 2018 samples. ***, **, and * represent p-values of 0.001, 0.01, and 0.05, respectively. Blue colors indicate positive correlations, while red indicates negative correlations.
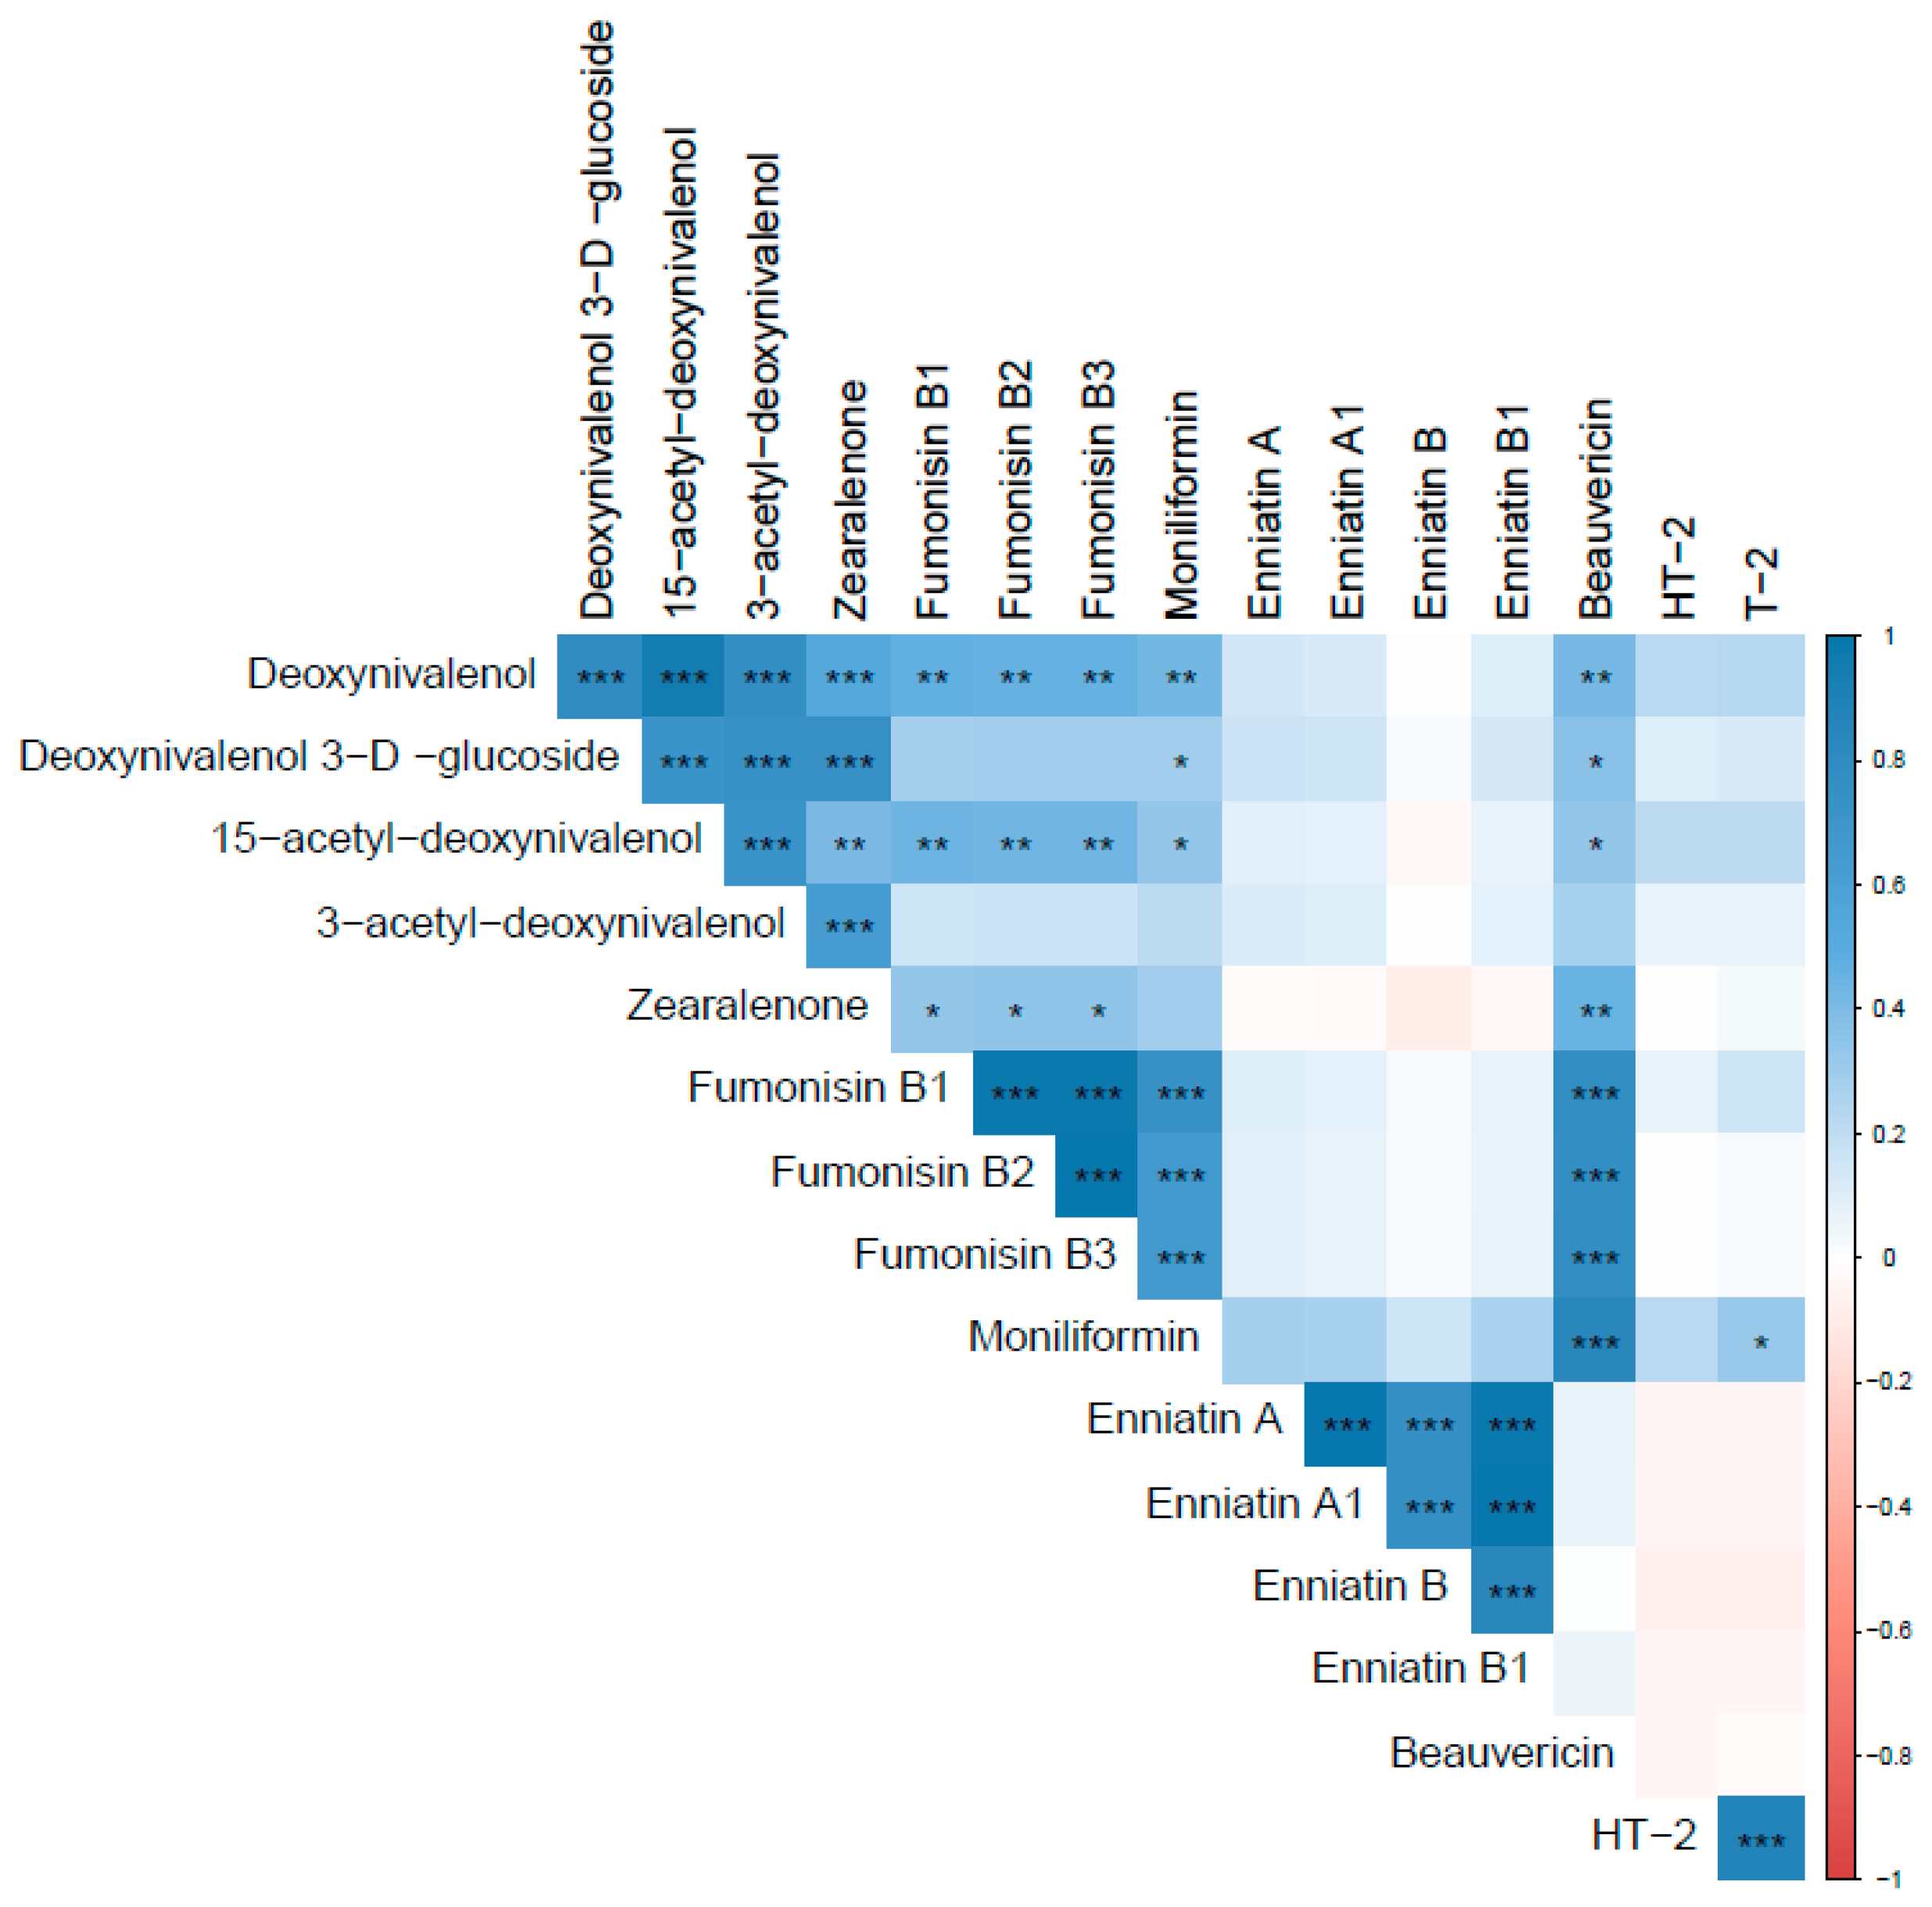
Figure 4.
Sampling locations in Michigan during the 2017 and 2018 growing seasons. Maize grain samples were obtained from the same hybrid (2600 growing degree units to black layer) at each location in both years of the study.
Figure 4.
Sampling locations in Michigan during the 2017 and 2018 growing seasons. Maize grain samples were obtained from the same hybrid (2600 growing degree units to black layer) at each location in both years of the study.
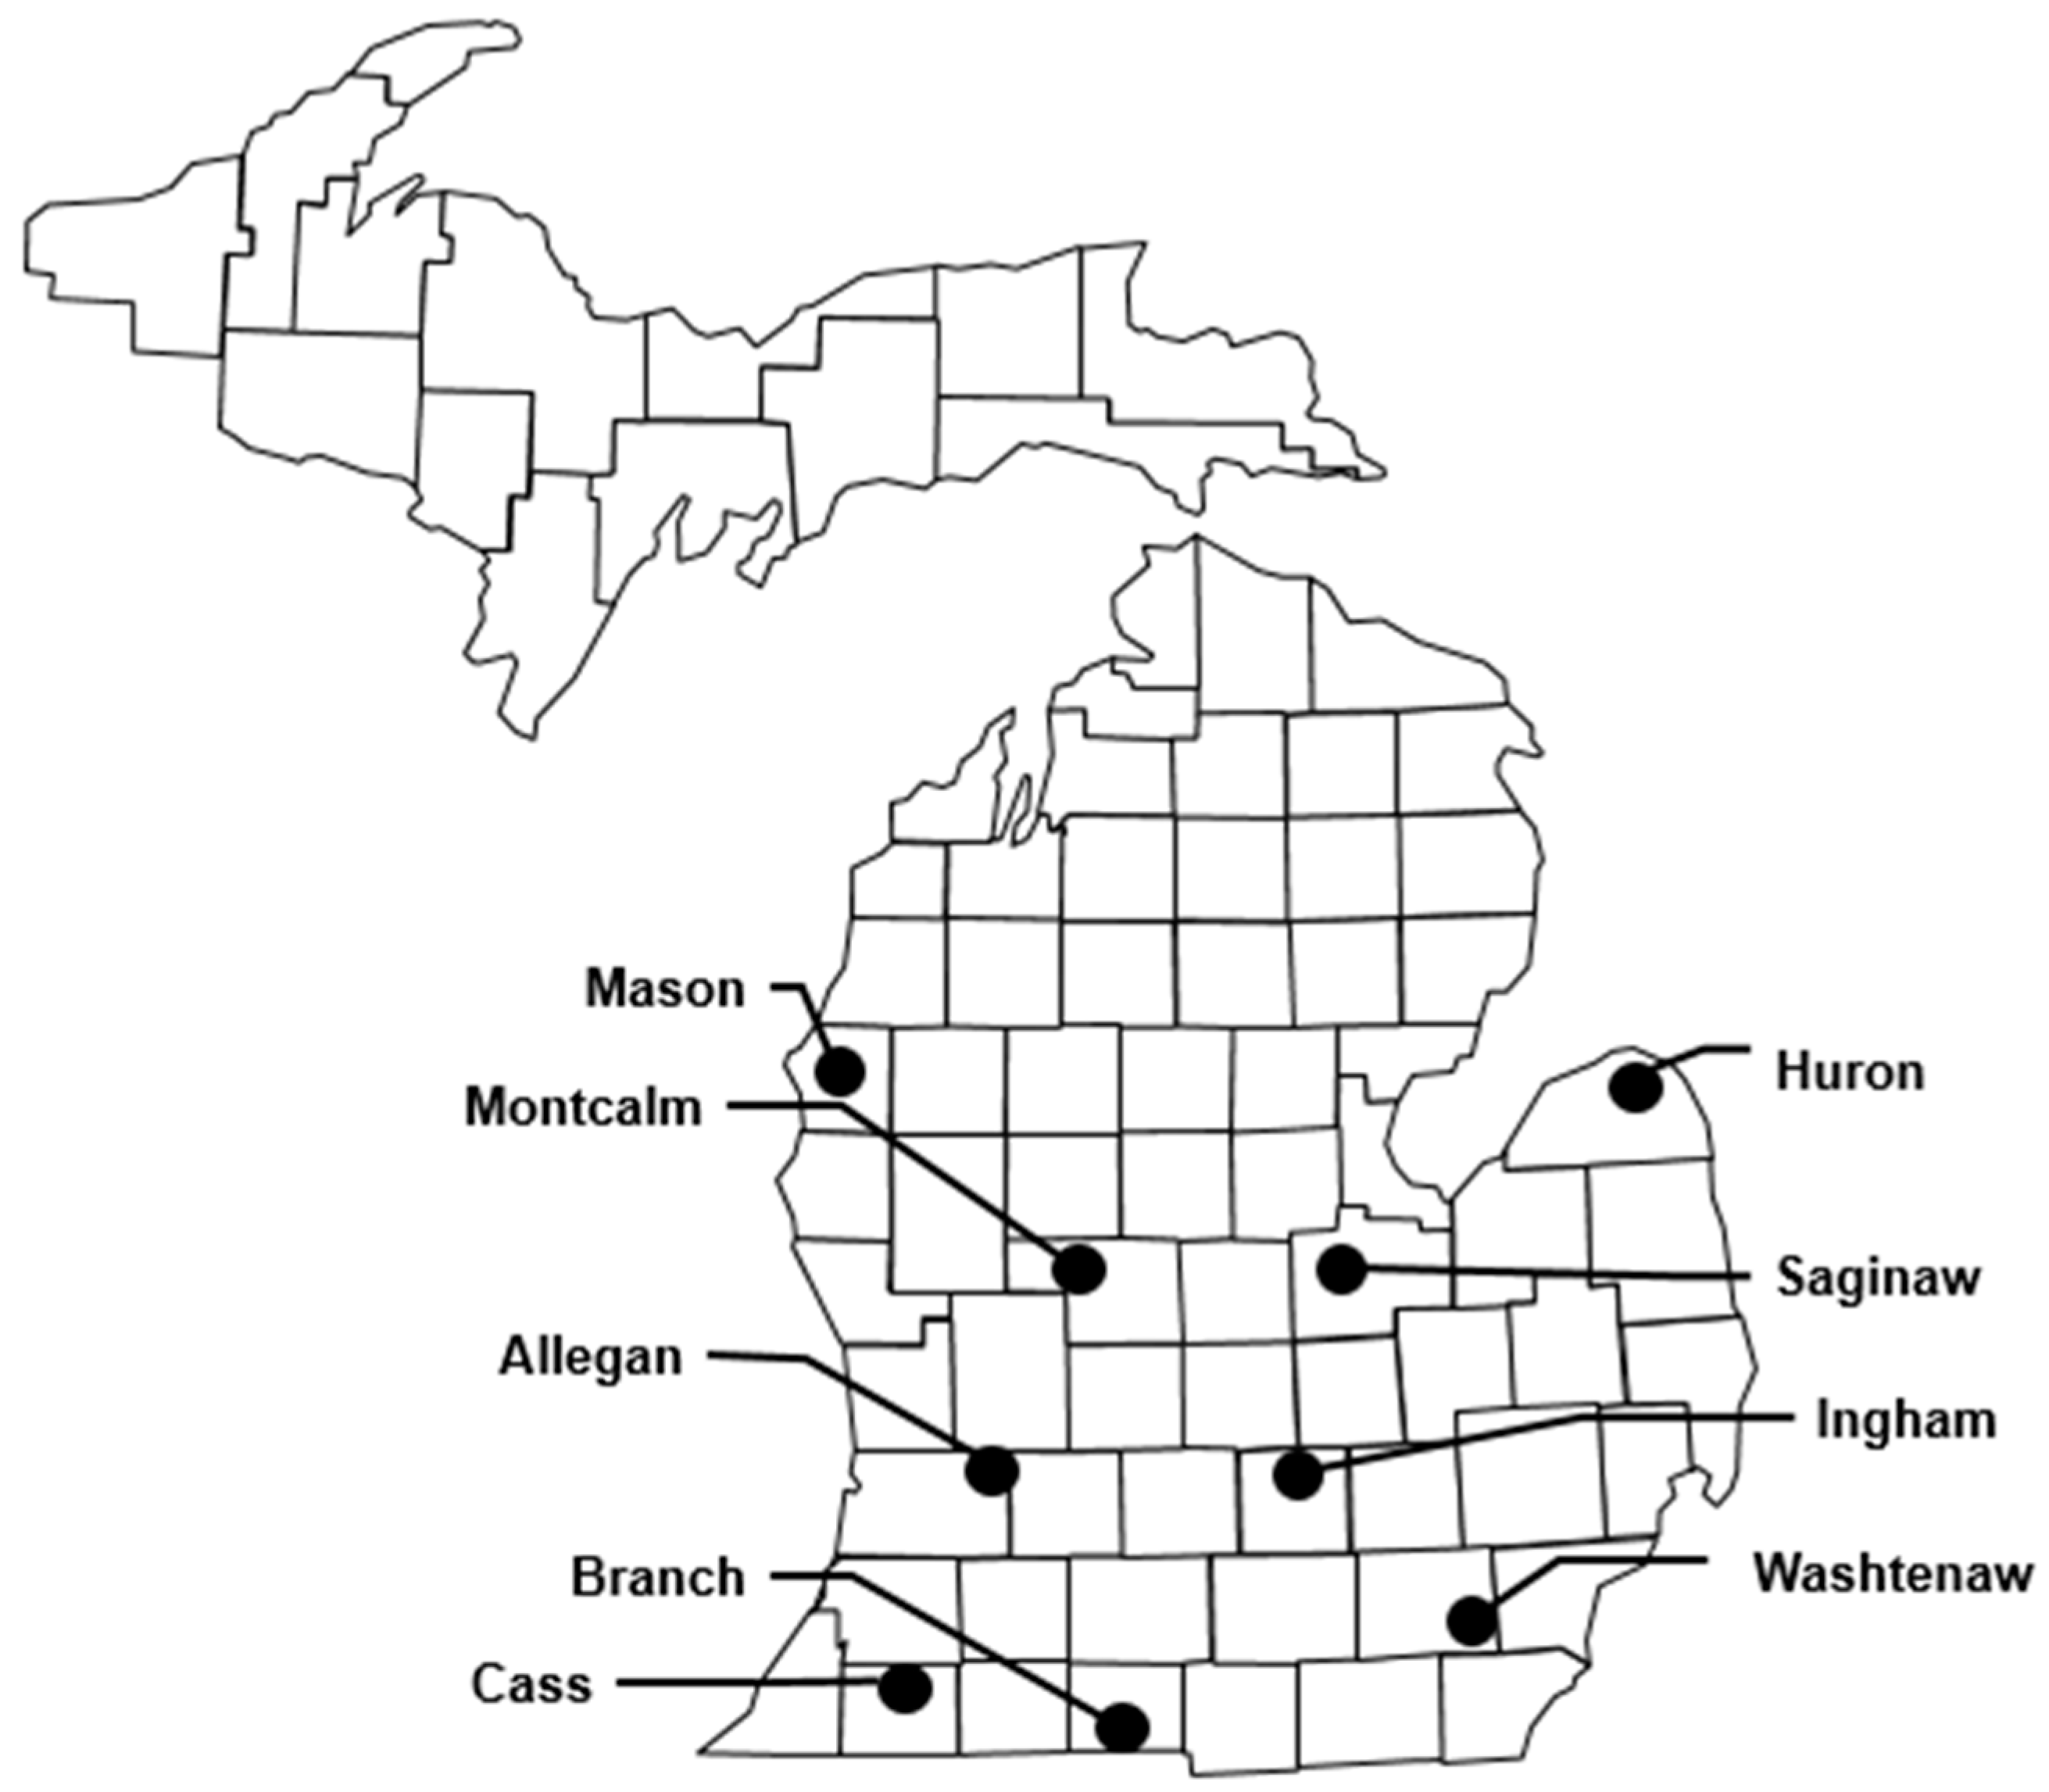
Table 2.
Statistics of mycotoxin concentrations from 45 maize grain samples in 2017 across nine locations in Michigan. Percentage of positive samples, the limit of detection (LOD), the limit of quantification (LOQ), mean, standard deviation (SD), minimum, and maximum concentrations were calculated for each mycotoxin.
| Mycotoxin | LOD a | LOQ b | Positive c | Mean | Median | SD | Min | Max |
|---|---|---|---|---|---|---|---|---|
| μg kg−1 | μg kg−1 | % | –––––––––––––––– μg kg−1 –––––––––––––––– | |||||
| Beauvericin | 0.04 | 0.10 | 78 | 0.11 | 0.69 | 0.03 | ND d | 3217.50 |
| Deoxynivalenol | 14.34 | 30.13 | 93 | 1228.65 | 471.99 | 1657.95 | ND | 8288.60 |
| Deoxynivalenol 3-β-D-glucoside | 1.44 | 3.30 | 73 | 1195.70 | 384.79 | 1631.45 | ND | 6266.49 |
| 15-acetyl-deoxynivalenol | 23.24 | 39.88 | 47 | 137.23 | 0 | 193.50 | ND | 927.64 |
| 3-acetyl-deoxynivalenol | 13.86 | 31.76 | 0 | - | - | - | - | - |
| Diacetoxyscirpenol | 0.29 | 0.72 | 0 | - | - | - | - | - |
| Enniatin A | 0.01 | 0.02 | 100 | 0.11 | 0.11 | 0.03 | 0.05 | 0.19 |
| Enniatin A1 | 0.01 | 0.02 | 0 | - | - | - | - | - |
| Enniatin B | <0.00 | 0.01 | 84 | 0.28 | 0.30 | 0.14 | ND | 0.68 |
| Enniatin B1 | <0.00 | 0.01 | 4 | 0.02 | 0 | 0.11 | ND | 0.65 |
| Fumonisin B1 | 0.19 | 0.49 | 80 | 299.37 | 10.38 | 737.82 | ND | 3686.44 |
| Fumonisin B2 | 0.97 | 2.47 | 80 | 984.53 | 21.65 | 2310.07 | ND | 22,538.63 |
| Fumonisin B3 | 0.58 | 1.55 | 71 | 642.24 | 19.15 | 1737.81 | ND | 8733.03 |
| Fusarenon-X | 104.19 | 232.43 | 0 | - | - | - | - | - |
| HT-2 | 16.54 | 30.12 | 0 | - | - | - | - | - |
| Moniliformin | 0.12 | 0.26 | 47 | 45.50 | 0 | 104.90 | ND | 420.45 |
| Nivalenol | - | - | 0 | - | - | - | - | - |
| T-2 toxin | 0.30 | 0.69 | 11 | 3.42 | 0 | 11.70 | ND | 64.00 |
| Zearalenone | 0.03 | 0.07 | 69 | 196.60 | 9.8 | 451.59 | ND | 2204.13 |
a Limit of detection. Calculated as three times the standard deviation around the analyte retention time b Limit of quantification. Calculated as ten times the standard deviation around the analyte retention time c Samples below the limit of detection were considered negative reads d ND represents samples below the limit of detection.
Table 3.
Statistics of mycotoxin concentrations from 45 maize grain samples in 2018 across nine locations in Michigan. Percentage of positive samples, the limit of detection (LOD), the limit of quantification (LOQ), mean, standard deviation (SD), minimum, and maximum concentrations were calculated for each mycotoxin.
| Mycotoxin | LOD a | LOQ b | Positive c | Mean | Median | SD | Min | Max |
|---|---|---|---|---|---|---|---|---|
| μg kg−1 | μg kg−1 | % | –––––––––––––––– μg kg−1 ––––––––––––––––– | |||||
| Beauvericin | 0.02 | 0.07 | 100 | 588.58 | 58.09 | 1442.40 | 1.04 | 7446.21 |
| Deoxynivalenol | 58.49 | 139.66 | 100 | 5143.06 | 4004.76 | 4910.49 | 173.82 | 20,475.00 |
| Deoxynivalenol 3-β-D-glucoside | 0.73 | 1.77 | 100 | 757.88 | 392.58 | 845.09 | 7.44 | 3249.36 |
| 15-acetyl-deoxynivalenol | 11.64 | 22.77 | 100 | 451.20 | 276.91 | 1787.60 | 38.93 | 1787.60 |
| 3-acetyl-deoxynivalenol | 2.51 | 6.06 | 64 | 11.63 | 9.66 | 13.36 | ND d | 63.04 |
| Diacetoxyscirpenol | - | - | 0 | - | - | - | - | - |
| Enniatin A | 0.01 | 0.03 | 11 | 0.52 | 0 | 3.25 | ND | 21.84 |
| Enniatin A1 | 0.05 | 0.10 | 9 | 0.65 | 0 | 4.06 | ND | 27.28 |
| Enniatin B | 0.01 | 0.01 | 20 | 0.11 | 0 | 0.45 | ND | 2.34 |
| Enniatin B1 | 0.01 | 0.02 | 9 | 0.21 | 0 | 1.19 | ND | 7.94 |
| Fumonisin B1 | 0.21 | 0.50 | 96 | 2179.62 | 324.04 | 6926.47 | ND | 45,145.82 |
| Fumonisin B2 | 0.09 | 0.23 | 89 | 730.75 | 43.99 | 2861.31 | ND | 19,118.06 |
| Fumonisin B3 | 0.09 | 0.25 | 89 | 700.72 | 44.89 | 2693.38 | ND | 17,972.72 |
| Fusarenon-X | - | - | 0 | - | - | - | - | - |
| HT-2 toxin | 1.65 | 0.80 | 9 | 14.07 | 0 | 52.63 | ND | 276.74 |
| Moniliformin | 0.06 | 0.13 | 73 | 141.25 | 14.22 | 267.99 | ND | 1160.35 |
| Nivalenol | - | - | 0 | - | - | - | - | - |
| T-2 toxin | 0.30 | 0.69 | 27 | 7.18 | 0 | 26.47 | ND | 156.65 |
| Zearalenone | 0.03 | 0.05 | 100 | 592.84 | 109.26 | 984.60 | 0.56 | 4148.75 |
a Limit of detection. Calculated as three times the standard deviation around the analyte retention time b Limit of quantification. Calculated as ten times the standard deviation around the analyte retention time c Samples below the limit of detection were considered negative reads d ND represents samples below the limit of detection.
Table 4.
Effect of location on deoxynivalenol (DON), deoxynivalenol 3-β-D-glucoside (D3G), zearalenone (ZEN), and enniatin A (ENNA) contamination levels in 2017; all other toxins tested did not vary by location.
Table 4.
Effect of location on deoxynivalenol (DON), deoxynivalenol 3-β-D-glucoside (D3G), zearalenone (ZEN), and enniatin A (ENNA) contamination levels in 2017; all other toxins tested did not vary by location.
| Location | Mycotoxin | |||
|---|---|---|---|---|
| DON | D3G | ZEN | ENNA | |
| ––––––––––––––––––––– μg kg−1 ––––––––––––––––––––––– | ||||
| Allegan | 1900 ab | 2400 ab | 386 ab | 0.08 b |
| Branch * | 1780 ab | 1570 ab | 191 ab | 0.10 ab |
| Cass * | 1950 ab | 2220 ab | 143 ab | 0.09 b |
| Huron | 130 b | 106 b | 0.49 b | 0.10 ab |
| Ingham | 205 b | 171 b | 0.36 b | 0.14 a |
| Mason * | 485 b | 336 b | 112 b | 0.12 b |
| Montcalm | 1320 ab | 769 b | 63.9 ab | 0.12 ab |
| Saginaw | 126 b | 51.5 b | 3.39 b | 0.14 a |
| Washtenaw | 3690 a | 3110 a | 869 a | 0.14 a |
| p-value | 0.002 | 0.002 | 0.03 | 0.0006 |
Note: Letters indicate significance within columns. Means followed by different letters indicate significant differences at p < 0.05. All other mycotoxins did not differ between locations. * indicates locations under irrigation.
Table 5.
Effect of location on deoxynivalenol (DON), deoxynivalenol 3-β-D-glucoside (D3G), HT-2 toxin (HT-2), and T-2 toxin (T-2) contamination levels in 2018; all other toxins tested did not vary by location.
Table 5.
Effect of location on deoxynivalenol (DON), deoxynivalenol 3-β-D-glucoside (D3G), HT-2 toxin (HT-2), and T-2 toxin (T-2) contamination levels in 2018; all other toxins tested did not vary by location.
| Location | Mycotoxin | |||
|---|---|---|---|---|
| DON | D3G | HT-2 | T-2 | |
| ––––––––––––––––––––– μg kg−1 ––––––––––––––––––––– | ||||
| Allegan | 1820 bcd | 361 ab | 0 b | 0.17 b |
| Branch * | 969 d | 130 b | 0 b | 0.62 b |
| Cass * | 3040 bcd | 252 ab | 0 b | 0.17 b |
| Huron | 10,800 a | 1150 ab | 117 a | 55.5 a |
| Ingham | 3870 abcd | 741 ab | 0 b | 0.22 b |
| Mason * | 5870 abcd | 148 ab | 10.0 b | 7.27 b |
| Montcalm | 9190 abc | 1000 ab | 0 b | 0.31 b |
| Saginaw | 9480 ab | 1600 a | 0 b | 0.00 b |
| Washtenaw | 1250 d | 103 b | 0 b | 0.29 b |
| p-value | 0.0001 | 0.006 | 0.001 | 0.005 |
Note: Letters indicate significance within columns. Means followed by different letters indicate significant differences at p < 0.05. All other mycotoxins did not differ between locations. * indicates locations under irrigation.
Table 6.
Total monthly precipitation (mm) and average monthly temperatures (°C) at each of nine locations in Michigan in 2017 and 2018 along with 30-year averages for each location.
Table 6.
Total monthly precipitation (mm) and average monthly temperatures (°C) at each of nine locations in Michigan in 2017 and 2018 along with 30-year averages for each location.
| Location | 2017 | 2018 | 30-Year Average | |||||||||
|---|---|---|---|---|---|---|---|---|---|---|---|---|
| July | August | September | Total | July | August | September | Total | July | August | September | Total | |
| ––––––––––––––––––––––––––––––––– Precipitation (mm) ––––––––––––––––––––––––––––––––– | ||||||||||||
| Allegan | 57.1 | 71.6 | 19.3 | 148 | 84.0 | 129 | 57.4 | 270 | 86.1 | 97.5 | 96.8 | 280 |
| Branch * | 82.5 | 46.0 | 25.9 | 154 | 50.0 | 113 | 51.0 | 214 | 89.2 | 108 | 105 | 302 |
| Cass * | 85.3 | 68.1 | 46.4 | 200 | 29.7 | 131 | 36.3 | 197 | 111 | 103 | 95.0 | 309 |
| Huron | 65.7 | 68.0 | 27.9 | 162 | 27.4 | 133 | 40.6 | 201 | 81.3 | 89.7 | 98.6 | 270 |
| Ingham | 46.5 | 41.9 | 22.1 | 111 | 40.9 | 87.1 | 93.7 | 222 | 82.8 | 83.8 | 92.2 | 259 |
| Mason * | 83.0 | 45.7 | 34.5 | 163 | 31.5 | 140 | 101 | 273 | 77.0 | 90.2 | 98.6 | 266 |
| Montcalm | 23.3 | 34.5 | 17.8 | 75.6 | 30.2 | 196 | 99.3 | 326 | 79.0 | 92.5 | 96.3 | 268 |
| Saginaw | 78.7 | 79.5 | 21.8 | 180 | 29.0 | 179 | 62.7 | 271 | 79.8 | 81.0 | 95.5 | 256 |
| Washtenaw | 38.8 | 60.4 | 32.5 | 132 | 28.9 | 83.5 | 45.4 | 158 | 88.4 | 77.0 | 87.9 | 253 |
| –––––––––––––––––––––––––––––––– Temperature (°C) –––––––––––––––––––––––––––––––– | ||||||||||||
| Allegan | 21.8 | 19.4 | 17.7 | 22.3 | 22.1 | 18.5 | 21.2 | 20.3 | 16.1 | |||
| Branch * | 19.9 | 17.3 | 15.8 | 22.4 | 22.1 | 18.8 | 21.7 | 20.7 | 16.4 | |||
| Cass * | 21.8 | 19.7 | 18.4 | 22.4 | 22.2 | 19.0 | 22.3 | 21.3 | 17.1 | |||
| Huron | 20.8 | 19.1 | 17.4 | 22.1 | 21.2 | 17.7 | 20.7 | 19.8 | 15.8 | |||
| Ingham | 21.6 | 19.2 | 17.5 | 22.2 | 21.5 | 17.7 | 22.1 | 21.3 | 16.9 | |||
| Mason * | 19.6 | 18.1 | 17.2 | 21.4 | 21.1 | 17.1 | 20.7 | 19.9 | 15.9 | |||
| Montcalm | 20.9 | 18.4 | 17.0 | 21.1 | 21.1 | 17.1 | 21.1 | 20.2 | 15.9 | |||
| Saginaw | 22.1 | 20.1 | 18.2 | 23.2 | 22.6 | 18.5 | 21.6 | 20.69 | 16.1 | |||
| Washtenaw | 22.5 | 20.1 | 17.9 | 22.9 | 22.4 | 19.0 | 22.2 | 21.3 | 16.7 | |||
Note: Monthly temperature and rainfall numbers obtained from the nearest MSU Enviro-weather station (https://mawn.geo.msu.edu/ (accessed on 1 March 2021). Thirty-year average temperature and precipitation data collected from the National Oceanic and Atmosphere Administration (https://www.ncdc.noaa.gov/cdo-web/datatools/normals (accessed on 1 March 2021). * indicates locations under irrigation.
Table 7.
Results of ANOVA for western bean cutworm incidence at each of nine locations across Michigan in 2017 and 2018.
Table 7.
Results of ANOVA for western bean cutworm incidence at each of nine locations across Michigan in 2017 and 2018.
| Location | 2017 | 2018 |
|---|---|---|
| ––––––% –––––––– | ||
| Allegan | 4.00 b | 12.0 a |
| Branch * | 14.0 b | 4.00 a |
| Cass * | 29.6 b | 3.00 a |
| Huron | 21.1 b | 15.0 a |
| Ingham | 19.0 b | 8.00 a |
| Mason * | 18.0 b | 27.9 a |
| Montcalm | 11.9 b | 13.0 a |
| Saginaw | 21.0 b | 15.0 a |
| Washtenaw | 95.0 a | 27.0 a |
| p-value | <0.0001 | 0.1195 |
Note: Letters indicate significance within columns. Means followed by different letters indicate significant differences at p < 0.05. * indicates locations under irrigation.
Publisher’s Note: MDPI stays neutral with regard to jurisdictional claims in published maps and institutional affiliations. |
© 2022 by the authors. Licensee MDPI, Basel, Switzerland. This article is an open access article distributed under the terms and conditions of the Creative Commons Attribution (CC BY) license (https://creativecommons.org/licenses/by/4.0/).
Share and Cite
MDPI and ACS Style
Fusilier, K.; Chilvers, M.I.; Limay-Rios, V.; Singh, M.P. Mycotoxin Co-Occurrence in Michigan Harvested Maize Grain. Toxins 2022, 14, 431. https://doi.org/10.3390/toxins14070431
AMA Style
Fusilier K, Chilvers MI, Limay-Rios V, Singh MP. Mycotoxin Co-Occurrence in Michigan Harvested Maize Grain. Toxins. 2022; 14(7):431. https://doi.org/10.3390/toxins14070431
Chicago/Turabian StyleFusilier, Katlin, Martin I. Chilvers, Victor Limay-Rios, and Maninder P. Singh. 2022. "Mycotoxin Co-Occurrence in Michigan Harvested Maize Grain" Toxins 14, no. 7: 431. https://doi.org/10.3390/toxins14070431
Note that from the first issue of 2016, this journal uses article numbers instead of page numbers. See further details here.