Novel Insights into the Inheritance of Gibberella Ear Rot (GER), Deoxynivalenol (DON) Accumulation, and DON Production


Abstract
:1. Introduction
2. Results
2.1. GER Data
2.2. DON Data
2.3. DON Data for 1% Visual Infection
2.4. Comparison of the Traits and Their Heteroses and Stability
3. Discussion
3.1. Visual Symptoms
3.2. Toxin Evaluation
3.3. DON Contamination and 1% Visual Infection
3.4. Interactions between Traits and Genetic Considerations
3.5. Relationships between Traits
3.6. Breeding Aspects
3.7. Methodical Conclusions
4. Conclusions
5. Materials and Methods
5.1. Plant Material
5.2. Experimental Conditions and Design
5.3. Isolates and Inoculation
5.4. Evaluation of Symptoms and Deoxynivalenol
5.5. Statistical Methods
Author Contributions
Funding
Institutional Review Board Statement
Informed Consent Statement
Data Availability Statement
Acknowledgments
Conflicts of Interest
Abbreviations
| AER | Aspergillus ear rot |
| ANOVA | analysis of variance |
| DON | deoxynivalenol |
| DON% (M/M) | calculated between general means |
| DON% DON | contamination for a GER% visual infection, mean of eight epidemics (year * isolate) |
| FDK | Fusarium damaged kernel mothers |
| FER | Fusarium ear rot |
| FUM | fumonisin B1 + B2 |
| FUMB1 | fumonisin B1 |
| G1-G4 | 5 maize genotypes |
| GCA | general combining ability |
| GER | Gibberella ear rot |
| GER% | Gibberella ear rot severity as percentage |
| (M+F)/2 | parental mean |
| MR | moderately resistant |
| MS/MR | susceptible/moderately resistant |
| ns | not significant |
| QTL | quantitative trait locus |
| S | susceptible |
| SCA | specific combining ability |
| ZEA | zearalenone |
References
- Han, X.; Huangfu, B.; Xu, T.; Xu, W.; Asakiya, C.; Huang, K.; He, X. Research progress of safety of zearalenone: A review. Toxins 2022, 14, 386. [Google Scholar] [CrossRef] [PubMed]
- Mesterhazy, A.; Toldine Toth, E.; Szel, S.; Varga, M.; Toth, B. Resistance of maize hybrids to Fusarium graminearum, F. culmorum, and F. verticillioides ear rots with toothpick and silk channel inoculation, as well as their toxin production. Agronomy 2020, 10, 1283. [Google Scholar] [CrossRef]
- Mesterhazy, A.; Szieberth, D.; Toldine, E.T.; Nagy, Z.; Szabó, B.; Herczig, B.; Bors, I.; Tóth, B. Updating the methodology of identifying maize hybrids resistant to ear rot pathogens and their toxins—Artificial inoculation tests for kernel resistance to Fusarium graminearum, F. verticillioides and Aspergillus flavus. J. Fungi. 2022, 8, 293. [Google Scholar] [CrossRef] [PubMed]
- Szabó, B.; Tóth, B.; Toldiné, É.; Varga, M.; Kovacs, N.; Varga, J.; Kocsubé, S.; Palágyi, A.; Bagi, F.; Budakov, D.; et al. A new concept to secure food safety standards against Fusarium species and Aspergillus flavus and their toxins in maize. Toxins 2018, 10, 372. [Google Scholar] [CrossRef] [PubMed]
- Brown, N.A.; Urban, M.; van de Meene, A.M.; Hammond-Kosack, K.E. The infection biology of Fusarium graminearum: Defining the pathways of spikelet-to-spikelet colonization in wheat ears. Fungal Biol. 2010, 114, 555–571. [Google Scholar] [CrossRef]
- Kazan, K.; Gardiner, D.M.; Manners, J.M. On the trail of a cereal killer: Recent advances in Fusarium graminearum pathogenomics and host resistance. Mol. Plant. Path. 2012, 13, 399–413. [Google Scholar] [CrossRef]
- Lanubile, A.; Maschietto, V.; Marocco, A. Breeding maize for resistance to mycotoxins. In Mycotoxin Reduction in Grain Chains; Leslie, J.F., Logrieco, F., Eds.; Wiley-Blackwell: Ames, IA, USA; Chichester/Oxford, UK, 2014; p. 352. [Google Scholar]
- Reid, L.M.; Hamilton, R.J. Effect of inoculation position, timing, macroconidial concentration and irrigation on resistance of maize to Fusarium graminearum infection through kernels. Can. J. Plant. Path. 1996, 18, 279–285. [Google Scholar] [CrossRef]
- Koehler, B. Natural mode of entrance of fungi into corn ears and some symptoms that indicate infection. J. Agric. Res. 1942, 64, 421–442. [Google Scholar]
- Reid, L.; Bolton, A.; Hamilton, R.; Woldemariam, T.; Mather, D.E. Effect of silk age on resistance of maize to Fusarium graminearum. Can. J. Plant. Pathol. 1992, 14, 293–298. [Google Scholar] [CrossRef]
- Sutton, J.C.; Baliko, W. Methods of quantifying partial resistance to Gibberella zeae in maize ears. Can. J. Plant. Path. 1981, 3, 26–32. [Google Scholar] [CrossRef]
- Mesterházy, Â. Resistance of corn to Fusarium ear rot and its relation to seedling resistance. J. Phytopathol. 1982, 103, 218–231. [Google Scholar] [CrossRef]
- Mesterházy, A.; Lemmens, M.; Reid, L.M. Breeding for resistance to ear rots caused by Fusarium spp. in maize—A review. Plant. Breed. 2012, 131, 1–19. [Google Scholar] [CrossRef]
- Munkvold, G.P.; White, D.G. Compendium of Corn Diseases; The American Phytopathological Society (APS) Press: St. Paul, MN, USA, 2016; p. 165. [Google Scholar]
- Reid, L.M.; Woldemariam, T.; Zhu, X.; Stewart, D.W.; Schaafsma, A.W. Effect of inoculation time and point of entry on disease severity in Fusarium graminearum, Fusarium verticillioides, or Fusarium subglutinans inoculated maize ears. Can. J. Plant. Pathol. 2002, 24, 162–167. [Google Scholar] [CrossRef]
- Munkvold, G.P.; Desjardins, A.E. Fumonisins in Maize. Can we reduce their occurrence? Plant. Dis. 1997, 81, 556–565. [Google Scholar] [CrossRef] [PubMed]
- Reid, L.M.; Hamilton, R.I. Effect of macroconidial suspension volume and concemntration on expression of resistance to Fusarium graminearum in maize. Plant. Dis. 1995, 79, 461–466. [Google Scholar] [CrossRef]
- Czembor, E.; Ochodzki, P. Resistance of flint and dent maize forms for colonization by Fusarium spp. and mycotoxins contamination. Maydica 2009, 54, 263–267. [Google Scholar]
- Nerbass, R.; Casa, R.T.; Kuhnem, P.R.; Bogo, A.; Sangoi, L.; Fingstag, M.D.; Vieira Junior, J.A.L.; Stoltz, J.C. Evaluation of Fusarium graminearum inoculation methods in maize ears and hybrid reaction to Gibberella ear rot under southern Brazilian environmental conditions. Eur. J. Plant. Pathol. 2016, 144, 45–53. [Google Scholar] [CrossRef]
- Griffing, B. Concept of general and specific combining ability in relation to diallel crossing systems. Aust. J. Biol. Sci. 1956, 9, 463–493. [Google Scholar] [CrossRef]
- Nyaga, C.; Gowda, M.; Beyene, Y.; Murithi, W.T.; Burgueno, J.; Toledo, F.; Makumbi, D.; Olsen, M.S.; Das, B.; Suresh, L.M.; et al. Hybrid breeding for MLN resistance: Heterosis, combining ability, and hybrid prediction. Plants 2020, 9, 468. [Google Scholar] [CrossRef]
- Moreno-González, J.; Ares, J.A.; Ferro, R.A.; Ramírez, L.C. Genetic and statistical models for estimating genetic parameters of maize seedling resistance to Fusarium graminearum Schwabe root rot. Euphytica 2004, 137, 55–61. [Google Scholar] [CrossRef]
- Fan, X.M.; Zhang, Y.D.; Yao, W.H.; Bi, Y.Q.; Liu, L.; Chen, H.M.; Kang, M.S. Reciprocal diallel crosses impact combining ability, variance estimation, and heterotic group classification. Crop. Sci. 2014, 54, 89–97. [Google Scholar] [CrossRef]
- Galiano-Carneiro, A.L.; Kessel, B.; Presterl, T.; Gaikpa, D.S.; Maria Belen Kistner, M.B.; Miedaner, T. Multi-parent QTL mapping reveals stable QTL conferring resistance to Gibberella ear rot in maize. Euphytica 2021, 217, 2. [Google Scholar] [CrossRef]
- Ali, M.L.; Taylor, J.H.; Jie, L.; Sun, G.; William, M.K.; Kasha, J.; Reid, L.M.; Pauls, K.P. Molecular mapping of QTLs for resistance to Gibberella ear rot, in corn, caused by Fusarium graminearum. Genome 2005, 48, 521–533. [Google Scholar] [CrossRef]
- Martin, M.; Miedaner, T.; Schwegler, D.D.; Kessel, B.; Ouzunova, M.; Dhillon, B.S.; Schipprack, W.; Utz, H.F.; Melchinger, A.E. Comparative QTL mapping for Gibberella ear rot resistance and reduced deoxynivalenol contamination across connected maize populations. Crop. Sci. 2012, 52, 32–43. [Google Scholar] [CrossRef]
- Blanc, G.; Charcosset, A.; Mangin, B.; Gallais, A.; Moreau, L. Connected populations for detecting quantitative trait loci and testing for epistasis: An application in maize. Theor. Appl. Genet. 2006, 113, 206–224. [Google Scholar] [CrossRef] [PubMed]
- Gaikpa, D.S.; Kessel, B.; Presterl, T.; Ouzunova, M.; Galiano-Carneiro, A.L.; Mayer, M.; Melchinger, A.E.; Schön, C.C.; Miedaner, T. Exploiting genetic diversity in two European maize landraces for improving Gibberella ear rot resistance using genomic tools. Theor. Appl. Genet. 2021, 134, 793–805. [Google Scholar] [CrossRef]
- Mesterhazy, A. Relationship between resistance to stalk rot and ear rot of corn influenced by rind resistance, premature death, and the rate of drying of the ear. Maydica 1983, 28, 425–437. [Google Scholar]
- Mesterházy, Á.; Kovács, K. Breeding corn against fusarial stalk rot, ear rot and seedling blight. Acta Phytopath. Acad. Sci. Hung. 1986, 21, 231–249. [Google Scholar]
- Mesterházy, Á. Kukoricahibridek csõ- és szárfuzáriummal szembeni ellenállósága és mechanikai szilárdsága (Resistance of corn to stalk rot and ear rot and the mechanical strength of the stalk /English summary and captions/). Növénytermelés 1978, 37, 1–11. [Google Scholar]
- Mesterházy, Á.; Kovács, G., Jr.; Kovács, K. Breeding resistance for Fusarium ear rot (FER) in corn. 18th Int. Conference on maize and sorghum genetics and breeding, Eucarpia, Beograd. Acta Biologica Yugoslavia Serija F. Genetika 2000, 32, 495–505. [Google Scholar]
- Kadam, D.C.; Sarah, M.; Potts, S.M.; Bohn, M.O.; Lipka, A.E.; Lorenz, A.J. Genomic prediction of single crosses in the early stages of a maize hybrid breeding pipeline. G3 Genes/Genomes/Genet 2016, 6, 3443–3453. [Google Scholar] [CrossRef] [PubMed]
- Kovács, K.; Kovács, G.; Mesterházy, Á. Expression of resistance to fusarial ear blight in corn inbreds and their hybrids. Maydica 1994, 39, 187–190. [Google Scholar]
- Hung, H.-Y.; Holland, J.B. Diallel analysis of resistance to Fusarium ear rot and fumonisin contamination in maize. Crop. Sci. 2012, 52, 2173–2181. [Google Scholar] [CrossRef]
- Reid, L.M.; Mather, D.E.; Hamilton, R.I.; Bolton, A.T. Diallel analysis of resistance in maize to Fusarium graminearum infection via the silk. Can. J. Plant. Sci. 1992, 72, 915–923. [Google Scholar] [CrossRef]
- Kebede, A.Z.; Reid, L.M.; Zhu, X.; Wu, J.; Woldemariam, T.; Voloaca, C.; Xiang, K. Relationship between kernel drydown rate and resistance to Gibberella ear rot in maize. Euphytica 2015, 201, 79–88. [Google Scholar] [CrossRef]
- Kebede, A.Z.; Woldemariam, T.; Reid, L.M.; Harris, L.J. Quantitative trait loci mapping for Gibberella ear rot resistance and associated agronomic traits using genotyping-by-sequencing in maize. Theor. Appl. Genet. 2016, 129, 17–29. [Google Scholar] [CrossRef]
- Tembo, L.; Asea, G.; Gibson, P.T.; Okori, P. Resistance breeding strategy for Stenocarpella maydis and Fusarium graminearum cob rots in tropical maize. Plant. Breed. 2013, 132, 83–89. [Google Scholar] [CrossRef]
- Gxasheka, M.; Wang, J.; Tyasi, T.L.; Gao, J. Scientific understanding, and effects on ear rot diseases in maize production: A review. Int. J. Soil. Crop. Sci. 2015, 3, 77–84. [Google Scholar]
- Giorni, G.M.; Kreff, E.D.; Iglesias, J.; Fauguel, C.M.; Fernandez, M.; Silvina-Oviedo, M.; Presello, D.A. Quantitative trait loci for Fusarium and Gibberella ear rot resistance in Argentinian maize germplasm. Euphytica 2016, 211, 287–294. [Google Scholar] [CrossRef]
- Miedaner, T.; Bolduan, C.; Melchinger, A.E. Aggressiveness and mycotoxin production of eight isolates each of Fusarium graminearum and Fusarium verticillioides for ear rot on susceptible and resistant early maize inbred lines. Eur. J. Plant. Pathol. 2010, 127, 113–123. [Google Scholar] [CrossRef]
- Sobiech, A.; Tomkowiak, A.; Nowak, B.; Bocianowski, J.; Wolko, Ł.; Spychała, J. Associative and Physical Mapping of Markers Related to Fusarium in Maize Resistance, Obtained by Next-Generation Sequencing (NGS). Int. J. Mol. Sci. 2022, 23, 6105. [Google Scholar] [CrossRef] [PubMed]
- Loffler, M.; Kessel, B.; Ouzunova, M.; Miedaner, T. Covariation between line and testcross performance for reduced mycotoxin concentrations in European maize after silk channel inoculation of two Fusarium species. Theor. Appl. Genet. 2011, 122, 925–934. [Google Scholar] [CrossRef] [PubMed]
- Bolduan, C.; Miedaner, T.; Utz, H.F.; Dhillon, B.S.; Melchinger, A.E. Genetic variation in testcrosses and relationship between line per se and testcross performance for resistance to Gibberella ear rot. Crop. Sci. 2010, 50, 1691–1696. [Google Scholar] [CrossRef]
- Miedaner, T.; Han, S.; Kessel, B.; Ouzunova, M.; Schrag, T.; Utz, F.H.; Melchinger, A.E. Prediction of deoxynivalenol and zearalenone concentrations in Fusarium graminearum inoculated backcross populations of maize by symptom rating and near-infrared spectroscopy. Plant. Breed. 2015, 134, 529–534. [Google Scholar] [CrossRef]
- Szabó-Hevér, Á.; Lehoczki-Krsjak, S.; Varga, M.; Purnhauser, L.; Pauk, J.; Lantos, C.; Mesterházy, Á. Differential influence of QTL linked to Fusarium head blight, Fusarium-damaged kernel, deoxynivalenol contents and associated morphological traits in a Frontana-derived wheat population. Euphytica 2014, 200, 9–26. [Google Scholar] [CrossRef]
- Czembor, E.; Waskiewicz, A.; Piechota, U.; Puchta, M.; Czembor, J.H.; Stepien, Ł. Differences in ear rot resistance and Fusarium verticillioides-produced fumonisin contamination between Polish currently and historically used maize inbred lines. Front. Microbiol. 2019, 10, 449. [Google Scholar] [CrossRef]
- Miedaner, T.; Löffler, M.; Bolduan, C.; Kessel, B.; Ouzunova, M.; Mirdita, V.; Melchinger, A.B. Genetic variation for resistance and mycotoxin content of European maize inoculated with Fusarium graminearum and F. verticillioides. Cereal Res. Comm. 2008, 36, 46–48. [Google Scholar] [CrossRef]
- Robertson-Hoyt, L.A.; Kleinschmidt, C.E.; White, D.G.; Payne, G.A.; Maragos, C.M.; Holland, J.B. Relationships of resistance to Fusarium ear rot and fumonisin contamination with agronomic performance of maize. Crop. Sci. 2007, 47, 1770–1778. [Google Scholar] [CrossRef] [Green Version]
- Sutton, J.C. Epidemiology of wheat head blight and maize ear rot caused by Fusarium graminearum. Can. J. Plant. Path. 1982, 4, 195–209. [Google Scholar] [CrossRef]
- Toth, B.; Gyorgy, A.; Varga, M.; Mesterhazy, A. The influence of the dilution rate on the aggressiveness of inocula and the expression of resistance against Fusarium head blight in wheat. Plants 2020, 9, 943. [Google Scholar] [CrossRef]
- Young, H.C. The toothpick method of inoculating corn for ear and stalk rots. Phytopathology 1943, 33, 16. [Google Scholar]
- Christensen, C.M.; Kaufmann, H.H. Grain Storage, the Role of Fungi in Quality Loss; Library of Congress Catalog Card Number: 70-76174; University of Minnesota Press: Minneapolis, MN, USA, 1969; p. 153. [Google Scholar]
- Fu, D.; Xiao, M.; Hayward, A.; Fu, Y.; Liu, G.; Jiang, G.; Zhang, H. Utilization of crop heterosis: A review. Euphytica 2014, 197, 161–173. [Google Scholar] [CrossRef]
- Rehman, A.U.; Dang, T.; Qamar, S.; Ilyas, A.; Fatema, R.; Kafle, M.; Hussain, Z.; Masood, S.; Iqbal, S.; Shahzad, K. Revisiting plant heterosis—From field scaleto molecules. Genes 2021, 12, 1688. [Google Scholar] [CrossRef] [PubMed]
- Reid, L.M.; Hamilton, R.I.; Mather, D.E. Screening Maize for Resistance to Gibberella Ear Rot; Technical Bulletin Series; Research Branch Agriculture and Agri-Food Canada: Ottawa, ON, Canada, 1996; p. 62. [Google Scholar]
- Sváb, J. Biometriai Módszerek a Kutatásban (Methods for Biometrics in Research), 3rd ed.; Mezogazdasági Kiadó (Agr. Publ. House): Budapest, Hungary, 1981; p. 557. [Google Scholar]
- Weber, E. Grundriss der Biologischen Statistik. (Fundaments of the Biological Statistics); VEB Fisher Verlag: Jena, Germany, 1967; p. 1241. [Google Scholar]


| (A) Ear rot coverage caused by F. graminearum as a percentage, and resistance classification based on responses of inbreds to natural contamination | ||||||||||||
| Hybrid | Mother | Father | Mother Group | Hybrid Fact % | Mean of Group | Mother Fact | Father Fact | Mean of M + F | Mean of Group | Heterosis % | Mean Heteroses of Groups % | |
| Line | Line | Mean | % | % | % | % | ||||||
| G 1 | 28 | 37 | S. inbreds | 23.60 | 20.03 | 36.20 | 28.12 | 16.0 * | ||||
| G 2 | 38 | 16.88 | 20.03 | 11.11 | 15.57 | −8.4 | ||||||
| G 3 | 39 | 18.69 | 20.03 | 26.27 | 23.15 | 19.2 | ||||||
| G 4 | 29 | 37 | 23.43 | 26.47 | 36.20 | 31.34 | 25.2 | |||||
| G 5 | 38 | 16.72 | 26.47 | 11.11 | 18.79 | 11.0 | ||||||
| G 6 | 39 | 25.92 | 26.47 | 26.27 | 26.37 | 1.7 | ||||||
| G 7 | 30 | 37 | 17.67 | 35.22 | 36.20 | 35.71 | 50.5 | |||||
| G 8 | 38 | 25.70 | 35.22 | 11.11 | 23.17 | −10.9 | ||||||
| G 9 | 39 | 15.05 | 20.4 | 35.22 | 26.27 | 30.74 | 25.9 | 51.1 | 17.3 | |||
| G 10 | 31 | 37 | MR/MS inbreds | 19.70 | 17.18 | 36.20 | 26.69 | 26.2 | ||||
| G 11 | 38 | 14.57 | 17.18 | 11.11 | 14.15 | −3.0 | ||||||
| G 12 | 39 | 18.54 | 17.18 | 26.27 | 21.73 | 14.6 | ||||||
| G 13 | 32 | 37 | 36.78 | 17.49 | 36.20 | 26.85 | −37.0 | |||||
| G 14 | 38 | 22.23 | 17.49 | 11.11 | 14.30 | −55.4 | ||||||
| G 15 | 39 | 11.31 | 17.49 | 26.27 | 21.88 | 48.3 | ||||||
| G 16 | 33 | 37 | 19.67 | 21.62 | 36.20 | 28.91 | 32.0 | |||||
| G 17 | 38 | 11.15 | 21.62 | 11.11 | 16.36 | 31.9 | ||||||
| G 18 | 39 | 19.17 | 19.2 | 21.62 | 26.27 | 23.94 | 21.6 | 19.9 | 8.6 | |||
| G 19 | 34 | 37 | MR. Inbreds | 14.77 | 23.93 | 36.20 | 30.07 | 50.9 | ||||
| G 20 | 38 | 22.44 | 23.93 | 11.11 | 17.52 | −28.1 | ||||||
| G 21 | 39 | 10.58 | 23.93 | 26.27 | 25.10 | 57.9 | ||||||
| G 22 | 35 | 37 | 21.75 | 21.64 | 36.20 | 28.92 | 24.8 | |||||
| G 23 | 38 | 16.28 | 21.64 | 11.11 | 16.38 | 0.6 | ||||||
| G 24 | 39 | 19.25 | 21.64 | 26.27 | 23.96 | 19.6 | ||||||
| G 25 | 36 | 37 | 23.92 | 18.73 | 36.20 | 27.47 | 12.9 | |||||
| G 26 | 38 | 15.70 | 18.73 | 11.11 | 14.92 | −5.2 | ||||||
| G 27 | 39 | 23.24 | 18.66 | 18.73 | 26.27 | 22.50 | 22.98 | −3.3 | 14.4 | |||
| Mean | 19.44 | 19.4 | 22.48 | 24.53 | 23.50 | 23.5 | 13.44 | 13.4 | ||||
| LSD 5% | 5.64 | 1.90 | ||||||||||
| * Yellow highlighting: useful positive heterosis. | ||||||||||||
| (B) ANOVA | ||||||||||||
| Source of Var. | SS | df | MS | F | LSD 5% | |||||||
| Hybrid A | 25,196.97 | 44 | 572.7 | 8.67 | *** | 5.64 | ||||||
| Year B | 56,905.94 | 3 | 18,968.6 | 287.27 | *** | |||||||
| Isolates C | 39.19 | 1 | 39.2 | 0.59 | ns | |||||||
| A × B | 34,896.91 | 132 | 264.4 | 4.00 | *** | |||||||
| A × C | 3118.19 | 44 | 70.9 | 1.07 | ns | |||||||
| B × C | 2507.19 | 3 | 835.7 | 12.66 | *** | |||||||
| A × B × C | 9532.06 | 132 | 72.2 | 1.09 | ns | |||||||
| Within | 23.88 | 360 | 66.3 | |||||||||
| Total | 155,078.9 | 719 | ||||||||||
| *** p = 0.001, ns = not significant | ||||||||||||
| (C) Hybrid performance of the inheritance tests of GER depending on the performance of the inbreds of the mother and father inbreds. | ||||||||||||
| Inbred | Mother | G 28 | G 29 | G 30 | G 31 | G 32 | G 33 | G 34 | G 35 | G 36 | Mean | LSD |
| Father | per se | 20.03 | 26.47 | 35.22 | 17.18 | 17.49 | 21.62 | 23.93 | 21.64 | 18.73 | 22.48 | 5% |
| G 37 | 36.20 | 23.60 * | 23.43 | 17.67 | 19.70 | 36.78 | 19.67 | 14.77 | 21.75 | 23.92 | 22.37 | |
| G 38 | 11.11 | 16.88 | 16.72 | 25.70 | 14.57 | 22.23 | 11.15 | 22.44 | 16.28 | 15.70 | 17.96 | |
| G 39 | 26.27 | 18.69 | 25.92 | 15.05 | 18.54 | 11.31 | 19.17 | 10.58 | 19.25 | 23.24 | 17.97 | |
| Mean | 19.73 | 22.02 | 19.48 | 17.60 | 23.44 | 16.66 | 15.93 | 19.10 | 20.95 | 19.44 | 3.25 | |
| Mother group | 20.41 | 19.24 | 18.88 | 1.88 | ||||||||
| Father lines | 1.45 | |||||||||||
| * Yellow highlighting: strong difference between the resistance of the father line and the hybrid. | ||||||||||||
| (D) Means of the father and mother lines in the inheritance tests of GER depending on the performance of the inbreds of the mother and father lines. | ||||||||||||
| Inbred | Mother | G 28 | G 29 | G 30 | G 31 | G 32 | G 33 | G 34 | G 35 | G 36 | Mean | |
| Father | per se | 20.03 | 26.47 | 35.22 | 17.18 | 17.49 | 21.62 | 23.93 | 21.64 | 18.73 | 22.48 | |
| G 37 | 36.20 | 28.12 | 31.34 | 35.71 | 26.69 | 26.85 | 28.91 | 30.07 | 28.92 | 27.47 | 29.34 | |
| G 38 | 11.11 | 15.57 | 18.79 | 23.17 | 14.15 | 14.30 | 16.36 | 17.52 | 16.38 | 14.92 | 16.80 | |
| G 39 | 26.27 | 23.15 | 26.37 | 30.74 | 21.73 | 21.88 | 23.94 | 25.10 | 23.96 | 22.50 | 24.37 | |
| Mean | 22.28 | 25.50 | 29.87 | 20.86 | 21.01 | 23.07 | 24.23 | 23.09 | 21.63 | 23.50 | ||
| 25.88 | 21.65 | 22.98 | ||||||||||
| The hybrid performance and parental means often disagreed, especially in terms of the hybrid performance (Table 1C,D), bold data: means of hybrids across father lines. | ||||||||||||
| (A) Ear rot coverage caused by F. graminearum as a percentage, and resistance classification based on responses of inbreds to artificial inoculation | ||||||||||||
| Hybrid | Mother | Father | Mother Group | Hybrid Fact % | Mean of Group | Mother Fact | Father Fact | Mean of Parents | Mean of Group | Heterosis % | Mean of Heterosis % | Change of Heterosis |
| Line | Line | Mean | % | % | % | % | % | |||||
| G19 | 34 | 37 | S inbreds | 14.77 | 23.93 | 36.20 | 30.07 | 20.5 * | ||||
| G20 | 38 | 22.44 | 23.93 | 11.11 | 17.52 | 10.4 | ||||||
| G21 | 39 | 10.58 | 23.93 | 26.27 | 25.10 | 7.4 | ||||||
| G7 | 30 | 37 | 17.67 | 35.22 | 36.20 | 35.71 | −3.0 | |||||
| G8 | 38 | 25.70 | 35.22 | 11.11 | 23.17 | 4.0 | ||||||
| G9 | 39 | 15.05 | 35.22 | 26.27 | 30.74 | 63.2 | ||||||
| G4 | 29 | 37 | 23.43 | 26.47 | 36.20 | 31.34 | 25.2 | |||||
| G5 | 38 | 16.72 | 26.47 | 11.11 | 18.79 | 11.0 | ||||||
| G6 | 39 | 25.92 | 19.14 | 26.47 | 26.27 | 26.37 | 26.53 | 1.7 | 15.60 | 27.9 | ||
| G1 | 28 | 37 | MR/MS inbreds | 23.60 | 20.03 | 36.20 | 28.12 | 16.0 | ||||
| G2 | 38 | 16.88 | 20.03 | 11.11 | 15.57 | −8.4 | ||||||
| G3 | 39 | 18.69 | 20.03 | 26.27 | 23.15 | 19.2 | ||||||
| G16 | 33 | 37 | 19.67 | 21.62 | 36.20 | 28.91 | 32.0 | |||||
| G17 | 38 | 11.15 | 21.62 | 11.11 | 16.36 | 31.9 | ||||||
| G18 | 39 | 19.17 | 21.62 | 26.27 | 23.94 | 19.9 | ||||||
| G22 | 35 | 37 | 21.75 | 21.64 | 36.20 | 28.92 | 24.8 | |||||
| G23 | 38 | 16.28 | 21.64 | 11.11 | 16.38 | 0.6 | ||||||
| G24 | 39 | 19.25 | 18.5 | 21.64 | 26.27 | 23.95 | 22.8 | 19.6 | 17.3 | 18.9 | ||
| G10 | 31 | 37 | MR Inbreds | 19.70 | 17.18 | 36.20 | 26.69 | 26.2 | ||||
| G11 | 38 | 14.57 | 17.18 | 11.11 | 14.15 | −3.0 | ||||||
| G12 | 39 | 18.54 | 17.18 | 26.27 | 21.73 | 14.6 | ||||||
| G13 | 32 | 37 | 36.78 | 17.49 | 36.20 | 26.85 | −37.0 | |||||
| G14 | 38 | 22.23 | 17.49 | 11.11 | 14.30 | −55.4 | ||||||
| G15 | 39 | 11.31 | 17.49 | 26.27 | 21.88 | 48.3 | ||||||
| G25 | 36 | 37 | 23.92 | 18.73 | 36.20 | 27.47 | 12.9 | |||||
| G26 | 38 | 15.70 | 18.73 | 11.11 | 14.92 | −5.2 | ||||||
| yes | 39 | 23.24 | 20.7 | 18.73 | 26.27 | 22.50 | 21.2 | −3.3 | −0.2 | 2.4 | ||
| Mean | 19.44 | 6.9 | 5.93 | 8.18 | 7.06 | 7.1 | −0.07 | −0.1 | 0.8 | |||
| LSD 5% | 5.60 | 1.88 | 3.25 | 1.45 | ||||||||
| * Yellow highlighting: useful positive heterosis. | ||||||||||||
| (B) Hybrid resistance data (bold) from the GER inheritance study, with ear rot data as percentages. | ||||||||||||
| Inbred | Mother | G 34 | G 30 | G 29 | G 28 | G 33 | G 35 | G 31 | G 32 | G 36 | Mean | LSD 5% |
| Father | per se | 23.93 | 35.22 | 26.47 | 20.03 | 21.62 | 21.64 | 17.18 | 17.49 | 18.73 | 22.48 | |
| G 37 | 36.20 | 14.77 * | 17.67 | 23.43 ** | 23.60 | 19.67 | 21.75 | 19.70 | 36.78 | 23.92 | 22.37 | |
| G 38 | 11.11 | 22.44 | 25.70 | 16.72 | 16.88 | 11.15 | 16.28 | 14.57 | 22.23 | 15.70 | 17.96 | |
| G 39 | 26.27 | 10.58 | 15.05 | 25.92 | 18.69 | 19.17 | 19.25 | 18.54 | 11.31 | 23.24 | 17.97 | |
| Mean | 24.52 | 15.93 | 19.48 | 22.02 | 19.73 | 16.66 | 19.10 | 17.60 | 23.44 | 20.95 | 19.44 | 3.25 |
| Mean | Mother groups | 19.14 | 18.50 | 20.67 | 1.88 | |||||||
| * Yellow highlighting: unexpected hybrid reactions compared to the parental means (Table 2C), ** Expected hybrid data. | ||||||||||||
| (C) Hybrid resistance data (bold) from the GER inheritance study, parental means, with ear rot data as percentages. | ||||||||||||
| Inbred | Mother | G 34 | G 30 | G 29 | G 28 | G 33 | G 35 | G 31 | G 32 | G 36 | Mean | |
| Father | per se | 23.93 | 35.22 | 26.47 | 20.03 | 21.62 | 21.64 | 17.18 | 17.49 | 18.73 | 22.48 | |
| G 37 | 36.20 | 30.07 * | 35.71 | 31.34 | 28.12 | 28.91 | 28.92 | 26.69 | 26.85 | 27.47 | 29.34 | |
| G 38 | 11.11 | 17.52 | 23.17 | 18.79 | 15.57 | 16.36 | 16.38 | 14.15 | 14.30 | 14.92 | 16.80 | |
| G 39 | 26.27 | 25.10 | 30.74 | 26.37 | 23.15 | 23.94 | 23.96 | 21.73 | 21.88 | 22.50 | 24.37 | |
| Mean | 24.52 | 24.23 | 29.87 | 25.50 | 22.28 | 23.07 | 23.09 | 20.86 | 21.01 | 21.63 | 23.50 | |
| Group mean | 26.53 | 22.81 | 21.17 | |||||||||
| (A) DON data of the hybrids, mg/kg | ||||||||||||
| A/Hybrid | Mother | Father | Mother Group | Hybrid Fact % | Group Mean | Mother Fact % | Father Fact % | (M + F)/2 Mean | Group Mean | Heterosis % | Heterosis Mean | Heterosis Change |
| Inbred | Mean | % | % | % | % | % | ||||||
| G 19 | M34 | F37 | S inbreds | 55.50 | 39.80 | 87.87 | 63.84 | 13.1 * | ||||
| G 20 | F38 | 44.33 | 39.80 | 25.21 | 32.50 | −36.4 | ||||||
| G 21 | F39 | 43.24 | 39.80 | 69.08 | 54.44 | 20.6 | ||||||
| G 7 | M30 | F37 | 39.88 | 88.83 | 87.87 | 88.35 | 54.9 | |||||
| G 8 | F38 | 81.82 | 88.83 | 25.21 | 57.02 | −43.5 | ||||||
| G 9 | F39 | 37.85 | 88.83 | 69.08 | 78.96 | 52.1 | ||||||
| G 4 | M29 | F37 | 82.23 | 44.80 | 87.87 | 66.33 | −24.0 | |||||
| G 5 | F38 | 84.24 | 44.80 | 25.21 | 35.00 | −140.7 | ||||||
| G 6 | F39 | 61.17 | 58.9 | 44.80 | 69.08 | 56.94 | 59.3 | −7.4 | −12.4 | 0.67 | ||
| G 1 | M28 | F37 | MR/MS inbreds | 89.55 | 54.33 | 87.87 | 71.10 | −26.0 | ||||
| G 2 | F38 | 57.51 | 54.33 | 25.21 | 39.77 | −44.6 | ||||||
| G 3 | F39 | 105.62 | 54.33 | 69.08 | 61.70 | −71.2 | ||||||
| G 22 | M35 | F37 | 91.04 | 47.35 | 87.87 | 67.61 | −34.7 | |||||
| G 23 | F38 | 49.01 | 47.35 | 25.21 | 36.28 | −35.1 | ||||||
| G 24 | F39 | 54.82 | 47.35 | 69.08 | 58.22 | 5.8 | ||||||
| G 16 | M33 | F37 | 78.42 | 63.76 | 87.87 | 75.81 | −3.4 | |||||
| G 17 | F38 | 60.46 | 63.76 | 25.21 | 44.48 | −35.9 | ||||||
| G 18 | F39 | 70.27 | 73.0 | 63.76 | 69.08 | 66.42 | 57.9 | −5.8 | –27.9 | −26.08 | ||
| G 10 | M31 | F37 | MR inbreds | 59.77 | 34.75 | 87.87 | 61.31 | 2.5 | ||||
| G 11 | F38 | 70.31 | 34.75 | 25.21 | 29.98 | −134.5 | ||||||
| G 12 | F39 | 37.91 | 34.75 | 69.08 | 51.91 | 27.0 | ||||||
| G 13 | M32 | F37 | 114.42 | 26.24 | 87.87 | 57.06 | −100.5 | |||||
| G 14 | F38 | 76.66 | 26.24 | 25.21 | 25.73 | −198.0 | ||||||
| G 15 | F39 | 25.76 | 26.24 | 69.08 | 47.66 | 46.0 | ||||||
| G 25 | M36 | F37 | 28.66 | 66.18 | 87.87 | 77.03 | 62.8 | |||||
| G 26 | F38 | 62.68 | 66.18 | 25.21 | 45.69 | −37.2 | ||||||
| G 27 | F39 | 49.93 | 58.5 | 66.18 | 69.08 | 67.63 | 51.6 | 26.2 | –34.0 | −13.37 | ||
| Mean | 63.45 | 17.88 | 22.1 | 19.98 | −35.0 | |||||||
| LSD 5% | 45.12 | 4.72 | 45.12 | 45.12 | ||||||||
| * Yellow highlighting: useful positive heterosis. | ||||||||||||
| (B) Hybrid resistance data (bold) from the GER inheritance study and DON data (mg/kg), grouped by the father lines, original data. | ||||||||||||
| Inbreds | Mother | G 34 | G 30 | G 29 | G 28 | G 35 | G 33 | G 31 | G 32 | G 36 | Mean | |
| Father | per se | 39.80 | 88.78 | 44.80 | 54.33 | 47.35 | 63.76 | 34.75 | 26.24 | 66.18 | 51.78 | |
| G 37 | 87.87 | 55.50 | 39.88 * | 82.23 ** | 89.55 | 91.04 | 78.42 | 59.77 | 114.42 | 28.66 | 71.05 | |
| G 38 | 25.21 | 44.33 | 81.82 | 84.24 | 57.51 | 49.01 | 60.46 | 70.31 | 76.66 | 62.68 | 65.22 | |
| G 39 | 69.08 | 43.24 | 37.85 | 61.17 | 105.62 | 54.82 | 70.27 | 37.91 | 25.76 | 41.25 | 53.10 | |
| Mean | 60.72 | 47.69 | 53.19 | 75.88 | 84.22 | 64.95 | 69.72 | 55.99 | 72.28 | 44.19 | 63.12 | |
| LSD 5% F | 58.92 | 72.97 | 57.49 | 15.04 | ||||||||
| LSD 5% M | 21.26 | |||||||||||
| * Yellow highlighting: extra high contamination in G38 hybrids. ** Bold: hybrid data. | ||||||||||||
| (C) Hybrid resistance data (bold) as parental means from the GER inheritance study and DON (mg/kg), grouped by the father lines. | ||||||||||||
| Inbreds | Mother | G34 | G 30 | G 29 | G 28 | G 35 | G 33 | G 31 | G 32 | G 36 | Mean | |
| Father | per se | 39.8 | 88.78 | 44.8 | 54.33 | 47.35 | 63.76 | 34.75 | 26.24 | 66.18 | 51.78 | |
| G 37 | 87.87 | 63.84 * | 88.35 | 66.33 | 71.10 | 67.61 | 75.81 | 61.31 | 57.06 | 77.03 | 69.83 | |
| G 38 | 25.21 | 32.50 | 57.02 | 35.00 | 39.77 | 36.28 | 44.48 | 29.98 | 25.73 | 45.69 | 38.50 | |
| G 39 | 69.08 | 54.44 | 78.96 | 56.94 | 61.70 | 58.22 | 66.42 | 51.91 | 47.66 | 67.63 | 60.43 | |
| Mean | 60.72 | 50.26 | 74.78 | 52.76 | 57.52 | 54.04 | 62.24 | 47.73 | 43.48 | 63.45 | 56.25 | |
| * Bold: Hybrid data. | ||||||||||||
| (D) ANOVA. | ||||||||||||
| Source of Var. | SS | df | MS | F | p-Value | F Crit. | ||||||
| Years | 735,158.4 | 3 | 245,052.8 | 133.30 | 1.68 × 10−45 | 2.65 | ||||||
| Hybrids | 166,584.7 | 44 | 3786.0 | 2.06 | 0.000503 | 1.44 | ||||||
| Interaction | 367,728.5 | 132 | 2785.8 | 1.52 | 0.004836 | 1.30 | ||||||
| Within | 330,909.7 | 180 | 1838.4 | |||||||||
| Total | 1,600,381.4 | 359 | ||||||||||
| (A) DON data (mg/kg) of the hybrids, with means for the eight independent data sets. | ||||||||||||
| Hybrid | Mother | Father | Mother Group | Hybrid Rate * | Mean of Group | Mother Rate | Father Fact Rate | (M + F)/2 | Mean of Group | Heterosis | Heterosis Group | Heterosis Change |
| Inbred | S inbreds | mean | Inbred | % | % | % | % | % | ||||
| G 25 | 34 | 37 | 3.15 | 10.14 | 1.71 | 5.93 | 46.9 ** | |||||
| G 26 | 38 | 0.88 | 10.14 | 2.41 | 6.27 | 85.9 | ||||||
| G 27 | 39 | 4.52 | 10.14 | 1.55 | 5.85 | 22.6 | ||||||
| G 13 | 30 | 37 | 1.00 | 1.28 | 1.71 | 1.49 | 33.0 | |||||
| G 14 | 38 | 1.47 | 1.28 | 2.41 | 1.84 | 20.0 | ||||||
| G 15 | 39 | 1.47 | 1.28 | 1.55 | 1.41 | −3.9 | ||||||
| G 4 | 29 | 37 | 1.90 | 0.83 | 1.71 | 1.27 | −49.3 | |||||
| 38 | 2.39 | 0.83 | 2.41 | 1.62 | −47.3 | |||||||
| G 6 | 39 | 1.15 | 1.99 | 0.83 | 1.55 | 1.19 | 2.99 | 3.8 | 12.4 | 33.3 | ||
| G 10 | 28 | 37 | MS/MR inbreds | 1.76 | 1.44 | 1.71 | 1.58 | −11.3 | ||||
| G 11 | 38 | 2.85 | 1.44 | 2.41 | 1.92 | −48.0 | ||||||
| G 12 | 39 | 2.83 | 1.44 | 1.55 | 1.50 | −89.2 | ||||||
| G 16 | 35 | 37 | 2.08 | 0.97 | 1.71 | 1.34 | −55.3 | |||||
| G 17 | 38 | 1.54 | 0.97 | 2.41 | 1.69 | 8.9 | ||||||
| G 18 | 39 | 1.16 | 0.97 | 1.55 | 1.26 | 7.8 | ||||||
| G 22 | 33 | 37 | 2.20 | 1.72 | 1.71 | 1.72 | −28.0 | |||||
| G 23 | 38 | 3.50 | 1.72 | 2.41 | 2.06 | −69.5 | ||||||
| G 24 | 39 | 1.99 | 2.21 | 1.72 | 1.55 | 1.64 | 1.63 | −21.5 | −34.0 | −35.3 | ||
| G 19 | 31 | 37 | MR inbreds | 1.48 | 1.23 | 1.71 | 1.47 | −0.3 | ||||
| G 20 | 38 | 2.77 | 1.23 | 2.41 | 1.82 | −52.3 | ||||||
| G 21 | 39 | 1.05 | 1.23 | 1.55 | 1.39 | 24.7 | ||||||
| G 1 | 32 | 37 | 1.57 | 0.56 | 1.71 | 1.14 | −37.8 | |||||
| G 2 | 38 | 2.18 | 0.56 | 2.41 | 1.48 | −46.7 | ||||||
| G 3 | 39 | 3.43 | 0.56 | 1.55 | 1.06 | −224.7 | ||||||
| G 7 | 36 | 37 | 0.80 | 1.31 | 1.71 | 1.51 | 46.8 | |||||
| G 8 | 38 | 2.04 | 1.31 | 2.41 | 1.86 | −9.5 | ||||||
| G 9 | 39 | 1.94 | 1.92 | 1.31 | 1.55 | 1.43 | 1.46 | −35.8 | −37.3 | −31.1 | ||
| Mean | 2.04 | 2.16 | 1.89 | 2.03 | −19.6 | |||||||
| LSD 5% | 1.84 | 0.61 | 1.84 | 1.84 | ||||||||
| * Rate: DON mg/kg/GER%, mean for eight rates. ** Yellow highlighting: useful heterosis. | ||||||||||||
| (B) Hybrid resistance data (bold) from the GER inheritance study, with DON data (mg/kg) for a percentage of visual infection. | ||||||||||||
| Inbred | Mother | G 34 | G 30 | G 29 | G 28 | G 33 | G 35 | G 31 | G 32 | G 36 | Mean | LSD 5% |
| Father | per se | 10.14 | 1.28 | 0.83 | 1.44 | 0.97 | 1.72 | 1.23 | 0.56 | 1.31 | 2.16 | |
| G 37 | 1.71 | 3.15 | 1.00 | 1.90 | 1.76 | 2.08 | 2.20 | 1.48 | 1.57 | 0.80 | 1.77 | |
| G 38 | 2.41 | 0.88 | 1.47 | 2.39 | 2.85 | 1.54 | 3.50 | 2.77 | 2.18 | 2.04 | 2.18 | |
| G 39 | 1.55 | 4.52 | 1.47 | 1.15 | 2.83 | 1.16 | 1.99 | 1.05 | 3.43 | 1.94 | 2.17 | |
| Mean | 1.89 | 2.85 | 1.31 | 1.81 | 2.48 | 1.59 | 2.56 | 1.77 | 2.39 | 1.59 | 2.04 | 1.84 |
| Father group | 1.99 | 2.21 | 1.92 | ns | ||||||||
| (C) Parental means of hybrid resistance data (bold) from the GER inheritance study, with DON data as mg/kg for a percentage of visual infection. | ||||||||||||
| Inbred | Mother | G 34 | G 30 | G 29 | G 28 | G 33 | G 35 | G 31 | G 32 | G 36 | Mean | |
| Father | per se | 10.14 | 1.28 | 0.83 | 1.44 | 0.97 | 1.72 | 1.23 | 0.56 | 1.31 | 2.16 | |
| G 37 | 1.71 | 5.93 | 1.49 | 1.27 | 1.58 | 1.34 | 1.72 | 1.47 | 1.14 | 1.51 | 1.94 | |
| G 38 | 2.41 | 6.27 | 1.84 | 1.62 | 1.92 | 1.69 | 2.06 | 1.82 | 1.48 | 1.86 | 2.29 | |
| G 39 | 1.55 | 5.85 | 1.41 | 1.19 | 1.50 | 1.26 | 1.64 | 1.39 | 1.06 | 1.43 | 1.86 | |
| Mean | 1.89 | 6.02 | 1.58 | 1.36 | 1.67 | 1.43 | 1.81 | 1.56 | 1.23 | 1.60 | 2.03 | |
| Mean | 2.99 | 1.63 | 1.46 | |||||||||
| (D) ANOVA | ||||||||||||
| Source of variance | SS | df | MS | F | p-Value | F Crit. | LSD 5% | |||||
| Year | 319.77 | 3 | 106.59 | 30.12 | 7.94 × 10⁻¹⁶ | 2.65 | 0.39 | |||||
| Genotypes | 834.61 | 44 | 18.97 | 5.36 | 3.55 × 10⁻¹⁶ | 1.44 | 1.30 | |||||
| Interaction | 3003.09 | 132 | 22.75 | 6.43 | 1.29 × 10⁻²⁹ | 1.30 | 2.60 | |||||
| Within | 637.09 | 180 | 3.54 | |||||||||
| Total | 4794.57 | 359 | ||||||||||
| All are significant at p = 0.001 or higher. SS = sum of squares, df = degree of freedom, F = F value, F crit. critical level for LSD 5%, LSD = least significant difference | ||||||||||||
| Hybrid | Mother | Father | Mother Res. | Heterosis for Traits | |||
|---|---|---|---|---|---|---|---|
| group | GER% | DON (mg/kg) | DON% M/M | DON%, 8 Repl. | |||
| G19 | 34 | 37 | S inbreds | 20.45 | 13.06 | –83.83 | 46.87 |
| G20 | 38 | 10.40 | −36.38 | −3.43 | 85.90 | ||
| G21 | 39 | 7.39 | 20.57 | −90.58 | 22.59 | ||
| G7 | 30 | 37 | −2.99 | 54.86 | −70.51 | 32.99 | |
| G8 | 38 | 4.04 | −43.50 | −311.44 | 19.97 | ||
| G9 | 39 | 63.20 | 52.06 | −72.76 | −3.91 | ||
| G4 | 29 | 37 | 25.24 | −23.96 | −119.63 | −49.31 | |
| G5 | 38 | 10.99 | −140.66 | −77.21 | −47.26 | ||
| G6 | 39 | 1.69 | −7.43 | 2.32 | 3.81 | ||
| G1 | 28 | 37 | MS/MR inbreds | 16.05 | −25.96 | −47.71 | −11.35 |
| G2 | 38 | −8.43 | −44.61 | −42.10 | −48.04 | ||
| G3 | 39 | 19.24 | −71.17 | −118.93 | −89.25 | ||
| G16 | 33 | 37 | 31.98 | −3.43 | −48.32 | −27.98 | |
| G17 | 38 | 31.86 | −35.91 | −107.82 | −69.45 | ||
| G18 | 39 | 19.93 | −5.80 | −31.40 | −21.47 | ||
| G22 | 35 | 37 | 24.79 | −34.65 | −78.96 | −55.30 | |
| G23 | 38 | 0.56 | −35.08 | −33.19 | 8.89 | ||
| G24 | 39 | 19.62 | 5.84 | −16.68 | 7.81 | ||
| G10 | 31 | 37 | MR/R inbreds | 26.20 | 2.52 | −132.42 | −0.33 |
| G11 | 38 | −2.96 | −134.53 | −125.08 | −52.33 | ||
| G12 | 39 | 14.64 | 26.98 | 9.01 | 24.71 | ||
| G13 | 32 | 37 | −37.00 | −100.53 | −85.26 | −37.82 | |
| G14 | 38 | −55.43 | −197.97 | −80.13 | −46.66 | ||
| G15 | 39 | 48.30 | 45.96 | −8.68 | −224.70 | ||
| G25 | 36 | 37 | 12.92 | 62.80 | 59.78 | 46.80 | |
| G26 | 38 | −5.22 | −37.16 | −37.69 | −9.46 | ||
| G27 | 39 | −3.31 | 26.18 | 42.38 | −35.77 | ||
| Mean | 10.89 | −24.74 | −63.34 | −19.63 | |||
| Traits | GER% | DON (mg/kg) | DON% Mean | ||||
| DON (mg/kg) | 0.6086 ** | ||||||
| DON% Mean | 0.0760 | 0.3597 | |||||
| DONH% M/M | −0.1083 | 0.2063 | 0.0516 | ||||
| Hybrids | Traits | |||
|---|---|---|---|---|
| GER % | DON mg/kg | DON/% repl | DON% M/M | |
| G1 | 23.60 | 89.55 | 1.76 | 3.79 |
| G2 | 16.26 | 57.51 | 2.85 | 3.54 |
| G3 | 18.07 | 105.62 | 2.83 | 5.85 |
| G4 | 23.43 | 82.23 | 1.90 | 3.51 |
| G5 | 16.72 | 84.24 | 2.39 | 5.04 |
| G6 | 25.30 | 61.17 | 1.15 | 2.42 |
| G7 | 17.67 | 39.88 | 1.00 | 2.26 |
| G8 | 25.70 | 81.82 | 1.47 | 3.18 |
| G9 | 15.05 | 37.85 | 1.47 | 2.52 |
| G10 | 19.70 | 59.77 | 1.48 | 3.03 |
| G11 | 14.57 | 70.31 | 2.77 | 4.83 |
| G12 | 17.92 | 37.91 | 1.05 | 2.12 |
| G13 | 36.78 | 114.42 | 1.57 | 3.11 |
| G14 | 22.23 | 76.66 | 2.18 | 3.45 |
| G15 | 11.31 | 25.76 | 3.43 | 2.28 |
| G16 | 19.67 | 78.42 | 2.20 | 3.99 |
| G17 | 11.15 | 60.46 | 3.50 | 5.42 |
| G18 | 19.17 | 70.27 | 1.99 | 3.67 |
| G19 | 14.77 | 55.50 | 3.15 | 3.76 |
| G20 | 21.82 | 44.33 | 0.88 | 2.03 |
| G21 | 10.58 | 43.24 | 4.52 | 4.09 |
| G22 | 21.75 | 91.04 | 2.08 | 4.18 |
| G23 | 16.28 | 49.01 | 1.54 | 3.01 |
| G24 | 19.25 | 54.82 | 1.16 | 2.85 |
| G25 | 23.92 | 28.66 | 0.80 | 1.20 |
| G26 | 15.70 | 62.68 | 2.04 | 3.99 |
| G27 | 23.24 | 49.93 | 1.94 | 2.15 |
| GKT3275 chseck | 18.05 | 68.69 | 2.41 | 3.81 |
| GKT 414 chseck | 17.02 | 61.58 | 1.55 | 3.62 |
| P0216 chseck | 14.17 | 38.58 | 1.56 | 2.72 |
| Sarolta chseck | 18.93 | 44.81 | 1.56 | 2.37 |
| GKT 376 chseck | 14.49 | 49.02 | 1.97 | 3.38 |
| Csanád chseck | 22.29 | 87.60 | 2.37 | 3.93 |
| Mean | 18.99 | 62.52 | 2.02 | 3.37 |
| GER% | DON (mg/kg) | DON/% repl. | ||
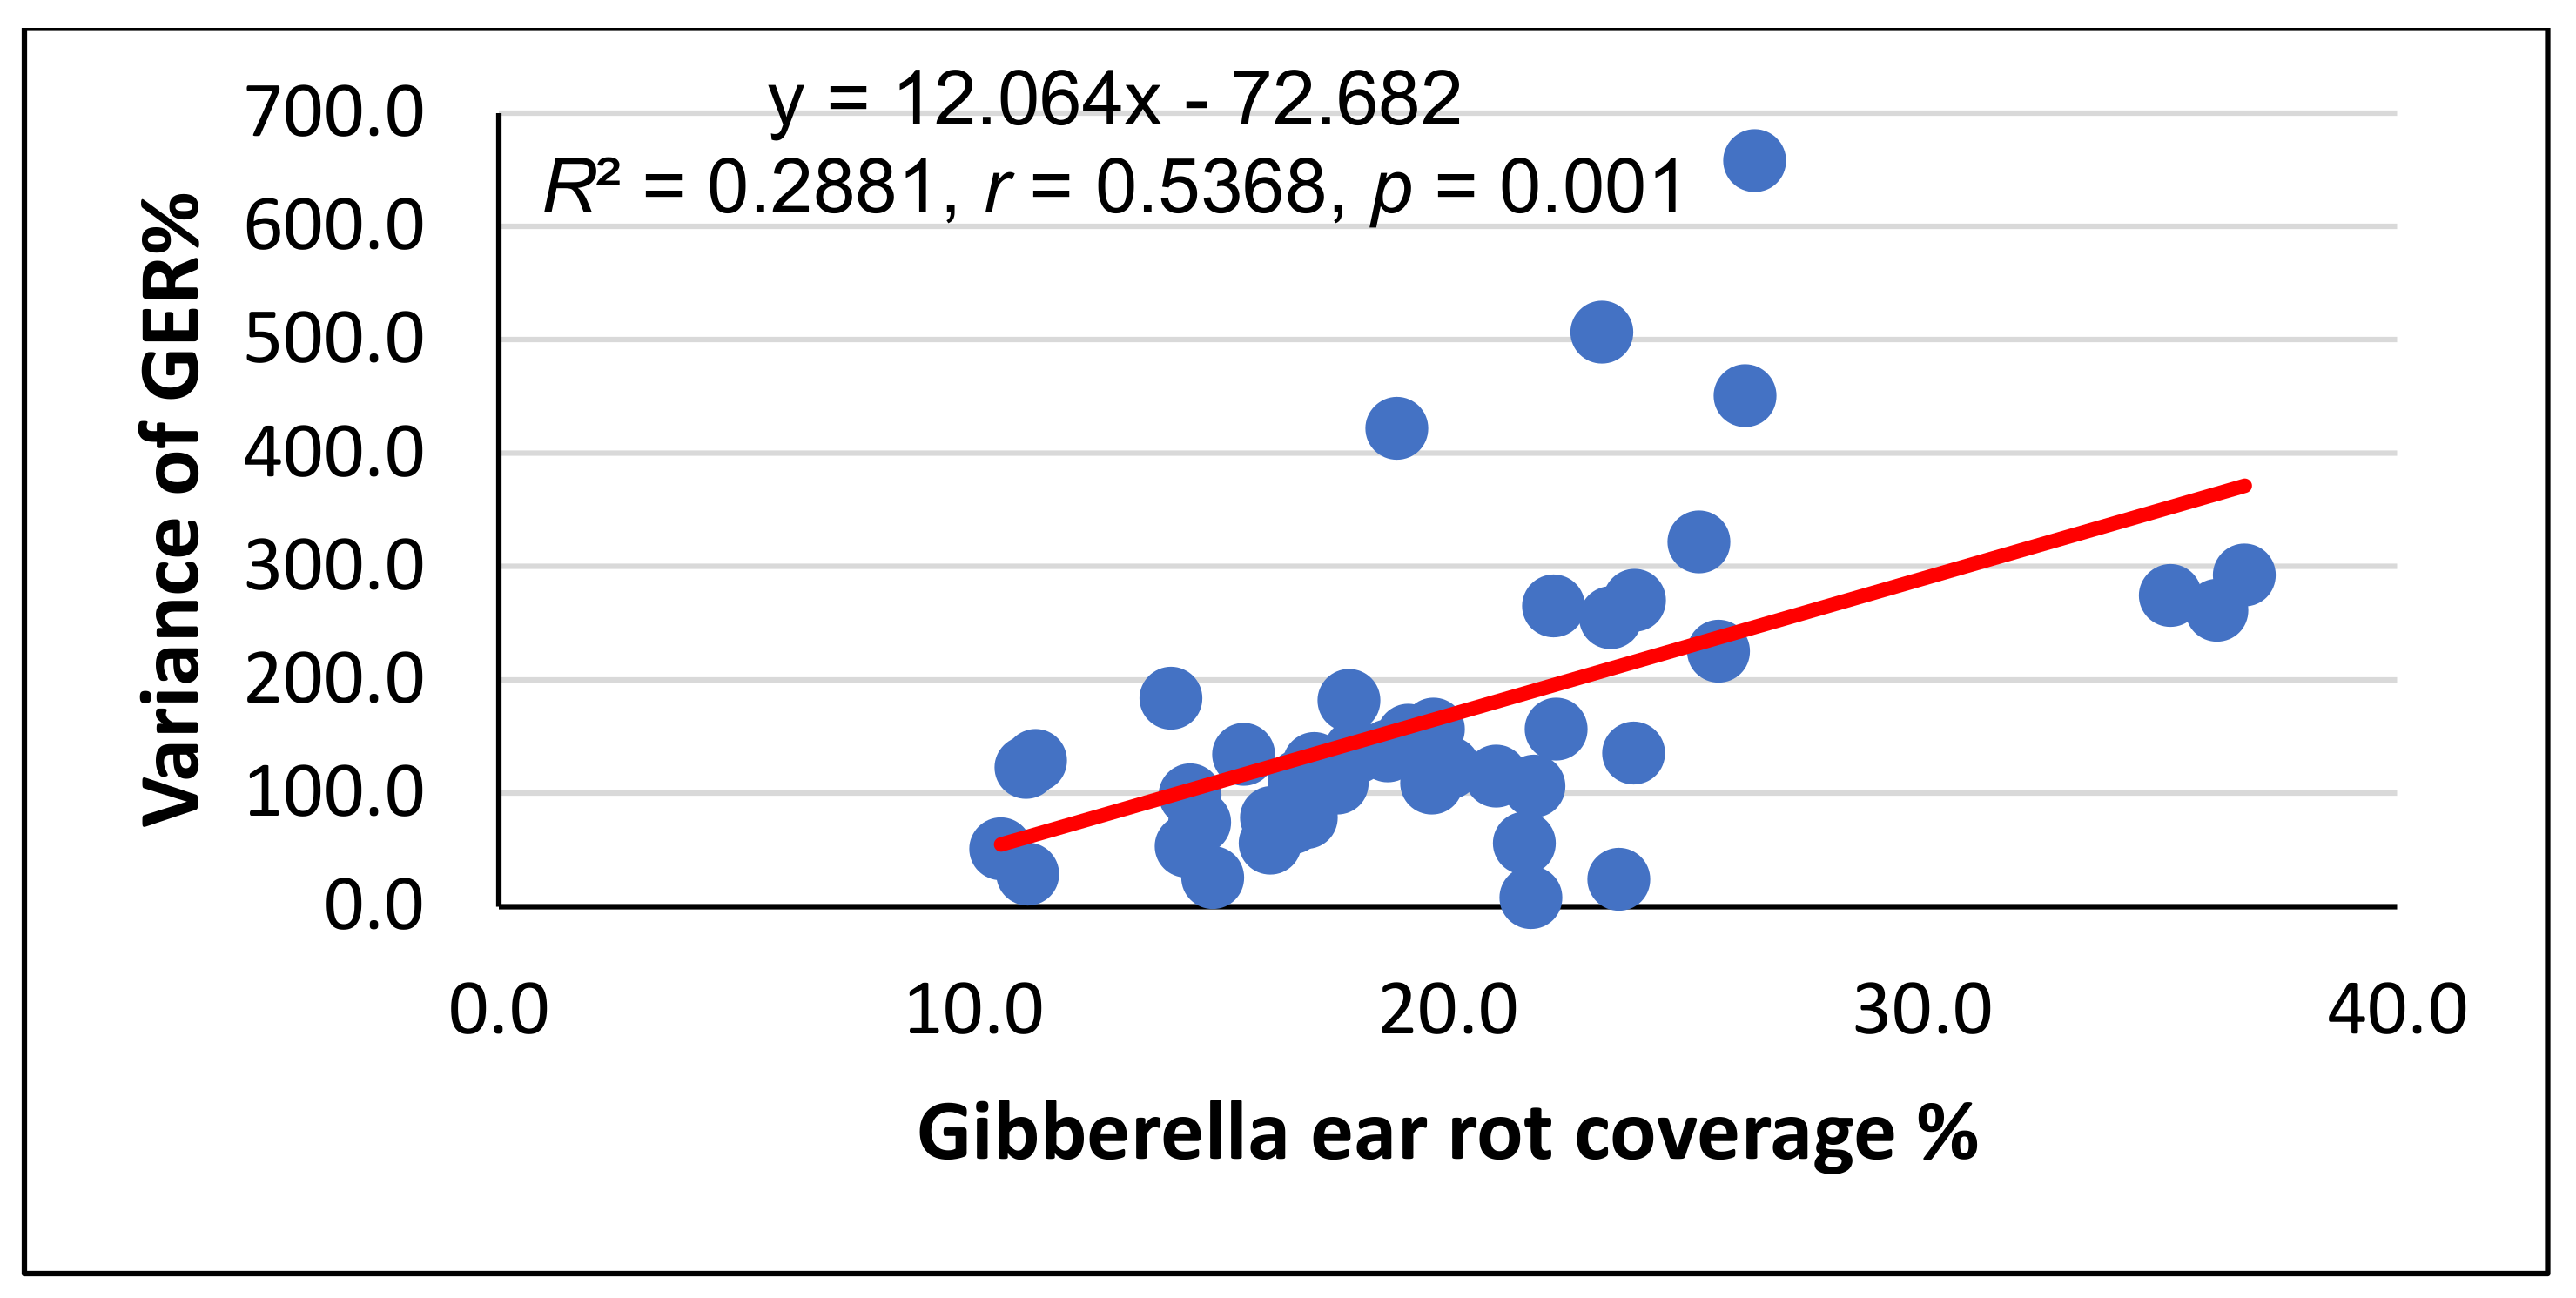
| DON (mg/kg) | 0.5433 ** | |||
| DON/% | −0.5345 *** | 0.1155 | ||
| DON% Mean | −0.26825 | 0.6405 *** | 0.6370 *** | |
| GER% | Trait | Hybrid | Mother | Father | (M + F)/2 |
|---|---|---|---|---|---|
| Mother | −0.0131 | ||||
| Father | 0.3051 | 0.0046 | |||
| (M + F)/2 | 0.2652 | 0.4582 ** | 0.8909 **** | ||
| Heterosis | −0.5938 *** | 0.3089 | 0.4916 *** | 0.5773 *** | |
| DON (mg/kg) | Trait | Hybrid | Mother | Father | (M + F)/2 |
| Mother | −0.1374 | ||||
| Father | 0.0372 | 0.0001 | |||
| (M+F)/2 | −0.0467 | 0.5633 *** | 0.8262 **** | ||
| Heterosis | −0.6572 **** | 0.4038 * | 0.5608 *** | 0.6908 **** | |
| DON% | Trait | Hybrid | Mother | Father | (M + F)/2 |
| Mother | −0.1484 | ||||
| Father | −0.3147 | −0.0001 | |||
| (M + F)/2 | −0.2165 | 0.9734 **** | 0.2289 | ||
| Heterosis | −0.9517 **** | 0.3929 * | 0.3516 | 0.4630 ** |
| Mean Temperature °C | ||||||
| June | July | August | September | October | Mean | |
| 2017 | 23.1 | 23.3 | 24.2 | 18.1 | 12.5 | 20.22 |
| 2018 | 21.6 | 23.6 | 24.6 | 18.9 | 14.3 | 20.6 |
| 2019 | 23.8 | 22.5 | 24.5 | 18.6 | 14.0 | 20.7 |
| 2020 | 21.6 | 22.3 | 23.7 | 19.3 | 12.8 | 19.9 |
| Precipitation mm | ||||||
| June | July | August | September | October | Sum | |
| 2017 | 49.4 | 45.4 | 18.8 | 36.1 | 35.4 | 185.1. |
| 2018 | 116.3 | 65.6 | 59.1 | 37.8 | 10.4 | 289.2 |
| 2019 | 111.3 | 47.8 | 23.3 | 30.5 | 27.1 | 240.1 |
| 2020 | 113.6 | 117.1 | 59.9 | 24.9 | 92.3 | 407.8 |
Publisher’s Note: MDPI stays neutral with regard to jurisdictional claims in published maps and institutional affiliations. |
© 2022 by the authors. Licensee MDPI, Basel, Switzerland. This article is an open access article distributed under the terms and conditions of the Creative Commons Attribution (CC BY) license (https://creativecommons.org/licenses/by/4.0/).
Share and Cite
Mesterhazy, A.; Szabó, B.; Szél, S.; Nagy, Z.; Berényi, A.; Tóth, B. Novel Insights into the Inheritance of Gibberella Ear Rot (GER), Deoxynivalenol (DON) Accumulation, and DON Production. Toxins 2022, 14, 583. https://doi.org/10.3390/toxins14090583
Mesterhazy A, Szabó B, Szél S, Nagy Z, Berényi A, Tóth B. Novel Insights into the Inheritance of Gibberella Ear Rot (GER), Deoxynivalenol (DON) Accumulation, and DON Production. Toxins. 2022; 14(9):583. https://doi.org/10.3390/toxins14090583
Chicago/Turabian StyleMesterhazy, Akos, Balázs Szabó, Sándor Szél, Zoltán Nagy, Attila Berényi, and Beata Tóth. 2022. "Novel Insights into the Inheritance of Gibberella Ear Rot (GER), Deoxynivalenol (DON) Accumulation, and DON Production" Toxins 14, no. 9: 583. https://doi.org/10.3390/toxins14090583