Article

Multiplexed Host-Induced Gene Silencing of Aspergillus flavus Genes Confers Aflatoxin Resistance in Groundnut

by
Kalyani Prasad
1,†,
Kalenahalli Yogendra
1,†,
Hemalatha Sanivarapu
1,
Kanniah Rajasekaran
2,
Jeffrey W. Cary
2,
Kiran K. Sharma
3,* and
Pooja Bhatnagar-Mathur
4,*
1
International Crops Research Institute for the Semi-Arid Tropics (ICRISAT), Hyderabad 502324, India
2
Southern Regional Research Center, Agricultural Research Service, United States Department of Agriculture (USDA/ARS), New Orleans, LA 70124, USA
3
Sustainable Agriculture Program, The Energy and Resources Institute (TERI), India Habitat Center, New Delhi 110003, India
4
International Maize and Wheat Improvement Center (CIMMYT), El Batán, Texcoco 56237, Mexico
*
Authors to whom correspondence should be addressed.
These authors contributed equally to this work.
Toxins 2023, 15(5), 319; https://doi.org/10.3390/toxins15050319
Submission received: 27 March 2023 / Revised: 18 April 2023 / Accepted: 23 April 2023 / Published: 5 May 2023
(This article belongs to the Section Mycotoxins)

Abstract

:
Aflatoxins are immunosuppressive and carcinogenic secondary metabolites, produced by the filamentous ascomycete Aspergillus flavus, that are hazardous to animal and human health. In this study, we show that multiplexed host-induced gene silencing (HIGS) of Aspergillus flavus genes essential for fungal sporulation and aflatoxin production (nsdC, veA, aflR, and aflM) confers enhanced resistance to Aspergillus infection and aflatoxin contamination in groundnut (<20 ppb). Comparative proteomic analysis of contrasting groundnut genotypes (WT and near-isogenic HIGS lines) supported a better understanding of the molecular processes underlying the induced resistance and identified several groundnut metabolites that might play a significant role in resistance to Aspergillus infection and aflatoxin contamination. Fungal differentiation and pathogenicity proteins, including calmodulin, transcriptional activator-HacA, kynurenine 3-monooxygenase 2, VeA, VelC, and several aflatoxin pathway biosynthetic enzymes, were downregulated in Aspergillus infecting the HIGS lines. Additionally, in the resistant HIGS lines, a number of host resistance proteins associated with fatty acid metabolism were strongly induced, including phosphatidylinositol phosphate kinase, lysophosphatidic acyltransferase-5, palmitoyl-monogalactosyldiacylglycerol Δ-7 desaturase, ceramide kinase-related protein, sphingolipid Δ-8 desaturase, and phospholipase-D. Combined, this knowledge can be used for groundnut pre-breeding and breeding programs to provide a safe and secure food supply.
Key Contribution: Multiplexed HIGS confers enhanced resistance to Aspergillus infection and reduces aflatoxin contamination in groundnut to safer levels (<20 ppb). Proteome profiling unravels molecular processes underlying induced resistance to Aspergillus flavus.

1. Introduction

Aspergillus flavus is a ubiquitous saprophytic fungus that infects maize, groundnut, cotton, chilies, and several nuts and seed crops [1,2]. Infection by A. flavus leads to the production of carcinogenic secondary metabolites, including polyketide-derived aflatoxins [3], that are serious health hazards to humans and animals, leading to an annual loss of over USD 932 million globally [3,4]. Groundnut (Arachis hypogaea L.) is highly vulnerable to Aspergillus invasion and aflatoxin contamination, which not only poses a health hazard, but also hampers international trade [5,6]. Despite numerous breeding efforts, lack of the resistance germplasm has been a limiting factor in achieving significant progress so far [7].
The emergence of biotechnological methods offers a novel and environmentally safe approach to obtaining aflatoxin-resistant groundnuts [8,9]. Based on the understanding of molecular patterns underlying plant–A. flavus interactions, host-induced gene silencing (HIGS) has proven to be an effective approach due to enhanced trait durability, as the host plant acts as a delivery system to induce gene silencing in A. flavus [9,10]. Recent studies have discovered the genes involved in each step of the aflatoxin biosynthetic pathway [11,12]. Targeted downregulation of the aflatoxin biosynthetic genes aflR [13], aflM [14], and aflC [10] in maize and aflM and aflP [9] and five RNAi genes, aflR, aflS, aflC, pes1, and aflep [8,15], in groundnut can provide considerable success in developing aflatoxin-resistant genotypes. Moreover, aflatoxin biosynthetic pathway genes and silencing of Aspergillus genes, including alkaline protease (alk) [16] and alpha-amylase (amy1) [17], have been reported in maize.
Here, we describe an improved host-induced gene silencing strategy in groundnut to simultaneously control fungal infection and aflatoxin contamination by multiplexed silencing of four A. flavus genes, such as nsdC [18] and veA [19], involved in fungal developmental processes, including conidiophore biogenesis, sclerotial production, and aflatoxin production—aflR [20] transcriptional regulation of aflatoxin production and aflM (Ver1) [21], an aflatoxin biosynthetic pathway clustered gene that converts Versicolorin A (VERA) to Demethylsterigmatocystin (DMST). We were able to obtain groundnut transformants that had significantly lower A. flavus infection, while showing an enhanced reduction in aflatoxin contamination within safer levels. Furthermore, to develop effective control strategies for aflatoxin resistance, we used liquid chromatography coupled with hybrid mass spectrometry (LC-MS/MS)-based non-target proteomics of two contrasting groundnut lines (resistant HIGS and susceptible wild type (WT)) infected by A. flavus to better understand the underlying resistance mechanism to fungal infection and aflatoxin contamination at the molecular level. The findings provide significant insights that enable comparison of both genotypic and time points of post-harvest groundnut–A. flavus interaction and unravel the mechanisms that provide resistance and possibly susceptibility in HIGS lines expressing the four RNAi genes.

2. Results

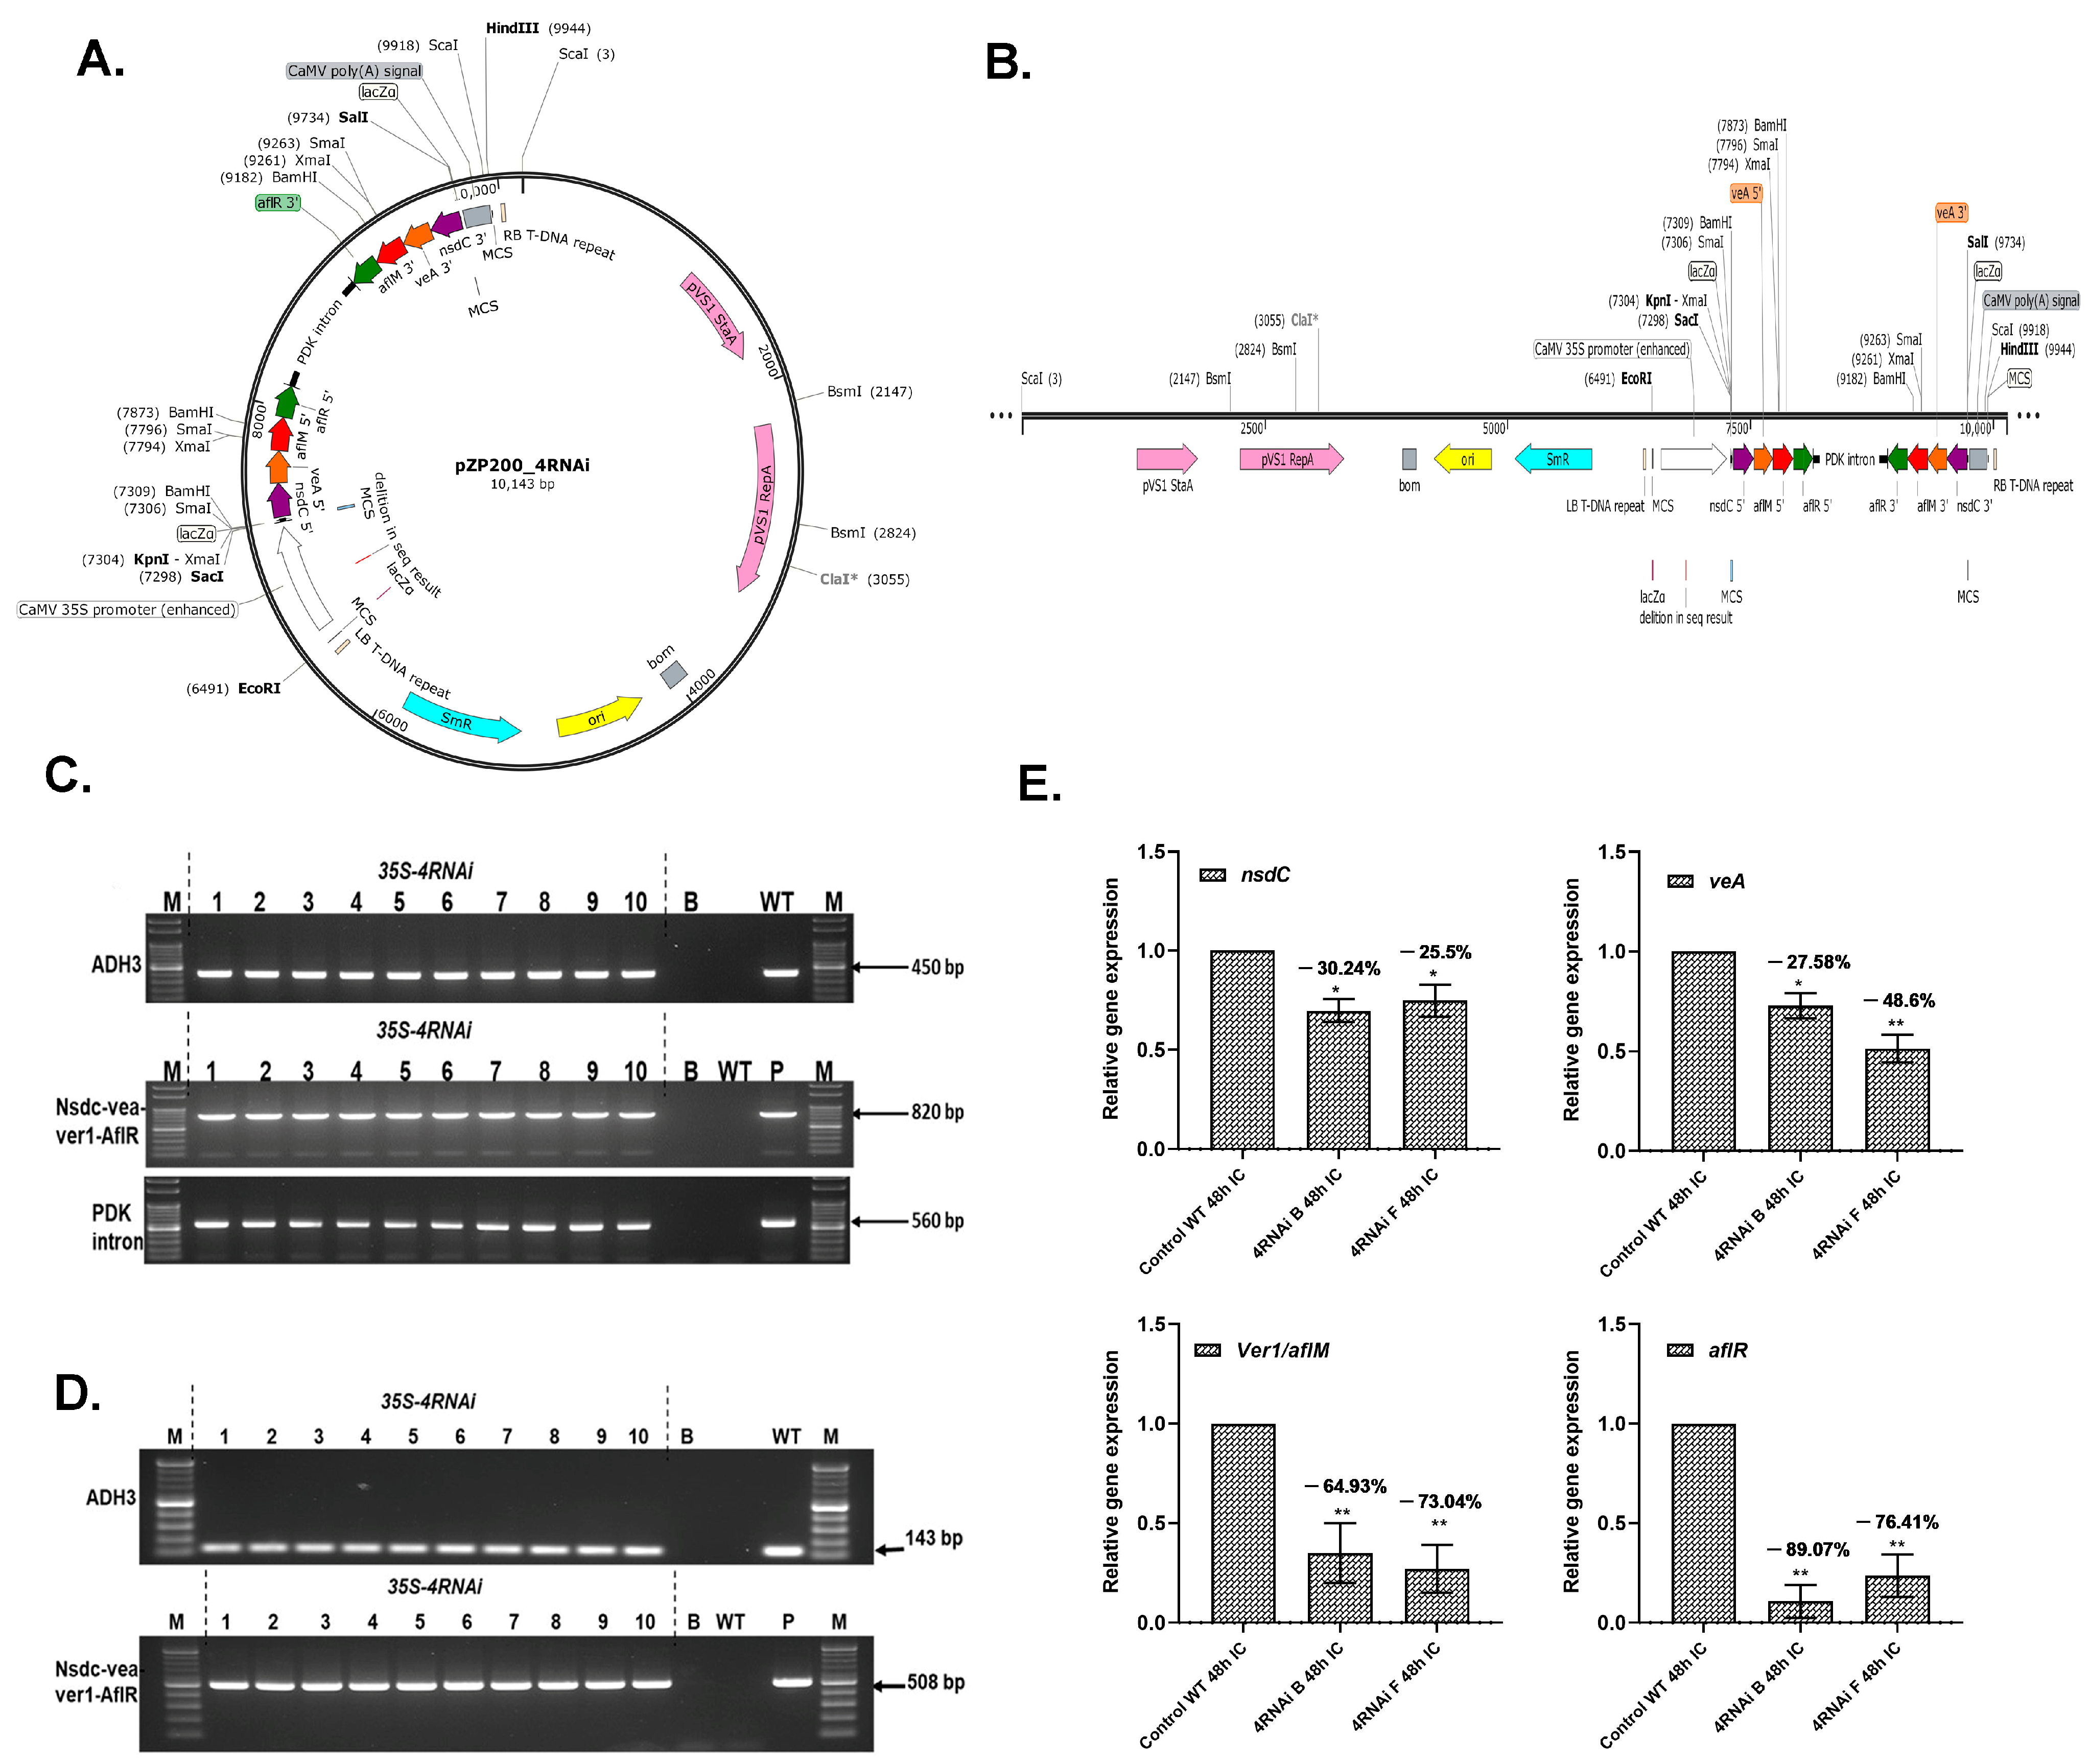
2.1. Generation of HIGS Lines Overexpressing 4RNAi Cassette

To knock down A. flavus developmental and aflatoxin biosynthetic cluster genes that could be processed by the host’s RNAi machinery (Figure 1A,B), HIGS lines overexpressing the 4RNAi genes’ inverted repeat sequences were developed by Agrobacterium-mediated transformation of cv. ICGV 91114. Overall, 44 putative primary transformants (T0) were successfully produced, and the presence of the transgene was confirmed by PCR analysis using 4RNAi primers (Figure 1C). Eleven randomly selected groundnut HIGS events in the T3 generation revealed a single-copy integration of the aflR gene in all tested events (Supplementary Table S2). Further, inheritance analysis indicated the integration of all 4RNAi genes in the groundnut genome in a 3:1 segregation ratio (Supplementary Table S3).
Reverse transcription PCR analysis of homozygous T3 lines revealed active transcription of the 4RNAi gene cassette in the HIGS events, while no transcripts were detected in the WT control lines (Figure 1D). Quantitative RT-PCR (qRT-PCR) assays using RNA isolated from A. flavus-infected cotyledons revealed a significant reduction of targeted nsdC, veA, aflM, and aflR transcripts, indicating silencing of the targeted fungal genes during the A. flavus infection of HIGS groundnut cotyledons, compared to their WT counterparts (Figure 1E).

2.2. 4RNAi-Expressing HIGS Lines Demonstrate no Substantial Alterations in Gene Expression

Any unintentional suppression of nontargeted groundnut genes was assessed by predicting siRNA sequences using pssRNAit for the 4RNAi gene sequences [22]. The predicted siRNAs revealed no putative off-targets in the groundnut genome (Supplementary Tables S4 and S5). Moreover, HIGS plants did not show any noticeable effects on their growth and development and demonstrated normal morphology, flowering, and seed set compared to their WT controls (Supplementary Figure S1).

2.3. HIGS Cotyledons Showed Significant Resistance to A. flavus Infection and Aflatoxin Contamination

The cotyledons of T1, T2, and T3 progenies of groundnut HIGS lines were screened for Aspergillus infection using in vitro seed colonization assays. Of these, progenies of two HIGS lines (B-10-7 and F-5-4) consistently had less mycelial growth compared to WT controls after challenging with the A. flavus strain AF11-4 (Figure 2A, Supplementary Figure S2). Furthermore, the relative gene expression of the FLAV gene significantly varied between WT control lines and 4RNAi events. The 4RNAi event B-10-7 and F-5-4 showed a 97% and 99% reduction, respectively, in fungal biomass compared to the susceptible WT control line (Figure 2B).
Similarly, the level of aflatoxin B1 tested across 7 T1 events showed a significant (p ≤ 0.01) reduction of aflatoxin levels in the inoculated 4RNAi cotyledons (0–6 ppb) compared to the WT-controls (7529.27 ppb) (Figure 2C). Trait stability was confirmed in the T2 and T3 generations, while the AFB1 levels were significantly reduced in the T2 (0–3 ppb) and T3 (0.1–17 ppb) progenies, compared to the WT controls (Figure 2C).

2.4. Impact of Aspergillus Infection on Groundnut Proteomes

To understand the proteome changes for identifying A. flavus-responsive proteins, label-free quantitative proteomics analysis was performed on A. flavus-infected HIGS and WT lines at 0, 30, 48, and 72 h post-infection. Proteins were identified based on the criteria of at least 2 unique peptides matching with a 1.5-fold change at p ≤ 0.05 between the uninfected and infected groups in the contrasting genotypes and expression profiles studied (Figure 3A). Comparative analysis revealed differential regulation of 984 proteins at various time points, with 528 proteins being upregulated and 456 downregulated in HIGS lines compared to the WT controls (Supplementary Figure S3A,B).
Based on gene ontology analysis, the identified proteins were categorized into different groups, such as molecular functions, cellular components, and biological processes (Supplementary Figure S4). The data of GO-based annotation, KEGG pathways, and the subcellular localization of all identified proteins are listed in Supplementary Tables S7 and S8. Putative function analysis identified 21 GO terms related to biological processes, 9 GO terms for molecular functions, and 6 GO terms for cellular components. Proteins with binding and catalytic activity were highly represented in the molecular function category, while the cells, cell parts, and organelles were the most represented categories of cellular components. Most proteins were involved in cellular processes, response to stimulus, and metabolic processes in the biological process category. DEPs in the contrasting lines shared the same categories in biological, molecular, and cellular processes in broad functional distribution analysis. However, there were differences in the proportional distribution of the proteins (Supplementary Figure S4A–C).
Pathway analysis carried out between DEPs from HIGS and WT control samples using the MapMan tool revealed groundnut metabolic Aspergillus pathways that responded to A. flavus infection. The DEPs were mapped individually and in comparison to each other and different functional categories. All DEPs were associated with 35 pathways (Supplementary Figure S4D,E), with significantly enriched ones related to stress (24–26%), signaling (9–11%), protein (9–10%), lipid metabolism (6–7%), and photosynthesis (5%).

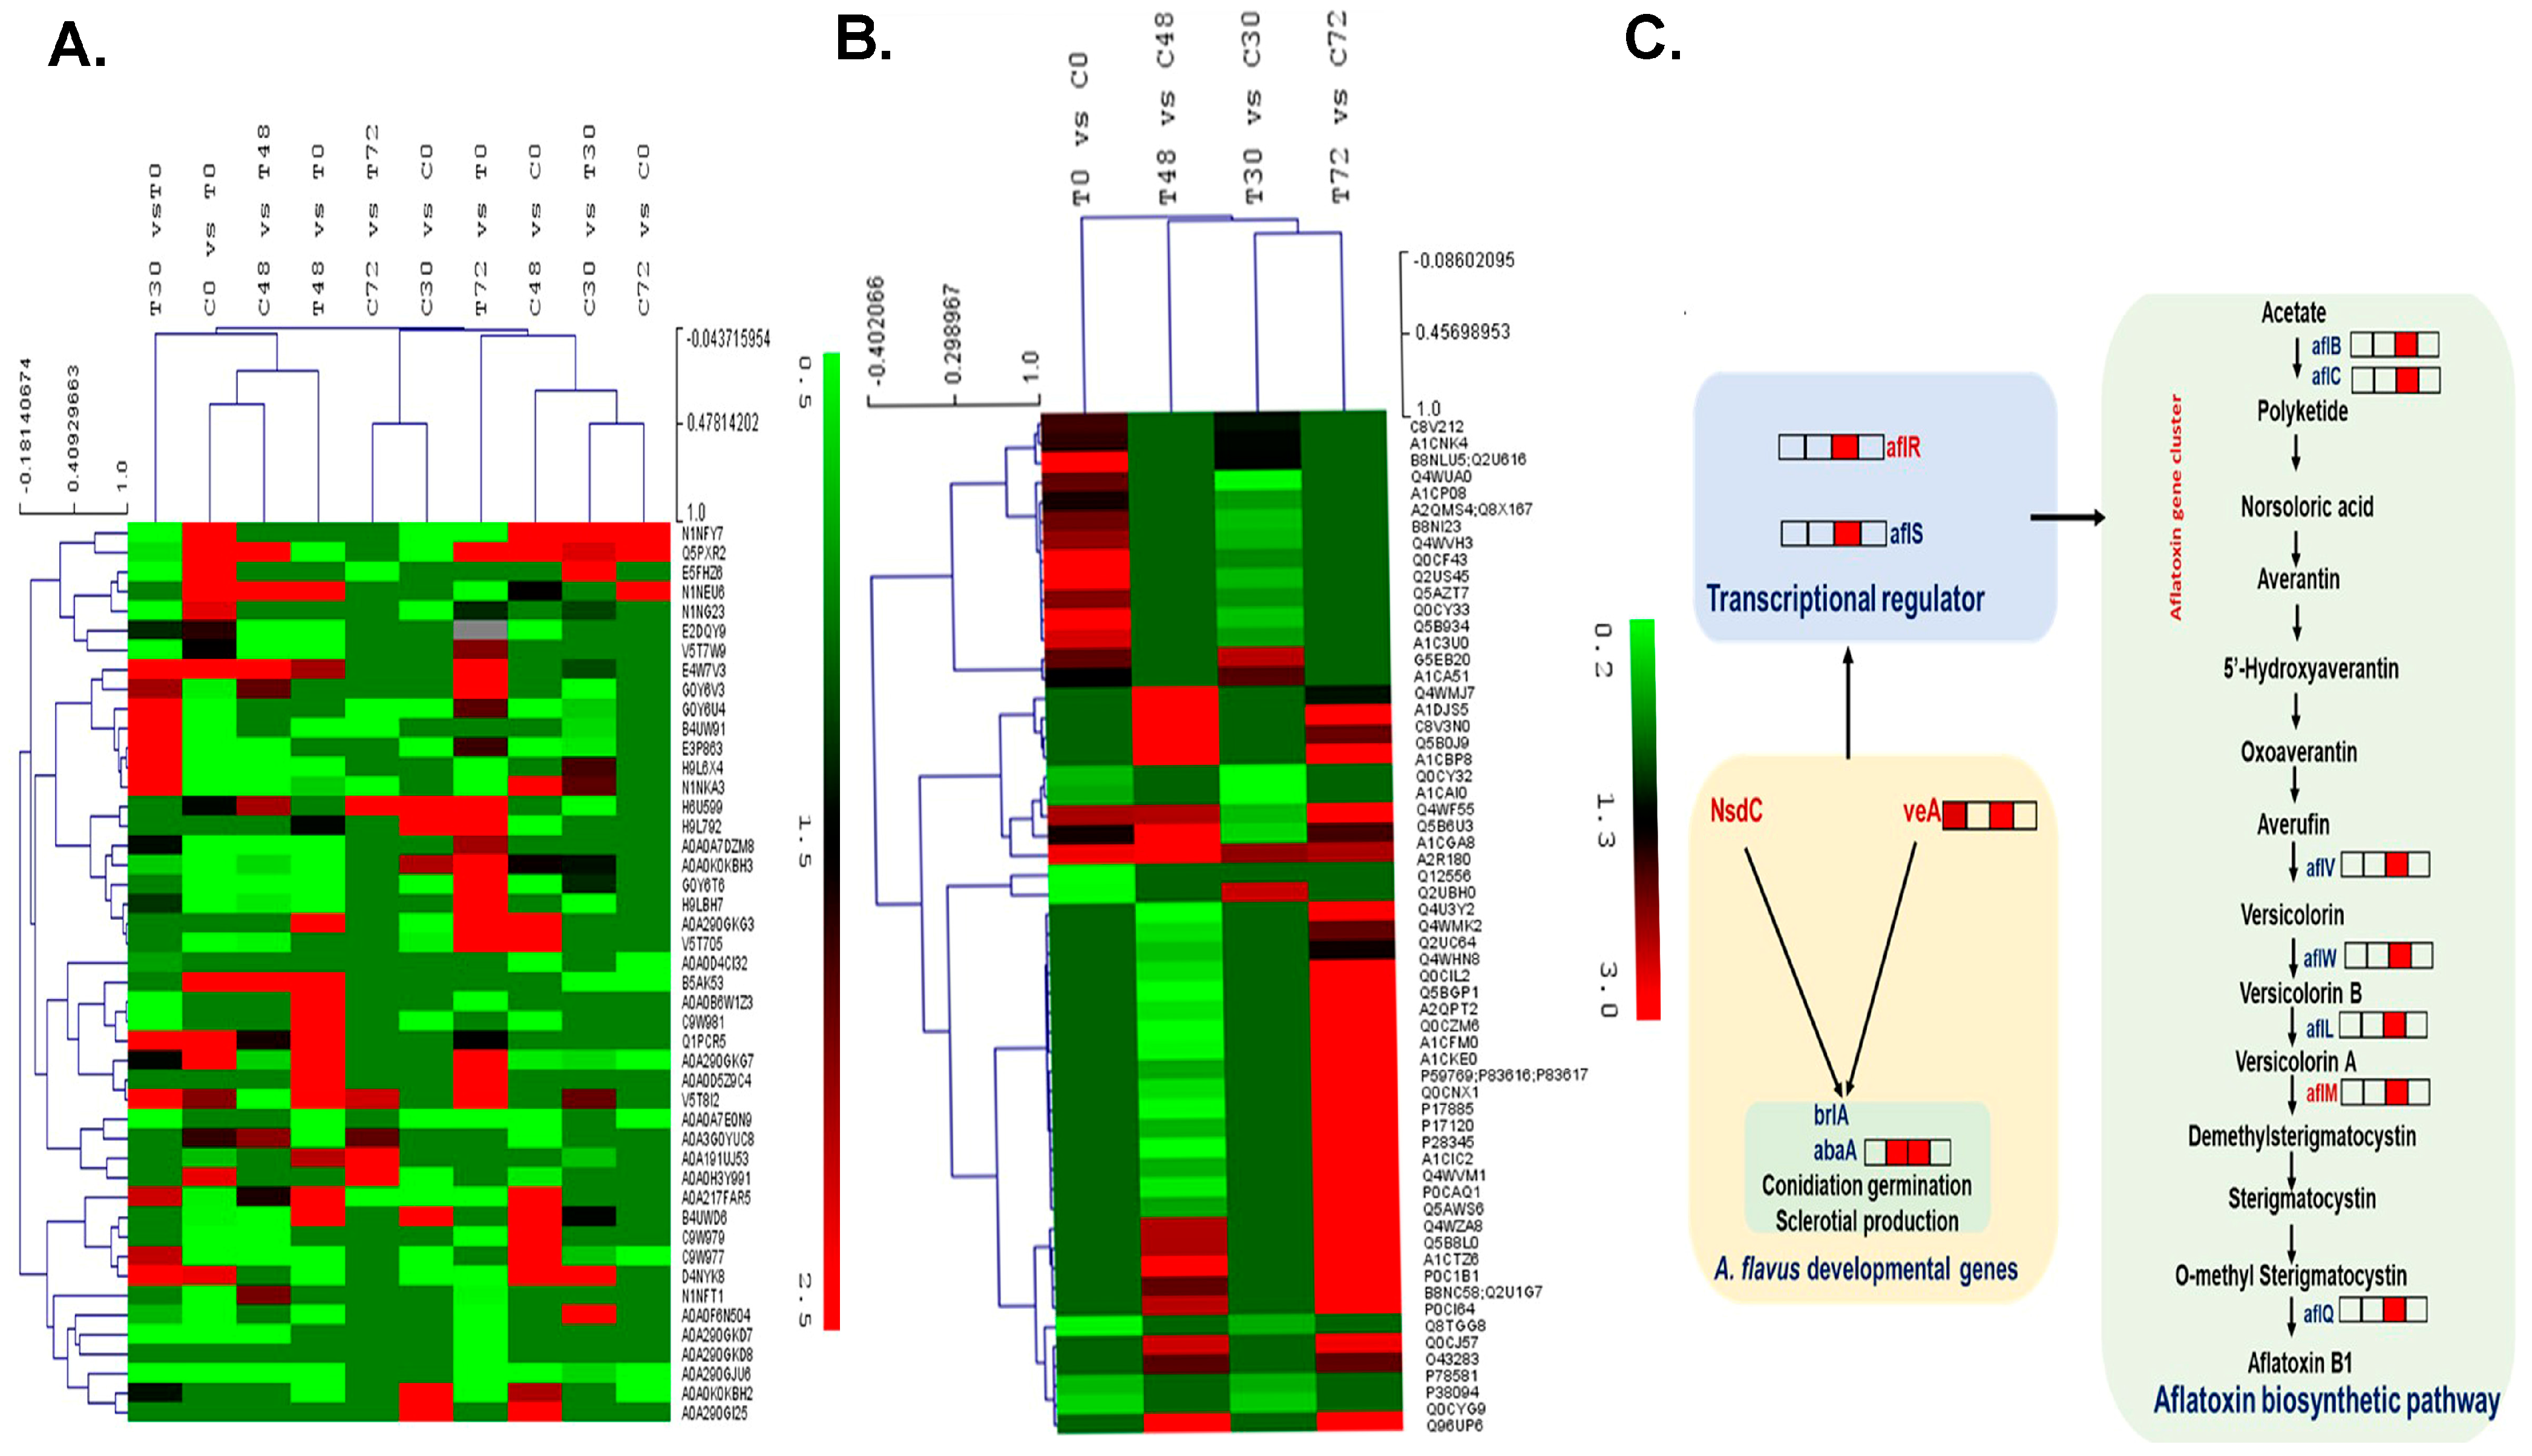
2.5. Effect of Host-Induced Gene Silencing on the A. flavus Proteome

To confirm whether the inhibition of aflatoxin biosynthesis observed in our study occurred through host-induced gene silencing of nsdC, veA, aflM, and aflR, the proteomic analysis of the HIGS lines and WT control were compared under A. flavus infection. Proteins were filtered against the known A. flavus proteome on the UniProt database. A total of 1745 DEPs were observed, of which 995 were upregulated and 750 were downregulated in the HIGS lines in comparison with the WT controls (Supplementary Figure S3C,D), and expression profiles of the quantified proteins were heat-mapped (Figure 3B, Supplementary Tables S9 and S10).
Proteins previously reported to play a role in fungal differentiation and development, pathogenicity, and aflatoxin biosynthetic pathways were selected, and their expression was compared based on the fold change (FC) between the 4RNAi and WT samples (Table 1, Figure 3C). Genes known to be involved in fungal differentiation and pathogenicity—such as calmodulin (46.44 FC); eukaryotic translation initiation factor 3 subunit I (35.84); transcriptional activator hacA (23.18); kynurenine 3-monooxygenase 2 (11.03); fungal sexual development regulator velC (3.47 FC); conidiophore development regulator veA (2.44 FC); and aflatoxin biosynthetic pathway proteins, such as aflC (7.06 FC), aflL (3.79 FC), aflM (4.26 FC), aflQ (3.46 FC), aflR (2.01 FC), aflS (5.71 FC), aflV (3.92 FC), aflW (1.75), and aflJ (1.90)—were higher in the WT lines, while pectinesterase A (77.76), pectin lyase D (21.05), calpain-7 (12.10), aflB (2.16 FC), aflN (2.74), and α-amylase A (2.82 FC) were in higher abundance in HIGS samples.
The levels of DEPs observed in the proteomics data of the known aflatoxin biosynthetic pathway proteins were further validated by qRT-PCR analysis of their respective genes (Figure 4). The results were consistent with the proteomics data, confirming the downregulation of proteins upon the silencing of the targeted aflatoxin regulatory and cluster biosynthetic genes. Expression of the targeted developmental and aflatoxin regulatory genes was significantly reduced compared to the WT control samples in the two promising lines, viz., 4RNAi_B and 4RNAi_F, for nsdC (0.70 and 0.75 FC), veA (0.73 and 0.51 FC), and aflR (0.11 and 0.24 FC), as well as the biosynthetic genes aflM (0.35 and 0.27 FC), aflQ (0.05 and 0.66 FC), aflV (0.05 and 0.72 FC), aflW (0.04 and 0.49 FC), aflS (0.19 and 0.77 FC), aflL (0.16 and 0.66 FC), aflB (0.05 and 0.53 FC), aflP (0.19 and 0.56 FC), aflD (0.04 and 0.50 FC), aflO (0.05 and 0.74), and aflJ (0.14 and 0.43 FC).

2.6. Differentially Expressed Proteins in the Groundnut Host System and Identification of Host Resistance-Associated Proteins

To identify the potential proteins that are associated with resistance, proteomes of the HIGS lines were compared to the WT line during the progression of A. flavus infection (Table 2, Supplementary Table S7). Analysis of A. flavus-responsive DEPs revealed that they were essentially involved in the activation of heat shock proteins (HSPs), calcium signaling, phytohormones, transcription factors, and fatty acid pathways (Table 2, Figure 5).
Levels of resistance-associated proteins—including Ca2+ signaling proteins, such as calcium-dependent protein kinase (CDPK) (5.94 FC) and Ca2+ binding protein (SOS3) (2.27 FC)—were not detected or significantly higher in HIGS lines compared to the WT control lines at different time points, except for CDPK that was downregulated at the 0 and 30 h time points. Further, levels of Ca2+ signaling proteins involved in heat shock signal transduction-activated heat shock proteins, such as HSP17.6 (2.50 FC), HSP 2 (2.50 FC), HSP 70 (3.62 FC), and HSP transcription factor A-2 (2.10 FC), were not detected or significantly higher in the HIGS samples compared to the control at most time points.
Proteins encoding phytohormone and transcription factors were detected in abundance in HIGS lines compared to the WT control samples (Table 2). Phytohormones, such as auxin-induced putative Aldo/keto reductase family protein (4.44 FC), auxin signaling F-box 3 (3.38 FC), ABA response element-binding protein 1 (12.57 FC), and ABA 8′-hydroxylase 3 (8.95 FC), were either not detected or significantly higher in HIGS lines than in the WT control. Similarly, HIGS lines showed significant upregulation of several transcription factors, including ethylene-responsive transcription factor (66.16 FC), ethylene-responsive element-binding factor 3 (70.87 FC), ethylene-responsive element-binding factor 4 (6.26 FC), NAC (4.04 FC), NAC3 (4.28 FC), MYB25 (5.33 FC), MYB1 (4.73 FC), MYB9 (2.40 FC), WRKY15 (12.15 FC), and DREB transcription factor (9.65), except for WRKY, which was not detected at 0 and 72 h and was downregulated at 30 h.
Numerous DEPs were associated with different metabolic pathways in the HIGS lines compared with the susceptible WT control plants (Table 2). Some of the proteins that changed substantially were related to fatty acid biosynthesis, which includes acyl carrier protein (29.37 FC), lipoxygenase (9.88 FC), lipoxygenase 1 (7.97 FC), phosphatidylinositol phosphate kinase (4.68 FC), lysophosphatidyl acyltransferase 5 (5.40 FC), palmitoyl-monogalactosyldiacylglycerol Δ-7 desaturase (6.01 FC), ceramide kinase-related protein (3.18 FC), sphingolipid Δ-8 desaturase (9.71 FC), and phospholipase D (4.15 FC), which were higher in HIGS lines compared to the control line.

2.7. Identified Host Susceptibility-Associated Proteins

Higher levels of susceptibility-associated proteins (SAPs) were observed in WT when compared to HIGS lines (Table 3, Supplementary Table S8). Significantly higher levels of putative SAPs were detected for proteins—such as annexin (6.26 FC); syntaxin (4.02 FC); mildew resistance locus O (MLO)-like protein (3.82 FC); calmodulin (3.33); heat shock protein HSP4 (11.67 FC); transcription factors, such as NAC 2 (5.56), MYB 21 (5.59), and MYB 20 (3.00); β -ketoacyl-ACP synthase II-1 (41.34 FC); 9-cis-epoxy carotenoid dioxygenase (7.53); long-chain acyl-CoA synthetase 4 (12.32); and C3HC4 type (RING finger) (7.70 FC)—than for the WT lines during A. flavus infection (Table 3).

2.8. Validation of DEPs by qRT-PCR

Selected DEPs identified through proteomics were further validated by qRT-PCR of their associated genes to ascertain if changes observed in protein expression were regulated during transcription (Figure 6). These were previously reported to be involved in various biological processes in response to biotic stress, proteolysis, flavonoid and fatty acid biosynthesis, and signal transduction pathways and were grouped into different subcategories that are linked to plant resistance or susceptibility, either directly or indirectly. The fold change in the expression of target resistance genes in the two HIGS lines compared to the WT control following A. flavus infection was validated by qRT-PCR. Significant increases in expression (p ≤ 0.05) were observed in both HIGS samples for calcium-dependent protein kinase (CDPK) (4.89, 3.72 FC), cinnamyl alcohol dehydrogenase (CAD) (3.39, 4.47 FC), cinnamic acid 4-hydroxylase (C4H) (3.17, 7.28 FC), chalcone-flavanone isomerase (CFI) (2.44, 5.25 FC), cationic peroxidase 2 (PNC) (7.04, 72.62 FC), diacylglycerol acyltransferase (10.5, 22.39 FC), dihydroflavonol-4-reductase (DFR) (1.62, 4.46 FC), lysophosphatidyl acyltransferase 5 (LPAT) (1.26, 7.29 FC), sphingolipid Δ-8 desaturase (SLD) (1.83, 15.74 FC), and calmodulin (5.03, 1.53 FC)). These results were consistent with the proteomics data, confirming the differential expression of all 10 genes after infection by the pathogen in the resistant HIGS lines when compared to the WT control line.

3. Discussion

Host-induced gene silencing of A. flavus genes essential for pathogen growth and development has proven to control both necrotrophic and biotrophic fungal pathogens [23,24,25]. Several studies have reported that upon A. flavus infection, selective degradation of mRNA induced by siRNA interferes or blocks the translation of the targeted fungal genes, resulting in reduced aflatoxin contamination [8,9,10,14,17].
The HIGS groundnut plants developed in this study simultaneously target nsdC, veA, aflM, and aflR involved in fungal morphogenesis and aflatoxin biosynthesis pathway genes [18,26], and the HIGS plants demonstrated significantly lower infection and aflatoxin accumulation than previously reported in other RNAi-based studies [8,9,14]. PCR and RT-PCR screening showed stable expression and inheritance of the 4RNAi construct in progenies from the T2 and T3 generations. Segregation analysis revealed mendelian segregation of transgenes, thereby indicating inheritance of single copy inserts in a 3:1 ratio, aligning with our previous report [9]. Our results confirm previous findings, where silencing of the fungal sexual development gene, nsdC, in A. flavus demonstrated a lower fungal load and aflatoxin production [18]. After downregulation of aflR, a regulatory gene, a sequence-specific zinc, binuclear, DNA-binding protein that activates the transcription of most structural genes in the aflatoxin gene cluster was shown to suppress the expression of A. flavus pathway genes [27,28]. Silencing of the aflR gene was previously shown to result in significantly lower levels of aflatoxins (14-fold) in RNAi maize plants than in wild-type plants, though significant off-target effects on plant architecture were also observed [13]. Another candidate for our study was veA, a velvet family protein that plays a key role in A. flavus conidiation and sclerotial, as well as regulating aflatoxin biosynthesis [29]. The downregulation of veA suppresses the expression of aflR, aflD, aflM, and aflP, the major aflatoxin genes, resulting in inhibition of aflatoxin synthesis in the fungus [30]. Likewise, RNAi-based suppression of another target gene, aflM, was previously shown to significantly enhance aflatoxin resistance in maize [14], and RNAi groundnuts [9] also demonstrated significantly enhanced resistance to aflatoxin contamination.
Several HIGS lines developed in this study significantly reduced the A. flavus biomass compared to WT control lines, which could be attributed to the silencing of the targeted nsdC and veA genes. These lines also showed high levels of aflatoxin resistance, with the HIGS lines accumulating non-detectable levels (<10 ppb) of aflatoxin in comparison to >7000 ppb in WT lines. Gene expression studies indicated over 50% reduction of the transcripts of the fungal genes aflM and aflR in the 4RNAi-HIGS lines assayed, whereas nsdC and veA showed 30% suppression in the tested HIGS lines compared to WT controls during infection. This showed that aflM and aflR, and to a lesser extent nsdC and veA, are limiting factors in aflatoxin biosynthesis and are efficient targets for HIGS, as reported in maize [13,14].
Comparative proteome profiling in the HIGS lines and their WT counterparts gathered further evidence that suppression of these four RNAi-targeted genes affected the fungal morphogenesis and aflatoxin cluster genes. A significant reduction in the expression of several fungal proteins in the infected HIGS lines was observed, including the fungal sexual development regulator, VelC, and aflatoxin biosynthetic pathway proteins, such as AflC, AflL, AflM, AflQ, AflR, AflS, AflV, AflW, VeA, and AflJ, further validating the reduced growth of the fungus on the HIGS groundnut lines, as was demonstrated in the bioassays. Silencing of five genes involved in aflatoxin production, aflR, aflS, aflC, pes1, and efflux pump (aflep), has been previously reported in groundnut to result in a 100% reduction in the aflatoxins B1 and B2 [8]; however, this study reported lower levels of aflatoxin only in immature seeds [31]. Several in vitro studies also revealed that RNAi-based silencing of aflatoxin pathway genes causes a significant reduction in aflatoxin production [32,33]. These findings suggest that simultaneous silencing of morphogenesis and aflatoxin cluster genes can be an attractive strategy for reducing aflatoxin content in groundnut.
Despite the demonstrated success of HIGS as an effective aflatoxin mitigation strategy, the molecular mechanisms of resistance to Aspergillus infection and aflatoxin contamination in plants is not well understood. Hence, we compared proteome profiles of HIGS lines expressing the 4RNAi construct and WT controls during A. flavus infection. We identified differential expression of resistance-associated proteins or susceptibility-associated proteins during the groundnut–A. flavus interaction. Intrinsically, plants have different barriers to prevent the entry and growth of the pathogen, including the cell wall, which plays a significant role [34]. When the core defense mechanism of plants is ineffective, they begin to rely on the gene products that can recognize and respond to pathogen effector molecules, known as host plant effector-triggered immunity (ETI). At the molecular level, the interaction between plant and pathogen is a mutual interplay, where calcium signaling pathways either activate or deactivate the ROS pathway [35]. We observed high expression of calcium-dependent protein kinase, SOS3 proteins, HSP17.6, HSP70, HSP2, and heat shock transcription factor A-2 in the resistant HIGS lines. The high concentrations of calcium ions in the cytosol affect the production of enzymes that generate reactive oxygen species (ROS) [35,36], which further regulate the heat shock proteins (HSPs) in pathogen infection as defense molecules. Furthermore, the increased levels of free calcium can activate the mitogen-activated protein kinases (MAPKs), which play a key role in the phosphorylating of regulatory proteins. Heat shock proteins (HSPs) function as molecular chaperones by interacting with other proteins and providing stability and protection from damage [37]. For instance, HSP, Ntshsp17, and RSI2 act as molecular chaperones and help in inducing defense responses in tobacco and tomato against Ralstonia solanacearum and Fusarium oxysporum, respectively, by stabilizing signaling-related proteins [38]. Likewise, in tomatoes, the induction of mitochondrial HSP22 during oxidative stress helps to provide adaptive responses [39]. In contrast, Mds1 (Mayetiola destructor susceptibility-1) expression in wheat leads to an increased susceptibility to wheat gall midge and powdery mildew [40]. In addition, several reports suggest that ROS also induces an increase in cytosolic Ca2+ concentrations, which in turn activates other defense responses, such as the production of phytohormones, transcription factors, and secondary metabolites [41,42,43].
We observed that the proteins associated with the phytohormones synthesis, including auxin, gibberellin, ethylene, and ABA, that is involved in host–pathogen interactions were induced at higher levels in resistant HIGS groundnut lines [44]. ABR1, a homolog of an abscisic acid insensitive gene, which is known to be a repressor of the ABA signaling pathway, has been reported to confer resistance against pre-harvest aflatoxin contamination [45]. Further, in maize, the ethylene-responsive factor (ZmERF1) was shown to induce defensin proteins that resist Aspergillus infection [46].
Over 40 transcription factor-related proteins, including MYB, WRKY, NAC, and ERF binding proteins, were detected in the resistant HIGS lines at high levels. Among these was a transcription factor, MYB30, that is a positive regulator of a hypersensitive response (HR) involved in the regulation of downstream very-long-chain fatty acid (VLCFA) biosynthesis pathways in Arabidopsis against pathogen attack [47]. Furthermore, Apple MdMYB30 has been shown to modulate plant resistance by regulating cuticular wax biosynthesis against Botryosphaeria dothidea [48]. In addition, WRKY genes are reported to regulate fatty acid composition in Arabidopsis [49] and positively influence the PR1 protein activity in rice [50] during Xanthomonas oryzae pv. oryzae (Xoo) attacks, and they are involved in defense responses to A. flavus inoculation in maize [46].
Plants have developed specific metabolic pathways to synthesize signaling molecules and antimicrobial compounds to combat pathogen infection. In the current study, 52 proteins were differentially induced in the resistant HIGS lines that are involved in fatty acid metabolism. We observed a higher abundance of acyl carrier protein, lipoxygenase, β-hydroxy acyl-ACP dehydratase, phosphatidylinositol phosphate kinase, lysophosphatidyl acyltransferase 5, palmitoyl-monogalactosyldiacylglycerol Δ-7 desaturase, ceramide kinase-related protein, sphingolipid Δ-8 desaturase, and phospholipase D in 4RNAi lines. The antimicrobial properties of plant lipoxygenases were reported for various pathogens, including A. flavus [51]. In maize and soybean, lipoxygenase-3 (LOX3) and a few other 9-oxylipins suppress aflatoxin biosynthesis upon A. flavus infection [52]. The glycerophospholipids are structural components of membranes that act as novel secondary messengers as defense signaling pathways in plants [53]. Similarly, Phospholipase D (PLD) catalyzes the hydrolysis of structural phospholipids functioning as second messengers in the regulation of signaling pathways in plant defense [54]. Expression of the α, β, and γ class of Phospholipase genes is induced following Pseudomonas syringae infiltration in Arabidopsis, thereby suggesting their function as a positive regulator of disease resistance [55]. Hence, this provides insights into the involvement of fatty acids in the synthesis of signaling molecules and antimicrobial compounds to act as physical and chemical barriers to the entry of Aspergillus during the infection process [41,56].
Furthermore, we observed that the susceptibility-associated proteins (SAPs), such as mildew resistance locus O (MLO), annexin, syntaxin, calmodulin, and 9-cis-epoxy carotenoid dioxygenase, were significantly upregulated in susceptible WT controls compared to HIGS lines. Understanding the role of these susceptibility genes helps us to devise strategies for breeding aflatoxin-resistant crops [41,57]. The primary calcium sensor in plants, calmodulin (CaM) binds to calcium ions and regulates various cellular functions by modulating the activity of different target proteins in response to calcium signals [58]. Silencing of the calmodulin-like proteins SlCML55 in tomatoes inhibits Phytophthora infection [59]. The 9-cis-epoxy carotenoid dioxygenase involved in the biosynthesis of ABA was reported to be highly expressed in the susceptible genotype. Increased ABA levels suppress disease resistance by downregulating salicylic acid (SA)- or methyl jasmonate (MJ)-induced defense gene expression [60]. However, depending on the pathosystem, ABA reportedly modulates host immunity against fungal pathogens. In the rubber plant, ABA has been shown to positively regulate the defense against powdery mildew [61], and in barley, ABA contributed to an increased susceptibility to M. oryzae [62]. In addition, as reported previously [41], genes such as MLO, annexin, and syntaxin were also identified as SAPs in this study. Since MLO helps in fungus attachment to the host cell, increasing host susceptibility (S) to fungal pathogens, silencing of these genes enhanced disease resistance against the powdery mildew in different crops, indicating its negative role in plant defense [63]. Annexins, a family of calcium-binding proteins that mediate membrane fusion and regulate the phagocytosis and exocytosis of vesicles [64], were upregulated in the WT and possibly might have decreased the integrity of the plant cell membrane, resulting in increased susceptibility. Similarly, the upregulation of syntaxin during infection indicated its role as a susceptibility factor that promotes infection. RNAi-mediated silencing of syntaxin has been reported to confer resistance to P. infestans in potatoes [65] and apples [66]. Considering these findings, our results justify further study of these SAPs as potential targets in gene editing approaches for enhanced resistance to aflatoxin contamination in groundnut.

4. Conclusions

We propose an effective mechanism to alleviate aflatoxins in groundnuts by reducing their levels quite effectively below the regulatory thresholds. Our study provides ample evidence that groundnut can export heterogenous expressed sRNAs into the invading fungus, and that silencing of target genes that are essential for pathogen growth, development, and aflatoxin production affect the pathogenicity and resulting mycotoxin accumulation in Aspergillus–groundnut pathosystems. Furthermore, comparative proteome profiling of the HIGS lines during infection provided clues that targeting the fungal nsdC and veA genes could have allowed the HIGS genotype more time to mount a strong defense response to the invading fungus compared to the WT host, resulting in higher levels of resistance gene expression triggering a natural defense mechanism, whereas simultaneous suppression of aflR and aflM genes disrupted the aflatoxin biosynthetic pathway, resulting in reduced contamination. Together, silencing multiple Aspergillus genes by HIGS conferred enhanced resistance, providing an effective strategy for controlling fungal infection and aflatoxin contamination. A major highlight of this work is the identification of genes and their encoded proteins that play a role in the complex innate defense mechanisms of groundnut and perhaps other plant species that can serve as key molecular targets in future metabolic engineering or breeding approaches for developing aflatoxin-resistant crops.

5. Materials and Methods

5.1. Generation of HIGS Groundnut Expressing RNAi Genes

Four A. flavus genes, including the fungal developmental genes nsdC (GenBank: CP044620.144), veA (XM_041294274.1) and the aflatoxin biosynthetic pathway genes aflR (XM_041285628.1) and aflM (ver-1) (XM_041291516.1), were isolated from a highly aflatoxigenic A. flavus isolate NRRL 3357 [67]. PCR products of four regions of the A. flavus genes nsdC (210 bp, CP044620.1:2938046–2938256), veA (200 bp, XM_041294274.1:1171–1371), aflM (210 bp, XM_041291516.1: 2152–2362), and aflR (200 bp, XM_041285628.1:840–1040) were cloned into the pHANNIBAL vector downstream to the cauliflower mosaic virus (CaMV) 35S promoter in sense and antisense orientations, separated by a pyruvate orthophosphate dikinase (Pdk) intron with a polyadenylation signal. To avoid the off-target effects, siRNAs for the 4RNAi gene sequences were predicted using pssRNAit [22]. These regions having efficient siRNA hits showing no homology with the sequence of the groundnut genome were selected for construct development (Supplementary Tables S5 and S6). The resulting recombinant gene (2x35S-5′4RNAi-Pdk-3′4RNAi-polyA) was then cloned at EcoRI and HindIII sites of the binary vector pPZP200; this construct is referred to as pPZP200_4RNAi throughout the text (Figure 1A,B). The binary vector pPZP200 contains a spectinomycin gene for bacterial selection and is devoid of a selectable marker/reporter gene. HIGS lines were developed in groundnut var. ICGV 91,114, using Agrobacterium-mediated transformation [68,69]. Regenerated plants were transplanted into soil and grown to maturity under containment greenhouse facilities.

5.2. Genotyping of HIGS Plants

The DNeasy® Plant Mini Kit (Qiagen Valencia, Valencia, CA, USA) was used to isolate the genomic DNA from young leaves of putative groundnut transformants. Extracted DNA was quantified using a Qubit™ 4 Fluorometer (Invitrogen, Waltham, MA, USA). The presence or absence of the 4RNAi transgenes and a control gene, ADH 3 (EG529529), were determined using PCR with gene-specific primers (Supplementary Table S1). PCR was performed using Emerald Amp® GT PCR 2× Master Mix (Takara Bio Inc., San Jose, CA, USA) as per the manufacturer’s instructions.

5.3. Gene Expression Analyses

Leaf tissues were used to extract total RNA for RT-PCR, while infected kernel tissues collected at 0 and 48 h post-infection (hpi) were used for qPCR. The RNeasy Plant Mini kit (Qiagen, Tokyo, Japan) was used for RNA extraction and quantified with a Nanodrop ND 1000 Spectrophotometer (Nanodrop, Wilmington, DE, USA). DNase treatment was carried out using the DNase Kit (Fermentas, Waltham, MA, USA) according to the manufacturer’s instructions. For cDNA synthesis, 1.0 μg of purified RNA was used with the recommended protocol (Thermoscript RT-PCR system, Invitrogen, Waltham, MA, USA).
RT-PCR was performed using an Emerald Amp® GT PCR 2× MasterMix (Takara Bio Inc., San Jose, CA, USA), as per the manufacturer’s instructions, followed by gel electrophoresis to visualize PCR products. Quantitative PCR was performed in a Realplex Real-Time PCR system (Eppendorf, Framingham, MA, USA) using SYBER Green mix (Bioline, London, UK). For gene expression analysis, the groundnut ADH 3 (EG529529) and G6Pd (EG030635) genes were used as reference genes [70], while the A. flavus species-specific tubulin (CP044619.1) was used as the reference gene for fungal gene expression (Supplementary Table S1). Fungal gene primers for qPCR were designed outside of the sequence used to obtain ds4RNAi.
For each qPCR reaction (10 µL), 5-times-diluted cDNA, 0.4 mM of each primer, and 5 µL SYBR Green mix (Bioline, London, UK) were added. The reaction conditions involved initial denaturation at 95 °C for 2 min, followed by 40 cycles of 15 s at 95 °C and 30 s at 60 °C with fluorescent signal recording. Melt curves were generated for each reaction to ensure specific amplification. All qPCR reactions, including the non-template control, were performed in 3 biological and 3 technical replicates. Relative fold expression was determined using the 2−ΔΔCt method [71].

5.4. Copy Number Detection and Inheritance Studies

To estimate the copy number in the 4RNAi lines, a relative quantitative method [72] was considered using the equation: X0/R0 = 10[(CtXIX)/SX][(CtR-IR)/SR], where IX and IR represent intercepts of the relative standard curves, and SX and SR represents slopes of the standard curves of the target and reference genes, respectively. CtX and CtR are the threshold cycles for amplification of the target and reference genes of the unknown test sample. The serial dilutions of genomic DNA from 100 ng to 10 ng were used to prepare the standard curves for the transgene (aflR), and vacuolar protein sorting-associated protein 53 A-like (GnVP) was used as the endogenous/reference gene. Copy numbers were detected by qPCR in the Realplex (Eppendorf, Hamburg, Germany) Real-Time PCR system using a 2X SensiFASTTM SYBR No-ROX (Bioline, London, UK) kit with 10 ng of genomic DNA for each sample (using three biological and technical replicates for each event). Standard curves were generated by plotting the log values and the corresponding Ct values. The copy number of the reference gene (R0) for GnVp (Gene ID: 107638771) was taken as 2 copies in the tetraploid groundnut for copy number estimation. Primer sequences for target and reference genes are given in Supplementary Table S1. PCR data of T1, T2, and T3 generation were used to analyze the segregation pattern in the 4RNAi events. The Chi-square test (p < 0.05) was applied to determine if the 4RNAi transgene was segregating according to the Mendelian pattern of inheritance.

5.5. Aspergillus flavus Growth Conditions

Fungal bioassays were conducted using the AF 11-4 strain of Aspergillus flavus [73]. Fungal spores were collected in sterile distilled water containing 0.05% Tween 20 and diluted to a concentration of 5 × 10⁴ spores/mL using a Neubauer hemocytometer. The colony-forming units (CFUs) were determined by standard tenfold dilutions to obtain ~40,000 CFU/mL on A. flavus parasiticus agar (AFPA) medium.

5.6. Colonization of A. flavus on Kernels and Aflatoxin Analysis

The T1, T2, and T3 generation HIGS lines were screened for resistance to a highly aggressive and toxigenic strain of A. flavus isolate AF 11–4 by in vitro seed colonization, as previously described [9]. Seeds from the HIGS events and WT control ICGV 91,114 were surface sterilized with a 0.1% solution of mercuric chloride, followed by washings with sterilized distilled water. The seeds were soaked in water for 2 h, and subsequently, the seed coat was removed, and cotyledons surgically cut into two vertical halves and arranged with the cut surface exposed in Petri dishes with 1.7% sterile agar/water (w/v). Each half of the cotyledon was inoculated with 2 µL freshly prepared fungal spore suspension (5 × 10⁴ spores/mL) and incubated at 28 ± 1 °C in the dark. All the inoculated and uninoculated samples collected at 0, 30, 48, and 72 h post-infection (hpi) were immediately frozen in liquid nitrogen and stored at −80 °C for further use.
The aflatoxin content (AFB1) was estimated using the indirect ELISA method, as previously described [74]. Briefly, the cotyledons collected at 72 hpi were extracted in 70% methanol containing 0.5% KCl and incubated overnight for 16 h in the dark at 25 °C, followed by ELISA. Three biological and three technical replicates were used in aflatoxin bioassays, along with wild-type controls (cv. ICGV 91114). The biological replicate consisted of 100 mg of each half-cotyledon sample per event.

5.7. Detection of Fungal Load

The DNA was extracted from 100 mg of A. flavus-infected groundnut seeds at 72 hpi with the PureLink Plant Total DNA Purification kit (Invitrogen, Waltham, MA, USA). The isolated DNA was evaluated for purity on 0.8% (w/v) agarose gel, and the concentration was determined using a Qubit Fluorometer 2.0 and stored at −20 °C for further use. The fungal load in the A. flavus-infected groundnut samples of the WT control and 4RNAi lines was determined using quantitative PCR (qPCR) with a relative quantification method [75]. The DNA concentration of each sample was normalized to 50 ng/µL. Following the test for DNA amplification using groundnut ADH 3 (EG529529) gene-specific primers, quantitative real-time PCR (qPCR) was performed to amplify the A. flavus ITS2 region, using FLAV as the target gene and ADH3 as the housekeeping gene (primer sequences shown in Supplementary Table S1). The qPCR reaction (10 µL) included 1 µL of template DNA, 0.4 mM of each primer, and 5 µL SYBR Green mix (Bioline, London, UK). The qPCR reactions were performed in biological and technical triplicates, and the Ct values for the FLAV gene were normalized using the groundnut ADH3 gene. The relative gene expression of FLAV was calculated using the 2−ΔΔCt method [71].

5.8. Extraction and Digestion of Total Proteins

Proteins were extracted from both A. flavus-infected and uninfected samples of T3 generation HIGS lines (F-4 & F-5) and the WT control ICGV 91114, as previously described [41]. The protein concentration was determined and normalized by loading an equal amount of each sample in the polyacrylamide gel electrophoresis (PAGE). The proteins were then subjected to reduction, alkylation, and overnight trypsin digestion using sequencing-grade porcine trypsin (Promega, Madison, WI, USA). Peptides from each fraction were extracted separately in 60% (v/v) acetonitrile (ACN) containing 0.1% (v/v) formic acid, sonicated in ice for 30 min, followed by concentrating in a speed vacuum concentrator (Thermo Scientific, Waltham, MA, USA) and purification using C18 spin columns (Thermo Scientific, Waltham, MA, USA). These samples were either immediately used for proteomics analysis or stored at −80 °C for further use.

5.9. UPLC-MS Analysis of Peptides

The trypsin digests were separated on an Acquity BEH C18 UPLC column (75 µm × 150 cm × 1.7 µm; Waters, Cheshire, UK) connected to a UPLC system for 90 min using LC-MS grade water in 0.1% formic acid (v/v; mobile phase A) and acetonitrile in 0.1% formic acid (mobile phase B). The separated peptides were analyzed for MS and MS/MS fragmentation on a Xevo-G2-XS (Waters, Milford, MA, USA), using an ESI source in positive mode. The scan time was set to 0.5 s in continuum mode, and the mass range was set to 50–2000 Da in TOF, with Leucine encephalin (200 pg/μL; Sigma-Aldrich, St. Louis, MO, USA) as an external calibrant. Mass spectra of the samples were acquired by MassLynx v4.0 software (Waters, Milford, MA, USA) and submitted for the identification and expression analysis of proteins.

5.10. Identification and Quantification of Proteins

Progenesis QI for Proteomics Software V.4.0 (Nonlinear Dynamics, Newcastle, UK) was used to identify and quantify proteins from raw spectra. Following alignment of the MS scans by retention time, peak lists for each replicate containing m/z and abundance were generated. Parameters were set to 5 to increase sensitivity for peak detection, and proteins with charges higher than 5 in the detection range (100–1600 m/z) between 5–80 min were captured. Triplicate MS scans grouped based on the treatment were normalized and compared for abundance data, followed by statistical evaluation. The peptides assigned to more than one protein were excluded from quantification. Protein identifications were completed using the Progenesis inbuilt ion accounting algorithm against the groundnut proteome and A. flavus proteome downloaded from UniProt (http://www.uniprot.org/, accessed on 30 September 2021), where the false discovery rate (FDR) for statistically significant proteins was 5% [76]. Quantitative analysis was based on the ratio of protein ion counts among contrasting samples or treatments. The resulting dataset was filtered, and only proteins quantified with 2 or more unique peptides and having a fold change of 1.5 with a significant p-value (p ≤ 0.05) were considered as up- or downregulated. Significant protein subcellular localization was predicted using Plant-mPLoc [77]. The proteomics data based on mass spectrometry were deposited at the ProteomeXchange consortium via jPOSTrepo [78] with the database identifier PXD028196.

5.11. Functional Annotation and Pathway Mapping

The protein classification analysis of unique and differentially expressed proteins into Gene Ontology (GO) categories was conducted using the MapMan application (http://mapman.gabipd.org, accessed on 30 September 2021) [79]. The potential involvement of these predicted proteins in biological pathways was explored by mapping them to the reference canonical pathways, using the Arachis genus as a reference in the KEGG automated annotation server KAAS (http://www.genome.jp/kaas-bin/kaasmain, accessed on 30 September 2021). To identify the expression patterns of proteins responsive to A. flavus, 50 common proteins that showed equal to or more than 1.5-fold variation were hierarchically clustered, using MeV software (Version 4.8, USA) with the Euclidean distance method.

Supplementary Materials

The following supporting information can be downloaded at: https://www.mdpi.com/article/10.3390/toxins15050319/s1, Figure S1: Phenotypic assessment of groundnut HIGS lines in T3 generation and wild type control ICGV 91114; Figure S2: Microscopic observation of A. flavus growth inhibition in HIGS lines and susceptible wild type control; Figure S3: Venn diagram showing significantly differentially expressed groundnut and A. flavus proteins during infection at 0, 30, 48 and 72 hpi. (A) Upregulated groundnut proteins between 4RNAi and WT controls; (B) Downregulated groundnut proteins between 4RNAi and WT controls; (C) Upregulated A. flavus proteins between treatments 4RNAi and WT controls; (D) Downregulated A. flavus proteins between 4RNAi and WT controls; Figure S4: Protein annotation and classification. All proteins identified at different time points were classified by GO terms based on their cellular component, molecular function, and biological process in, (A) Between controls and HIGS events, and (B) HIGS events, (C) WT controls. D-F. Functional classification of differentially expressed proteins in (D) Comparison of HIGS and control samples, (E) HIGS, (F) Control, based on map man bin codes; Table S1: List of primers used in this study; Table S2: Copy number of aflR gene in groundnut HIGS lines estimated by qPCR assay; Table S3: Transgene segregation in 4RNAi-HIGS lines in T1, T2, and T3 generations; Table S4: Sequence predicted siRNAs with 4RNAi-HIGS construct using pssRNAit; Table S5: Number of off-targets identified with 4RNAi-HIGS construct; Table S6: “si-Fi” predictions of nsdC, veA, ver1, & aflR Aspergillus flavus sequence; Table S7: Proteins up-regulated in A. flavus infected 4RNAi-HIGS lines expressing nsdC, veA, aflR, and aflM genes; Table S8: Proteins upregulated in WT controls showing upregulated proteins following infection with A. flavus; Table S9: Fungal proteins upregulated in Aspergillus flavus colonizing 4RNAi-HIGS lines expressing nsdC, veA, aflR, and aflM genes during infection; Table S10: Fungal proteins upregulated in Aspergillus flavus colonizing WT-genotype during infection.

Author Contributions

Conceptualization, P.B.-M. and K.K.S.; methodology, P.B.-M. and K.P.; software, K.Y.; data analysis, K.P., K.Y. and H.S.; writing—original draft preparation, P.B.-M., K.Y. and K.P.; writing—review and editing, K.Y., K.R., J.W.C., K.K.S. and P.B.-M.; visualization, K.P. and K.Y.; supervision, P.B.-M.; project administration, P.B.-M. and K.K.S.; funding acquisition: P.B.-M. and K.K.S. All authors have read and agreed to the published version of the manuscript.

Funding

This research was funded by the CGIAR through the Fund from its Donors to the CGIAR Research Program on Grain Legumes and Dryland cereals (CRP-GLDC).

Institutional Review Board Statement

Not applicable.

Informed Consent Statement

Not applicable.

Data Availability Statement

All data are presented in figures. The mass spectrometry proteomics data are deposited at the ProteomeXchange consortium via jPOSTrepo with the database identifier PXD028196.

Acknowledgments

PBM acknowledges the financial support from the CGIAR Research Program on Grain Legumes and Dryland Cereals (CRP-GLDC), supported by CGIAR Fund Donors.

Conflicts of Interest

The authors declare no conflict of interest.

References

  1. Amaike, S.; Keller, N.P. Aspergillus flavus. Ann. Rev. Phytopathol. 2011, 49, 107–133. [Google Scholar] [CrossRef] [PubMed]
  2. Antiga, L.; La Starza, S.R.; Miccoli, C.; D’angeli, S.; Scala, V.; Zaccaria, M.; Shu, X.; Obrian, G.; Beccaccioli, M.; Payne, G.A.; et al. Aspergillus flavus exploits maize kernels using an “Orphan” secondary metabolite cluster. Int. J. Mol. Sci. 2020, 21, 8213. [Google Scholar] [CrossRef] [PubMed]
  3. Wu, F.; Groopman, J.D.; Pestka, J.J. Public health impacts of foodborne mycotoxins. Annu. Rev. Food Sci. Technol. 2014, 5, 351–372. [Google Scholar] [CrossRef] [PubMed]
  4. Kumar, A.; Pathak, H.; Bhadauria, S.; Sudan, J. Aflatoxin contamination in food crops: Causes, detection, and management: A review. Food Prod. Proc. Nutr. 2021, 3, 17. [Google Scholar] [CrossRef]
  5. Bhatnagar-Mathur, P.; Sunkara, S.; Bhatnagar-Panwar, M.; Waliyar, F.; Sharma, K.K. Biotechnological advances for combating Aspergillus flavus and aflatoxin contamination in crops. Plant Sci. 2015, 234, 119–132. [Google Scholar] [CrossRef]
  6. Pandey, M.K.; Kumar, R.; Pandey, A.K.; Soni, P.; Gangurde, S.S.; Sudini, H.K.; Fountain, J.C.; Liao, B.; Desmae, H.; Okori, P.; et al. Mitigating aflatoxin contamination in groundnut through a combination of genetic resistance and post-harvest management practices. Toxins 2019, 11, 315. [Google Scholar] [CrossRef]
  7. Nigam, S.; Waliyar, F.; Aruna, R.; Reddy, S.; Kumar, P.L.; Craufurd, P.Q.; Diallo, A.T.; Ntare, B.R.; Upadhyaya, H.D. Breeding peanut for resistance to aflatoxin contamination at ICRISAT. Peanut Sci. 2009, 36, 42–49. [Google Scholar] [CrossRef]
  8. Arias, R.S.; Dang, P.M.; Sobolev, V.S. RNAi-mediated control of aflatoxins in peanut: Method to analyze mycotoxin production and transgene expression in the peanut/Aspergillus pathosystem. J. Vis. Exp. 2015, 106, e53398. [Google Scholar] [CrossRef]
  9. Sharma, K.K.; Pothana, A.; Prasad, K.; Shah, D.; Kaur, J.; Bhatnagar, D.; Chen, Z.Y.; Raruang, Y.; Cary, J.W.; Rajasekaran, K.; et al. Peanuts that keep aflatoxin at bay: A threshold that matters. Plant Biotechnol. J. 2018, 16, 1024–1033. [Google Scholar] [CrossRef]
  10. Thakare, D.; Zhang, J.; Wing, R.A.; Cotty, P.J.; Schmidt, M.A. Aflatoxin-free transgenic maize using host-induced gene silencing. Sci. Adv. 2017, 3, e1602382. [Google Scholar] [CrossRef]
  11. Caceres, I.; Al Khoury, A.; El Khoury, R.; Lorber, S.P.; Oswald, I.; El Khoury, A.; Atoui, A.; Puel, O.; Bailly, J.D. Aflatoxin biosynthesis and genetic regulation: A review. Toxins 2020, 12, 150. [Google Scholar] [CrossRef]
  12. Khan, R.; Ghazali, F.M.; Mahyudin, N.A.; Samsudin, N.I.P. Aflatoxin biosynthesis, genetic regulation, toxicity, and control strategies: A review. J. Fungi 2021, 7, 606. [Google Scholar] [CrossRef] [PubMed]
  13. Masanga, J.O.; Matheka, J.M.; Omer, R.A.; Ommeh, S.C.; Monda, E.O.; Alakonya, A.E. Downregulation of transcription factor aflR in Aspergillus flavus confers reduction to aflatoxin accumulation in transgenic maize with alteration of host plant architecture. Plant Cell Rep. 2015, 34, 1379–1387. [Google Scholar] [CrossRef] [PubMed]
  14. Raruang, Y.; Omolehin, O.; Hu, D.; Wei, Q.; Han, Z.-Q.; Rajasekaran, K.; Cary, J.W.; Wang, K.; Chen, Z.Y. Host induced gene silencing targeting Aspergillus flavus aflM reduced aflatoxin contamination in transgenic maize under field conditions. Front. Microbiol. 2020, 11, 754. [Google Scholar] [CrossRef]
  15. Power, I.L.; Faustinelli, P.C.; Orner, V.A.; Sobolev, V.S.; Arias, R.S. Analysis of small RNA populations generated in peanut leaves after exogenous application of dsRNA and dsDNA targeting aflatoxin synthesis genes. Sci. Rep. 2020, 10, 13820. [Google Scholar] [CrossRef] [PubMed]
  16. Omolehin, O.; Raruang, Y.; Hu, D.; Han, Z.-Q.; Wei, Q.; Wang, K.; Rajasekaran, K.; Cary, J.W.; Chen, Z.Y. Resistance to aflatoxin accumulation in maize mediated by host-induced silencing of the Aspergillus flavus alkaline protease (alk) gene. J. Fungi 2021, 7, 904. [Google Scholar] [CrossRef]
  17. Gilbert, M.K.; Majumdar, R.; Rajasekaran, K.; Chen, Z.-Y.; Wei, Q.; Sickler, C.M.; Lebar, M.D.; Cary, J.W.; Frame, B.R.; Wang, K. RNA interference-based silencing of the alpha-amylase (amy1) gene in Aspergillus flavus decreases fungal growth and aflatoxin production in maize kernels. Planta 2018, 247, 1465–1473. [Google Scholar] [CrossRef]
  18. Cary, J.W.; Harris-Coward, P.Y.; Ehrlich, K.C.; Mack, B.M.; Kale, S.P.; Larey, C.; Calvo, A.M. NsdC and NsdD affect Aspergillus flavus morphogenesis and aflatoxin production. Eukaryot. Cell 2012, 11, 1104–1111. [Google Scholar] [CrossRef]
  19. Calvo, A.M.; Bok, J.; Brooks, W.; Keller, N.P. veA is required for toxin and sclerotial production in Aspergillus parasiticus. Appl. Environ. Microbiol. 2004, 70, 4733–4739. [Google Scholar] [CrossRef] [PubMed]
  20. Price, M.S.; Yu, J.; Nierman, W.C.; Kim, H.S.; Pritchard, B.; Jacobus, C.A.; Bhatnagar, D.; Cleveland, T.E.; Payne, G.A. The aflatoxin pathway regulator AflR induces gene transcription inside and outside of the aflatoxin biosynthetic cluster. FEMS Microbiol. Lett. 2006, 255, 275–279. [Google Scholar] [CrossRef]
  21. Yu, J. Current understanding on aflatoxin biosynthesis and future perspective in reducing aflatoxin contamination. Toxins 2012, 4, 1024–1057. [Google Scholar] [CrossRef] [PubMed]
  22. Ahmed, F.; Senthil-Kumar, M.; Dai, X.; Ramu, V.S.; Lee, S.; Mysore, K.S.; Zhao, P.X. pssRNAit: A web server for designing effective and specific plant siRNAs with genome-wide off-target assessment. Plant Physiol. 2020, 184, 65–81. [Google Scholar] [CrossRef] [PubMed]
  23. Koch, A.; Wassenegger, M. Host-induced gene silencing–mechanisms and applications. New Phytol. 2021, 231, 54–59. [Google Scholar] [CrossRef]
  24. Nunes, C.C.; Dean, R.A. Host-induced gene silencing: A tool for understanding fungal host interaction and for developing novel disease control strategies. Mol. Plant Pathol. 2012, 13, 519–529. [Google Scholar] [CrossRef]
  25. Qi, T.; Guo, J.; Peng, H.; Liu, P.; Kang, Z.; Guo, J. Host-induced gene silencing: A powerful strategy to control diseases of wheat and barley. Int. J. Mol. Sci. 2019, 20, 206. [Google Scholar] [CrossRef] [PubMed]
  26. Baidya, S.; Duran, R.M.; Lohmar, J.M.; Harris-Coward, P.Y.; Cary, J.W.; Hong, S.Y.; Roze, L.V.; Linz, J.E.; Calvo, A.M. VeA is associated with the response to oxidative stress in the aflatoxin producer Aspergillus flavus. Eukaryot. Cell 2014, 13, 1095–1103. [Google Scholar] [CrossRef]
  27. Cary, J.; Ehrlich, K.; Wright, M.; Chang, P.-K.; Bhatnagar, D. Generation of aflR disruption mutants of Aspergillus parasiticus. Appl. Microbiol. Biotechnol. 2000, 53, 680–684. [Google Scholar] [CrossRef]
  28. Payne, G.; Nystrom, G.; Bhatnagar, D.; Cleveland, T.; Woloshuk, C. Cloning of the afl-2 gene involved in aflatoxin biosynthesis from Aspergillus flavus. Appl. Environ. Microbiol. 1993, 59, 156–162. [Google Scholar] [CrossRef]
  29. Chang, P.-K.; Scharfenstein, L.L.; Li, P.; Ehrlich, K.C. Aspergillus flavus VelB acts distinctly from VeA in conidiation and may coordinate with FluG to modulate sclerotial production. Fungal Genet. Biol. 2013, 58, 71–79. [Google Scholar] [CrossRef]
  30. Duran, R.M.; Cary, J.W.; Calvo, A.M. Production of cyclopiazonic acid, aflatrem, and aflatoxin by Aspergillus flavus is regulated by veA, a gene necessary for sclerotial formation. Appl. Microbiol. Biotechnol. 2007, 73, 1158–1168. [Google Scholar] [CrossRef]
  31. Power, I.L.; Dang, P.M.; Sobolev, V.S.; Orner, V.A.; Powell, J.L.; Lamb, M.C.; Arias, R.S. Characterization of small RNA populations in non-transgenic and aflatoxin-reducing-transformed peanut. Plant Sci. 2017, 257, 106–125. [Google Scholar] [CrossRef] [PubMed]
  32. Abdel-Hadi, A.M.; Caley, D.P.; Carter, D.R.; Magan, N. Control of aflatoxin production of Aspergillus flavus and Aspergillus parasiticus using RNA silencing technology by targeting aflD (nor-1) gene. Toxins 2011, 3, 647–659. [Google Scholar] [CrossRef] [PubMed]
  33. McDonald, T.; Brown, D.; Keller, N.P.; Hammond, T.M. RNA silencing of mycotoxin production in Aspergillus and Fusarium species. Mol. Plant Microbe Int. 2005, 18, 539–545. [Google Scholar] [CrossRef] [PubMed]
  34. Freeman, B.; Beattie, G. An overview of plant defenses against pathogens and herbivores. Plant Health Instr. 2008. [Google Scholar] [CrossRef]
  35. Görlach, A.; Bertram, K.; Hudecova, S.; Krizanova, O. Calcium and ROS: A mutual interplay. Redox Biol. 2015, 6, 260–271. [Google Scholar] [CrossRef]
  36. Millana Fañanás, E.; Todesca, S.; Sicorello, A.; Masino, L.; Pompach, P.; Magnani, F.; Pastore, A.; Mattevi, A. On the mechanism of calcium-dependent activation of NADPH oxidase 5 (NOX5). FEBS J. 2020, 287, 2486–2503. [Google Scholar] [CrossRef]
  37. Haslbeck, M.; Vierling, E. A first line of stress defense: Small heat shock proteins and their function in protein homeostasis. J. Mol. Biol. 2015, 427, 1537–1548. [Google Scholar] [CrossRef]
  38. Van Ooijen, G.; Lukasik, E.; Van Den Burg, H.A.; Vossen, J.H.; Cornelissen, B.J.; Takken, F.L. The small heat shock protein 20 RSI2 interacts with and is required for stability and function of tomato resistance protein I-2. Plant J. 2010, 63, 563–572. [Google Scholar] [CrossRef]
  39. Banzet, N.; Richaud, C.; Deveaux, Y.; Kazmaier, M.; Gagnon, J.; Triantaphylidès, C. Accumulation of small heat shock proteins, including mitochondrial HSP22, induced by oxidative stress and adaptive response in tomato cells. Plant J. 1998, 13, 519–527. [Google Scholar] [CrossRef]
  40. Liu, X.; Khajuria, C.; Li, J.; Trick, H.N.; Huang, L.; Gill, B.S.; Reeck, G.R.; Antony, G.; White, F.F.; Chen, M.-S. Wheat Mds-1 encodes a heat-shock protein and governs susceptibility towards the Hessian fly gall midge. Nat. Commun. 2013, 4, 2070. [Google Scholar] [CrossRef]
  41. Bhatnagar-Mathur, P.; Yogendra, K.; Parankusam, S.; Sanivarapu, H.; Prasad, K.; Lingampali, S.B.; Sharma, K.K. Comparative proteomics provide insights on the basis of resistance to Aspergillus flavus infection and aflatoxin production in peanut (Arachis hypogea L.). J. Plant Interact. 2021, 16, 494–509. [Google Scholar] [CrossRef]
  42. Dodds, P.N.; Rathjen, J.P. Plant immunity: Towards an integrated view of plant–pathogen interactions. Nat. Rev. Genet. 2010, 11, 539–548. [Google Scholar] [CrossRef] [PubMed]
  43. Kushalappa, A.C.; Yogendra, K.N.; Karre, S. Plant innate immune response: Qualitative and quantitative resistance. Crit. Rev. Plant Sci. 2016, 35, 38–55. [Google Scholar] [CrossRef]
  44. Pieterse, C.M.; Van der Does, D.; Zamioudis, C.; Leon-Reyes, A.; Van Wees, S.C. Hormonal modulation of plant immunity. Annu. Rev. Cell Dev. Biol. 2012, 28, 489–521. [Google Scholar] [CrossRef]
  45. Clevenger, J.; Marasigan, K.; Liakos, V.; Sobolev, V.; Vellidis, G.; Holbrook, C.; Ozias-Akins, P. RNA sequencing of contaminated seeds reveals the state of the seed permissive for pre-harvest aflatoxin contamination and points to a potential susceptibility factor. Toxins 2016, 8, 317. [Google Scholar] [CrossRef]
  46. Fountain, J.C.; Khera, P.; Yang, L.; Nayak, S.N.; Scully, B.T.; Lee, R.D.; Chen, Z.Y.; Kemerait, R.C.; Varshney, R.K.; Guo, B. Resistance to Aspergillus flavus in maize and peanut: Molecular biology, breeding, environmental stress, and future perspectives. Crop J. 2015, 3, 229–237. [Google Scholar] [CrossRef]
  47. Raffaele, S.; Vailleau, F.; Léger, A.; Joubès, J.; Miersch, O.; Huard, C.; Blée, E.; Mongrand, S.; Domergue, F.; Roby, D. A MYB transcription factor regulates very-long-chain fatty acid biosynthesis for activation of the hypersensitive cell death response in Arabidopsis. Plant Cell 2008, 20, 752–767. [Google Scholar] [CrossRef]
  48. Zhang, Y.L.; Zhang, C.L.; Wang, G.L.; Wang, Y.X.; Qi, C.H.; Zhao, Q.; You, C.X.; Li, Y.Y.; Hao, Y.J. The R2R3 MYB transcription factor MdMYB30 modulates plant resistance against pathogens by regulating cuticular wax biosynthesis. BMC Plant Biol. 2019, 19, 362. [Google Scholar] [CrossRef]
  49. Song, G.; Li, X.; Munir, R.; Khan, A.R.; Azhar, W.; Yasin, M.U.; Jiang, Q.; Bancroft, I.; Gan, Y. The WRKY6 transcription factor affects seed oil accumulation and alters fatty acid compositions in Arabidopsis thaliana. Physiol. Plant. 2020, 169, 612–624. [Google Scholar] [CrossRef]
  50. Choi, C.; Hwang, S.H.; Fang, I.R.; Kwon, S.I.; Park, S.R.; Ahn, I.; Kim, J.B.; Hwang, D.J. Molecular characterization of Oryza sativa WRKY 6, which binds to W-box-like element 1 of the Oryza sativa pathogenesis-related (PR) 10a promoter and confers reduced susceptibility to pathogens. New Phytol. 1015, 208, 846–859. [Google Scholar] [CrossRef]
  51. Jayashree, T.; Subramanyam, C. Oxidative stress as a prerequisite for aflatoxin production by Aspergillus parasiticus. Free Radic. Biol. Med. 2000, 29, 981–985. [Google Scholar] [CrossRef] [PubMed]
  52. Gao, X.; Kolomiets, M.V. Host-derived lipids and oxylipins are crucial signals in modulating mycotoxin production by fungi. Toxin Rev. 2009, 28, 79–88. [Google Scholar] [CrossRef]
  53. Laxalt, A.M.; Munnik, T. Phospholipid signalling in plant defence. Curr. Opin. Plant Biol. 2002, 5, 332–338. [Google Scholar] [CrossRef]
  54. Munnik, T.; Testerink, C. Plant phospholipid signaling: “In a nutshell”. J. Lipid Res. 2009, 50, S260–S265. [Google Scholar] [CrossRef]
  55. de Torres Zabela, M.; Fernandez-Delmond, I.; Niittyla, T.; Sanchez, P.; Grant, M. Differential expression of genes encoding Arabidopsis phospholipases after challenge with virulent or avirulent Pseudomonas isolates. Mol. Plant Microbe Interact. 2002, 15, 808–816. [Google Scholar] [CrossRef]
  56. Canavar, Ö.; Kaynak, M.A. Prevention of pre-harvest aflatoxin production and the effect of different harvest times on peanut (Arachis hypogaea L.) fatty acids. Food Addit. Contam. Part A 2013, 30, 1807–1818. [Google Scholar] [CrossRef] [PubMed]
  57. Garcia-Ruiz, H.; Szurek, B.; Van den Ackerveken, G. Stop helping pathogens: Engineering plant susceptibility genes for durable resistance. Curr. Opin. Biotechnol. 2021, 70, 187–195. [Google Scholar] [CrossRef]
  58. Yang, C.F.; Tsai, W.C. Calmodulin: The switch button of calcium signaling. Tzu Chi Med. J. 2002, 34, 15–22. [Google Scholar] [CrossRef]
  59. Zhang, J.; Zou, A.; Wen, Y.; Wei, X.; Liu, C.; Lv, X.; Ma, X.; Fan, G.; Sun, X. SlCML55, a novel Solanum lycopersicum calmodulin-like gene, negatively regulates plant immunity to Phytophthora pathogens. Sci. Hortic. 2022, 299, 111049. [Google Scholar] [CrossRef]
  60. Long, Q.; Xie, Y.; He, Y.; Li, Q.; Zou, X.; Chen, S. Abscisic acid promotes jasmonic acid accumulation and plays a key role in citrus canker development. Front. Plant Sci. 2019, 10, 1634. [Google Scholar] [CrossRef]
  61. Li, X.; Liu, Y.; He, Q.; Li, S.; Liu, W.; Lin, C.; Miao, W. A candidate secreted effector protein of rubber tree powdery mildew fungus contributes to infection by regulating plant ABA biosynthesis. Front. Microbiol. 2020, 11, 591387. [Google Scholar] [CrossRef] [PubMed]
  62. Ulferts, S.; Delventhal, R.; Splivallo, R.; Karlovsky, P.; Schaffrath, U. Abscisic acid negatively interferes with basal defence of barley against Magnaporthe oryzae. BMC Plant Biol. 2015, 15, 7. [Google Scholar] [CrossRef] [PubMed]
  63. Kusch, S.; Panstruga, R. mlo-based resistance: An apparently universal “weapon” to defeat powdery mildew disease. Mol. Plant Microbe Interact. 2017, 30, 179–189. [Google Scholar] [CrossRef]
  64. Rescher, U.; Gerke, V. Annexins-unique membrane binding proteins with diverse functions. J. Cell Sci. 2004, 117, 2631–2639. [Google Scholar] [CrossRef] [PubMed]
  65. Sun, K.; Schipper, D.; Jacobsen, E.; Visser, R.G.; Govers, F.; Bouwmeester, K.; Bai, Y. Silencing susceptibility genes in potato hinders primary infection with Phytophthora infestans at different stages. Hortic. Res. 2022, 9, uhab058. [Google Scholar] [CrossRef]
  66. He, X.; Huo, Y.; Liu, X.; Zhou, Q.; Feng, S.; Shen, X.; Li, B.; Wu, S.; Chen, X. Activation of disease resistance against Botryosphaeria dothidea by downregulating the expression of MdSYP121 in apple. Hortic. Res. 2018, 5, 24. [Google Scholar] [CrossRef] [PubMed]
  67. Nierman, W.C.; Yu, J.; Fedorova-Abrams, N.D.; Losada, L.; Cleveland, T.E.; Bhatnagar, D.; Bennett, J.W.; Dean, R.; Payne, G.A. Genome sequence of Aspergillus flavus NRRL 3357, a strain that causes aflatoxin contamination of food and feed. Genome Announc. 2015, 3, e00168-15. [Google Scholar] [CrossRef]
  68. Sharma, K.K.; Anjaiah, V. An efficient method for the production of transgenic plants of peanut (Arachis hypogaea L.) through Agrobacterium tumefaciens-mediated genetic transformation. Plant Sci. 2000, 159, 7–19. [Google Scholar] [CrossRef]
  69. Sharma, K.K.; Bhatnagar-Mathur, P. Peanut (Arachis hypogaea L.). In Methods in Molecular Biology Vol. 343: Agrobacterium Protocols, 2/e; Wang, K., Ed.; Humana Press Inc.: Totowa, NJ, USA, 2006; Volume 1, pp. 347–358. [Google Scholar]
  70. Reddy, D.S.; Bhatnagar-Mathur, P.; Cindhuri, K.S.; Sharma, K.K. Evaluation and validation of reference genes for normalization of quantitative real-time PCR based gene expression studies in peanut. PLoS ONE 2013, 8, e78555. [Google Scholar] [CrossRef]
  71. Livak, K.J.; Schmittgen, T.D. Analysis of relative gene expression data using real-time quantitative PCR and the 2−ΔΔCT method. Methods 2001, 25, 402–408. [Google Scholar] [CrossRef]
  72. Weng, H.; Pan, A.; Yang, L.; Zhang, C.; Liu, Z.; Zhang, D. Estimating number of transgene copies in transgenic rapeseed by real-time PCR assay with HMG I/Y as an endogenous reference gene. Plant Mol. Biol. Rep. 2004, 22, 289–300. [Google Scholar] [CrossRef]
  73. Mehan, V.; Ramakrishna, N.; Rao, R.; McDonald, D. Preharvest aflatoxin contamination of groundnuts subjected to terminal drought stress in postrainy season. Mycotoxin Res. 1995, 11, 103–109. [Google Scholar] [CrossRef] [PubMed]
  74. Reddy, K.; Reddy, C.; Muralidharan, K. Detection of Aspergillus spp. and aflatoxin B1 in rice in India. Food Microbiol. 2009, 26, 27–31. [Google Scholar] [CrossRef] [PubMed]
  75. Kumar, A.; Karre, S.; Dhokane, D.; Kage, U.; Hukkeri, S.; Kushalappa, A.C. Real-time quantitative PCR based method for the quantification of fungal biomass to discriminate quantitative resistance in barley and wheat genotypes to fusarium head blight. J. Cereal Sci. 2015, 64, 16–22. [Google Scholar] [CrossRef]
  76. Benjamini, Y.; Hochberg, Y. Controlling the false discovery rate: A practical and powerful approach to multiple testing. J. R. Stat. Soc. B Stat. Methodol. 1995, 57, 289–300. [Google Scholar] [CrossRef]
  77. Chou, K.-C.; Shen, H.-B. Plant-mPLoc: A top-down strategy to augment the power for predicting plant protein subcellular localization. PLoS ONE 2010, 5, e11335. [Google Scholar] [CrossRef]
  78. Okuda, S.; Watanabe, Y.; Moriya, Y.; Kawano, S.; Yamamoto, T.; Matsumoto, M.; Takami, T.; Kobayashi, D.; Araki, N.; Yoshizawa, A.C.; et al. jPOSTrepo: An international standard data repository for proteomes. Nucleic Acids Res. 2017, 45, D1107–D1111. [Google Scholar] [CrossRef]
  79. Lohse, M.; Nagel, A.; Herter, T.; May, P.; Schroda, M.; Zrenner, R.; Tohge, T.; Fernie, A.R.; Stitt, M.; Usadel, B. Mercator: A fast and simple web server for genome scale functional annotation of plant sequence data. Plant Cell Environ. 2014, 37, 1250–1258. [Google Scholar] [CrossRef]
Figure 1. Development of groundnut 4RNAi-HIGS lines. (A) Circular map of the 4RNAi binary vector used for groundnut transformation. (B) Linear representation of T-DNA region of the 4RNAi binary vector containing the constitutive enhanced cauliflower mosaic virus (d35S CaMV) promoter used for targeting the aflatoxin pathway genes. The hpRNA cassettes have inverted repeats of respective nsdC, veA, aflM, and aflR gene regions highlighted in purple, orange, red and green color respectively under control of the d35S CaMV promoter. LB left border; RB, right border. (C) PCR analysis using the 4RNAi primer pair to confirm the presence of 4RNAi genes (820 bp) and the primer pair specific for the PDK intron. (D) RT-PCR analysis of 4RNAi events. cDNA from HIGS and WT control were used to amplify the inserted transgene with amplicon sizes of 508 bp using the 4RNAi2 primer pair and primers specific for the endogenous gene (ADH3), (E) Relative transcript expression of A. flavus nsdC, veA, aflR, and aflM from infected 4RNAi lines and the WT control line. Quantitative RT-PCR of RNAs isolated from 48 hpi (hours post infection) samples used the A. flavus housekeeping gene, beta-tubulin, as the normalizer. Significant differences between HIGS and wild-type control plants were analyzed through Dunnett test: * p < 0.05; ** p < 0.01.
Toxins 15 00319 g001
Figure 2. Aspergillus growth and sporulation in groundnut control and HIGS 4RNAi lines at 72 h post-infection. (A) Screening for fungal colonization on cotyledons of 4RNAi B-10-7, 4RNAi-F-5-4, and WT controls. (B) Fungal load of A. flavus on cotyledons of T3 generation 4RNAi and their WT counterparts. (C) Aflatoxin content (ppb) in T1, T2, and T3 cotyledons of 4RNAi groundnut lines and untransformed WT controls at 72 hpi. Significant differences between HIGS and wild type control plants were analyzed through Dunnett test: ** p < 0.01.
Toxins 15 00319 g002
Figure 3. Clustering analysis of significantly differentially expressed proteins (DEPs) in groundnut cotyledons in response to A. flavus infection at 0, 30, 48, and 72 hpi. (A) Heat map and hierarchical clustering of groundnut proteins differentially expressed in control and HIGS samples at various time points; (B) Heat map and hierarchical clustering of A. flavus proteins differentially expressed in both control and HIGS samples at various time points; (C) Schematic showing the effect of RNAi silencing of nsdC, veA, aflR, and aflM genes on developmental genes and aflatoxin biosynthetic pathway regulatory and biosynthetic genes in HIGS and WT-control lines. The downregulated proteins in HIGS lines at 0, 30, 48, and 72 hpi are indicated as red (downregulated) squares.
Toxins 15 00319 g003
Figure 4. Relative expression of selected A. flavus genes that encode differentially expressed proteins in 4RNAi HIGS and WT lines. Quantitative RT-PCR of RNAs isolated from 48 hpi samples were normalized to the A. flavus beta-tubulin. Significant differences between HIGS and wild-type control plants were analyzed through Dunnett test: * p < 0.05; ** p < 0.01.
Toxins 15 00319 g004
Figure 5. Overview of the A. flavus–groundnut interaction showing proteins related to resistance in HIGS lines infected with A. flavus. Detailed information on these proteins is shown in Table 2 and Supplementary Table S7. Information on proteins related to calcium signaling (Table 2), heat shock proteins (Table 2), phytohormones (Table 2), transcription factors (Table 2), mitogen-activated protein kinase (MAPK), (Table S7), secondary metabolic pathway genes, lipoxygenase (LOX), glycerol-3-phosphate acyltransferase (GPAT), lysophosphatidyl acyltransferase (LPAT), phospholipase D (PLD), sphingolipid Δ-8 desaturase (SLD), ceramide kinase-related protein (CERKL), and phosphatidylserine decarboxylase proenzyme 1 (PISD-1) are presented in Table 2. While the upregulated and downregulated proteins at 0, 30, 48, and 72 hpi are indicated as green and red squares, the absent proteins are indicated as white squares.
Toxins 15 00319 g005
Figure 6. Relative expression of genes encoding differentially expressed proteins from 4RNAi HIGS lines and WT controls. Quantitative RT-PCR of RNAs isolated from 48 hpi samples were normalized to the A. flavus ADH3 and G6Pd housekeeping genes: calcium-dependent protein kinase (CDPK), cinnamyl alcohol dehydrogenase (CAD), cinnamic acid 4-hydroxylase (C4H), chalcone-flavanone isomerase (CFI), cationic peroxidase 2 (PNC), CDP-diacylglycerol-glycerol-3-phosphate 3-phosphatidyl transferase (H9L7), dihydroflavonol-4-reductase (DFR), lysophosphatidyl acyltransferase 5 (LPAT), sphingolipid Δ-8 desaturase (SLD), calmodulin, annexin, and syntaxin. Significant differences between resistant and susceptible plants were analyzed through Dunnett test: * p < 0.05; ** p < 0.01.
Toxins 15 00319 g006
Table 1. Differential expression of A. flavus developmental and aflatoxin biosynthetic pathway-related proteins observed during pathogenesis in 4RNAi-HIGS lines compared to WT controls.
AccessionMass (kDa)Protein Name0 h30 h48 h72 h
A. Fungal differentiation, development, and pathogenicity
P60204; P6020517.01Calmodulin −46.44
A0A1R3RGK427.39Ochratoxin biosynthesis cluster transcription factor 19.16
A2QK8234.97Probable pectinesterase A 77.76
Q2UNJ037.39Chitin synthase export chaperone −14.57
Q5B8Y3; Q2UQ3437.54Eukaryotic translation initiation factor 3 subunit I −35.84
Q1XGE2; Q8TFU837.79Transcriptional activator hacA −23.18
Q5ATQ339.87Endopolygalacturonase AN8327 −26.66
Q5AQJ139.94Probable pectin lyase D 21.05
C8VDI240.83Autophagy-related protein 3 1.9513.92
A1CLZ141.63Diels-Alderase ccsF 13.77
C8VQG9; Q6TLK543.31Secondary metabolism regulator laeA −10.42
Q2U6D545.27Autophagy-related protein 18 11.70
A2QMH155.14Kynurenine 3-monooxygenase 2 −11.03
Q1273056.63Protein disulfide-isomerase −10.25
Q5B9G556.87Mannitol 2-dehydrogenase 72.84
B0Y7U1; Q4WMR058.54Probable feruloyl esterase B-2 −15.05
P2829860.49Isocitrate lyase2.21 37.51
A1DG3766.19Autophagy-related protein 22-1 −22.5722.77
A1CEH469.49Vacuolar fusion protein mon1 83.61
Q1206270.39Versicolorin B synthase −30.71
Q9HFB3; Q96UW071.31pH-response transcription factor pacC/RIM10110.99 −16.96
Q2UB5680.15Sorting nexin mvp1−12.61
B8NBX484.06Cell pattern formation-associated protein stuA −12.90
P2094589.34Conidiophore development regulator abaA −2.64−11.04
Q9R1S893.36Calpain-712.10
Q92197101.78Chitin synthase C 20.18
Q4WPF2106.42Serine/threonine-protein kinase atg1 −1.57−12.29
Q00078123.26Protein kinase C-like −4.39−17.63
B. Aflatoxin biosynthetic pathway
Q8TGA121.22Fatty acid synthase beta subunit (aflB) 2.15
P5016128.15Versicolorin reductase 1 (aflM) −4.26
B9WYE638.87Versiconal hemiacetal acetate reductase (vrdA) −1.90
B8NUL8; Q2U4H246.30Lipoyl synthase_ mitochondrial (aflA) −1.67−3.75
O4271647.63Aflatoxin cluster transcriptional coactivator (aflS) −5.71
P5295747.25Sterigmatocystin biosynthesis regulatory protein (aflR) −2.01
P0C1B3; P3029255.32Alpha-amylase A type-1/2 (amy1) 2.82
Q6UEF355.48FAD-binding monooxygenase (aflW) −1.75−9.20
Q6UEG255.65Cytochrome P450 monooxygenase (aflN) 2.74
Q6UEF156.06Oxidoreductase (AflY)−2.50
Q6UEH456.23Cytochrome P450 monooxygenase (aflU) −8.42
Q9UW9556.73Versicolorin B desaturase (aflL) −3.79
Q6UEF456.73Cytochrome P450 monooxygenase (aflV) −3.92
Q5BBM157.79Sexual development regulator (velC) −3.47
O1334560.47O-methyl sterigmatocystin oxidoreductase (aflQ) −3.46
E9RCK463.20Developmental and secondary metabolism regulator (veA)−2.21 −2.44
Q1206270.38Versicolorin B synthase (AflK) −30.71
Q8TGA1212.26Fatty acid synthase beta subunit (aflB) −1.71
Q12053232.94Norsolorinic acid synthase (aflC) −7.06
Table 2. Resistance-related proteins identified in the 4RNAi transgenic lines in groundnut A. flavus infection.
AccessionMassDescriptionFold Change against WT Control
0 h30 h48 h72 h
Heat shock proteins and calcium signaling-related proteins
B4UW5114.52Class II small heat shock protein Le-HSP17.6 2.50
B4UW8918.10Heat shock protein 21.97 2.50
E3NYT219.04Heat shock protein 70 3.62
A0A068VVA224.85Ca2+ hinding-protein SOS3 2.142.27
E7CQA140.70Heat shock transcription factor A-2 2.10
V5M2Y861.53Calcium-dependent protein kinase 2.285.94
Phytohormones
Q5QET38.39Auxin-induced putative CP12 domain-containing protein 2.40
Q5QET89.69Auxin-induced putative aldo/keto reductase family protein 4.44
B4UW7712.57Gibberellin-regulated protein 1.611.94
E3NYH514.39S-adenosyl methionine synthase 2.003.04
M4TG0230.48Auxin signaling F-box 3 3.38
A0A023IUN133.82Abscisic acid 8-hydroxylase 3 8.95
D7RJM339.89S-adenosylmethionine decarboxylase proenzyme 2.02
K0FB3345.18Ethylene-responsive element binding factor 6 2.03
G4X5C748.26ABA response element binding protein 1 2.8612.57
U6NJF1; K4PM2455.28ABA 8′-hydroxylase4.353.19
Transcription factors
V5T7X78.47Putative MYB-related protein 25 5.331.86
M4SZY922.35Ethylene-responsive transcription factor1.642.03 66.16
V5T7W622.51Putative R2R3 MYB protein 8 2.10
A0A0H3Y99124.02Wuschel-related homeobox 13B1 3.00
A0A0H3Y7V824.25Wuschel-related homeobox 13A1.78
E4W7V324.80Putative DREB transcription factor1.91 9.65
M4SZZ424.80Nuclear transcription factor Y subunit A-3 2.03
M4T2P825.06F-box family protein 62.55
V5T68425.58Putative R2R3 MYB protein 91.55 2.40
V5T6N427.20Putative R2R3 MYB protein 14.73
A0A1L1VTR532.84MYB-like transcript factor 6 3.73
V5T7W933.01Putative MYB-related protein 14 7.39
V5T68833.56Putative MYB-related protein 16 1.584.19
J9Q9Z833.74Ethylene-responsive element binding factor 3 24.1770.87
V5T6Q534.36Putative MYB-related protein 28 1.91
K0FBW334.41Ethylene-responsive element binding factor 46.26 3.14
V5T8I235.73Putative R2R3 MYB protein 7 1.85 2.21
V5T71436.32Putative MYB-related protein 22 2.66
C6EU6737.94NAC-like transcription factor 3 2.204.28
V5T7Y138.12Putative MYB-related protein 30 1.654.50
C6EU6839.37NAC-like transcription factor1.67 2.624.04
B5AK5339.67WRKY transcription factor 15 12.15
V5T8I448.21Putative MYB-related protein 131.60 1.99
Fatty acids
D3YM7714.28Acyl carrier protein 3.9229.37
A0A0A6ZDY115.56Peptidyl-prolyl cis-trans isomerase 2.562.96
N1NKF715.99Glycerol-3-phosphate dehydrogenase 22.47
A0A0A6ZDP120.10Glyceraldehyde-3-phosphate dehydrogenase C2 2.043.26
B4UW5724.67Putative dihydroflavonol reductase1.67
B4UW4926.61Putative lipase 1.58
B4UWB926.79Lipoxygenase 1 7.97
A0A0U3E0B127.41Phosphatidyl inositol phosphate kinase 1.984.68
D8KXY541.11Malonyl-CoA:ACP transacylase 1-1 3.86
A0A384QWC243.91Acyl-[acyl-carrier-protein] desaturase 2.881.866.09
A0A3G0YUC844.36Lysophosphatidyl acyltransferase 55.40 3.901.82
A0A384QZQ345.64Palmitoyl-monogalactosyldiacylglycerol delta-7 desaturase 1.976.01
N1NG0648.153-ketoacyl-CoA synthase 1.673.48
N1NFY748.58Putative ceramide kinase-related protein 3.18
A0A0R4UXQ148.863-ketoacyl-CoA thiolase 4.58
A0A0R4VXV150.46Phosphatidylserine decarboxylase proenzyme 1 3.59
E6Y9A750.47Beta-ketoacyl-ACP synthetase I1.67 5.86
A0A384QZP952.49Sphingolipid delta8 desaturase2.292.222.399.71
A0A0K0K9Q653.75Glyceraldehyde-3-phosphate dehydrogenase1.82 3.873.85
A0A0R4UXP756.05Glycerol-3-phosphate acyltransferase 63.252.53
A0A385I5T057.543-ketoacyl-CoA synthase2.36
A0A109Z9U275.55Long chain acyl-CoA synthetase 11.51 2.02
F1AM7079.43Triacylglycerol lipase 1 1.65
A0A0R4VUF191.12Digalactosyldiacylglycerol synthase 12.61
Q2HWT791.27Phospholipase D2.63 4.15
Q4JME697.76Lipoxygenase1.639.883.433.36
Table 3. Susceptibility-associated proteins identified in transgenic 4RNAi groundnut lines infected with Aspergillus flavus.
AccessionMassDescriptionChange against WT
at Different Times after Infection (In Folds)
0 h30 h48 h72 h
E2DQY98.92Heat shock protein DnaJ −2.57−3.69
B4UW9012.43Heat shock protein 3 −1.58
B1PMD113.50Zinc finger protein ZFP133 −1.87
Q6R2U616.64Calmodulin −3.33
Q06H3917.10Syntaxin−2.05−1.93 −4.02
B4UWB222.09Kunitz trypsin inhibitor 4 −1.64
B4UW9125.92Putative heat shock protein 4 −1.53−11.67−3.21
V5T7W327.81Putative R2R3 MYB protein 3 −1.63−2.60
E3NYG828.02Zinc finger protein, ZAT10-like −3.51
V5T6P828.83Putative MYB-related protein 18−1.85−2.49−1.71
B5AK5230.03NAC-like transcription factor 2 −5.56−4.30
V5T69232.43Putative MYB-related protein 21 −1.51−5.59
V5T8J432.74Putative MYB-related protein 29 −1.83−2.05
B2ZHY334.34NAC-like transcription factor −1.83−1.68
A0A0F6VX6336.25Annexin −6.26
V5T7X237.51Putative MYB-related protein 20 −3.00−2.97
K0FAV241.50Ethylene-responsive element binding factor 1 −2.31−2.70−2.52
D8KXZ741.53Enoyl-ACP reductase 1–2 −2.00−6.41
E6Y9A852.10Chloroplast omega-6 fatty acid desaturase−2.96−1.63−1.95
A0A290G01056.63MLO-like protein −1.60−3.82
A0A385I5T057.543-ketoacyl-CoA synthase −2.16
B4YA1258.21Calcium calmodulin-dependent protein kinase −2.28
D8KXZ059.54Beta-ketoacyl-ACP synthase II-1 −41.34
Q70KY067.369-cis-epoxy carotenoid dioxygenase −1.89−7.53
A0A109QJM575.06Long chain acyl-CoA synthetase 4 −12.32
N1NFY2105.41Putative Zinc finger_ C3HC4 type (RING finger) −7.70
Disclaimer/Publisher’s Note: The statements, opinions and data contained in all publications are solely those of the individual author(s) and contributor(s) and not of MDPI and/or the editor(s). MDPI and/or the editor(s) disclaim responsibility for any injury to people or property resulting from any ideas, methods, instructions or products referred to in the content.

