Article

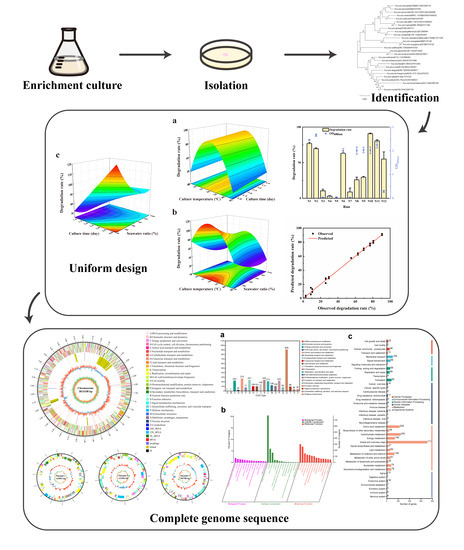
Isolation and Optimization of Aflatoxin B1 Degradation by Uniform Design and Complete Genome Sequencing of Novel Deep-Sea Kocuria rosea Strain 13

1
School of Environment, Harbin Institute of Technology, Harbin 150090, China
2
School of Marine Science and Technology, Harbin Institute of Technology (Weihai), Weihai 264209, China
3
Key Laboratory of Marine Genetic Resources, Third Institute of Oceanography, Ministry of Natural Resources of PR China, Xiamen 361005, China
4
State Key Laboratory Breeding Base of Marine Genetic Resources, Xiamen 361005, China
5
Key Laboratory of Marine Genetic Resources of Fujian Province, Xiamen 350002, China
6
Southern Marine Science and Engineering Guangdong Laboratory (Zhuhai), Zhuhai 519080, China
*
Author to whom correspondence should be addressed.
Toxins 2023, 15(9), 520; https://doi.org/10.3390/toxins15090520
Submission received: 10 July 2023 / Revised: 17 August 2023 / Accepted: 22 August 2023 / Published: 24 August 2023
(This article belongs to the Collection Aflatoxins)

Abstract

:
Aflatoxin B1 is a natural carcinogenic mycotoxin. The biological detoxification of aflatoxin could result in less environmental pollution, more moderate conditions, and less impact on food and feed, and be more convenient than physical and chemical methods. In this study, strain 13 with aflatoxin B1 degradation activity (67.47 ± 1.44%) was isolated and identified as Kocuria rosea. A uniform design was applied to optimize the degradation activity using a software Data Processing System, and a quadratic polynomial stepwise regression model was selected to investigate the relationships between the degradation rate and five independent variables. Furthermore, the optimal degradation conditions (culture temperature of 30 °C, culture time of 4.2 days, seawater ratio of 100%, pH of 7.11, and inoculation dosage of 0.09%) were verified with a degradation rate of 88 ± 0.03%, which was well matched with the predicted value (92.97%) of the model. Complete genome sequencing of Kocuria rosea, conducted with a combination of Illumina and single-molecule real-time sequencing, was used to analyze the genomic features and functions of the strain, which were predicted by the annotation based on seven databases, and may provide insights into the potential of Kocuria rosea, as well as providing a reference for degradation gene and protein mining. These results indicate that Kocuria rosea strain 13 has the ability to degrade aflatoxin B1 efficiently, and it also has the potential to provide aflatoxin-degrading enzymes.
Key Contribution: Kocuria rosea strain 13, isolated from the deep sea, could degrade aflatoxin B1 efficiently and be a source of aflatoxin-degrading enzymes.

Graphical Abstract

1. Introduction

Aflatoxins (AFs) are derivatives of dihydrofuranoxanadione; they have one benzopyrone and one difuran ring and are mainly produced by the genera of Aspergillus [1]. Naturally occurring aflatoxins classified as Group 1 have been evaluated by the International Agency for Research on Cancer (IARC) of the World Health Organization and are regarded as carcinogenic to humans [2]. The most carcinogenic aflatoxin is aflatoxin B1 (AFB1), and it has been found that the consumption of food contaminated with AFB1 causes immune suppression, deformity, gene mutagenesis, and carcinogenesis [3,4]. McMillan et al. reported that, when humans are exposed to AFB1 at a dose of 20–120 µg/kg body weight per day for 1–3 weeks, acute aflatoxin poisoning occurs, which can cause abdominal pain, emesis, and even death [5,6].
McMillan et al. stated that even chronic aflatoxin intoxication could cause hepatic carcinoma [6]. Therefore, knowing how to prevent and degrade aflatoxins to avoid exposure to humans and animals has become an increasingly urgent need due to the seriousness of aflatoxin toxicity, the widespread contamination of agricultural products, and the strictness of international standards of AFB1 in food and feed.
Physical methods of AFB1 detoxification require complex and strict operating conditions, such as heating at high temperatures [7], adsorbing with sodium bentonite [8] and smectite [9], optical radiation with ultraviolet light [10], gamma radiation [11], and light pulses [12]. Moreover, chemical methods, such as citric acid [13], ozone [14], ammonia gas, or alkali refining [15], might irreversibly change the composition and flavor of the food. Both physical and chemical methods might cause loss of sensory and nutritional value of food and feed, and be difficult to use on a large scale.
However, biological methods could have less environmental pollution, more moderate conditions, less impact on food and feed, and more convenience than physical and chemical methods. The biological detoxification of aflatoxin mainly includes plant extract detoxification, biosorption, bacterial degradation, and fungal degradation. Regarding plant extract detoxification, horse radish peroxidase from groundnut [16], seed extracts from the medical plant Trachyspermum ammi (L.) Sprague ex turrill [17], and leaf extracts from Adhatoda vasica Nees [18] have been reported to have an excellent degradation capacity to aflatoxins. For biosorption, Lactobacillus strains can bind aflatoxins with peptidoglycans on cell walls [19], and glucans with the helical molecular structure on cell walls of Saccharomyces cerevisiae can form a specific complementary structure when binding with AFB1 [20]. However, biosorption might be reversible and cannot essentially destroy the chemical structure of toxins. Therefore, bacterial degradation and fungal degradation have been studied to reduce toxicity permanently. There has been an increasing number of bacteria capable of aflatoxin degradation; they mainly belong to the phyla of Actinobacteria [21], Firmicute [22,23], Proteobacteria [24], Bacteroidetes [25], and Myxococcota [26]. Apart from single-strain degradation, it has also been reported that a microbial consortium can also degrade AFB1 with dominant strains, including Geobacillus and Tepidimicrobium [27]. Additionally, F420H2 from Mycobacterium smegmatis [28], extracellular enzymes from Myxococcus fulvus [26] and Bacillus subtilis [29], and intracellular enzymes from Rhodococcus rhodochrous [30] have been shown to have the ability to degrade AFB1. Moreover, AFB1-degrading enzymes have also been isolated from fungi [31], such as laccase from Trametes versicolor [32], Mn peroxidase from Pleurotus ostreatus [33], Phanerochaete sordida [34], or Cladosporium uredinicola [35], and enzymes from Aspergillus niger [36].
Most AFB1-producing and AFB1-degrading microorganisms are isolated from soil, plants, food, feed, crops [37], or animal waste [38]. However, there might be unknown aflatoxin-control microorganisms in the marine environment, since it has been reported that Emericella venezuelensis, which can produce aflatoxin, originated from the sea [39]. There has only been one aflatoxin-inhibiting strain from the deep sea reported so far that could inhibit the growth of aflatoxigenic fungi hypha and the generation of AFB1 [40]; nevertheless, no strains with AFB1 degradation properties from the deep sea have been elucidated. In this study, AFB1-degrading strain 13 was isolated from the deep sea and identified as Kocuria rosea. Additionally, degradation conditions were optimized through uniform design (UD), and a quadratic polynomial stepwise regression model was selected. Moreover, the complete genome of strain 13 was sequenced, and genome annotations were analyzed to gain insights into the genome functions of the strain.

2. Results and Discussion

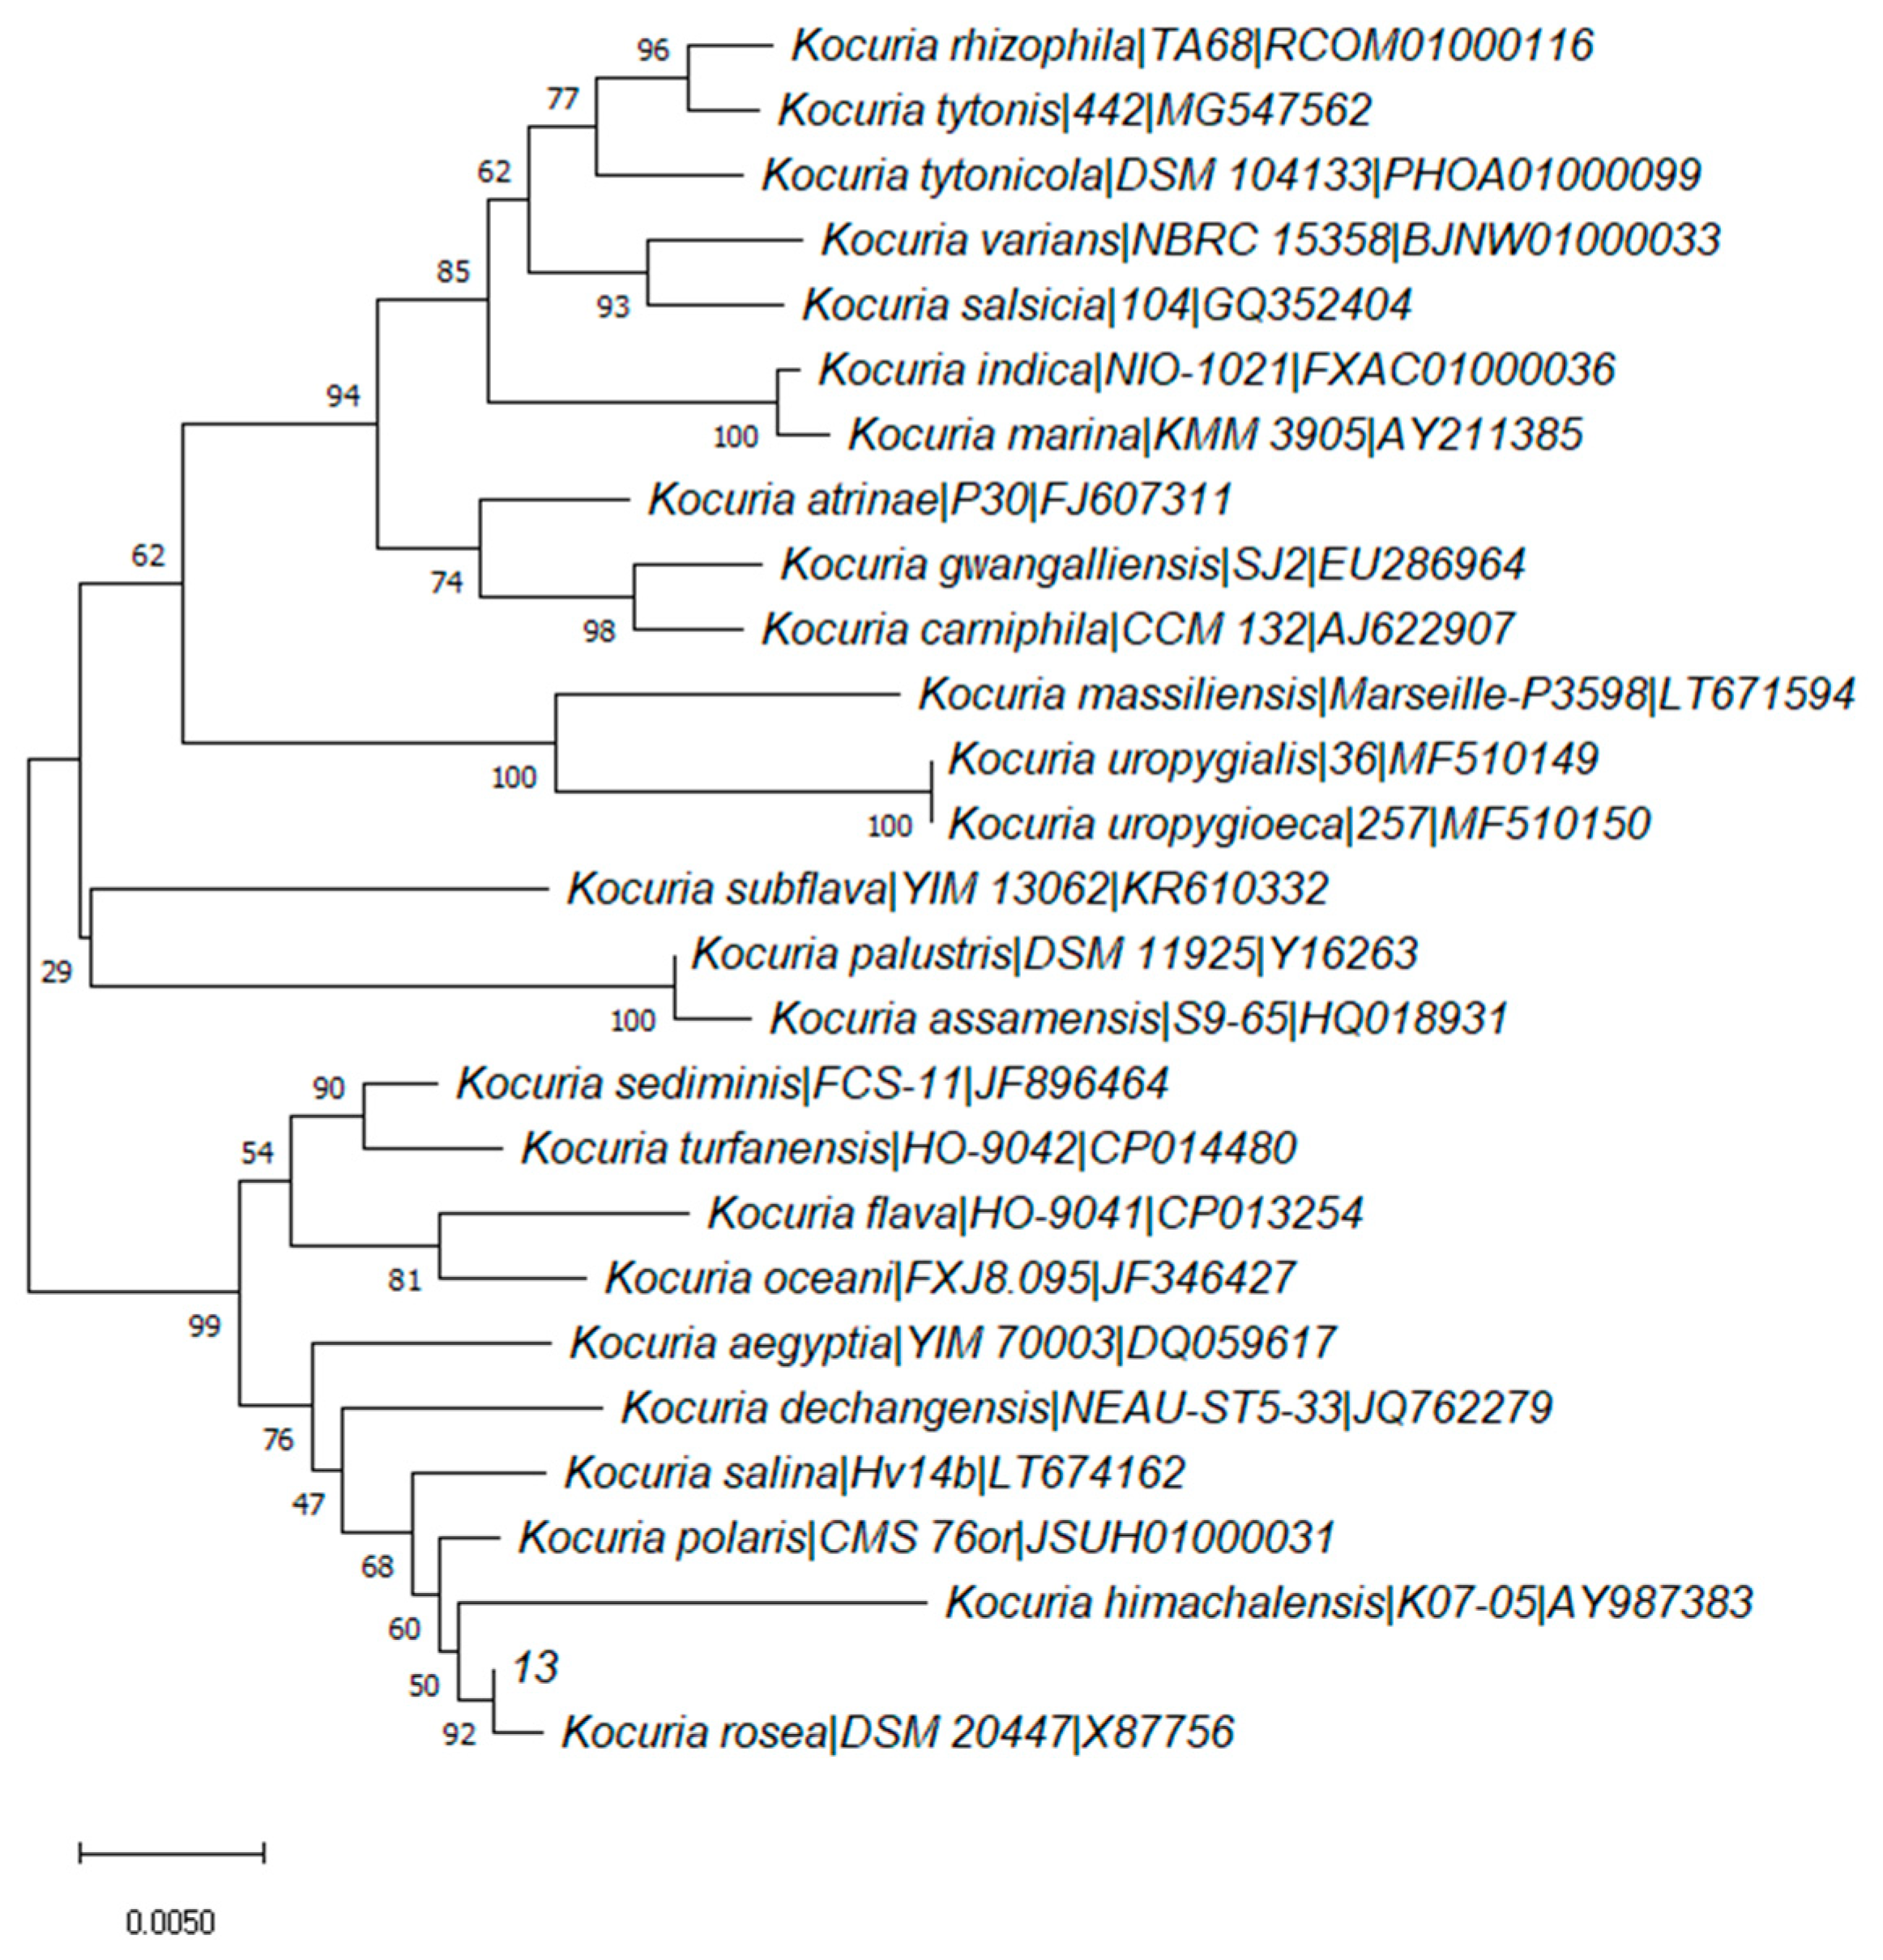
2.1. Screening and Identification of Degrading Strain 13

The strains were isolated from the colonies, and it was shown that strain 13 could degrade aflatoxin B1 with a rate of 67.47 ± 1.44% (with a culture temperature of 28 °C, culture time of 7 days, seawater ratio of 100%, pH of 7.52, and inoculation dosage of 1%) as optical density in 600nm (OD600nm) reached the value of 0.949 ± 0.016. The strain was identified according to a phylogenetic tree (Figure 1) by 16S rRNA gene sequencing, which shows the relationship of strain 13 between Kocuria species with other related strains. The similarity of strain 13 with type stain Kocuria rosea DSM 20447 was 99.65%, which indicates that stain 13 could be identified as Kocuria rosea.
The biological functions of Kocuria rosea strains were discovered, including the biosorption and biomineralization of U (VI) [41], dyes degradation and decolorization (methyl orange, amido black, methyl violet, cotton blue, and malachite green) [42,43], phenol biodegradation [44], Keratin hydrolysis [45], trinitrotoluene detoxification [46], and polyaromatic hydrocarbons degradation [47,48,49]. Naphthalene, anthracene, phenanthrene, fluorene, and pyrene, degraded by Kocuria rosea, have at least two benzene rings and have a similar structure with aflatoxin B1, which indicates that Kocuria rosea strains have the potential to degrade substances containing benzene ring structures.

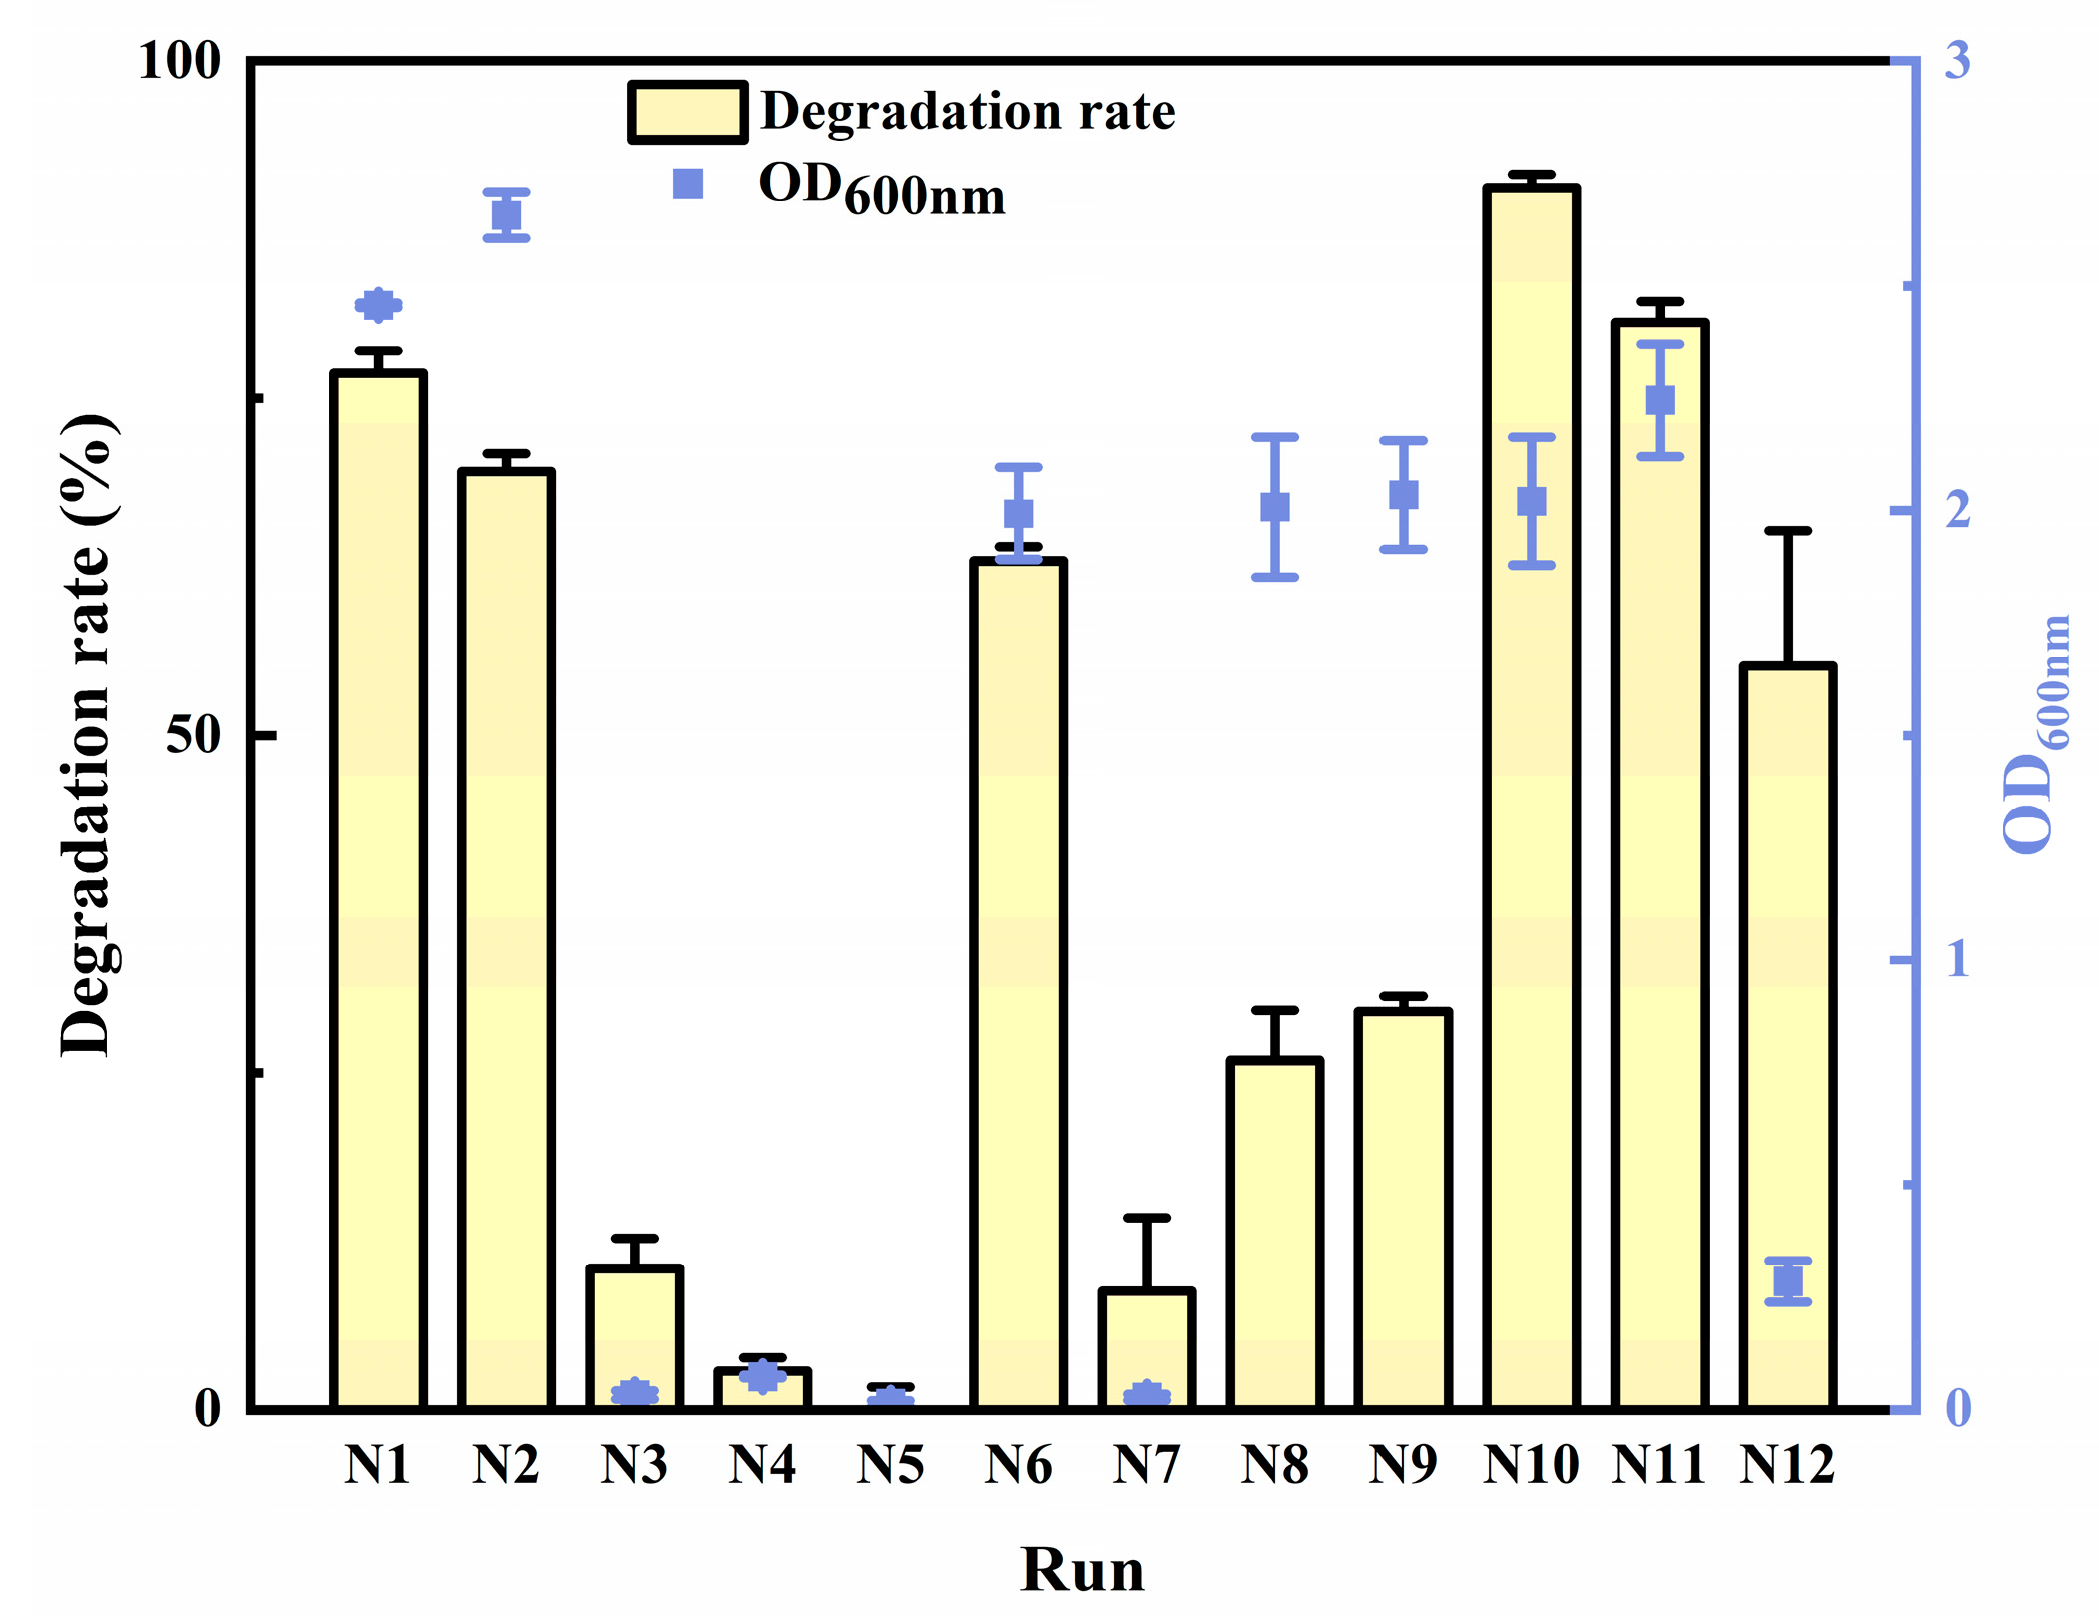
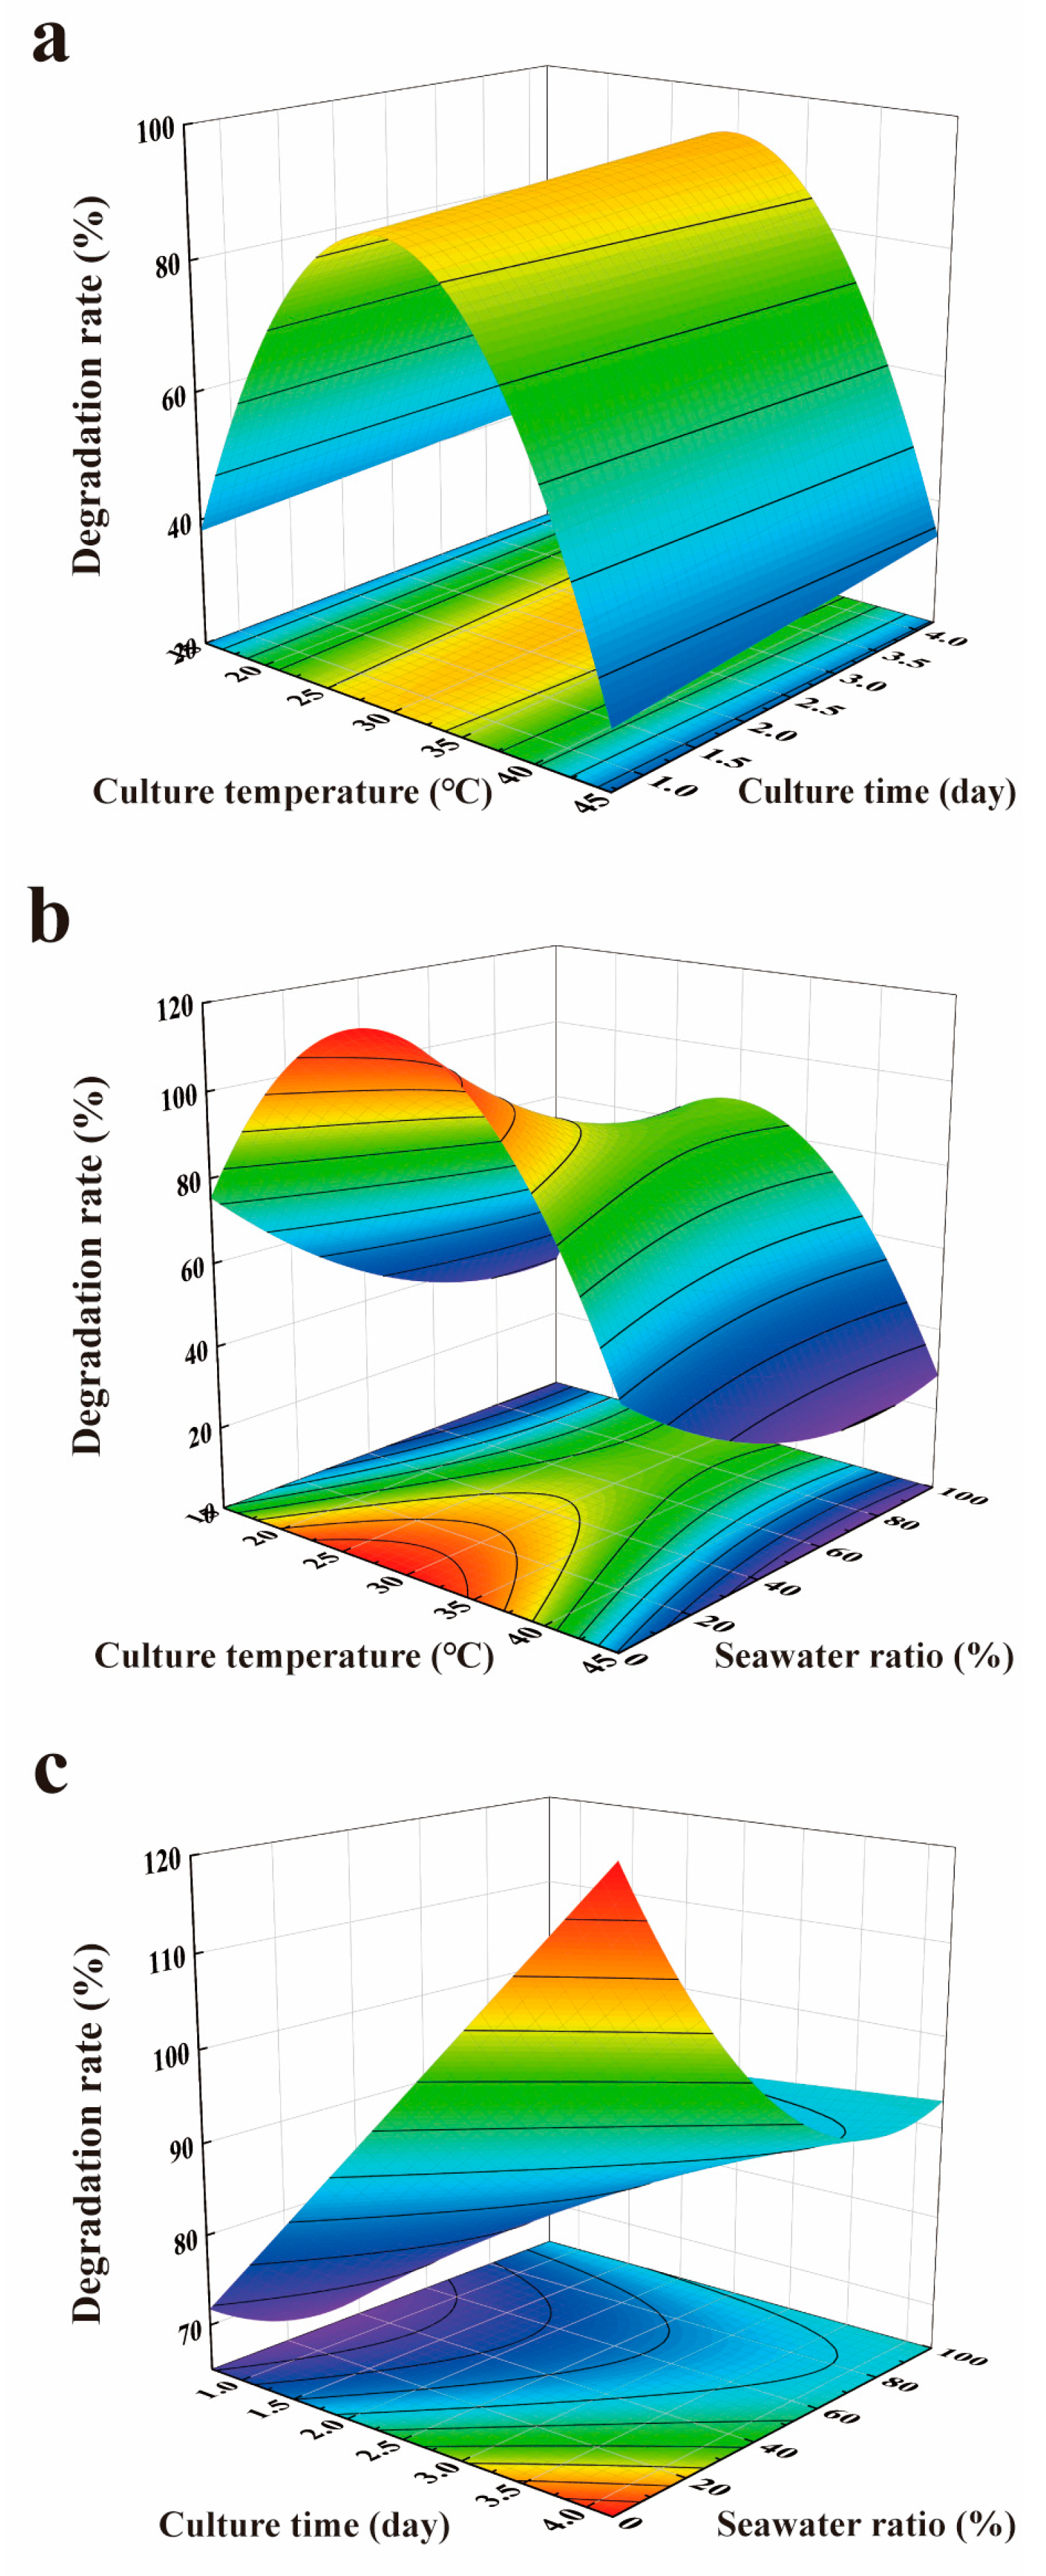
2.2. Optimization for AFB1 Degradation

The results of the degradation rate from UD are shown in Figure 2. It was demonstrated that the degradation rate of N1, N2, N6, N10, and N11 with relatively high OD600nm was over 60%. In order to select the model with a significant fitting effect, three types of quadratic polynomial mathematical models were evaluated and compared with the four parameters outlined in Table 1. The adjusted coefficient of determination ( R 2 a d j ) represents the correlation between the observed values and the predicted values [50]. The closer R 2 a d j is to 1, the better the fitting effect achieved is. Root mean square error (RMSE) represents the differences between predicted and observed values and the precision of the predicted model [51,52]. Akaike’s information criterion (AIC) was derived from an asymptotic approximation to the Kullback−Leibler divergence between the true distribution and the model, and the Bayesian information criteria (BIC) derived from the dominant terms in the Laplace approximation to the logarithm of the Bayes factor with a vague prior [53]. Both AIC and BIC are two parameters commonly used for model selection, which were first introduced by Akaike [54] and Schwarz [55], respectively. However, the AIC assumes that the true model is not considered in all models, but the BIC assumes that the true model is one of the models [56]. The smaller the values of RMSE, AIC, and BIC of the models, the better the fitting effects which were demonstrated for the models were. The R2 of the quadratic polynomial stepwise regression model and stepwise regression model with multiple factors and interaction terms were much closer to one compared to the multivariate and squared stepwise regression model. Moreover, the RMSE, nAIC, and BIC of the quadratic polynomial stepwise regression model were the minimums in the three models. Therefore, it was indicated that the quadratic polynomial stepwise regression model had a better fitting effect than the other two models.
The factors x2 × x3 and x2 × x2 in the quadratic polynomial stepwise regression model were removed for values of p greater than 0.05, which were 0.2404 and 0.2778, respectively. The formula of the model was generated as follows:
y = −1.349215599 + 0.13944838956 × x1 + 0.14664813874 × x2 − 0.003747153031 × x3 − 0.09323861795 × x5 −
0.0024620583619 × x1 × x1 + 0.00004951779435 × x3 × x3 + 0.009992701258 × x5 × x5 + 0.00023994501902 × x1
× x2 + 0.00005070750598 × x1 × x3 − 0.0014264859734 × x2 × x3
where y represents the degradation rate (%); x1 represents the culture temperature (°C); x2 represents the culture time (days); x3 represents the seawater ratio (%); x4 represents pH; and x5 represents the inoculation dosage (%).
Multi-way analysis of variance (ANOVA) (Table 2) was applied in model evaluation, showing that the p-value was below 0.05, which indicated the great predictive ability of the model. The correlation coefficient (R), determinate coefficient (R2), and adjusted determinate coefficient (adj. R2) of the equation were 0.999, 0.999998, and 0.99978, respectively, which also indicated that the model could well reflect the relationship among culture temperature, culture time, seawater ratio, pH, and inoculation dosage. The relationship between the predicted values and observed values of the degradation rate are also confirmed in Figure 3, which shows that most points were distributed along a straight line, indicating that the predicted values and observed values were very close. Furthermore, a two-way ANOVA and multiple comparisons of least significant difference (LSD) for the predicted value and observed value were performed, demonstrating that the observed value of three replications (p = 0.988, 0.851, and 0.865 > 0.5) had no significant differences from the predicted value. Therefore, the quadratic polynomial stepwise regression model effectively estimated the degradation rate of strain 13 cultured under different conditions.
Parameter estimation and significance test of the model were performed. It was shown that the p-values of the ten factors were all less than 0.05, indicating that these ten factors significantly affected the degradation rate (Table 3). According to standard regression coefficients, factors x1, x3 × x3, x2, x1 × x3, x5 × x5, and x1 × x2 had, in descending order, significant positive effects on the degradation rate. Additionally, factors x1 × x1, x2 × x3, x3, and x5 had, in descending order, significant negative effects on the degradation rate. The predicted model for interaction terms varying within the experimental range was visualized through response surface plots and contour plots, and other variables remained at the optimal level (Figure 4). The optimal temperature was 30 °C no matter what the culture time and seawater ratio was, as shown in Figure 4a,b. The contribution of x1 (standard regression coefficient) to the equation was 4.86; however, the contribution of x1 × x2 and x1 × x3 was only 0.03 and 0.20, respectively (Table 3), which explained that x1 had a more significant influence in x1 × x2 and x1 × x3 than x2 and x3 (Figure 4a,b). It was also indicated that culture temperature had the most significant impact on the degradation rate compared to other factors (Table 3). Moreover, although x2 × x3 had an extremely negative effect (p < 0.01) on the degradation rate with a standard regression coefficient of −0.50, x2 had a significantly positive effect (p < 0.01) with a standard regression coefficient of 0.55. Consistently, it was observed that higher culture time was beneficial to the degradation rate (Figure 4c).
The optimal degradation conditions were predicted as a culture temperature of 30 °C, culture time of 4.2 days, seawater ratio of 100%, pH of 7.1094, and inoculation dosage of 0.0899%, with a degradation rate of 92.97%. Additionally, the confirmation experiments showed that the degradation rate was 88 ± 0.03%. Furthermore, the results of the single-sample t-test (t = −2.845; p = 0.105 > 0.05) showed that the original hypothesis (H0: µ = 92.97%) could not be rejected, which demonstrated that there were no significant differences between the predicted value and observed value.

2.3. General Genomic Features of Strain 13

To better understand the AFB1 degradation mechanisms of strain 13, the complete genome of strain 13 was sequenced and mined. A graphical circular genome map of strain 13 is shown in Figure 5. The complete genome sequences of Kocuria rosea 13 were assembled into four scaffolds, including a chromosome and three plasmids. The chromosome had a size of 3,815,108 bp and a GC content of 72.86%. The predicted coding sequence has 3797 genes with a total length of 3,692,208 bp accounting for 91% of the complete genome, which also has 72.6% GC in the gene region. Additionally, there were 136 tandem repeats predicted with a ratio of 48% in the genome. Moreover, 91 RNA genes were predicted: 50 tRNA genes, 32 sRNA, and 9 rRNA genes, including 3 16S rRNA genes, 3 23S rRNA, and 3 5S rRNA genes. Regarding mobile genetic elements, six gene islands, eight clustered regularly interspaced short palindromic repeat (CRISPR)-Cas systems, and one prophage were predicted.

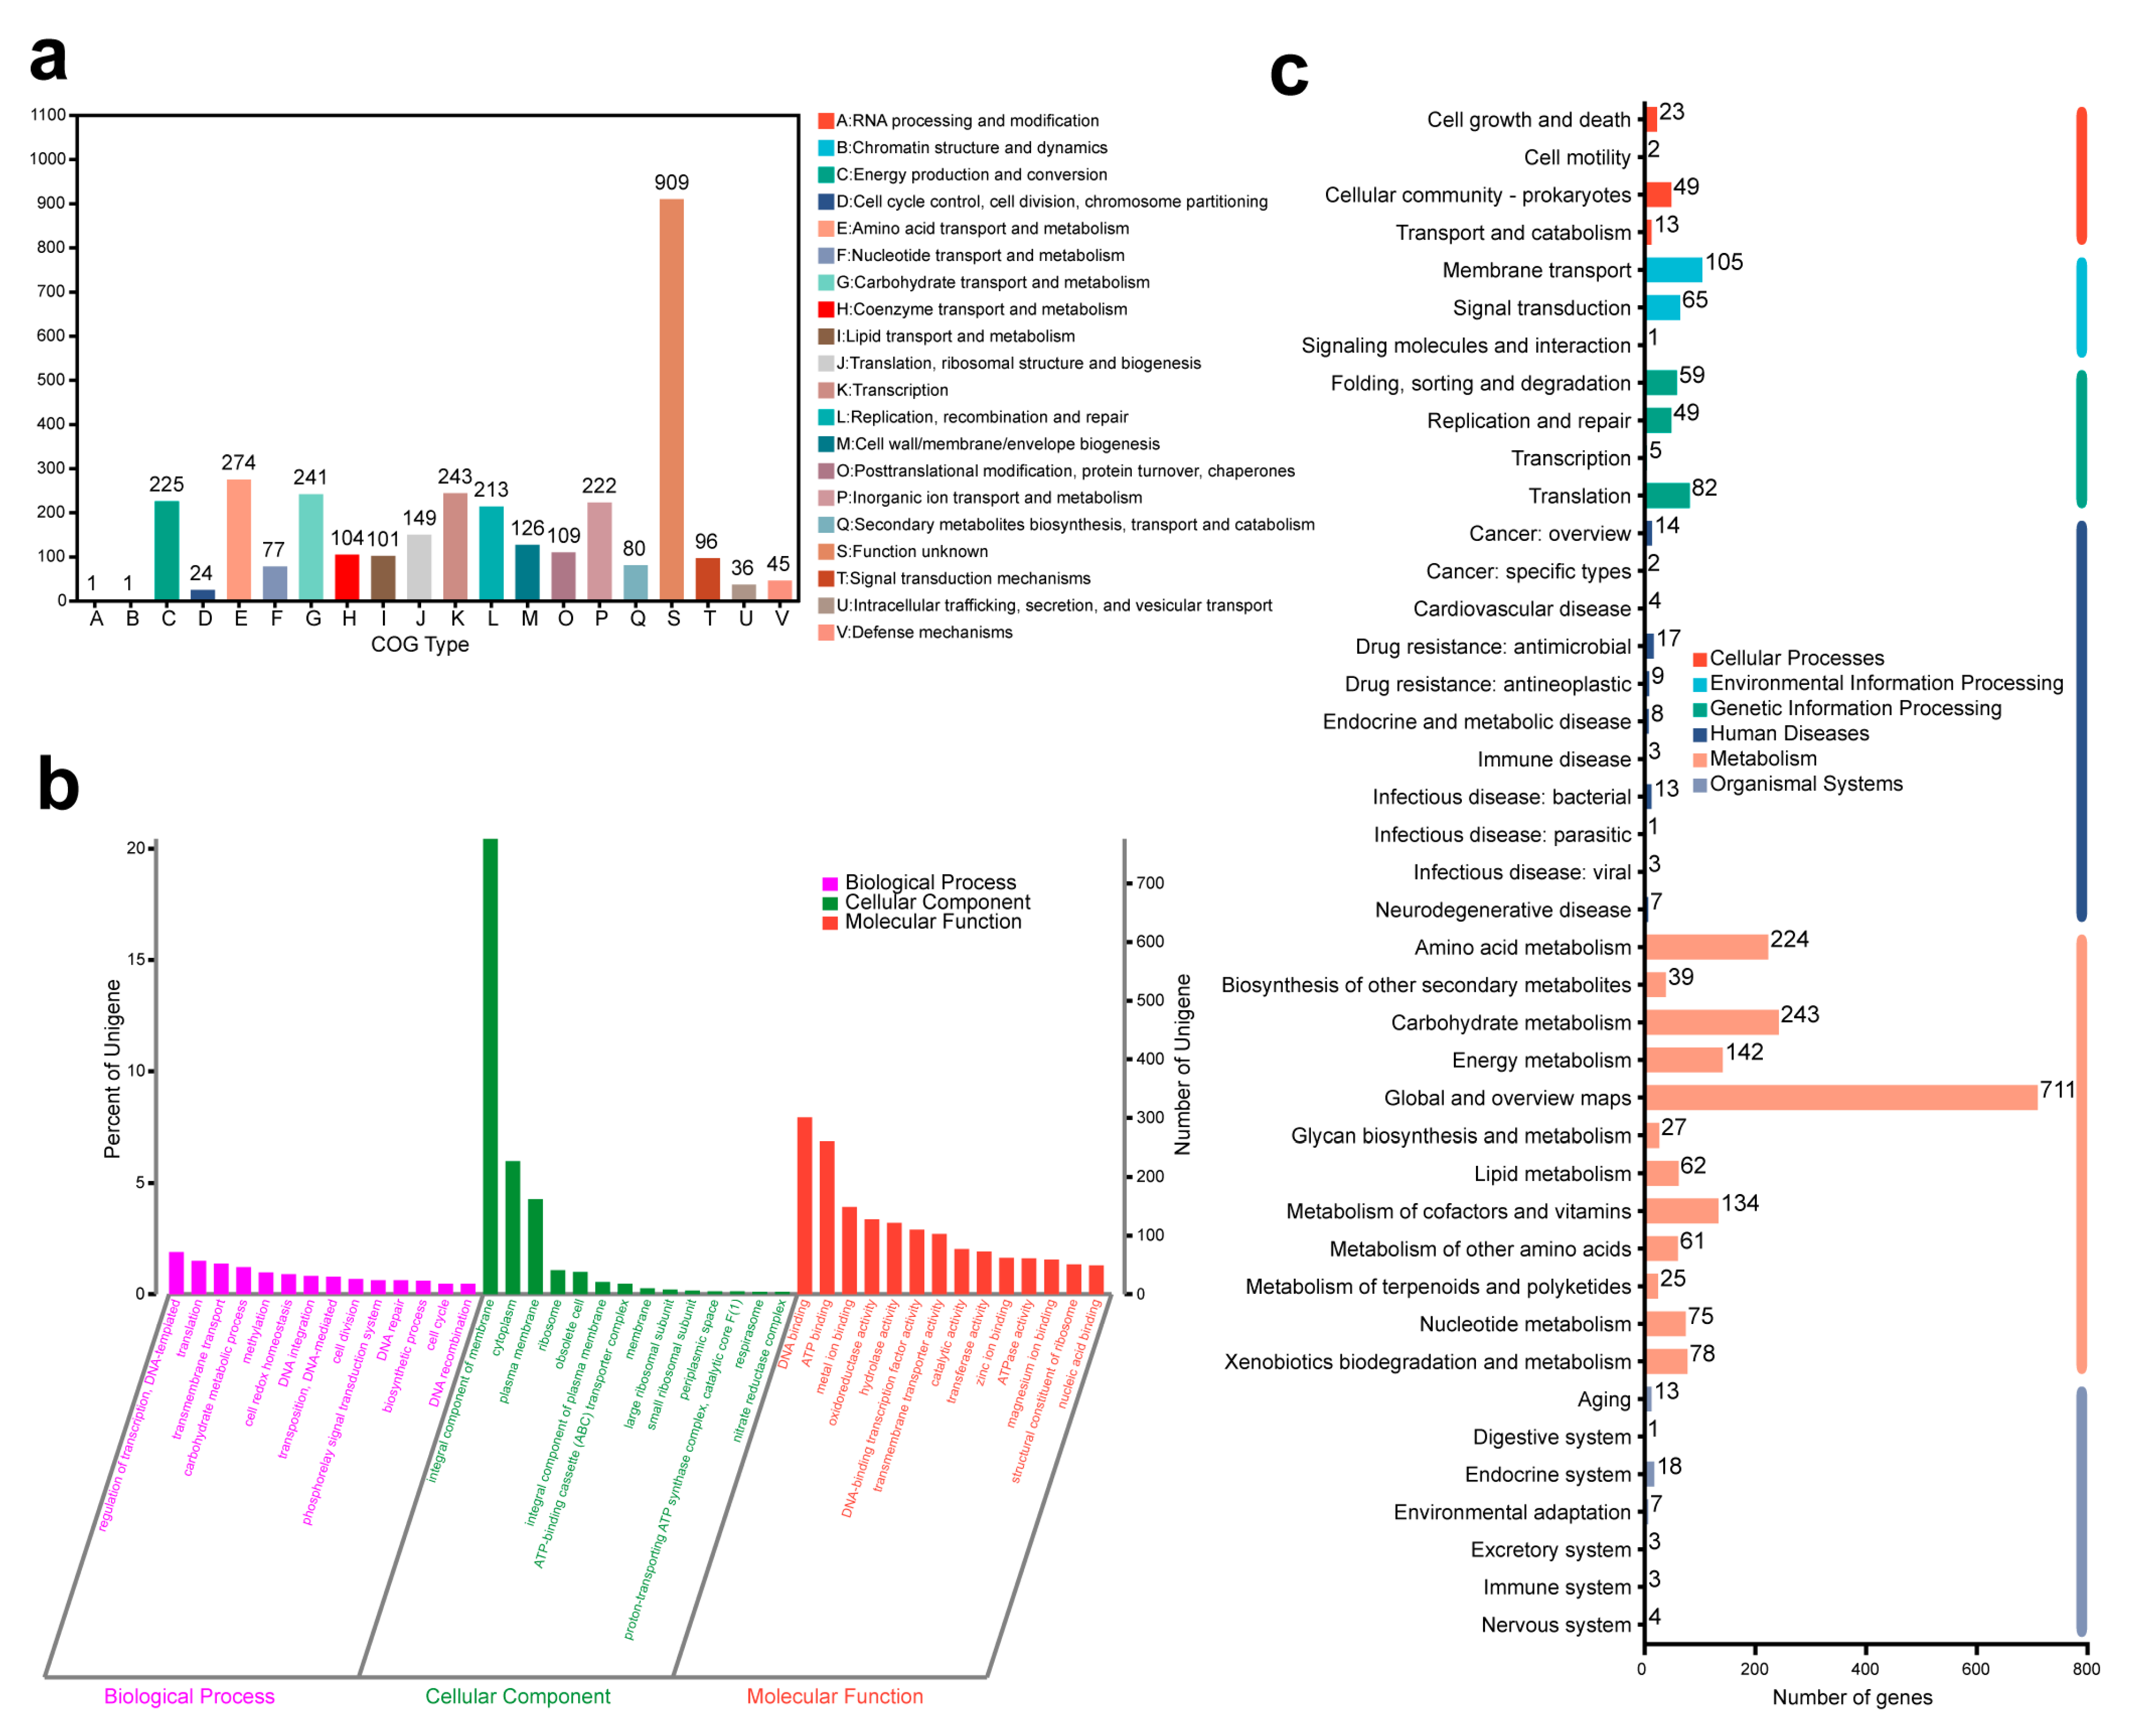
2.4. Gene Function Analysis

The CDS genome was annotated according to the following seven databases: Non-Redundant Protein Database (NR), Swiss-Prot, evolutionary genealogy of genes: Non-supervised Orthologous Groups (EggNOG), Pfam, Gene Ontology (GO), Kyoto Encyclopedia of Genes and Genomes (KEGG), and Carbohydrate-active enzymes (CAZy). The results of annotations for NR (Table S1), Swiss-Prot (Table S2), and Pfam (Table S3) were related to 3768, 2690, and 3120 genes, respectively.
EggNOG annotations divided 3231 genes, accounting for 85.09% of all the genes of strain 13 into 20 categories (Figure 6a). Type G Carbohydrate transport and metabolism had 241 genes which might be related to AFB1 degradation. Additionally, 80 genes annotated for secondary metabolites biosynthesis, transport, and catabolism could also be related to toxin degradation. Different gene numbers were counted from 1 to 274 for various function types; however, there were still unknown functions of 909 genes.
GO analysis classified 2698 genes (71.06% of all genes) from strain 13 into three major categories, including biological process (1149 genes), cellular component (1175 genes), and molecular function (2195 genes) (Figure 6b and Table S4). In the biological process, the GO annotations of top five genes were regulation of transcription and DNA-templated (GO ID: 0006355), translation (GO ID: 0006412), transmembrane transport (GO ID: 0055085), carbohydrate metabolic process (GO ID: 0005975), and methylation (GO ID: 0032259), which were related to 72 genes, 57 genes, 52 genes, 46 genes, and 37 genes, respectively. The biological process annotations of strain 13 contained 428 sub-functions, and molecular function annotations had 831 sub-functions. However, cellular component annotations had only 47 sub-functions. In the cellular component, the integral component of membrane (GO ID: 0016021) had the most genes (776 genes) in all GO annotations, and cytoplasm (GO ID: 0005737) and plasma membrane (GO ID: 0005886) had 227 genes and 162 genes, respectively. Furthermore, the carbohydrate metabolic process (GO ID: 0005975), oxidation-reduction process (GO ID: 0055114), aromatic amino acid family biosynthetic process (GO ID: 0009073), tetrahydrofolate metabolic process (GO ID: 0046653), aromatic compound catabolic process (GO ID: 0019439), mycothiol-dependent detoxification (GO ID: 0010127), and xenobiotic detoxification by transmembrane (GO ID: 1990961) might be related to AFB1 degradation.
In KEGG annotations, there were six primary categories (organismal systems, environmental information processing, human diseases, cellular processes, genetic information processing, and metabolism) of KEGG pathways corresponding to 1748 genes of strain 13, and each category contained different numbers of pathways (Figure 6c). Most numbers of genes (711 genes) were in connection with the global and overview maps in the largest category metabolism. Moreover, carbohydrate metabolism (243 genes), biosynthesis of other secondary metabolites (39 genes), and xenobiotics biodegradation and metabolism (78 genes) might be related to AFB1 degradation.
Carbohydrate-active enzymes (CAZyme) contain auxiliary activities (AAs), carbohydrate-binding modules (CBMs), polysaccharide lyases (PLs), carbohydrate esterases (CEs), glycoside hydrolases (GHs), and glycosyl transferases (GTs) which could degrade, modify, and generate glycosidic bonds. To reveal the mechanism of the microbial carbohydrate metabolism, CAZy was used for the prediction and classification of CAZyme in stain 13. Only four types of CAZymes were identified from the complete genes of the strain, which were AAs (17 genes), CEs (22 genes), GHs (43 genes), and GTs (43 genes) (Table S5). There were the highest gene counts for enzymes in the families of GHs and GTs, which played a pivotal part in the degradation of polymers.

3. Conclusions

In summary, Kocuria rosea strain 13 was found to degrade AFB1 (88 ± 0.03%) in optimized conditions (culture temperature of 30 °C, culture time of 4.2 days, seawater ratio of 100%, pH of 7.1094, and inoculation dosage of 0.0899%). Therefore, this study suggests that Kocuria rosea could be used for aflatoxin degradation. Moreover, the annotations of the genome predicted the potential of the strain, and some genes might be related to degradation mechanisms, which could be further screened and verified by transcriptomics techniques in subsequent research. Future work could also focus on the identification and toxicity assessment of the degradation products metabolized by the strain.

4. Materials and Methods

4.1. Chemicals and Culture Media

AFB1 (purity > 99%) was purchased from J&K Scientific Technology (Beijing, China). The composition of the M2 medium was (1 L seawater) 0.5 g peptone, 0.5 g yeast extract, 0.5 g starch, 0.5 g sucrose, 0.5 g glucose, 5 g sodium acetate, 0.05 g potassium sodium tartrate, 0.05 g malic acid, 0.05 g trisodium citrate, 1.0 g ammonium nitrate, and 0.2 g ammonium chloride adjusted to pH 7.5~7.6. The MilliPore Synergy UV water purification system (Merck, Germany) was used to produce ultrapure water with resistivity in 18.2 MΩ-cm.

4.2. Isolation of the Strain 13

Coumarin was added into a tube as the solid substrate, and the tube was wrapped up with nylon mesh in a case consumed by deep-sea organisms. Additionally, sterilization was performed at 115 °C for 30 min. The wrappage was placed in sterilized incubation chambers (ICs) of the deep-sea in situ microbial incubator (DIMI), which was placed at a flat-topped seamount in the West Pacific Ocean (N 20.4059567°, E 160.7700883°) at 1617 m depth for 348 days of cultivation. The samples were collected and diluted tenfold with sterile seawater. The suspension was enriched for 20 days at 150 rpm with a shaker at 20 °C in an M2 liquid culture medium with 1 µg mL−1 AFB1. Additionally, 1 mL of the suspension was cultured with the same conditions for the second enrichment in an M2 seawater medium with 5 µg mL−1 AFB1. Then, the final enrichment cultures were diluted in a gradient, spread onto the M2 culture plate with AFB1 as the only carbon source, and cultured at 20 °C. To obtain pure stains, different colonies were picked, isolated, and incubated on M2 plates separately. The growth rate of the strains in the M2 liquid culture medium was monitored by a UV-2000 spectrophotometer (Unico, Shanghai, China) with OD600nm. As the strains grew and OD600nm reached about 1.0, the suspensions were inoculated into an M2 liquid medium (AFB1 as the only carbon source) and cultured for seven days at 28 °C.

4.3. Determination of Aflatoxin Degradation Rate

AFB1 in the control groups and samples was extracted three times using chloroform with an equal volume before the solvent evaporated under N2 at room temperature [23,26,57,58]. Dimethyl sulfoxide (DMSO) (50 µL) was used to dissolve the dried extracts, and 20 µL of the mixture was injected in UltiMateTM3000 HPLC (Thermo Scientific, Bremen, Germany). HPLC analysis was conducted with a C18 Polaris column (250 mm × 4.6 mm i.d., 5 µm) in a mobile phase of water and methanol in a 1:1 ratio (v/v). The flow rate was set as 1 mL min−1, and a UV/VIS detector (Thermo Scientific, Germany) was used for absorbance measurements at a wavelength of 360 nm. The column temperature was set to 35 °C for detection. The software Chromeleon v6.8 was used for data analysis. The rate of AFB1 degradation was determined and calculated with (1 − AFB1 peak area in treatment/AFB1 peak area in control) × 100%.

4.4. UD for Aflatoxin Degradation Optimization

Aflatoxin degradation by the strain supernatant was optimized under UD according to [59]. Five independent variables were selected as follows: culture temperature (x1) (°C), culture time (x2) (days), seawater ratio (x3) (%), pH (x4), and inoculation dosage (x5) (%) (Table 4). Multiple mixed-level uniform designs U12 (41 × 64) were obtained with the software Data Processing System (DPS) 18.10 [60] by varying the parameters of random seed number, maximum iterations, and optimal search time. Seven UD matrix performance parameters [59] were compared among different UD tables, resulting in a UD (Table 5) with the smallest values of parameters being selected for the experimental scheme.
To assess degradation performance, the degradation rate was used as the dependent variable. The dependent variable could be related to the above five independent variables through three quadratic polynomial mathematical models: a quadratic polynomial stepwise regression model, a stepwise regression model with multiple factors and interaction terms, or a multivariate and squared stepwise regression model. The models were described using Equations (1)–(3).
Quadratic polynomial stepwise regression model:
y = b 0 + i = 1 m b i x i + i = 1 m b i i x i 2 + j = 1 i < j b i j x i x j
Stepwise regression model with multiple factors and interaction terms:
y = b 0 + i = 1 m b i x i + i = 1 i < j b i j x i x j
Multivariate and squared stepwise regression model:
y = b 0 + i = 1 m b i x i + i = 1 m b i x i 2
where y represents the dependent variable to be modeled; x i and x j represent the independent variables; b i j , b i i , b i , and b 0 represent the interaction coefficients, quadratic coefficients, linear coefficient, and constant coefficient, respectively.
The fit goodness of the three models was evaluated and compared using R 2 a d j , RMSE, nAIC, and BIC. The equations of R 2 a d j , RMSE, nAIC, and BIC can be described as follows:
R 2 a d j = 1 ( N 1 N n p ) i = 1 n ( O i P i ) 2 i = 1 n ( O i m ) 2
R M S E = R S S N = ( O i P i ) 2 N
nAIC = ln ( ( O i P i ) 2 N ) + 2 n p N
BIC = N ln ( ( O i P i ) 2 N ) + N ( n y ln ( 2 π ) + 1 ) + n p ln N
where O i represents the ith measured observed value; P i represents the ith predicted value; m represents the average value; RSS represents the residual sum of squares; N represents the number of values in the estimation data set; np represents the number of estimated parameters; and ny represents the number of model outputs.

4.5. DNA Extraction, Amplification, and 16S rRNA Gene Sequencing

The DNA of aflatoxin-degrading bacteria was extracted via a boiling lysis method: a single colony was selected and boiled in a 100 °C water bath for 15 min, then placed at 4 °C for 30 min, spun at 5000 rpm for one minute, and the extracted DNA in the supernatant was used for PCR amplification. An initial denaturation at 94 °C for 5 min, followed by 30 cycles of denaturation at 94 °C for 40 s, primer annealing at 55 °C for 40 s, extension for 1 min at 72 °C, and a final extension at 72 °C for 10 min, was used to amplify the DNA sample in a reaction mixture of 50 µL. The PCR product was purified and sent to Sangon Biotech Co., Ltd. (Shanghai, China) for sequencing. The sequences of the strain were assembled with the software DNAMAN 9.0.1 and aligned in EZTaxon (https://www.ezbiocloud.net/; accessed on 16 January 2023). The phylogenetic tree of the strain was constructed with the software MEGA 10.2.5 using the neighbor-joining (NJ) method. The bootstrap method replications were set as 1000. The 16S rDNA sequence of strain 13 (1521 bp) uploaded to GenBank was registered for the accession number CP127857.

4.6. Complete Genome Sequencing of Kocuria rosea

4.6.1. DNA Extraction

The bacterial cells were cultured to the logarithmic growth phase and collected via centrifuge CR21N (HITACHI, Tokyo, Japan) for 5 min at 14,000 rpm. The genomic DNA was extracted and purified with the Wizard® genomic DNA purification kit (Promega Corp., Madison, WI, USA), and the purity and concentration were detected using agarose gel electrophoresis and Nanodrop 2000 (Thermo Scientific, Germany), respectively.

4.6.2. Genomic Library Construction and Sequencing

The genome of the strain was sequenced with both Illumina sequencing and single-molecule real-time sequencing (SMRT). The Illumina data were used to assess genomic heterozygosity, genomic size, genomic duplication, presence of plasmids, and contamination, in addition to correcting long sequences from the third generation of sequencing to ensure the completeness and accuracy of the assembly.
For the Illumina platform, a focused acoustic shearer Covaris M220 (Covaris, Woburn, MA, USA) was used to shear DNA in a 1 µg genomic sample into 400–500 bp fragments. Additionally, the NEXTflex™ Rapid DNA-Seq kit (BIOO Scientific Co., Austin, TX, USA) and Illumina HiSeq X Ten (Illumina, San Diego, CA, USA) were used for library preparation and paired-end sequencing (2 × 150 bp), respectively.
For the SMRT platform, genomic DNA in a 15 µg sample was sheared into 8-10 kb fragments by a centrifuge 5424 (Eppendorf, Hamburg, Germany) at 6000 rpm for 1 min with a G-tube (Covaris, America). Both ends of the purified single-strand DNA fragments were connected with a sequencing adapter named SMRT bell for library construction. The Agencourt AMPure XP kit (Beckman Coulter Genomics, Woollahra, NSW, Australia) with 0.45× volumes was applied for library purification three times, and the library was sequenced by a PacBio RS II (Pacific Biosciences of California Inc., Menlo Park, CA, USA).

4.6.3. Genome Assembly and Plasmid Identification

The complete genome sequences, including plasmids, were assembled with the reads of both Illumina and PacBio. The Illumina raw data saved as a FASTQ file were trimmed, and low-quality reads were removed for clean data. The software Unicycler v0.4.8 [61] was used for the assembly of the PacBio reads before the reads were corrected according to Illumina reads with Pilon v1.22 for the complete genome, including chromosome and plasmid sequence. In addition, PlasFlow (https://github.com/smaegol/PlasFlow; accessed on 16 January 2023) was used for plasmid identification. Furthermore, the plasmid sequences were annotated using the basic local alignment search tool (BLAST) and database PLSDB (https://ccb-microbe.cs.uni-saarland.de/plsdb/; accessed on 16 January 2023). The genome sequences were stored at GenBank with the accession numbers CP127857 (chromosome), CP127858 (plasmid A), CP127859 (plasmid B), and CP127860 (plasmid C).

4.6.4. Structural Genomics Analysis

Glimmer v3.02, GeneMarkS v4.3, and Prodigal v2.6.3 were used for the prediction of the chromosome genome, plasmid genome, and codon sequence. Tandem repeats were identified with the Tandem Repeat Finder v4.04. Moreover, tRNA and rRNA were predicted with tRNAscan-SE v2.0 [62] and Barrnap, respectively. The sRNA was predicted using the software Infernal 1.1.3 (http://eddylab.org/infernal/, accessed on 16 January 2023) compared to the Rfam database (https://rfam.xfam.org/; accessed on 16 January 2023). The genomic island was predicted with Island Viewer [63], and CRISPRs were recognized with MinCED v3.0 (https://github.com/ctSkennerton/minced, accessed on 16 January 2023). Additionally, PHAST (http://phast.wishartlab.com/index.html; accessed on 16 January 2023) was used to search for possible prophage sequence. Genome visualization was displayed with Circos v0.69-6 (http://www.circos.ca, accessed on 16 January 2023) [64].

4.6.5. Genome Function Annotation

The CDS genome was compared and annotated with different databases using the following software: Diamond v0.8.35 for NR of the National Center for Biotechnology Information (NCBI), Swiss-Prot [65], and EggNOG v4.5.1 [66]; HMMER v3.1b2 (http://www.hmmer.org/, accessed on 16 January 2023) for Pfam (http://pfam.xfam.org/, accessed on 16 January 2023) [67]; Blast2go v2.5 for GO; BLAST+ v2.3.0 for KEGG; Diamond v0.8.35 for CAZy (http://www.cazy.org/, accessed on 16 January 2023).

Supplementary Materials

The following supporting information can be downloaded at: https://www.mdpi.com/article/10.3390/toxins15090520/s1, Table S1: NR annotations; Table S2: SwissProt annotations; Table S3: Pfam annotations; Table S4: GO annotations; Table S5: CAZy annotations.

Author Contributions

Conceptualization, J.W. and P.Y.; Methodology, J.W. and P.Y.; Software, J.W.; Validation, J.W., Q.C. and C.D.; Formal analysis, J.W.; Investigation, J.W., Q.C., C.D. and Z.S.; Resources, C.D.; Data curation, Z.S.; Writing—original draft, J.W.; Writing—review & editing, P.Y.; Visualization, J.W.; Supervision, P.Y.; Project administration, P.Y. and Z.S.; Funding acquisition, P.Y. All authors have read and agreed to the published version of the manuscript.

Funding

This research was funded by China Ocean Mineral Resource R&D Association (COMRA) Project (DY135-B2-17).

Institutional Review Board Statement

Not applicable.

Informed Consent Statement

Not applicable.

Data Availability Statement

The data presented in this study are available in this article.

Acknowledgments

The authors would like to thank Xin Li, Minglei Chi, Jinfeng Ma and all other engineers in Large Instrument and Equipment Test Management Center of Harbin Institute of Tech-nology (Weihai) for technical support and assistance.

Conflicts of Interest

The authors affirm that they have no known competing financial interest or personal relationships that could influence the work reported in this paper.

References

  1. Kurtzman, C.P.; Horn, B.W.; Hesseltine, C.W. Aspergillus nomius, a new aflatoxin-producing species related to Aspergillus flavus and Aspergillus tamarii. Antonie Leeuwenhoek 1987, 53, 147–158. [Google Scholar] [CrossRef]
  2. IARC. Some Traditional Herbal Medicines, Some Mycotoxins, Naphthalene and Styrene; IARC Press; World Health Organization: Lyon, France, 2002; Volume 82. [Google Scholar]
  3. Ishikawa, A.T.; Hirooka, E.Y.; e Silva, P.L.A.; Bracarense, A.P.F.R.L.; Flaiban, K.K.M.d.C.; Akagi, C.Y.; Kawamura, O.; da Costa, M.C.; Itano, E.N. Impact of a Single Oral Acute Dose of Aflatoxin B-1 on Liver Function/Cytokines and the Lymphoproliferative Response in C57Bl/6 Mice. Toxins 2017, 9, 374. [Google Scholar] [CrossRef]
  4. Fletcher, M.T.; Netzel, G. Food Safety and Natural Toxins. Toxins 2020, 12, 236. [Google Scholar] [CrossRef]
  5. Wild, C.P.; Gong, Y.Y. Mycotoxins and human disease: A largely ignored global health issue. Carcinogenesis 2010, 31, 71–82. [Google Scholar] [CrossRef]
  6. McMillan, A.; Renaud, J.B.; Burgess, K.M.N.; Orimadegun, A.E.; Akinyinka, O.O.; Allen, S.J.; Miller, J.D.; Reid, G.; Sumarah, M.W. Aflatoxin exposure in Nigerian children with severe acute malnutrition. Food Chem. Toxicol. 2018, 111, 356–362. [Google Scholar] [CrossRef]
  7. Pukkasorn, P.; Ratphitagsanti, W.; Haruthaitanasan, V. Effect of ultra-superheated steam on aflatoxin reduction and roasted peanut properties. J. Sci. Food Agric. 2018, 98, 2935–2941. [Google Scholar] [CrossRef]
  8. Pasha, T.N.; Farooq, M.U.; Khattak, F.M.; Jabbar, M.A.; Khan, A.D. Effectiveness of sodium bentonite and two commercial products as aflatoxin absorbents in diets for broiler chickens. Anim. Feed Sci. Technol. 2007, 132, 103–110. [Google Scholar] [CrossRef]
  9. Alam, S.S.; Deng, Y. Protein interference on aflatoxin B1 adsorption by smectites in corn fermentation solution. Appl. Clay Sci. 2017, 144, 36–44. [Google Scholar] [CrossRef]
  10. Liu, R.; Jin, Q.; Huang, J.; Liu, Y.; Wang, X.; Mao, W.; Wang, S. Photodegradation of Aflatoxin B-1 in peanut oil. Eur. Food Res. Technol. 2011, 232, 843–849. [Google Scholar] [CrossRef]
  11. Jalili, M.; Jinap, S.; Noranizan, M.A. Aflatoxins and ochratoxin a reduction in black and white pepper by gamma radiation. Radiat. Phys. Chem. 2012, 81, 1786–1788. [Google Scholar] [CrossRef]
  12. Wang, B.; Mahoney, N.E.; Pan, Z.; Khir, R.; Wu, B.; Ma, H.; Zhao, L. Effectiveness of pulsed light treatment for degradation and detoxification of aflatoxin B1 and B2 in rough rice and rice bran. Food Control 2016, 59, 461–467. [Google Scholar] [CrossRef]
  13. Aiko, V.; Edamana, P.; Mehta, A. Decomposition and detoxification of aflatoxin B1 by lactic acid. J. Sci. Food Agric. 2016, 96, 1959–1966. [Google Scholar] [CrossRef] [PubMed]
  14. Kamber, U.; Gülbaz, G.; Aksu, P.; Doğan, A. Detoxification of Aflatoxin B-1 in Red Pepper (Capsicum annuum L.) by Ozone Treatment and Its Effect on Microbiological and Sensory Quality. J. Food Process. Preserv. 2017, 41, e13102. [Google Scholar] [CrossRef]
  15. Ji, N.; Diao, E.; Li, X.; Zhang, Z.; Dong, H. Detoxification and safety evaluation of aflatoxin B1 in peanut oil using alkali refining. J. Sci. Food Agric. 2016, 96, 4009–4014. [Google Scholar] [CrossRef]
  16. Das, C.; Mishra, H.N. In vitro degradation of aflatoxin B1 in groundnut (Arachis hypogea) meal by horse radish peroxidase. LWT-Food Sci. Technol. 2000, 33, 308–312. [Google Scholar] [CrossRef]
  17. Velazhahan, R.; Vijayanandraj, S.; Vijayasamundeeswari, A.; Paranidharan, V.; Samiyappan, R.; Iwamoto, T.; Friebe, B.; Muthukrishnan, S. Detoxification of aflatoxins by seed extracts of the medicinal plant, Trachyspermum ammi (L.) Sprague ex Turrill—Structural analysis and biological toxicity of degradation product of aflatoxin G1. Food Control 2010, 21, 719–725. [Google Scholar] [CrossRef]
  18. Vijayanandraj, S.; Brinda, R.; Kannan, K.; Adhithya, R.; Vinothini, S.; Senthil, K.; Chinta, R.R.; Paranidharan, V.; Velazhahan, R. Detoxification of aflatoxin B1 by an aqueous extract from leaves of Adhatoda vasica Nees. Microbiol. Res. 2014, 169, 294–300. [Google Scholar] [CrossRef]
  19. Peltonen, K.; El-Nezami, H.; Haskard, C.; Ahokas, J.; Salminen, S. Aflatoxin B1 binding by dairy strains of lactic acid bacteria and bifidobacteria. J. Dairy Sci. 2001, 84, 2152–2156. [Google Scholar] [CrossRef]
  20. Shetty, P.H.; Hald, B.; Jespersen, L. Surface binding of aflatoxin B1 by Saccharomyces cerevisiae strains with potential decontaminating abilities in indigenous fermented foods. Int. J. Food Microbiol. 2007, 113, 41–46. [Google Scholar] [CrossRef]
  21. Wu, Q.; Jezkova, A.; Yuan, Z.; Pavlikova, L.; Dohnal, V.; Kuca, K. Biological degradation of aflatoxins. Drug Metab. Rev. 2009, 41, 1–7. [Google Scholar] [CrossRef]
  22. Gu, X.; Sun, J.; Cui, Y.; Wang, X.; Sang, Y. Biological degradation of aflatoxin M-1 by Bacillus pumilus E-1-1-1. MicrobiologyOpen 2019, 8, e00663. [Google Scholar] [CrossRef] [PubMed]
  23. Xue, G.; Qu, Y.; Wu, D.; Huang, S.; Che, Y.; Yu, J.; Song, P. Biodegradation of Aflatoxin B1 in the Baijiu Brewing Process by Bacillus cereus. Toxins 2023, 15, 65. [Google Scholar] [CrossRef] [PubMed]
  24. Wang, L.; Wu, J.; Liu, Z.; Shi, Y.; Liu, J.; Xu, X.; Hao, S.; Mu, P.; Deng, F.; Deng, Y. Aflatoxin B1 Degradation and Detoxification by Escherichia coli CG1061 Isolated from Chicken Cecum. Front. Pharmacol. 2019, 9, 1548. [Google Scholar] [CrossRef]
  25. Smiley, R.D.; Draughon, F.A. Preliminary evidence that degradation of aflatoxin B1 by Flavobacterium aurantiacum is enzymatic. J. Food Prot. 2000, 63, 415–418. [Google Scholar] [CrossRef] [PubMed]
  26. Zhao, L.H.; Guan, S.; Gao, X.; Ma, Q.G.; Lei, Y.P.; Bai, X.M.; Ji, C. Preparation, purification and characteristics of an aflatoxin degradation enzyme from Myxococcus fulvus ANSM068. J. Appl. Microbiol. 2011, 110, 147–155. [Google Scholar] [CrossRef]
  27. Wang, Y.; Zhao, C.; Zhang, D.; Zhao, M.; Zheng, D.; Lyu, Y.; Cheng, W.; Guo, P.; Cui, Z. Effective degradation of aflatoxin B1 using a novel thermophilic microbial consortium TADC7. Bioresour. Technol. 2017, 224, 166–173. [Google Scholar] [CrossRef]
  28. Taylor, M.C.; Jackson, C.J.; Tattersall, D.B.; French, N.; Peat, T.S.; Newman, J.; Briggs, L.J.; Lapalikar, G.V.; Campbell, P.M.; Scott, C.; et al. Identification and characterization of two families of F420H2-dependent reductases from Mycobacteria that catalyse aflatoxin degradation. Mol. Microbiol. 2010, 78, 561–575. [Google Scholar] [CrossRef]
  29. Farzaneh, M.; Shi, Z.-Q.; Ghassempour, A.; Sedaghat, N.; Ahmadzadeh, M.; Mirabolfathy, M.; Javan-Nikkhah, M. Aflatoxin B1 degradation by Bacillus subtilis UTBSP1 isolated from pistachio nuts of Iran. Food Control 2012, 23, 100–106. [Google Scholar] [CrossRef]
  30. Risa, A.; Divinyi, D.M.; Baka, E.; Krifaton, C. Aflatoxin B1 detoxification by cell-free extracts of Rhodococcus strains. Acta Microbiol. Immunol. Hung. 2017, 64, 423–438. [Google Scholar] [CrossRef]
  31. Branà, M.T.; Sergio, L.; Haidukowski, M.; Logrieco, A.F.; Altomare, C. Degradation of Aflatoxin B1 by a Sustainable Enzymatic Extract from Spent Mushroom Substrate of Pleurotus eryngii. Toxins 2020, 12, 49. [Google Scholar] [CrossRef]
  32. Alberts, J.F.; Gelderblom, W.C.A.; Botha, A.; van Zyl, W.H. Degradation of aflatoxin B-1 by fungal laccase enzymes. Int. J. Food Microbiol. 2009, 135, 47–52. [Google Scholar] [CrossRef]
  33. Yehia, R.S. Aflatoxin detoxification by manganese peroxidase purified from Pleurotus ostreatus. Braz. J. Microbiol. 2014, 45, 127–133. [Google Scholar] [CrossRef]
  34. Wang, J.; Ogata, M.; Hirai, H.; Kawagishi, H. Detoxification of aflatoxin B-1 by manganese peroxidase from the white-rot fungus Phanerochaete sordida YK-624. FEMS Microbiol. Lett. 2011, 314, 164–169. [Google Scholar] [CrossRef] [PubMed]
  35. Shao, S.; Cai, J.; Du, X.; Wang, C.; Lin, J.; Dai, J. Biotransformation and detoxification of aflatoxin B1 by extracellular extract of Cladosporium uredinicola. Food Sci. Biotechnol. 2016, 25, 1789–1794. [Google Scholar] [CrossRef] [PubMed]
  36. Fang, Q.; Du, M.; Chen, J.; Liu, T.; Zheng, Y.; Liao, Z.; Zhong, Q.; Wang, L.; Fang, X.; Wang, J. Degradation and Detoxification of Aflatoxin B1 by Tea-Derived Aspergillus niger RAF106. Toxins 2020, 12, 777. [Google Scholar] [CrossRef] [PubMed]
  37. Hua, S.S.T.; Sarreal, S.B.L.; Chang, P.-K.; Yu, J. Transcriptional Regulation of Aflatoxin Biosynthesis and Conidiation in Aspergillus flavus by Wickerhamomyces anomalus WRL-076 for Reduction of Aflatoxin Contamination. Toxins 2019, 11, 81. [Google Scholar] [CrossRef]
  38. Yan, Y.; Zhang, X.; Chen, H.; Huang, W.; Jiang, H.; Wang, C.; Xiao, Z.; Zhang, Y.; Xu, J. Isolation and Aflatoxin B1-Degradation Characteristics of a Microbacterium proteolyticum B204 Strain from Bovine Faeces. Toxins 2022, 14, 525. [Google Scholar] [CrossRef]
  39. Frisvad, J.C.; Samson, R.A. Emericella venezuelensis, a new species with stellate ascospores producing sterigmatocystin and aflatoxin B1. Syst. Appl. Microbiol. 2004, 27, 672–680. [Google Scholar] [CrossRef]
  40. Zhou, Y.; Wang, J.; Gao, X.; Wang, K.; Wang, W.; Wang, Q.; Yan, P. Isolation of a novel deep-sea Bacillus circulus strain and uniform design for optimization of its anti-aflatoxigenic bioactive metabolites production. Bioengineered 2019, 10, 13–22. [Google Scholar] [CrossRef]
  41. Zhou, L.; Dong, F.; Zhang, W.; Chen, Y.; Zhou, L.; Zheng, F.; Lv, Z.; Xue, J.; He, D. Biosorption and biomineralization of U(VI) by Kocuria rosea: Involvement of phosphorus and formation of U-P minerals. Chemosphere 2022, 288, 132659. [Google Scholar] [CrossRef]
  42. Parshetti, G.K.; Parshetti, S.; Kalyani, D.C.; Doong, R.-A.; Govindwar, S.P. Industrial dye decolorizing lignin peroxidase from Kocuria rosea MTCC 1532. Ann. Microbiol. 2012, 62, 217–223. [Google Scholar] [CrossRef]
  43. Parshetti, G.; Telke, A.; Kalyani, D.; Govindwar, S. Decolorization and detoxification of sulfonated azo dye methyl orange by Kocuria rosea MTCC 1532. J. Hazard. Mater. 2010, 176, 503–509. [Google Scholar] [CrossRef]
  44. Laxmi, M.V.; Chari, M.A. Isolation of novel bacterial strains from contaminated soils for phenol biodegradation. BioTechnology 2009, 3, 149–156. [Google Scholar]
  45. Bernal, C.; Cairó, J.; Coello, N. Purification and characterization of a novel exocellular keratinase from Kocuria rosea. Enzym. Microb. Technol. 2006, 38, 49–54. [Google Scholar] [CrossRef]
  46. Solyanikova, I.P.; Baskunov, B.P.; Baboshin, M.A.; Saralov, A.I.; Golovleva, L.A. Detoxification of high concentrations of trinitrotoluene by bacteria. Appl. Biochem. Microbiol. 2012, 48, 21–27. [Google Scholar] [CrossRef]
  47. Ahmed, R.Z.; Ahmed, N.; Gadd, G.M. Isolation of two Kocuria species capable of growing on various polycyclic aromatic hydrocarbons. Afr. J. Biotechnol. 2010, 9, 3611–3617. [Google Scholar]
  48. Khandelwal, A.; Sugavanam, R.; Ramakrishnan, B.; Dutta, A.; Varghese, E.; Banerjee, T.; Nain, L.; Singh, S.B.; Singh, N. Bio-polysaccharide composites mediated degradation of polyaromatic hydrocarbons in a sandy soil using free and immobilized consortium of Kocuria rosea and Aspergillus sydowii. Environ. Sci. Pollut. Res. 2022, 29, 80005–80020. [Google Scholar] [CrossRef] [PubMed]
  49. Mukherjee, A.; Zaveri, P.; Patel, R.; Shah, M.T.; Munshi, N.S. Optimization of microbial fuel cell process using a novel consortium for aromatic hydrocarbon bioremediation and bioelectricity generation. J. Environ. Manag. 2021, 298, 113546. [Google Scholar] [CrossRef]
  50. Kayan, B.; Gözmen, B. Degradation of Acid Red 274 using H2O2 in subcritical water: Application of response surface methodology. J. Hazard. Mater. 2012, 201, 100–106. [Google Scholar] [CrossRef]
  51. Ross, T. Indices for performance evaluation of predictive models in food microbiology. J. Appl. Bacteriol. 1996, 81, 501–508. [Google Scholar] [CrossRef]
  52. Sant’Ana, A.S.; Franco, B.D.G.M.; Schaffner, D.W. Modeling the growth rate and lag time of different strains of Salmonella enterica and Listeria monocytogenes in ready-to-eat lettuce. Food Microbiol. 2012, 30, 267–273. [Google Scholar] [CrossRef] [PubMed]
  53. McGibbon, R.T.; Schwantes, C.R.; Pande, V.S. Statistical Model Selection for Markov Models of Biomolecular Dynamics. J. Phys. Chem. B 2014, 118, 6475–6481. [Google Scholar] [CrossRef] [PubMed]
  54. Akaike, H. A new look at the statistical model identification. IEEE Trans. Autom. Control. 1974, 19, 716–723. [Google Scholar] [CrossRef]
  55. Schwarz, G. Estimating the Dimension of a Model. Ann. Stat. 1978, 6, 461–464. [Google Scholar] [CrossRef]
  56. Stylianou, C.; Pickles, A.; Roberts, S.A. Using Bonferroni, BIC and AIC to assess evidence for alternative biological pathways: Covariate selection for the multilevel Embryo-Uterus model. BMC Med. Res. Methodol. 2013, 13, 73. [Google Scholar] [CrossRef] [PubMed]
  57. Guan, S.; Ji, C.; Zhou, T.; Li, J.; Ma, Q.; Niu, T. Aflatoxin B1 degradation by Stenotrophomonas maltophilia and other microbes selected using coumarin medium. Int. J. Mol. Sci. 2008, 9, 1489–1503. [Google Scholar] [CrossRef]
  58. Suresh, G.; Cabezudo, I.; Pulicharla, R.; Cuprys, A.; Rouissi, T.; Brar, S.K. Biodegradation of aflatoxin B-1 with cell-free extracts of Trametes versicolor and Bacillus subtilis. Res. Vet. Sci. 2020, 133, 85–91. [Google Scholar] [CrossRef]
  59. Fang, K.-T.; Lin, D.K.J.; Winker, P.; Zhang, Y. Uniform design: Theory and application. Technometrics 2000, 42, 237–248. [Google Scholar] [CrossRef]
  60. Tang, Q.-Y.; Zhang, C.-X. Data Processing System (DPS) software with experimental design, statistical analysis and data mining developed for use in entomological research. Insect Sci. 2013, 20, 254–260. [Google Scholar] [CrossRef]
  61. Wick, R.R.; Judd, L.M.; Gorrie, C.L.; Holt, K.E. Unicycler: Resolving bacterial genome assemblies from short and long sequencing reads. PLoS Comput. Biol. 2017, 13, e1005595. [Google Scholar] [CrossRef]
  62. Chan, P.P.; Lowe, T.M. tRNAscan-SE: Searching for tRNA Genes in Genomic Sequences. In Gene Prediction; Methods in Molecular Biology; Humana Press: New York, NY, USA, 2019; Volume 1962, pp. 1–14. [Google Scholar] [CrossRef]
  63. Bertelli, C.; Laird, M.R.; Williams, K.P.; Simon Fraser University Research Computing Group; Lau, B.Y.; Hoad, G.; Winsor, G.L.; Brinkman, F.S.L. IslandViewer 4: Expanded prediction of genomic islands for larger-scale datasets. Nucleic Acids Res. 2017, 45, W30–W35. [Google Scholar] [CrossRef]
  64. Krzywinski, M.; Schein, J.; Birol, I.; Connors, J.; Gascoyne, R.; Horsman, D.; Jones, S.J.; Marra, M.A. Circos: An information aesthetic for comparative genomics. Genome Res. 2009, 19, 1639–1645. [Google Scholar] [CrossRef] [PubMed]
  65. Bairoch, A.; Apweiler, R. The SWISS-PROT protein sequence database and its supplement TrEMBL in 2000. Nucleic Acids Res. 2000, 28, 45–48. [Google Scholar] [CrossRef] [PubMed]
  66. Jensen, L.J.; Julien, P.; Kuhn, M.; von Mering, C.; Muller, J.; Doerks, T.; Bork, P. eggNOG: Automated construction and annotation of orthologous groups of genes. Nucleic Acids Res. 2008, 36, D250–D254. [Google Scholar] [CrossRef] [PubMed]
  67. Finn, R.D.; Bateman, A.; Clements, J.; Coggill, P.; Eberhardt, R.Y.; Eddy, S.R.; Heger, A.; Hetherington, K.; Holm, L.; Mistry, J.; et al. Pfam: The protein families database. Nucleic Acids Res. 2014, 42, D222–D230. [Google Scholar] [CrossRef] [PubMed]
Figure 1. Phylogenetic tree for 27 Kocuria species based on 16S rRNA gene sequencing.
Toxins 15 00520 g001
Figure 2. The degradation rate of uniform design experiments.
Toxins 15 00520 g002
Figure 3. The degradation rate of predicted and observed values in uniform experimental design.
Toxins 15 00520 g003
Figure 4. Response surface plots and contour plots of AFB1 degradation rate affected by interaction terms of two factors: (a) x1 − x2; (b) x1 − x3; (c) x2 − x3.
Toxins 15 00520 g004
Figure 5. The circular genome map of strain 13 for one chromosome and three plasmids. Six circles in each map from the outermost circle to the innermost circle represent the following genome features: (1) gene size scale (each major scale mark representing 0.1 Mb), (2) CDS on forward chains with clusters of orthologous groups of proteins (COGs) categories in different colors, (3) CDS on reverse chains with COGs categories in different colors, (4) rRNA and tRNA, (5) guanine–cytosine (GC) content, (6) GC skew.
Toxins 15 00520 g005
Figure 6. Histograms of function gene number: (a) EggNOG annotations; (b) GO annotations; (c) KEGG annotations.
Toxins 15 00520 g006
Table 1. Parameters of model fitness.
ModelR2RMSEnAICBIC
The quadratic polynomial stepwise regression model1.0000.000−19.72825.918
The stepwise regression model with multiple factors and interaction terms1.0000.000−18.19827.448
The multivariate and squared stepwise regression model0.9540.055−4.97840.667
Table 2. Analysis of variance regression model parameters.
Source of VariationSum of SquaresDegree of FreedomMean SquareF-Valuep-Value
Regression1.232811100.1232818,738,1940.000263
Residual1.41 × 10−811.41 × 10⁻⁸
Total variation1.23281111
Table 3. Parameter estimation and significance test of the model.
FactorRegression CoefficientStandard Regression CoefficientPartial Correlation Coefficientt-Valuep-Value
x10.1394484.86419411502.2220.000424
x20.1466480.54696611178.1420.00054
x3−0.00375−0.39932−1390.28540.001631
x5−0.09324−0.34776−0.99999264.14550.00241
x1 × x1−0.00246−5.20978−12130.1270.000299
x3 × x34.95 × 10−50.54974211308.8390.000486
x5 × x50.0099930.1865590.999963116.77420.005452
x1 × x20.000240.0319260.99987863.885120.009964
x1 × x35.07 × 10−50.1959350.999978149.49070.004259
x2 × x3−0.00143−0.49983−11134.8430.000561
Table 4. The levels of five independent variables.
Independent Variables123456
Temperature (°C)x115253545
Time (Days)x20.71.42.12.83.54.2
Seawater ratio (%)x3020406080100
pHx467891011
Inoculation dosage (%)x50.71.42.12.83.54.2
Table 5. The scheme and the matrix performance parameters of the uniform design.
Runx1x2x3x4x5Uniform Design Matrix Performance Parameters
N123231Centered discrepancy = 0.18836
N226514L2-discrepancy = 0.03101
N343636Modified discrepancy = 0.26946
N411425Symmetric discrepancy = 1.06848
N542312Wrap-around discrepancy = 0.37733
N622154Design matrix condition number = 1.5899
N744245D-optimal = 0.0000
N815366
N914642
N1035123
N1136451
N1231563
Disclaimer/Publisher’s Note: The statements, opinions and data contained in all publications are solely those of the individual author(s) and contributor(s) and not of MDPI and/or the editor(s). MDPI and/or the editor(s) disclaim responsibility for any injury to people or property resulting from any ideas, methods, instructions or products referred to in the content.

