2.1. SOD1 Is Phosphorylated in the Early Phase of Nodularin-Induced Apoptosis
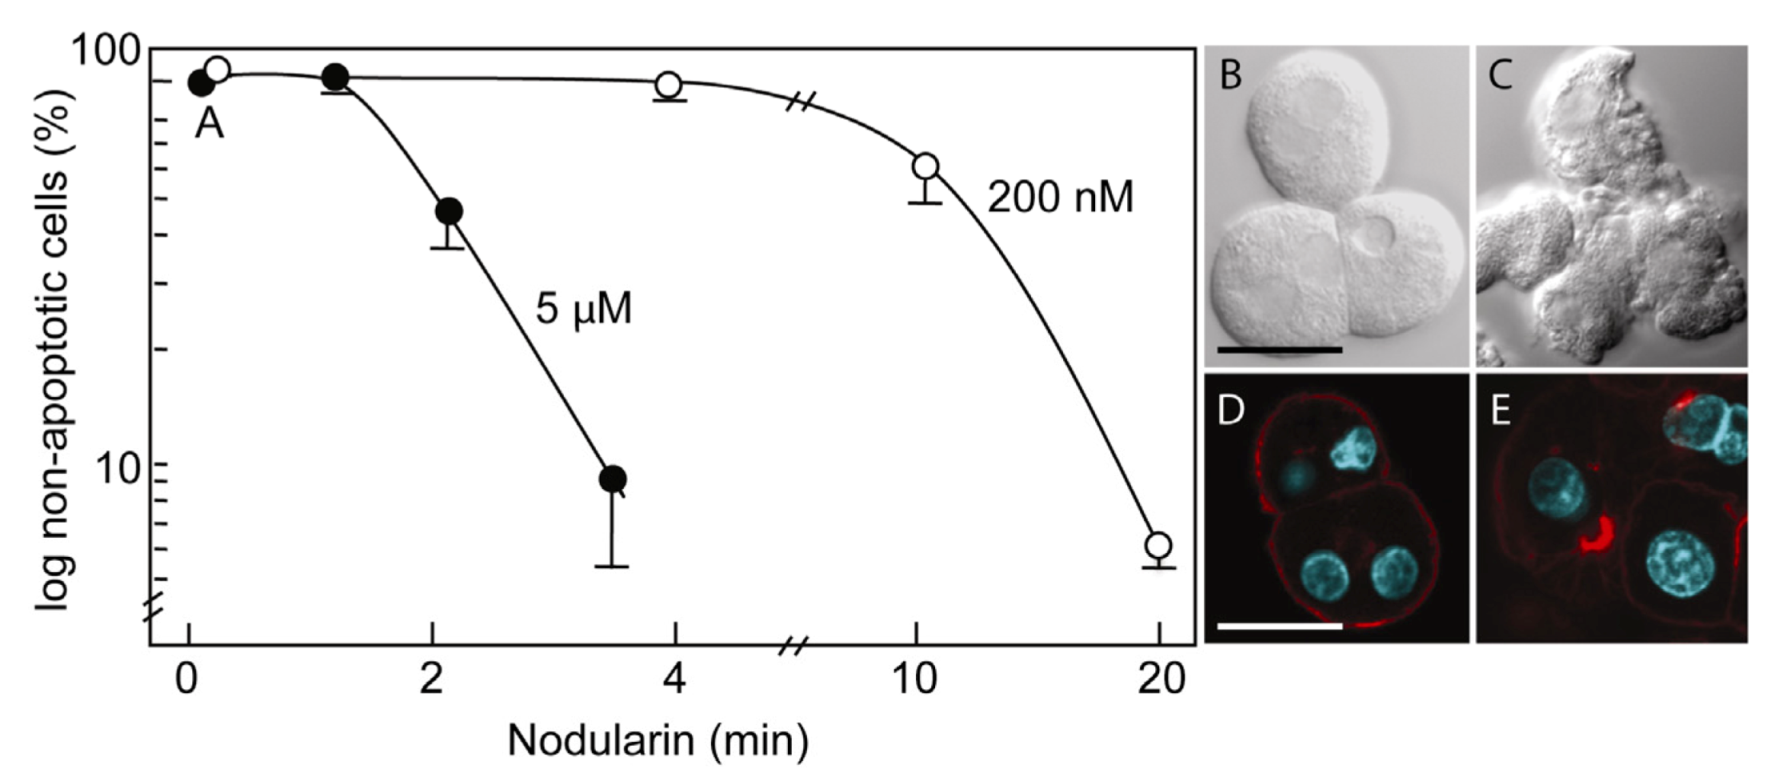
Primary hepatocytes exposed to 5 µM nodularin developed apoptosis, involving membrane budding (
Figure 1C) and actin reorganization (
Figure 1E), in only 2–4 min after toxin addition (
Figure 1). Exposure to 200 nM gave similar morphological changes after 10–20 min of incubation (
Figure 1A) [
2].
Figure 1.
Nodularin-induced apoptosis in primary hepatocytes. Primary hepatocytes in suspension were exposed to 5 µM (●) or 200 nM (○) nodularin (A). The unexposed hepatocytes appeared round with a smooth cell surface (B), whilst nodularin-exposed (5 µM) hepatocytes showed profound apoptotic-related budding (C). Control cells also had and with a cortical actin cytoskeleton (D) which was reorganized after nodularin exposure (E). Cell death was determined based on the appearance of apoptotic-related morphology. Values are the mean +/− S.E.M. of 3–5 separate experiments. Actin filaments were detected using rhodamin-conjugated phalloidin. Nuclei are stained with DAPI. Bars, 20 μm.
Figure 2.
SOD1 is phosphorylated in nodularin-treated apoptotic hepatocytes. Primary hepatocytes in suspension culture were pre-labeled for 35 min with
32Pi and exposed to nodularin (200 nM) for 10 min. Hepatocyte extract was fractionated and the cytosolic fraction (2.5 mg protein) was separated by two-dimensional gel electrophoresis (pI 5.3–6.5, 13 cm). Spots were identified using MALDI MS or MS/MS. See
Experimental Section for further details. The figure shows Coomassie-stained gels (
A and
B) and their corresponding autoradiographs (
C and
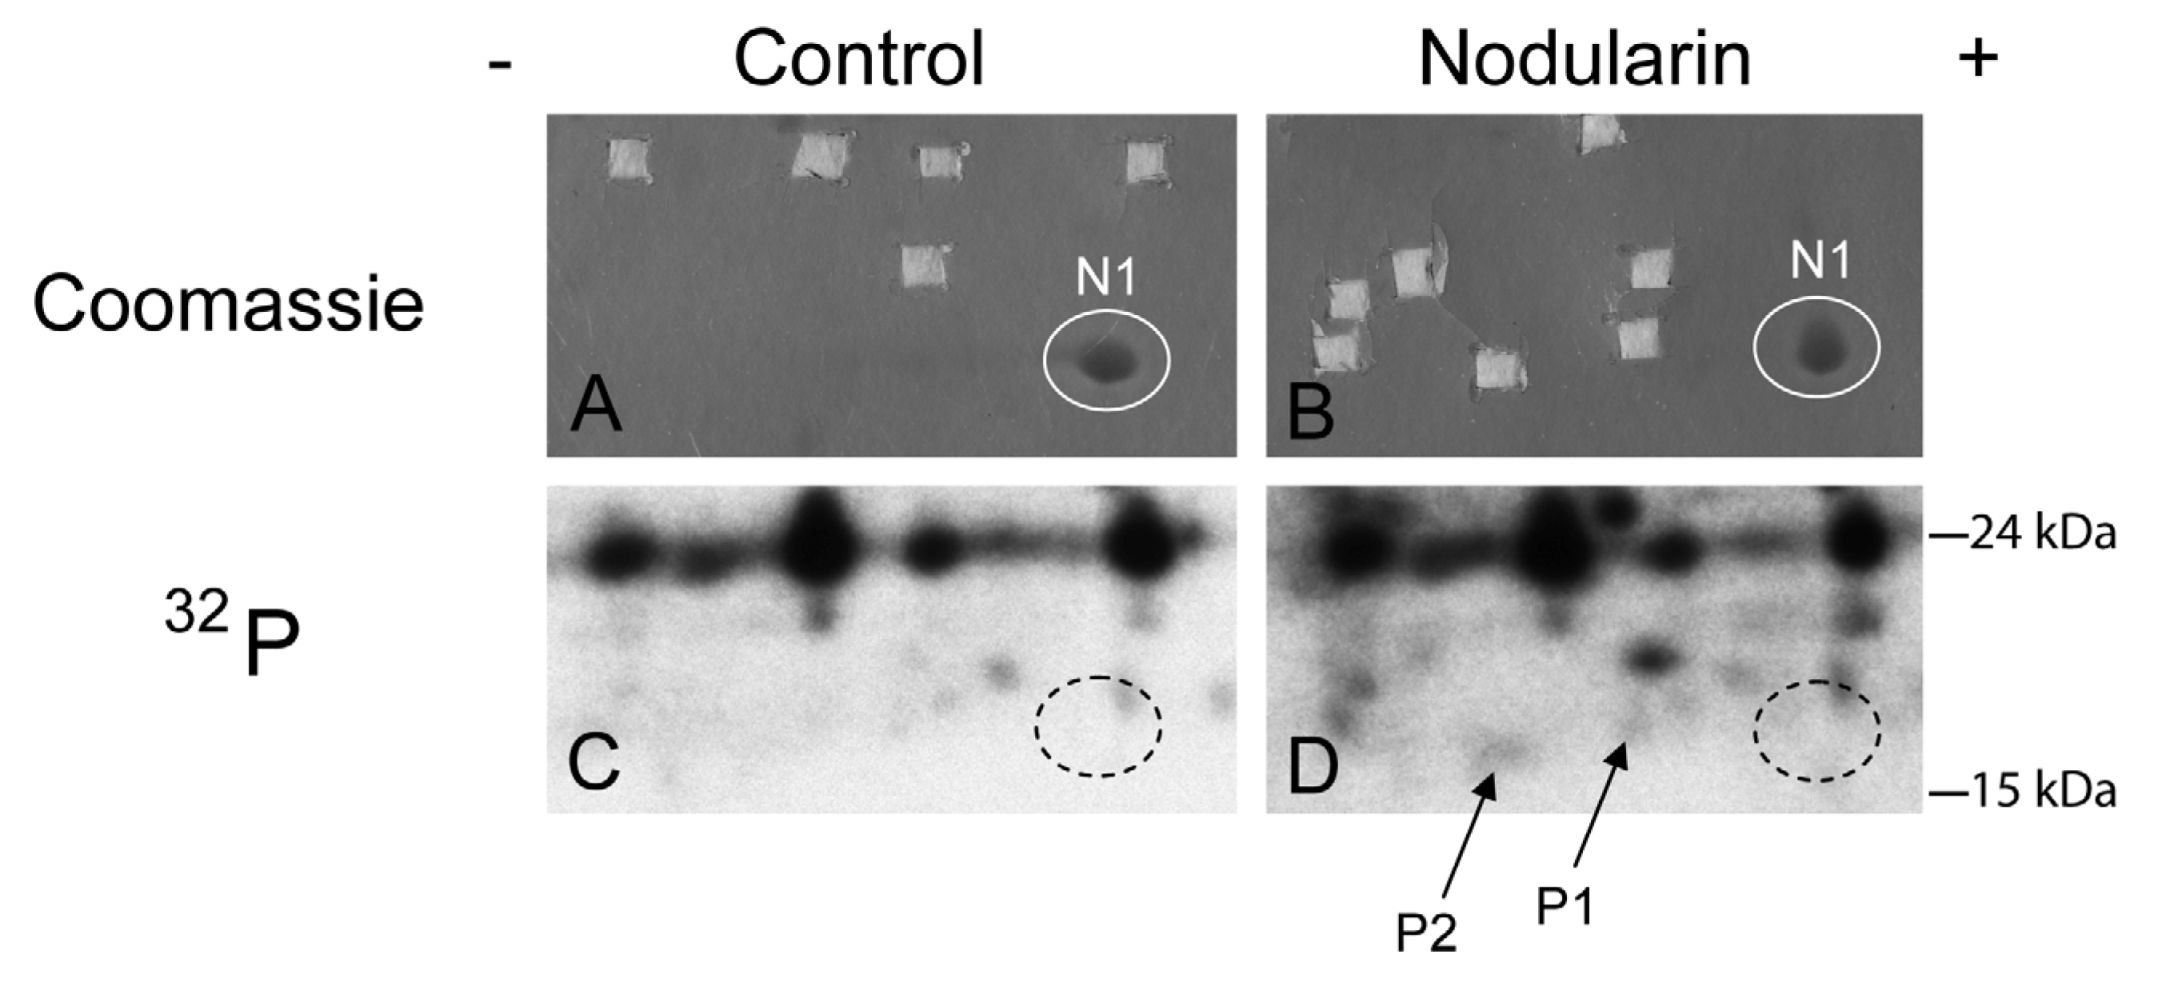
D). Only non-phosphorylated SOD1 (spot N1) was detectable with Coomassie staining. Spots were therefore cut from the Coomassie-stained gels using the autoradiographs as guidance. In nodularin-treated hepatocytes SOD1 was phosphorylated and appeared as two novel spots with an acidic shift (spot P1 and P2). N1, P1 and P2 were identified as SOD1.
Figure 2.
SOD1 is phosphorylated in nodularin-treated apoptotic hepatocytes. Primary hepatocytes in suspension culture were pre-labeled for 35 min with
32Pi and exposed to nodularin (200 nM) for 10 min. Hepatocyte extract was fractionated and the cytosolic fraction (2.5 mg protein) was separated by two-dimensional gel electrophoresis (pI 5.3–6.5, 13 cm). Spots were identified using MALDI MS or MS/MS. See
Experimental Section for further details. The figure shows Coomassie-stained gels (
A and
B) and their corresponding autoradiographs (
C and
D). Only non-phosphorylated SOD1 (spot N1) was detectable with Coomassie staining. Spots were therefore cut from the Coomassie-stained gels using the autoradiographs as guidance. In nodularin-treated hepatocytes SOD1 was phosphorylated and appeared as two novel spots with an acidic shift (spot P1 and P2). N1, P1 and P2 were identified as SOD1.
We have previously shown that both nodularin and microcystin induce phosphorylation of a number of proteins before any morphological signs of apoptosis can be observed [
1]. These early phosphorylated proteins are of interest as they most possibly are key players in apoptosis development or protection. Hitherto, we have just been able to identify one of these, namely acyl-CoA binding protein [
2], using proteomics-based techniques. The challenge is due to the low level amount of these phoshoproteins, as they cannot be visualized with high sensitivity protein staining (silver or Sypro Ruby). To be able to identify early phosphorylation events, we exposed hepatocytes to 200 nM nodularin for 20 min. To increase the amount of phosphoproteins loaded on the gel, the cell lysates were sub-fractionated. Phosphoproteins were visualized by autoradiography after pre-labeling hepatocytes with radioactive phosphate (
Figure 2C,D), and the autoradiographs were used as guidance to cut out corresponding unstained spots from the gels (
Figure 2A,B).
Figure 3.
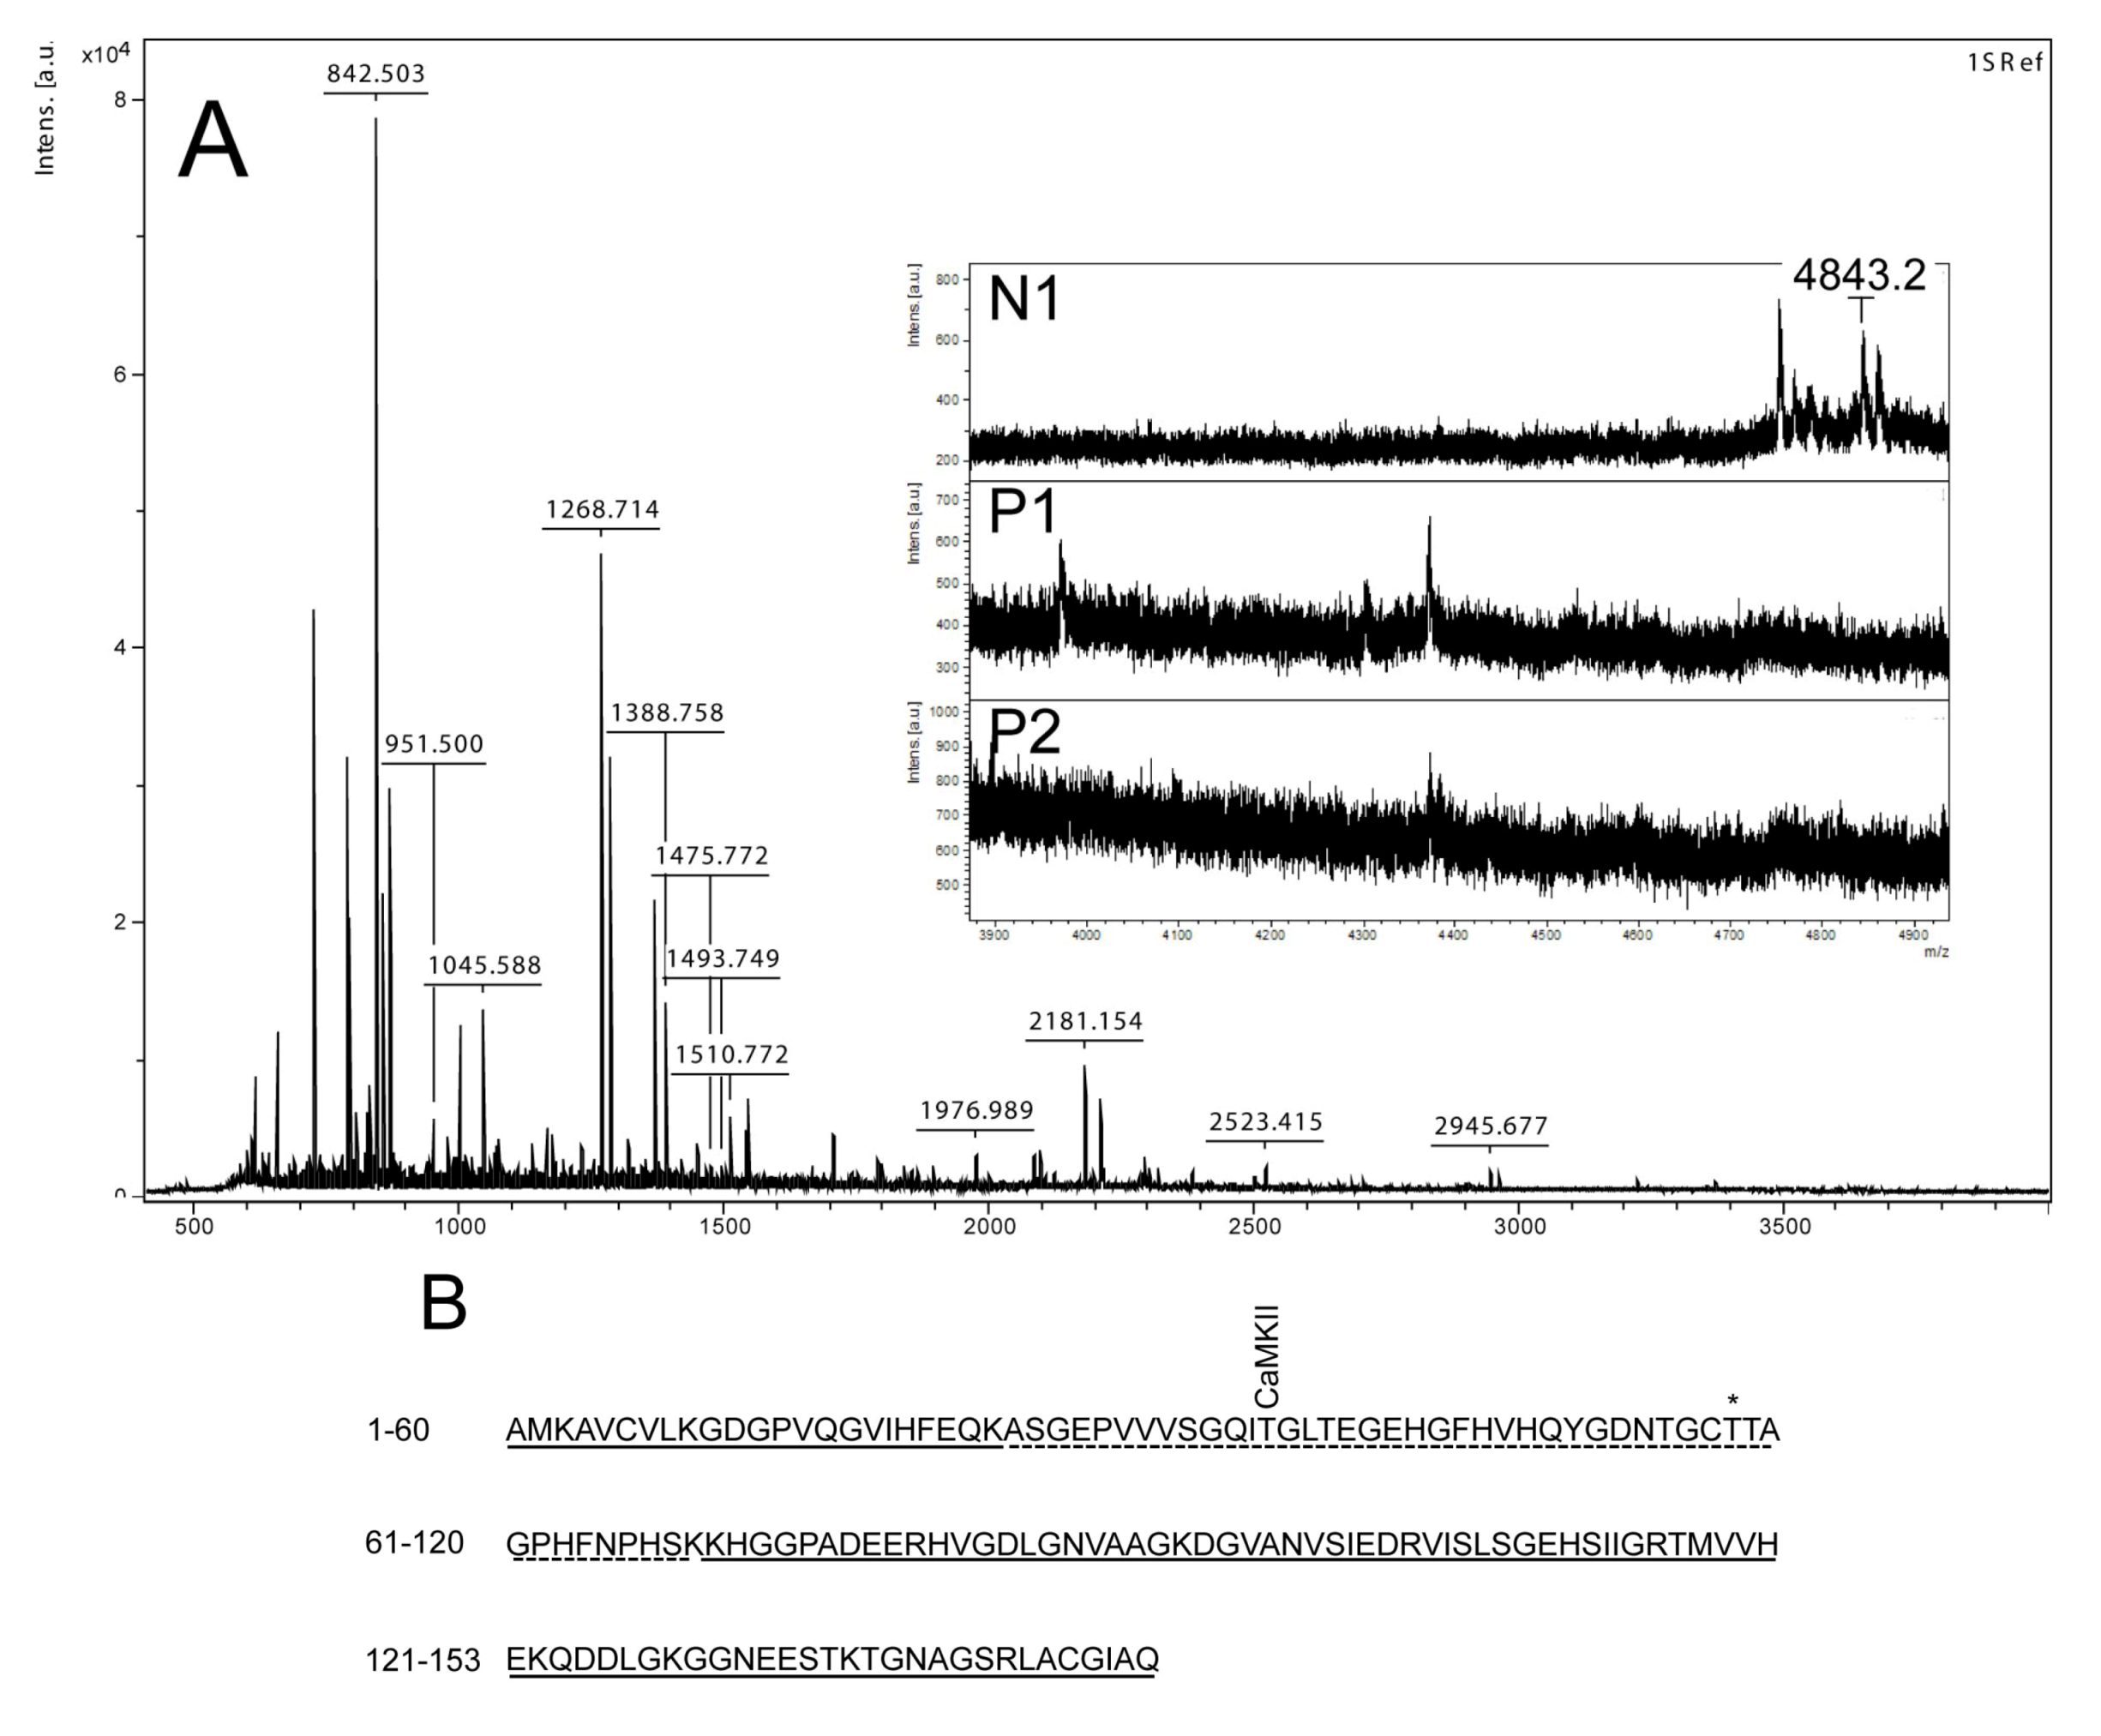
Mass spectrometry analysis of spot N1, P1 and P2. (
A) MALDI-MS spectrum of tryptic peptides obtained from P1 spot shown in
Figure 2. N1, P1, and P2 were all identified as SOD1. Mass spectra were similar for all three spots (N1, P1 and P2), except that the long tryptic peptide (4843.2
m/
z), corresponding to aa 24–69, was only observed in N1 (insert of
A). Sequence covered by all three spots is underlined in (
B). Dotted line refers to sequence covered only in N1 and represents the long tryptic peptide aa 24–69. This peptide has several possible Ser/Thr phosphorylation sites including a consensus sequence site for CaMKII and also a previously suggested phosphorylation site (asterisk) (Thr58) [
16].
Figure 3.
Mass spectrometry analysis of spot N1, P1 and P2. (
A) MALDI-MS spectrum of tryptic peptides obtained from P1 spot shown in
Figure 2. N1, P1, and P2 were all identified as SOD1. Mass spectra were similar for all three spots (N1, P1 and P2), except that the long tryptic peptide (4843.2
m/
z), corresponding to aa 24–69, was only observed in N1 (insert of
A). Sequence covered by all three spots is underlined in (
B). Dotted line refers to sequence covered only in N1 and represents the long tryptic peptide aa 24–69. This peptide has several possible Ser/Thr phosphorylation sites including a consensus sequence site for CaMKII and also a previously suggested phosphorylation site (asterisk) (Thr58) [
16].
By using the narrow ranged strips (pI 5.3–6.5) along with maximal protein loading, we were able to identify several phosphorylated proteins by mass spectrometry. Two of the phosphorylated spots (P1 and P2) that increased in intensity after nodularin exposure were identified as SOD1 (
Figure 2D and
Figure 3A). Neither of these was evident by protein staining. On the other hand, a more basic spot (N1) was visualized by Coomassie, both in control and in nodularin-exposed hepatocytes (
Figure 2A,B). N1 was shown to be a non-phosphorylated form of SOD1 (
Figure 2C,D and
Figure 3A insert). The acidic shifts of P1 and P2 from the parental N1 spot, together with their radioactive phosphate labeling, supported that P1 and P2 were phosphorylated forms of N1. In our effort to identify the specific phosphorylation site(s) of SOD1, we did not succeed. One explanation could be that the phosphorylation site(s) might be located in the long tryptic peptide (4843.2
m/
z) with low intensity extending from amino acid position 24 to 69 (
Figure 3B). This tryptic peptide was absent in the P1 and P2 spectra (
Figure 3A insert), indicating that it may have been post-translationally modified in the nodularin-exposed cells.
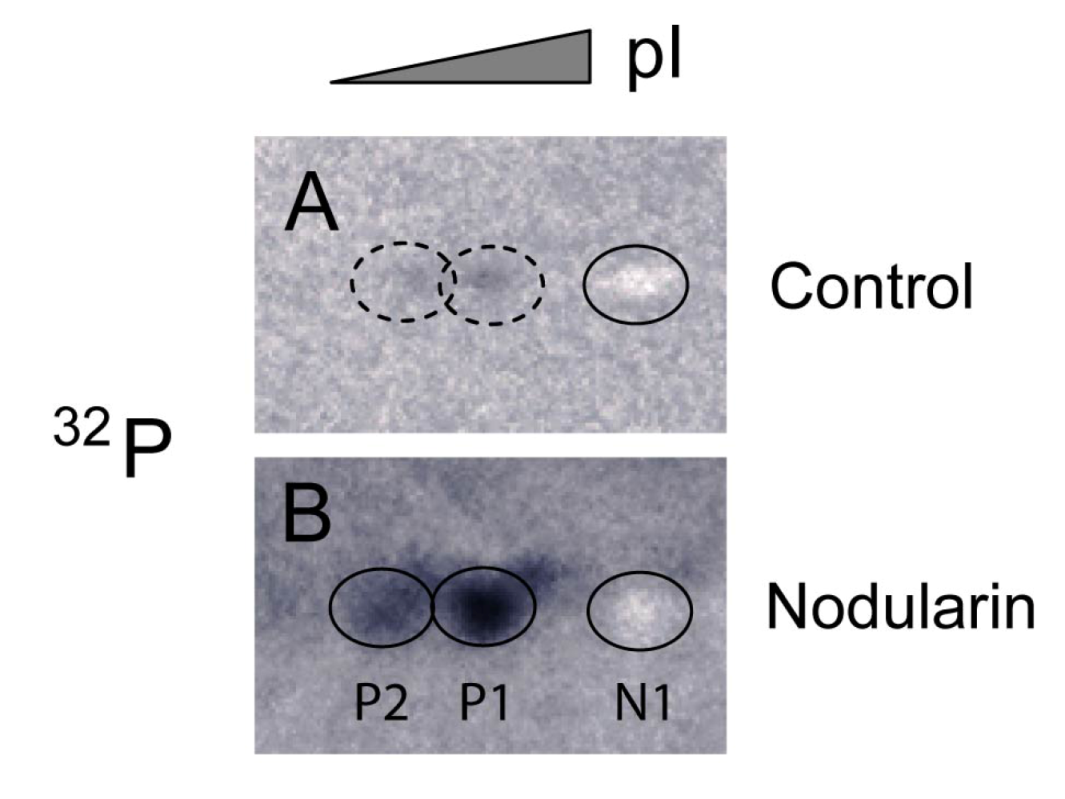
Nodularin-induced phosphorylation of SOD1 was further supported by immunoprecipitating SOD1 from total lysate of hepatocytes pre-labeled with radioactive phosphate. Again, the three forms (N1, P1 and P2) of SOD1 were recognized (
Figure 4). The silver stained N1 spots in both control and nodularin-treated hepatocytes could be observed as white “spots” on the autoradiograms (
Figure 4). P1 and P2 showed increased phosphate labeling after two minutes of exposure to 5 µM nodularin. The increased phosphorylation was more pronounced than in the hepatocytes treated for a longer period with a lower dose (200 nM) as seen in
Figure 2.
Figure 4.
Immunoprecipitation of SOD1 from
32P-labeled apoptotic hepatocytes. Hepatocytes were pre-labeled with
32Pi and exposed to 5 µM nodularin for 2 min. Total cell extract was immunoprecipitated with anti-SOD1 antibody and separated by two-dimensional gel electrophoresis (pI 4–7, 7 cm). See
Experimental Section for further details. The figure shows autoradiographs from control (
A) and nodularin-treated (
B) cells. The non-phosphorylated silver-stained SOD1 (spot N1) appeared as a white spot on the autoradiographs in both control- and nodularin-treated hepatocytes. Nodularin treatment led to increased abundance of the two phosphorylated SOD1 spots (P1 and P2). The effect was more pronounced than observed with a lower concentration of nodularin (
Figure 2).
Phosphorylation of SOD1 has previously only been shown in human erythrocytes [
16], but the function of this phosphorylation is unknown. Apart from identifying phosphorylation of Ser2 [
16], which is not found in rat, Wilcox
et al. also suggested Thr58 or Ser59 to be phosphorylated. Thr58 is a highly conserved amino acid and also a possible phosphorylation site in nodularin-exposed rat hepatocytes (
Figure 3). Our autoradiographs showed that nodularin-exposed hepatocytes possessed two phosphorylated SOD1 spots (
Figure 2 and
Figure 4), both showing an acidic shift compared to the non-phosphorylated form. The tryptic peptide of amino acid 24–69 was the only peptide that did not appear in these phosphorylated forms (P1 and P2) when compared to the non-phosphorylated form (N1) (
Figure 3). This peptide contains a number of potential Ser and Thr phosphorylation sites.
2.2. Ca2+/Calmodulin-Protein Kinase II Inhibitor KN93 Delays Nodularin-Induced ROS Development and Inhibits Post-Translational Modifications of SOD1
SOD1 is known as a broad acting scavenger of oxidative stress [
12] and the observed SOD1 phosphorylation could therefore be related to increased ROS development. Microcystin has previously been shown to increase ROS in primary hepatocytes [
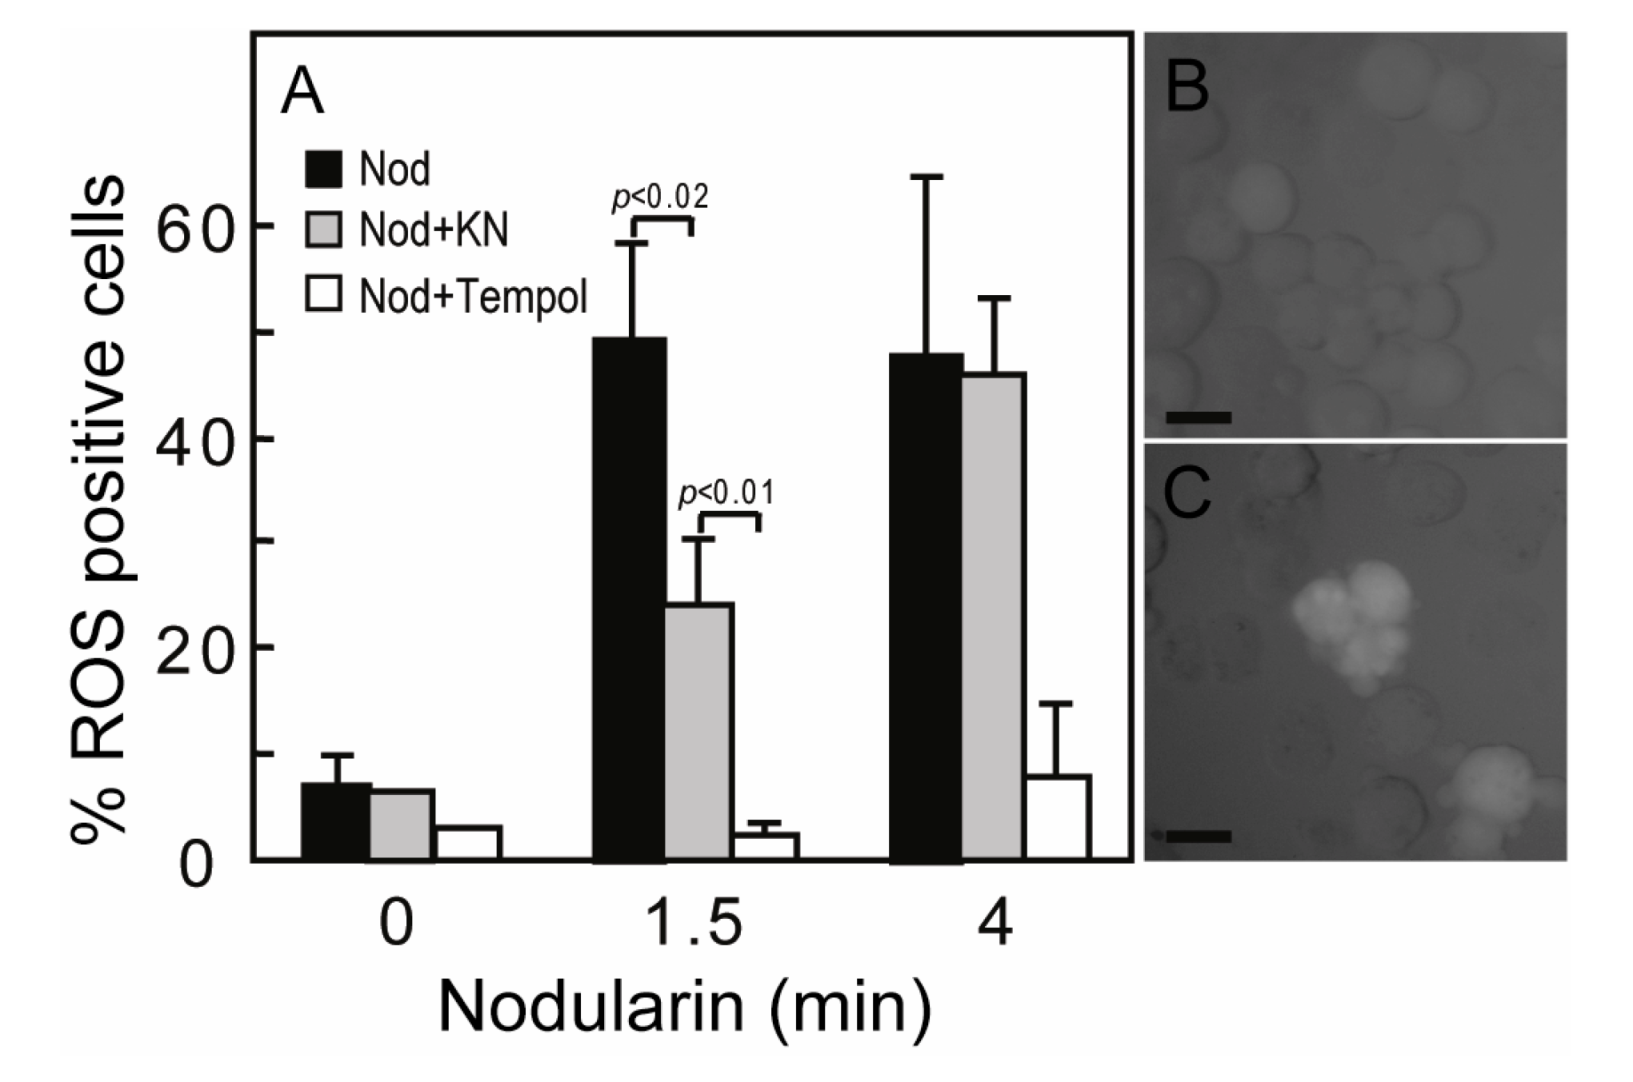
17]. Nodularin exposure also resulted in a ROS development, both at 200 nM (data not shown) and 5 μM exposure (
Figure 5A). The ROS development was efficiently inhibited by the SOD mimic TEMPOL (
Figure 5A). As we have previously shown that Ca
2+/calmodulin protein kinase II (CaMKII) is required for phosphatase inhibitor-induced apoptosis [
3], we also tested whether CaMKII activity had any effect on nodularin-induced ROS development. Interestingly, KN93, a CaMKII inhibitor, did inhibit ROS development (
Figure 5). This is in agreement with a study of microcystin-induced apoptosis, in which CaMKII was proposed to act upstream of mitochondrial ROS production [
4].
Figure 5.
Nodularin-induced ROS development can be delayed by CaMKII inhibitor KN93. (A) Hepatocytes were incubated with 5,6-chloromethyl-2',7'-dichlorodihydrofluorescein (CM-H2DCFDA) with or without either KN93 (30 µM) or the SOD1 mimic TEMPOL (5 mM) prior to addition of nodularin (5 µM). Hepatocytes were fixed and evaluated immediately by fluorescence microscopy. Hepatocytes were scored ROS positive when fluorescence increased clearly above hepatocyte auto-fluorescence (B, C). Both KN93 and TEMPOL inhibited nodularin-induced development of ROS. Panel B shows control cells and panel C nodularin-exposed cells. Values are the mean +/− SEM of 3–5 separate experiments. p-values; Student’s t-test. Bars: 20 µm.
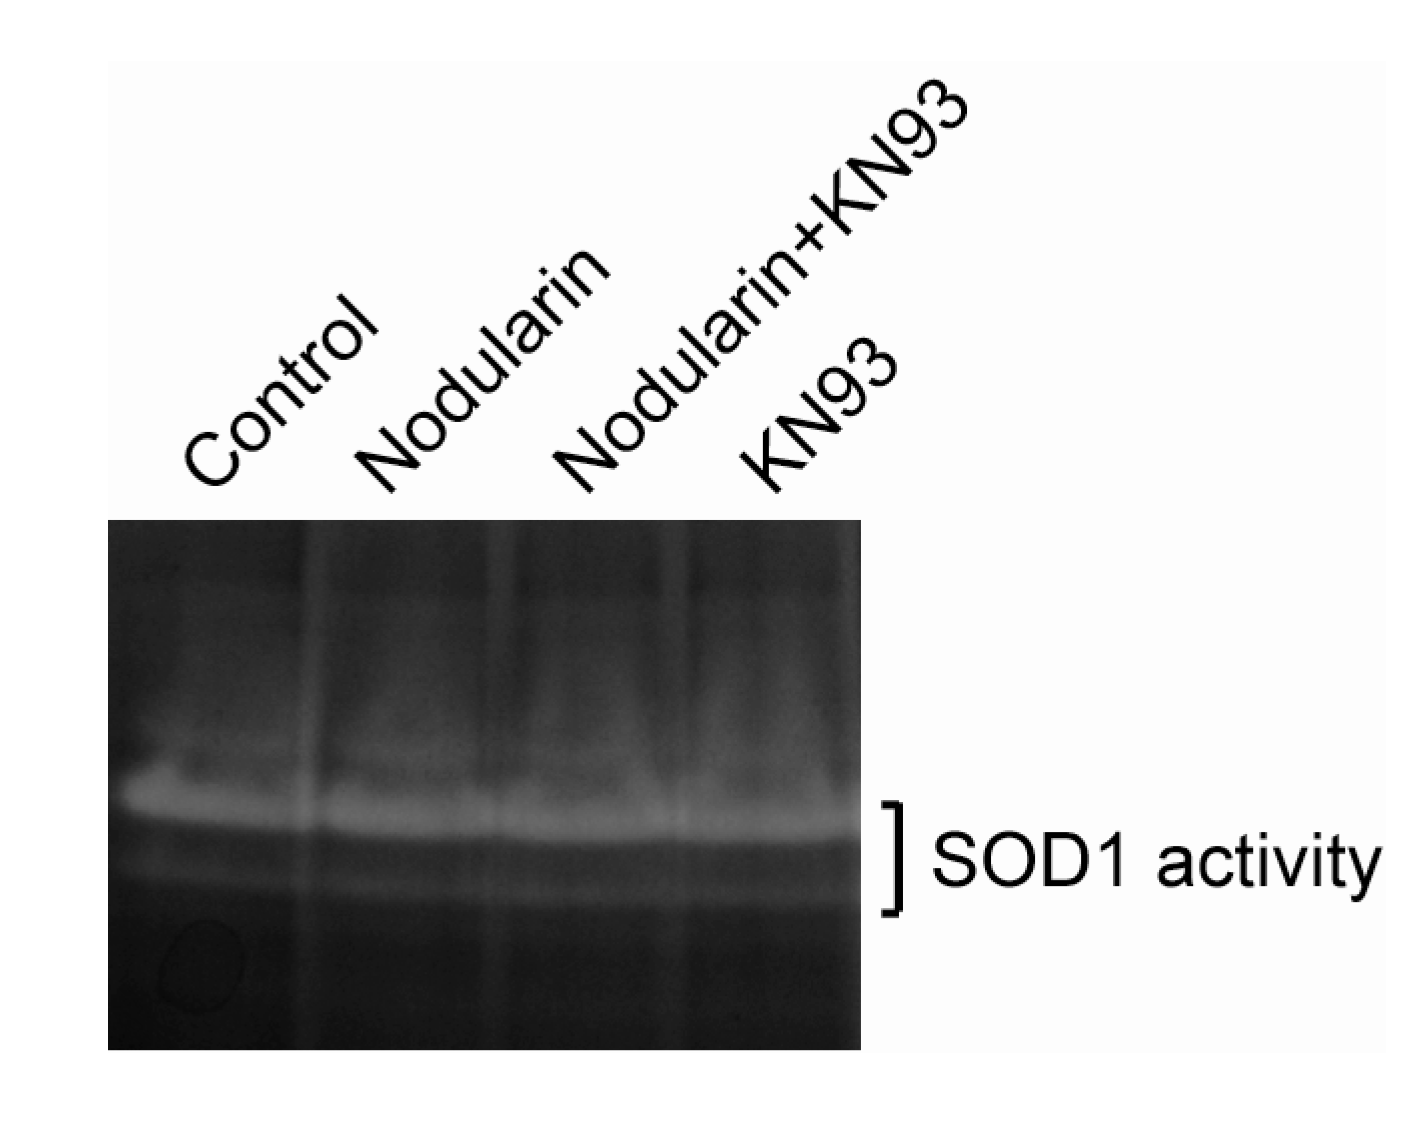
Next, we examined whether nodularin exposure, resulting in increased ROS (
Figure 5) and phosphorylation of SOD1 (
Figure 2 and
Figure 4), had any effect on the enzymatic SOD1 activity. As can be seen in
Figure 6, SOD1 activity appeared to be stable in the nodularin-exposed cells. Neither did SOD1 activity depend on CaMKII activity.
Figure 6.
SOD1 activity is retained in nodularin-exposed hepatocytes. Hepatocytes were pre-incubated with or without CaMKII inhibitor KN93 (30 µM) prior to addition of nodularin (200 nM) or left untreated. After 10 min of incubation cells were harvested, lysed, and equal amount of proteins were separated on a native gel and stained for SOD1 activity. See
Experimental Section for further details.
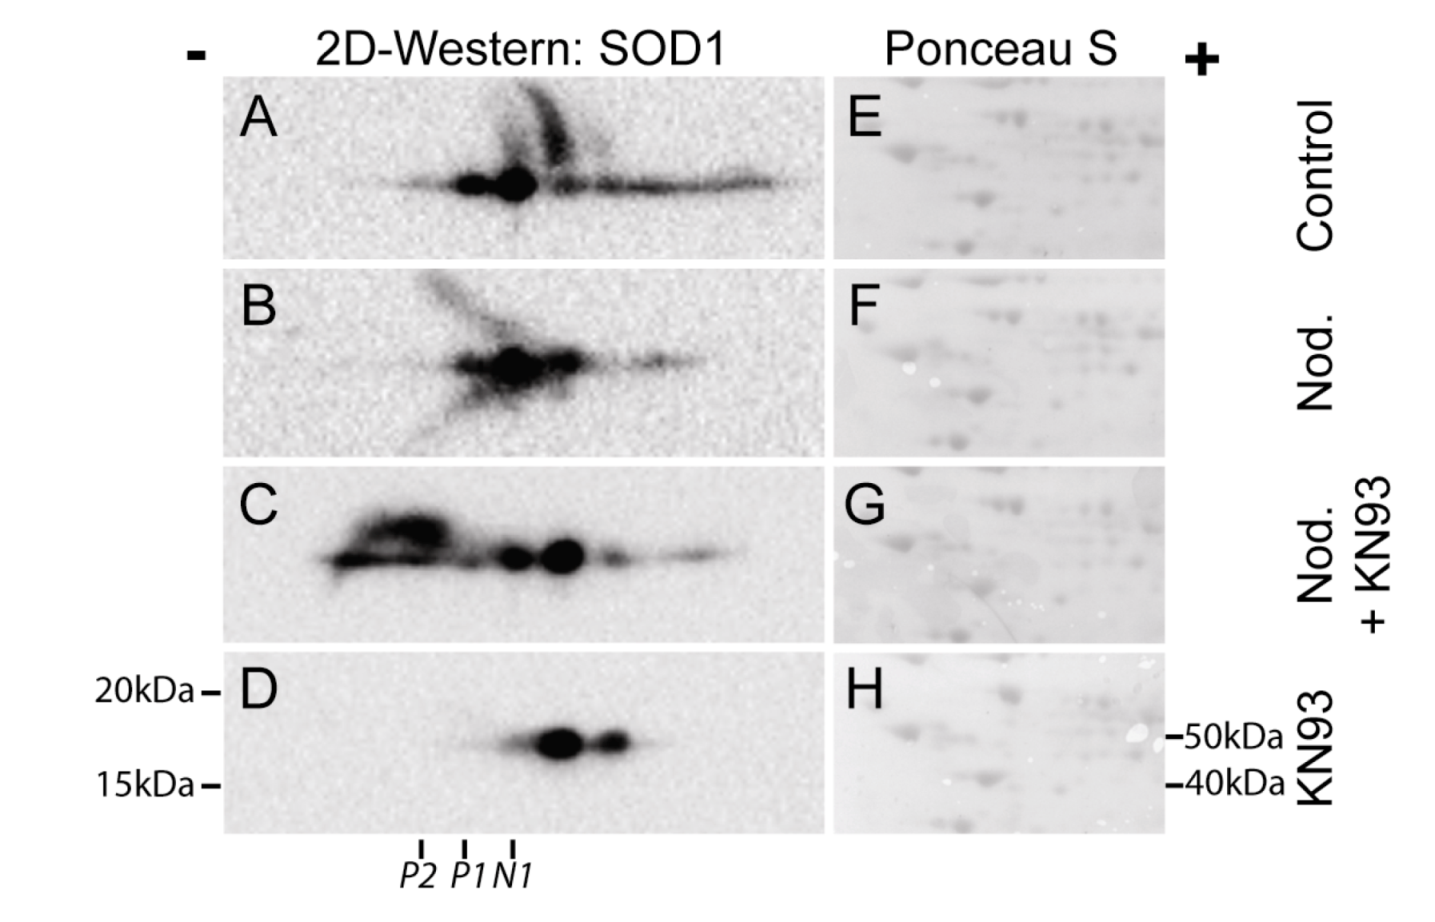
Figure 7.
CaMKII inhbitor KN93 regulates post-translational modification of SOD1. Hepatocytes were pre-incubated without (
A,
B) or with 30 µM KN93 (
C,
D) prior to addition of nodularin (200 nM). After 10 min of exposure nodularin samples (
B,
C) and controls (
A,
D) were TCA-precipitated and proteins were separated by two-dimensional gel electrophoresis. Gels were blotted and the membranes were stained with Ponceau S (
E–
H) before they were probed with anti-SOD1 antibody. SOD1 spots were horizontally aligned based on the Ponceau S staining. Positions of N1, P1 and P2 (
Figure 2) are indicated.
We have previously shown that the majority of microcystin-induced phosphorylation events depend on CaMKII activity [
3]. Using two-dimensional gel electrophoresis, followed by Western blotting, we elucidated the role of CaMKII in post-translational modification of SOD1 (
Figure 7). In non-treated hepatocytes a number of SOD1 spots were observed, both on the basic and the acid side of the major SOD1 spot (N1) (
Figure 7A). Nodularin exposure resulted in an acidic shift of the most basic SOD1 spots (
Figure 7B). A SOD1 spot at the position of P1 (
Figure 2) was observed, but a similar positioned spot was also observed in the control cells. This indicates that at position P1 there is a mixture of phosphorylated SOD1 and SOD1 with another modification giving a similar acidic shift. Similar acidic pI shifts will be observed in cases where cysteines are modified. Fujiwara
et al. [
18] showed that Cys111 of recombinant SOD1could be converted to cysteine sulfinic acid and to cysteine sulfonic acid, giving acidic pI shifts, when exposed to H
2O
2. It should be noted that this cysteine modification did not alter SOD1 activity [
18], which is in accordance with our observations (
Figure 6). Taken into account the nodularin-induced ROS development (
Figure 5), the SOD1 modified spots we observe (
Figure 7) can indeed be mixtures of phosphorylated and oxidized forms of SOD1. To identify possible CaMKII-regulated oxidation or phosphorylation sites of SOD1, one would need to proceed in a transfectable cell model using site-directed mutagenesis. Unfortunately, the hepatocyte specific nodularin can then not be used as an apoptosis inducer.
2.3. SOD1 Concentration Is High in the Sub-Membranous Area and in the Apoptotic Buds of Nodularin-Exposed Hepatocytes
We next studied the sub-cellular localization of SOD1 in nodularin-exposed hepatocytes to possibly find any indication of the functional role of SOD1 post-translational modification.
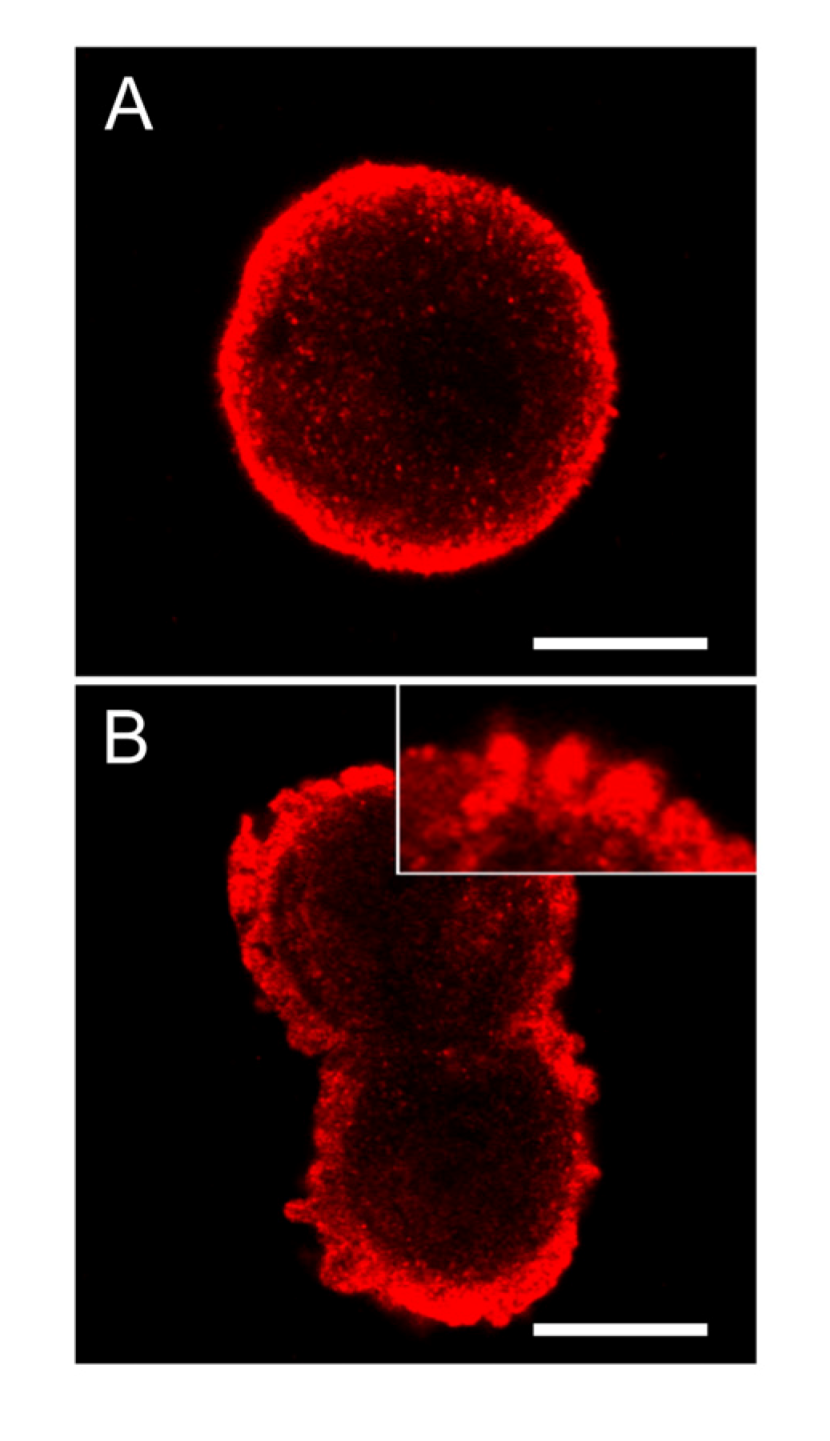
In control cells of hepatocytes in suspension cultures, the extent of SOD1 was highly increased in the area just below the cellular membrane (
Figure 8A). Following nodularin treatment, the sub-membranous SOD1 seemed to be concentrated into the apoptotic buds, leaving “tails” of SOD1 staining in the cytoplasma (
Figure 8B).
Figure 8.
SOD1 is highly concentrated below the cellular membrane in hepatocytes and also in the apoptotic cell membrane buds. In untreated control cells, high concentration of SOD1 was found in the sub-membranous area (A). After 2 min of nodularin treatment (5 µM) SOD1 localized to the apoptotic cellular membrane buds and stretched into the cytosol (B and insert of B). To visualize SOD1 cells were immunostained with anti-SOD1 antibody. Bars: 10 µm.
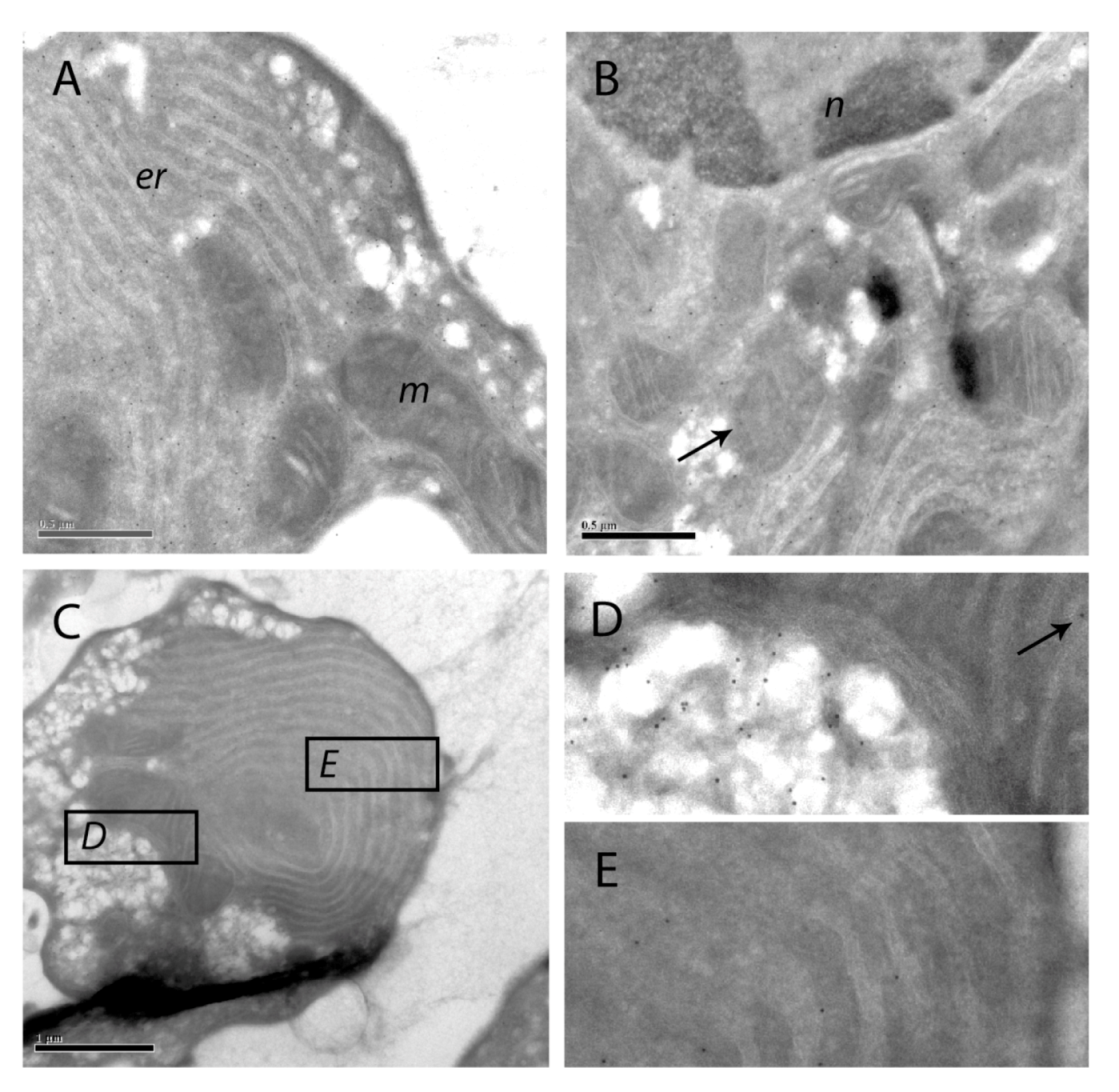
To study this in more detail we cryosectioned hepatocytes in suspension and labeled them with protein A-gold particles after incubation with anti-SOD1 antibody. In control cells, the electron microscopic resolution of SOD1 localization in isolated hepatocytes resembled that previously observed in hepatocytes of unexposed rat livers (data not shown) [
19]. Thus, the majority of SOD1 was found in the cytoplasm, including in the microvilli, with minor amounts in the mitochondria and endoplasmatic reticulum (data not shown). In late-staged apoptosis following nodularin exposure, labeling density of SOD1 was slightly higher close to the cell surface area than around the cell nucleus (
Figure 9A,B). The cisterna of the endoplasmatic reticulum (er) and the mitochondria (m) contained only minor amounts of SOD (
Figure 9), similar as observed in the unexposed hepatocytes and liver (data not shown) [
19].
Figure 9.
Immuno-gold labeling of SOD1 on cryosections of apoptotic hepatocytes. SOD1 was visualized with protein A-gold labeling of SOD1 in hepatocytes treated with 200 nM nodularin for 20 min. SOD1 was found throughout the cytosol and, to a minor degree, in the euchromatin area of the nucleus (n) (A and B). Minor amounts of SOD1 were observed in mitochondria (m) (arrows) and in the cisternae of endoplasmatic reticulum (er). In the apoptotic buds (C) a high concentration of SOD1 was found in the matrix part of the buds and between the tightly packed layers of endoplasmatic reticulum (C–E).
The immunofluorescence-based observation of high SOD1 concentrations in the apoptotic buds was further supported by the protein A-gold-labeling. Thus, in apoptotic buds of the hepatocytes (
Figure 9C) high density of labeling was found in the cytoplasmic matrix part of the buds and minor amounts in the mitochondria (
Figure 9D). SOD1 was also found between the layers of tightly packed endoplasmatic reticulum in the buds (
Figure 9E).
Mitochondrial SOD1 has been proposed to have a pro-apoptotic role by being released together with cytochrome C from mitochondria-dependent hepatocyte apoptosis [
20]. When we investigated sub-cellular distribution of SOD1 in nodularin-induced apoptotic hepatocytes we still could observe SOD1 in mitochondria (
Figure 9, arrows). We did not observe any ultrastructural damage or swelling of mitochondria, which accompanies mitochondrial-dependent apoptosis [
20] (
Figure 9). This suggests that mitochondrial SOD1 release does not have a major role in nodularin-induced apoptosis. On the other hand, the highly concentrated appearance of SOD1 in the sub-membranous area and in the apoptotic buds would make it possible for SOD1 to act in the dramatic reorganization of the cytoskeleton that occurs during the nodularin-induced apoptotic budding (
Figure 1) [
10,
11].
2.4. SOD1 Co-localization with Actin Filaments Is Disrupted in Hepatocytes Exposed to Nodularin
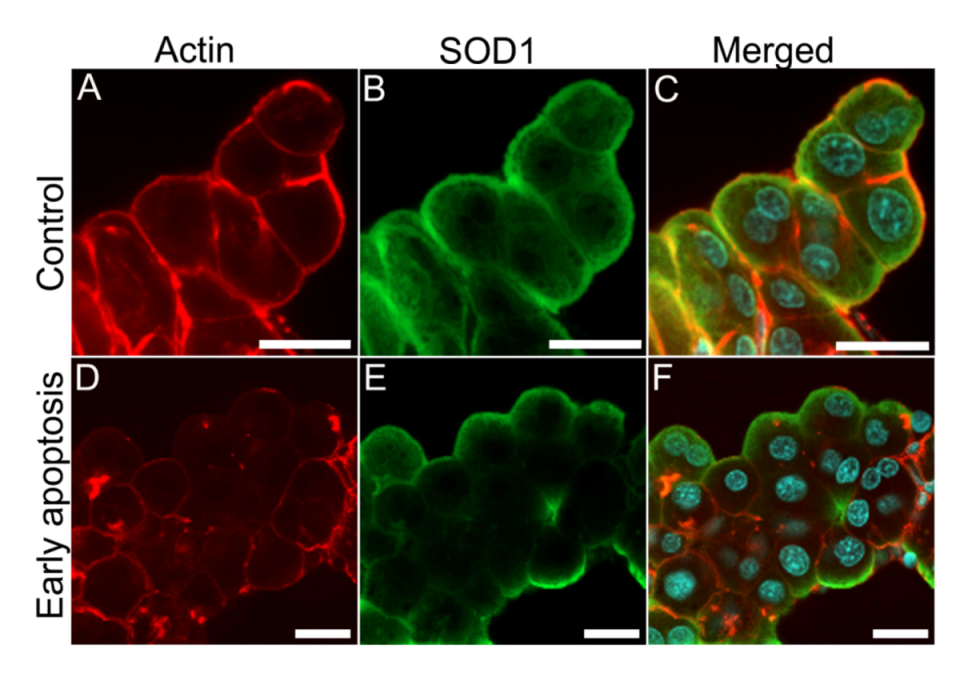
Nodularin-induced apoptosis involves reorganization of the cell cytoskeleton, including actin filaments (
Figure 1D,E), in order to develop apoptotic morphology (
Figure 1). Interestingly, expression of SOD1 has been shown to be essential for the preservation of the cytoskeleton [
15], and disease-related SOD1 mutants interact directly with the actin cytoskeleton [
14,
21]. We therefore compared the localization of SOD1 and actin filaments in nodularin-exposed hepatocytes. In control cells SOD1 and actin showed an overlap in the sub-membranous area (
Figure 10A–C). In the early stage of nodularin-induced apoptosis, before budding started to appear, this co-localization was partially lost (
Figure 10D–F).
Figure 10.
SOD1 and actin co-localization is disrupted in nodularin-exposed hepatocytes. In unexposed control hepatocytes, a high degree of both SOD1 and actin fibers were found co-localized in the sub-membranous area (yellow) (A–C). After exposure with 200 nM nodularin for 10 min the actin cytoskeleton reorganized into aggregates while SOD1 was still found in the sub-membranous area (D–F). Cells were fixed and labeled with anti-SOD1 antibody (green), followed by incubation with rhodamin-conjugated phalloidin (red), and DAPI (blue) for nuclear staining. Bars, 20 µm.
We next tested whether the SOD1-actin co-localization (
Figure 10) could be shown to be a direct or indirect binding between the two proteins using co-immunoprecipitation. Both proteins are high abundant proteins which always increase the risk of unspecific binding [
22] and immunoprecipitation of F-actin is usually not very efficient. It should be noted that previous studies have only been able to immunoprecipitate minor amounts of wild type SOD1 together with actin [
14]. Only a minor amount of SOD1 was pulled down together with actin also in our untreated cells (
Figure 11A,B). On the other hand, in the nodularin-treated cells we did not observe any SOD1-actin co-interaction (
Figure 11C,D). This indicated that the observed co-localization of SOD1 and F-actin (
Figure 10) may involve co-interaction between the two proteins.
Figure 11.
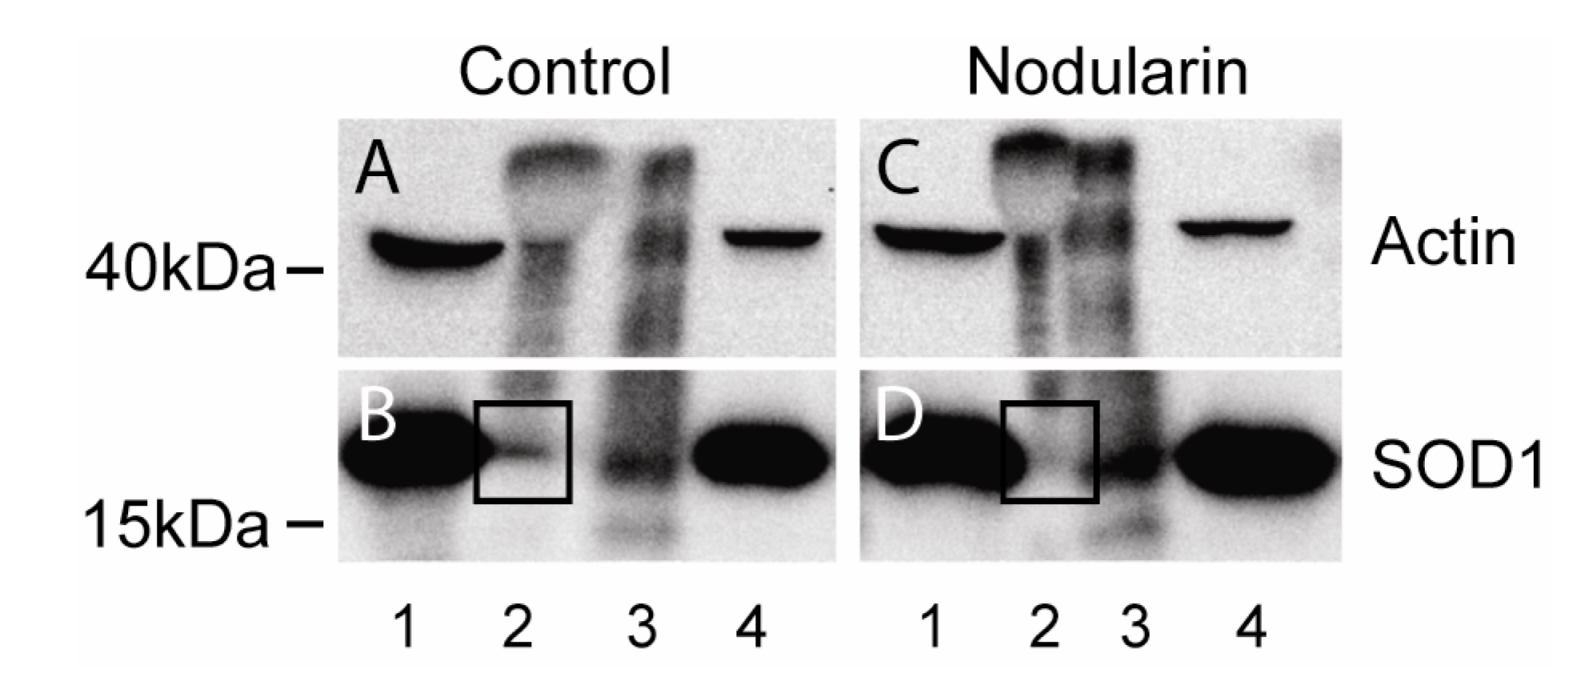
Co-immunoprecipitation of SOD1 and actin. Hepatocytes were left untreated (A, B) or exposed to 200 nM nodularin for 20 min (C, D). Total cell lysates were immunoprecipitated with anti-actin antibody and eluted proteins were separated by SDS-PAGE followed by Western blotting usinganti-actin and anti-SOD1 antibodies. Lane 1: total lysate, 2: glycine eluate, 3: SDS-eluate, and 4: unbound. Immunoprecipitated SOD1 is indicated in boxes.
Figure 11.
Co-immunoprecipitation of SOD1 and actin. Hepatocytes were left untreated (A, B) or exposed to 200 nM nodularin for 20 min (C, D). Total cell lysates were immunoprecipitated with anti-actin antibody and eluted proteins were separated by SDS-PAGE followed by Western blotting usinganti-actin and anti-SOD1 antibodies. Lane 1: total lysate, 2: glycine eluate, 3: SDS-eluate, and 4: unbound. Immunoprecipitated SOD1 is indicated in boxes.
2.5. SOD1 May Operate in Cellular Micro-Domains to Control Cytoskeletal Reorganization
Apart from being known as a scavenger of oxidative stress [
12], SOD1 has more recently also been shown as a redox regulatory protein at discrete sub-cellular domains [
13]. In these sub-cellular domains, ROS-sensitive kinases such as mitogen-activated protein kinase (MAPK) p38 and CaMKII are suggested to have key roles [
23,
24]. Since only a minor amount of the total SOD1 was shown to be phosphorylated (
Figure 2 and
Figure 4) this suggests that SOD1 phosphorylation may have a discrete regulatory function and not necessarily be a way to protect the cells from the major mitochondrial-linked ROS burst that occurs in nodularin-exposed hepatocytes [
17,
25].
Reorganization of actin filaments seems to depend on locally produced ROS [
26,
27]. Rac1, an activator of NADPH oxidase, is a mediator of this redox-dependent reorganization of the actin cytoskeleton [
26]. Interestingly, SOD1 has been shown to interact with Rac1 in a redox-dependent manner [
13]. This interaction keeps Rac1 in an active state, making it possible for Rac1 to participate in actin reorganization [
26,
28]. Phosphorylation and possibly also oxidation of SOD1 may regulate its ability to interact with other proteins.
Phosphorylation of SOD1 (
Figure 2 and
Figure 4) is accompanied with CaMKII-dependent phosphorylation of myosin light chain (MLC) (data not shown) in nodularin-exposed hepatocytes. Phosphorylated MLC has been shown to be a target for activated Rac1 [
29] and has also proven to be necessary for actin-myosin-based apoptotic budding [
30]. Nodularin-induced phosphorylation of MLC and SOD1 may therefore be involved in regulating that apoptosis-related cytoskeletal reorganization and budding in nodularin-exposed hepatocytes.
