Article

Selective Membrane Redistribution and Depletion of Gαq-Protein by Pasteurella multocida Toxin

Department of Microbiology, University of Illinois at Urbana-Champaign, Urbana, IL 61801, USA
*
Author to whom correspondence should be addressed.
Current address: School of Biotechnology, Southern Medical University, Guangzhou 510515, China.
Toxins 2016, 8(8), 233; https://doi.org/10.3390/toxins8080233
Submission received: 15 June 2016 / Revised: 22 July 2016 / Accepted: 25 July 2016 / Published: 1 August 2016
(This article belongs to the Special Issue Pasteurella multocida and Its Virulence Factors)

Abstract

:
Pasteurella multocida toxin (PMT), the major virulence factor responsible for zoonotic atrophic rhinitis, is a protein deamidase that activates the alpha subunit of heterotrimeric G proteins. Initial activation of G alpha-q-coupled phospholipase C-beta-1 signaling by PMT is followed by uncoupling of G alpha-q-dependent signaling, causing downregulation of downstream calcium and mitogenic signaling pathways. Here, we show that PMT decreases endogenous and exogenously expressed G alpha-q protein content in host cell plasma membranes and in detergent resistant membrane (DRM) fractions. This membrane depletion of G alpha-q protein was dependent upon the catalytic activity of PMT. Results indicate that PMT-modified G alpha-q redistributes within the host cell membrane from the DRM fraction into the soluble membrane and cytosolic fractions. In contrast, PMT had no affect on G alpha-s or G beta protein levels, which are not substrate targets of PMT. PMT also had no affect on G alpha-11 levels, even though G alpha-11 can serve as a substrate for deamidation by PMT, suggesting that membrane depletion of PMT-modified G-alpha-q has specificity.

Graphical Abstract

1. Introduction

Pasteurella multocida toxin (PMT) is the major virulence factor responsible for atrophic rhinitis, pasteurellosis, and dermonecrosis caused by infection with toxigenic capsular type D and some A strains of Pasteurella multocida (reviewed in [1]). PMT is a 1285-amino acid AB protein toxin that acts intracellularly by gaining entry into host cells via binding membrane phospholipids phosphatidylcholine, sphingomyelin, and an as-yet unknown trypsin-sensitive protein partner [2]. PMT is subsequently endocytosed and released from the late endosomes into the cytosol in a pH dependent manner [3,4,5], where it targets heterotrimeric G-proteins and modulates their downstream signaling pathways (reviewed in [6]). PMT acts on α subunits of the Gαq/11, Gα12/13, and Gαi1/2/3, but not Gαs families [7,8,9,10] through deamidation of a specific Gln residue in the switch II region of the active site of Gα subunits [11], changing Glu to Gln and converting the Gα-protein into a constitutively active form.
Physiologically, PMT stimulates phospholipase C β-1 (PLCβ1) signaling through its preferential activation of Gαq of the Gαq/11 family of G-proteins [9,10]. By doing so, PMT increases the intracellular cytoplasmic concentration of Ca2+ and activates mitogenic signaling pathways, leading to increased cellular proliferation and in some cell types cell differentiation [9,12]. PMT also indirectly activates Rho signal transduction through its action on Gαq/11 and Gα12/13 [13,14,15,16], leading to actin cytoskeletal rearrangements and changes in cellular morphology [10,14,17,18,19,20,21]. Thus far, the only Gα subunit that PMT does not deamidate or activate is Gαs [8,22,23], the stimulatory regulator of adenylate cyclase (AC). Instead, PMT inhibits adenylate cyclase activity through its activation of inhibitory AC regulators of the Gαi family [23]. PMT activation of these different G-protein signaling pathways, in conjunction with crosstalk among the downstream signaling pathways, can lead to multiple cellular outcomes (reviewed in [6,24]).
Although PMT modulates numerous intracellular signaling pathways to dictate cellular fate by constitutive activation of the Gα proteins, the overall activation of downstream signaling is not sustained and is subsequently mitigated by an unknown mechanism of downregulation. PMT causes an initial strong activation of downstream calcium and mitogenic signaling, which is subsequently followed by an uncoupling of the signaling in the case of Gαq-CPLCβ1 [9,21] and Gαi-AC [23]. Moreover, it has been shown that prolonged PMT treatment is sufficient to downregulate Gαq-mediated G-protein-coupled inward rectifying K+ channels [25,26,27] and to block agonist-induced binding of GTPγS binding to Gαi protein [23].
It is well established that sustained exposure of many G-protein-coupled receptors (GPCR), including those coupled with Gq and G11 proteins, to their cognate agonist results in desensitization of the pathway due to a sequestration, modification or reduction in cellular levels of the receptor and/or the Gα subunit [28,29,30,31,32,33,34]. This desensitization or downregulation may also result from a redistribution of the Gα proteins in the membrane to the cytosol, or within membranes from detergent resistant membranes (DRMs, or lipid rafts) to more soluble membrane fractions [34,35,36,37,38]. Indeed, some GPCRs, G proteins, and their effectors are not only localized in DRMs, but also dynamically move in and out of them during signal transduction [39]. In each of these cases, the downregulation of Gα signaling was mediated through agonist binding of the GPCR. Until now, discerning how the subsequent cellular downregulation of PMT-modified Gα-proteins occurs has not been studied.
In this study, we investigated the fate of the Gαq, Gα11, and Gαs proteins in HEK-293T cells after PMT treatment by determining the levels of the Gα protein in whole cell lysates, total membranes, detergent resistant membranes (DRMs), and the soluble membrane and cytosolic fractions. Results from our experiments indicate that treatment of HEK-293T cells with wildtype PMT, but not catalytically inactive mutant PMT (C1165S), stimulates the selective downregulation of Gαq, but not Gαs or Gα11, through redistribution of the Gαq protein from DRMs to soluble membrane and cytosolic fractions with overall loss of Gαq protein from the plasma membrane.

2. Results

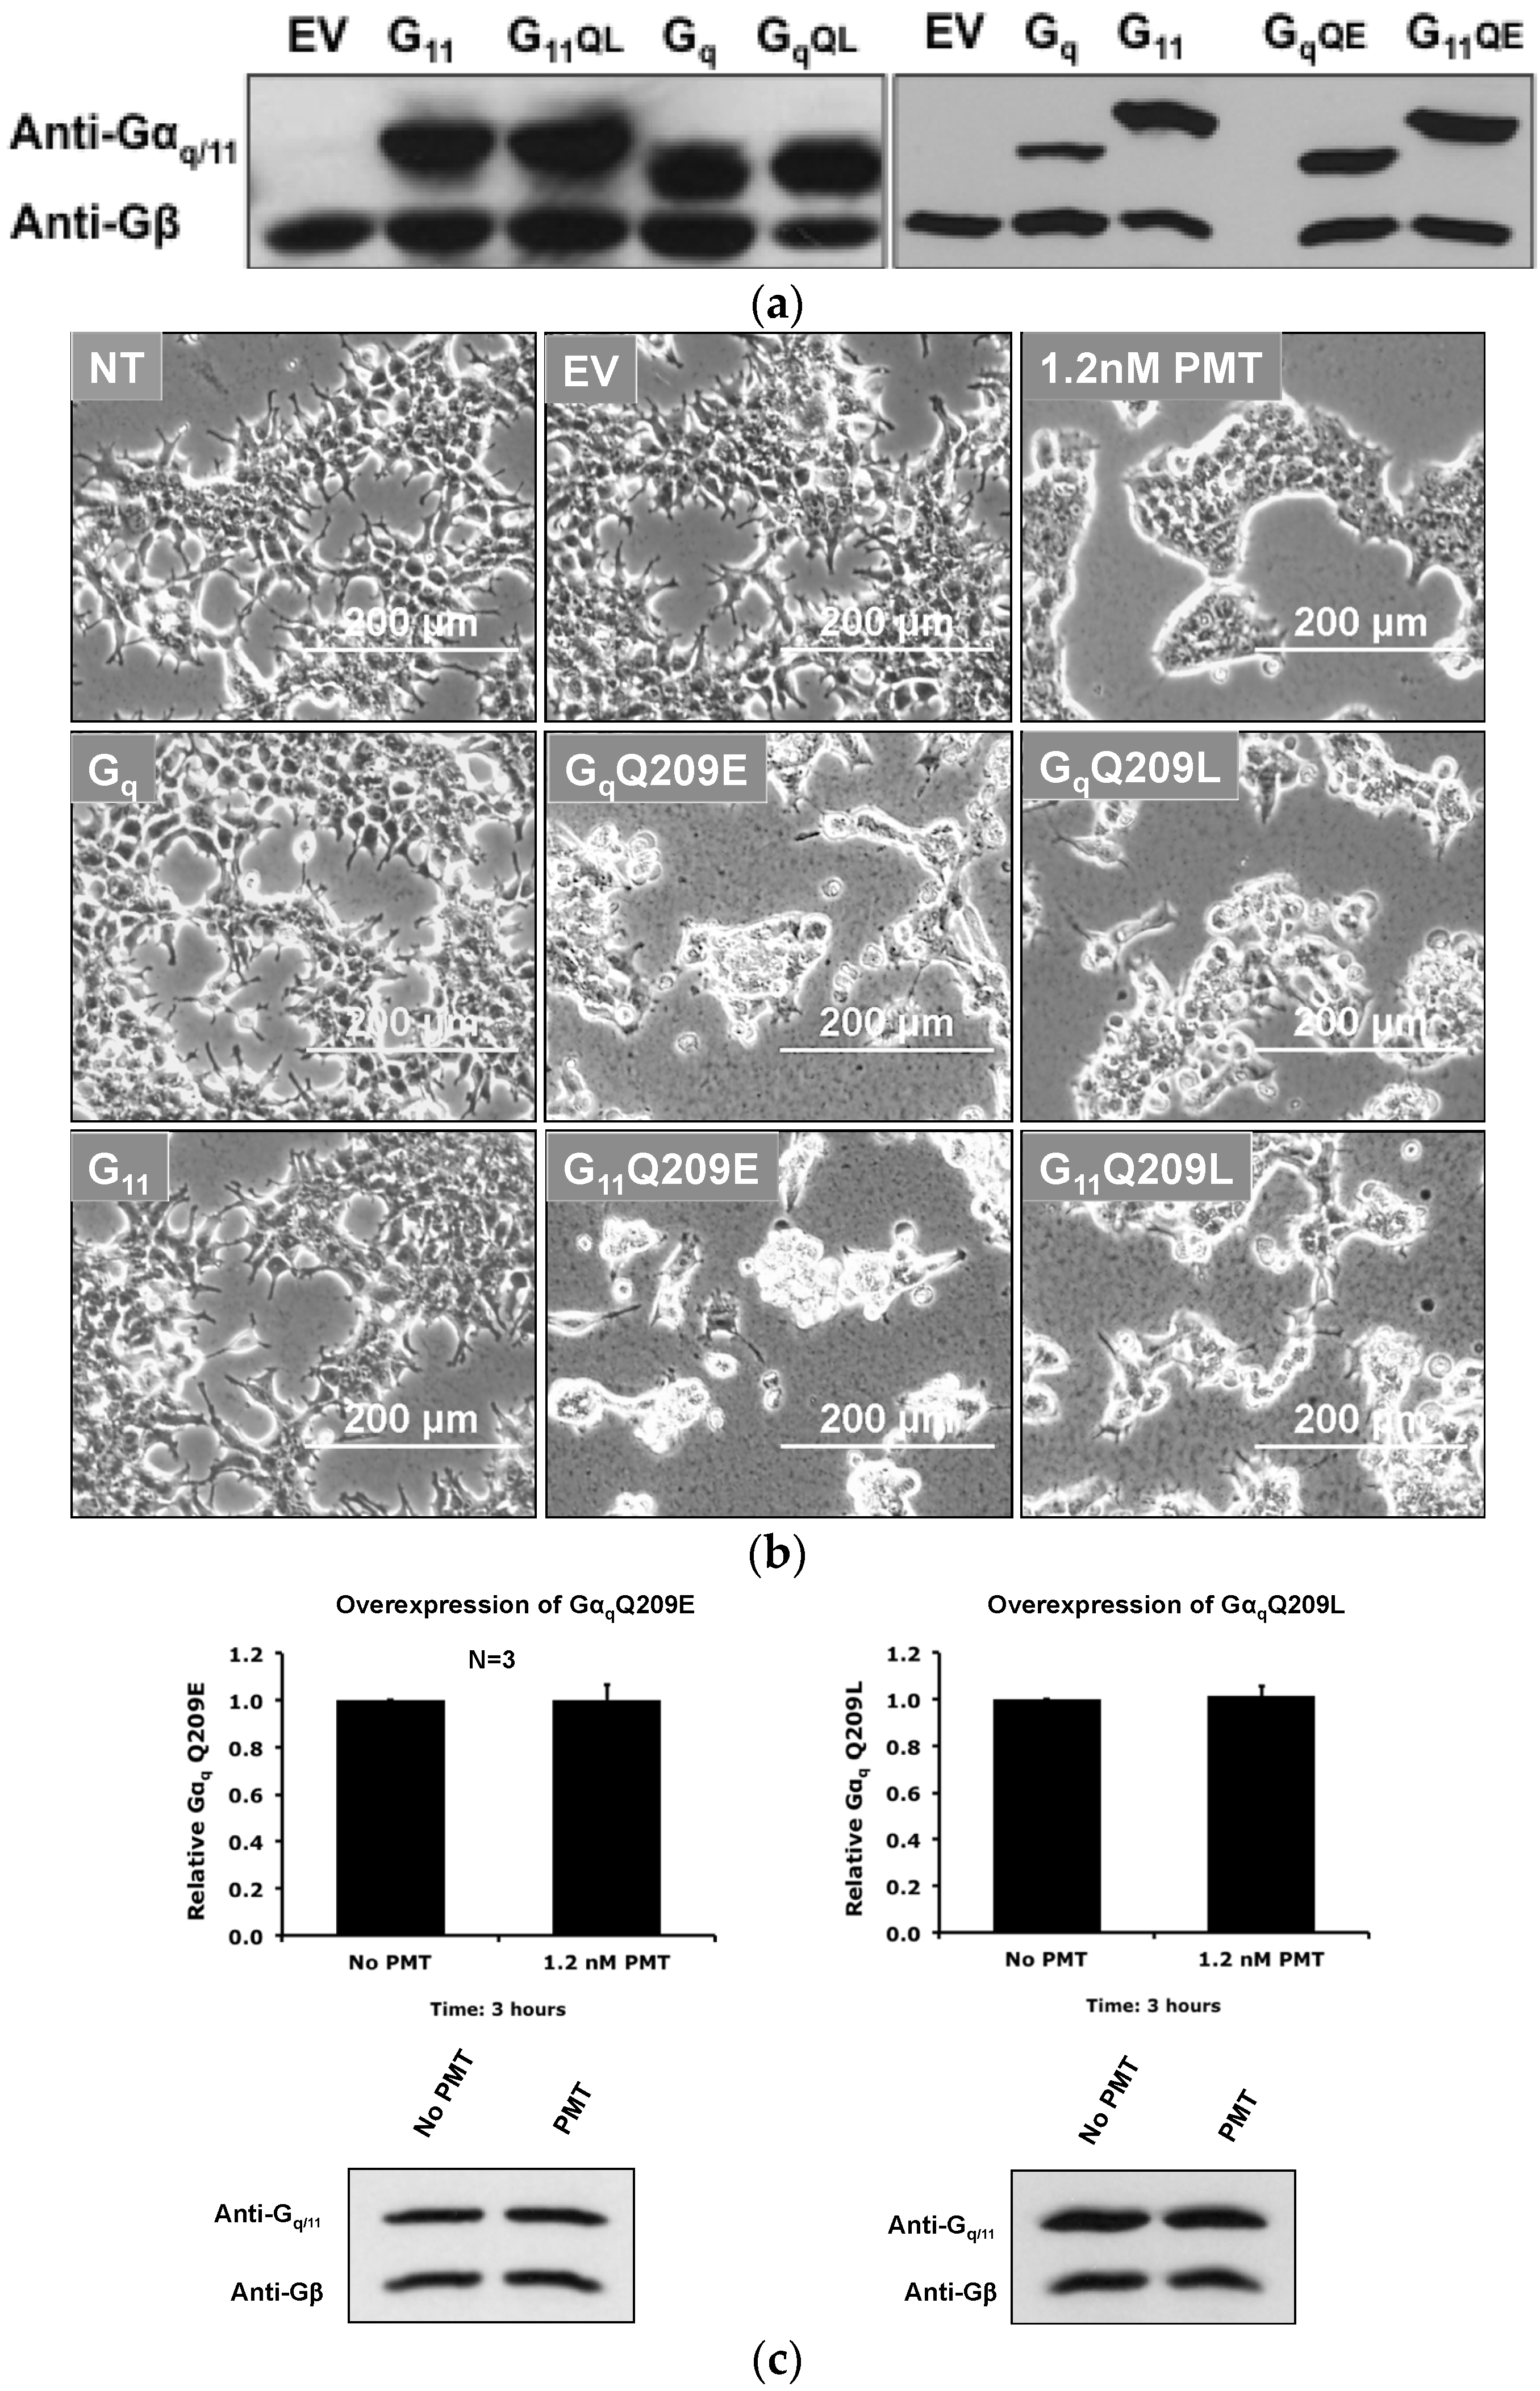
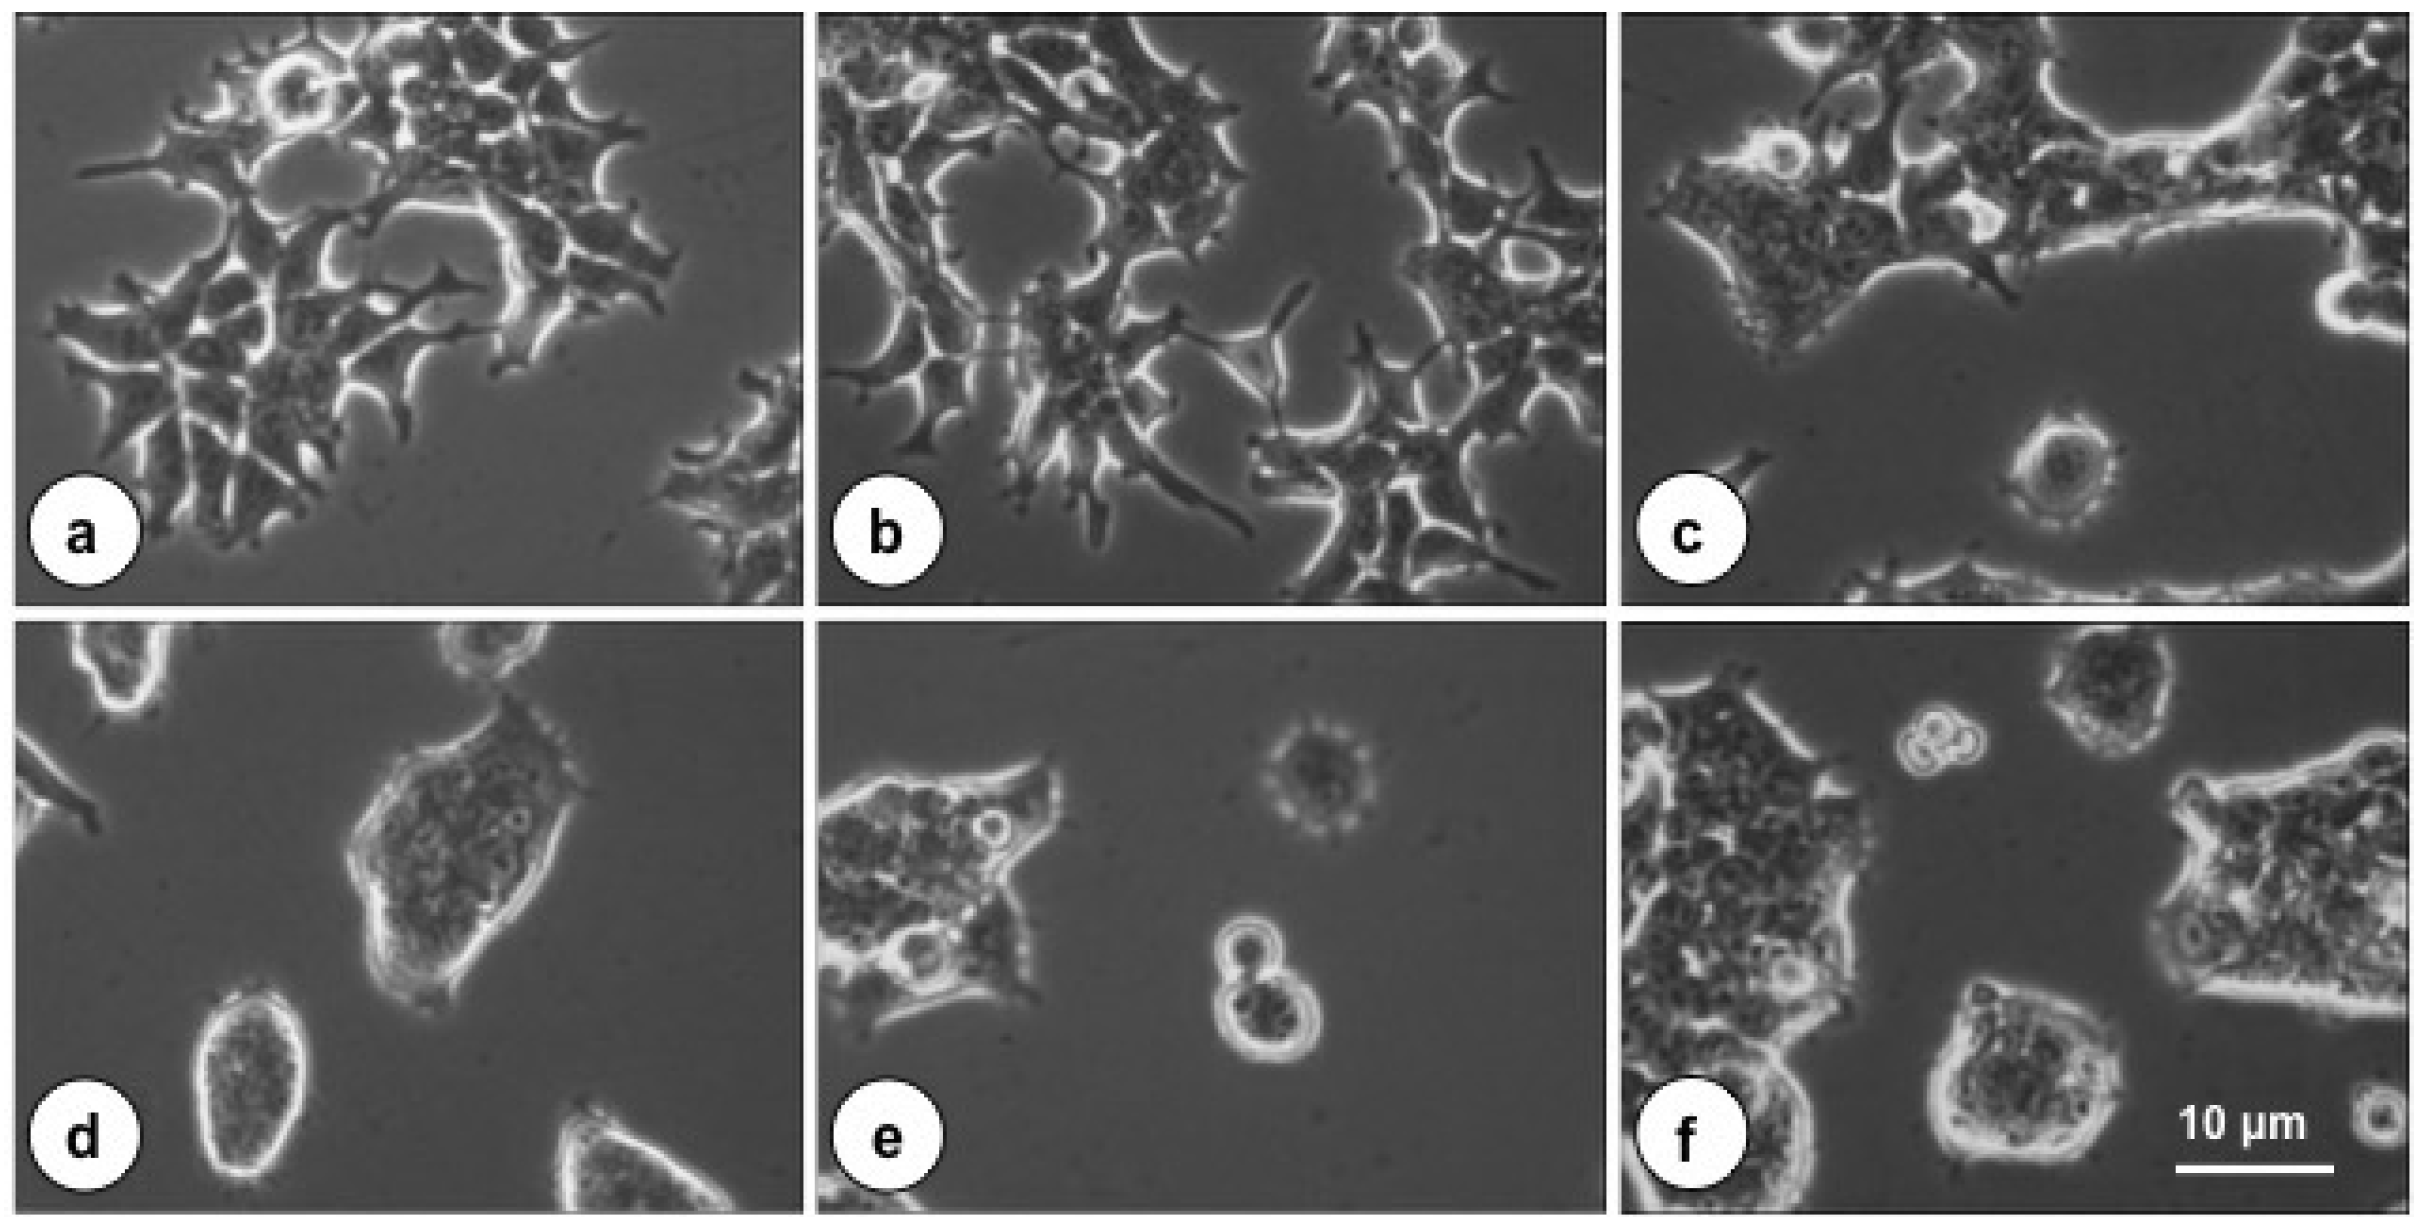
2.1. The Cytotoxic Effect of PMT on Cultured HEK-293T Cells

Recombinant, full-length PMT induced morphological effects in cultured HEK-293T cells, similar to that previously described for other cells [21]. PMT caused dosed-dependent rounding up and clumping of cells, as shown in Figure 1, and reorganization of the actin cytoskeleton (data not shown). Similar treatment with N-terminal (residues 1–506) or C-terminal (residues 486–1285) PMT fragments had no effect on cell morphology (data not shown).

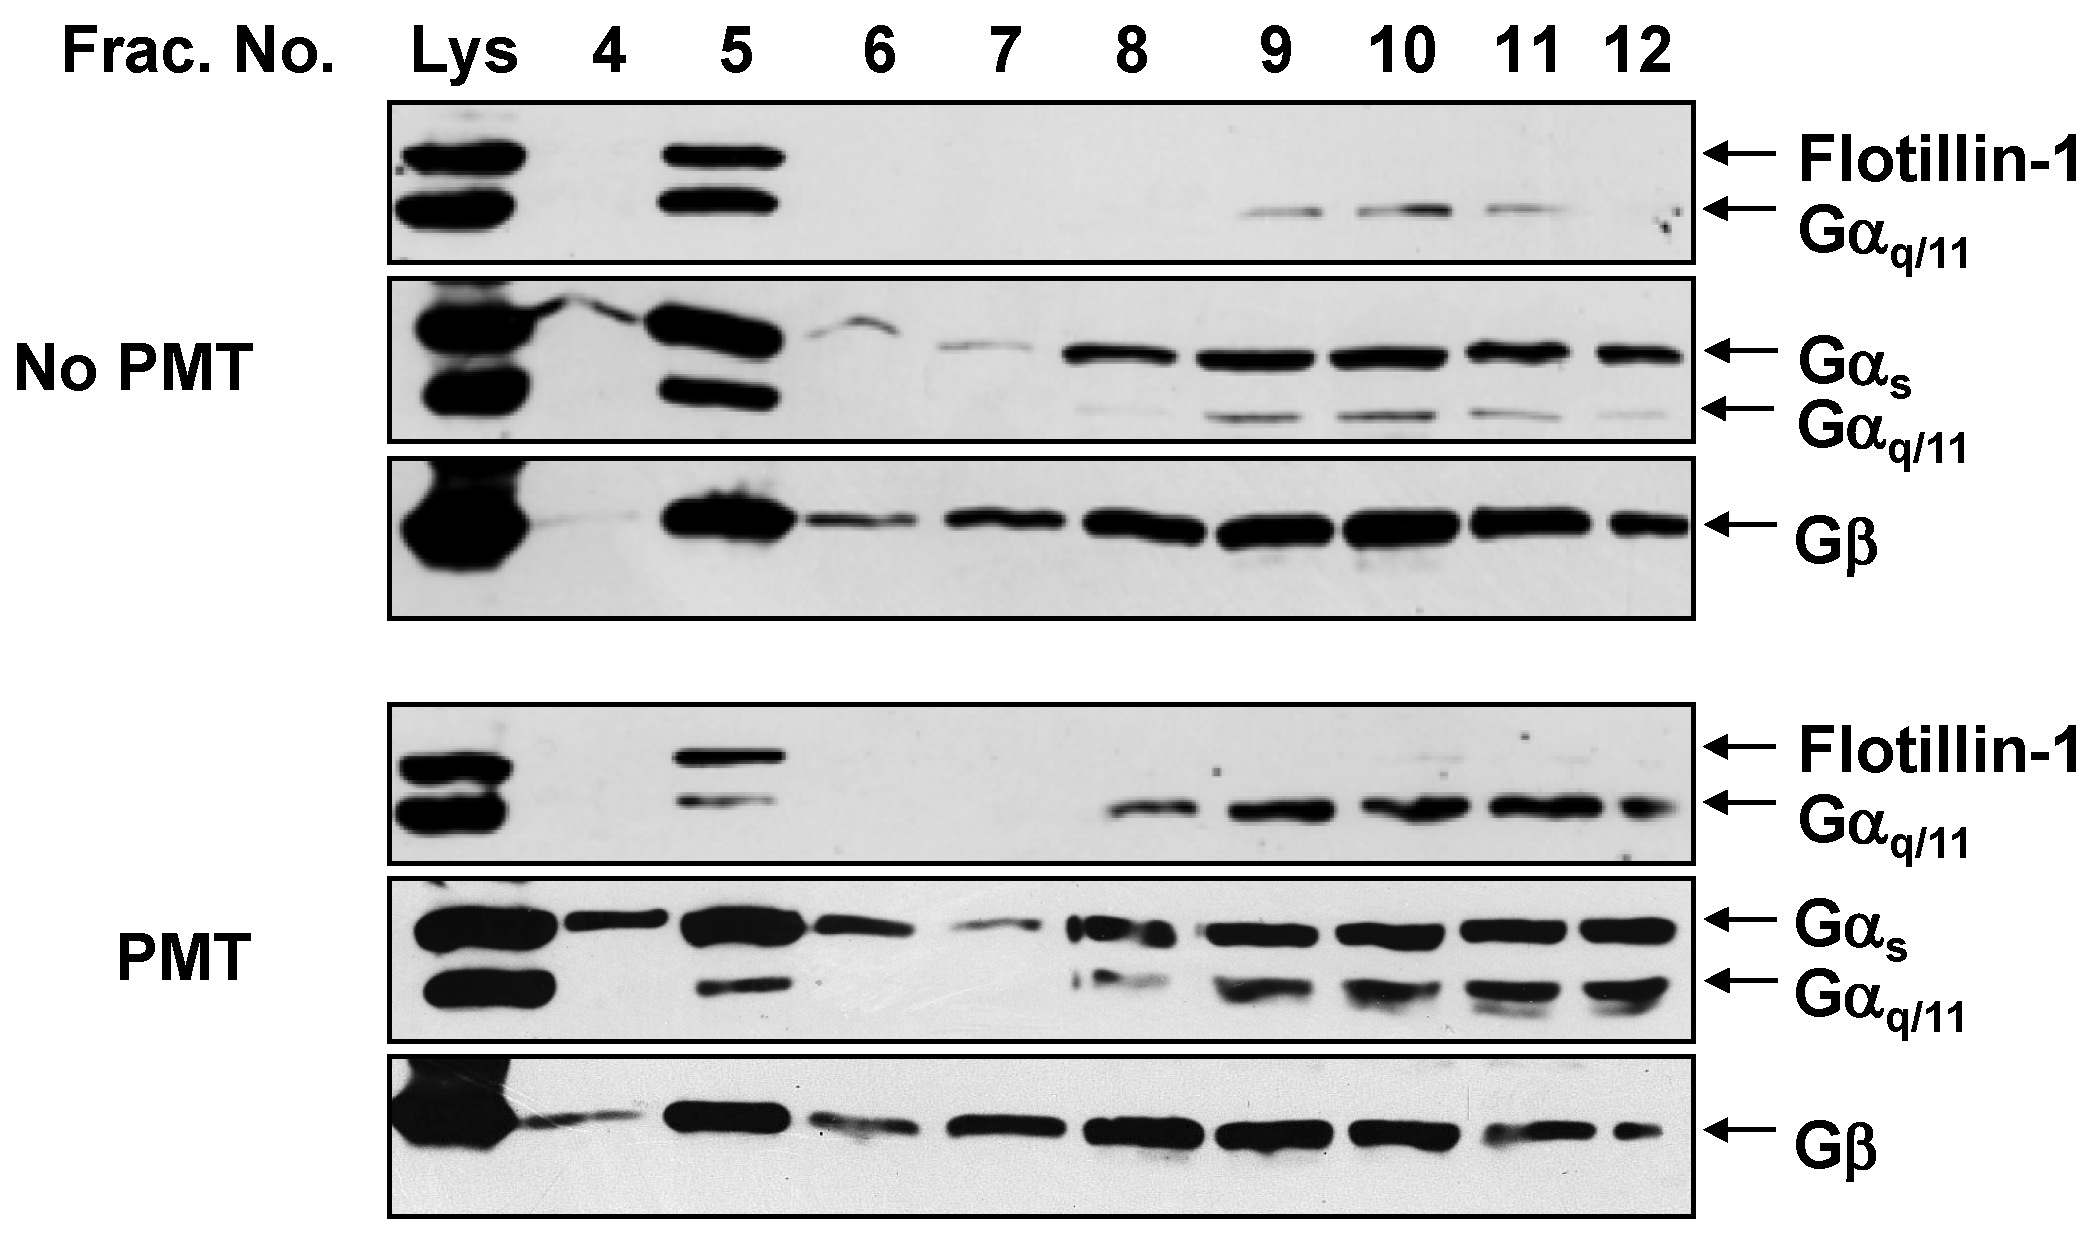
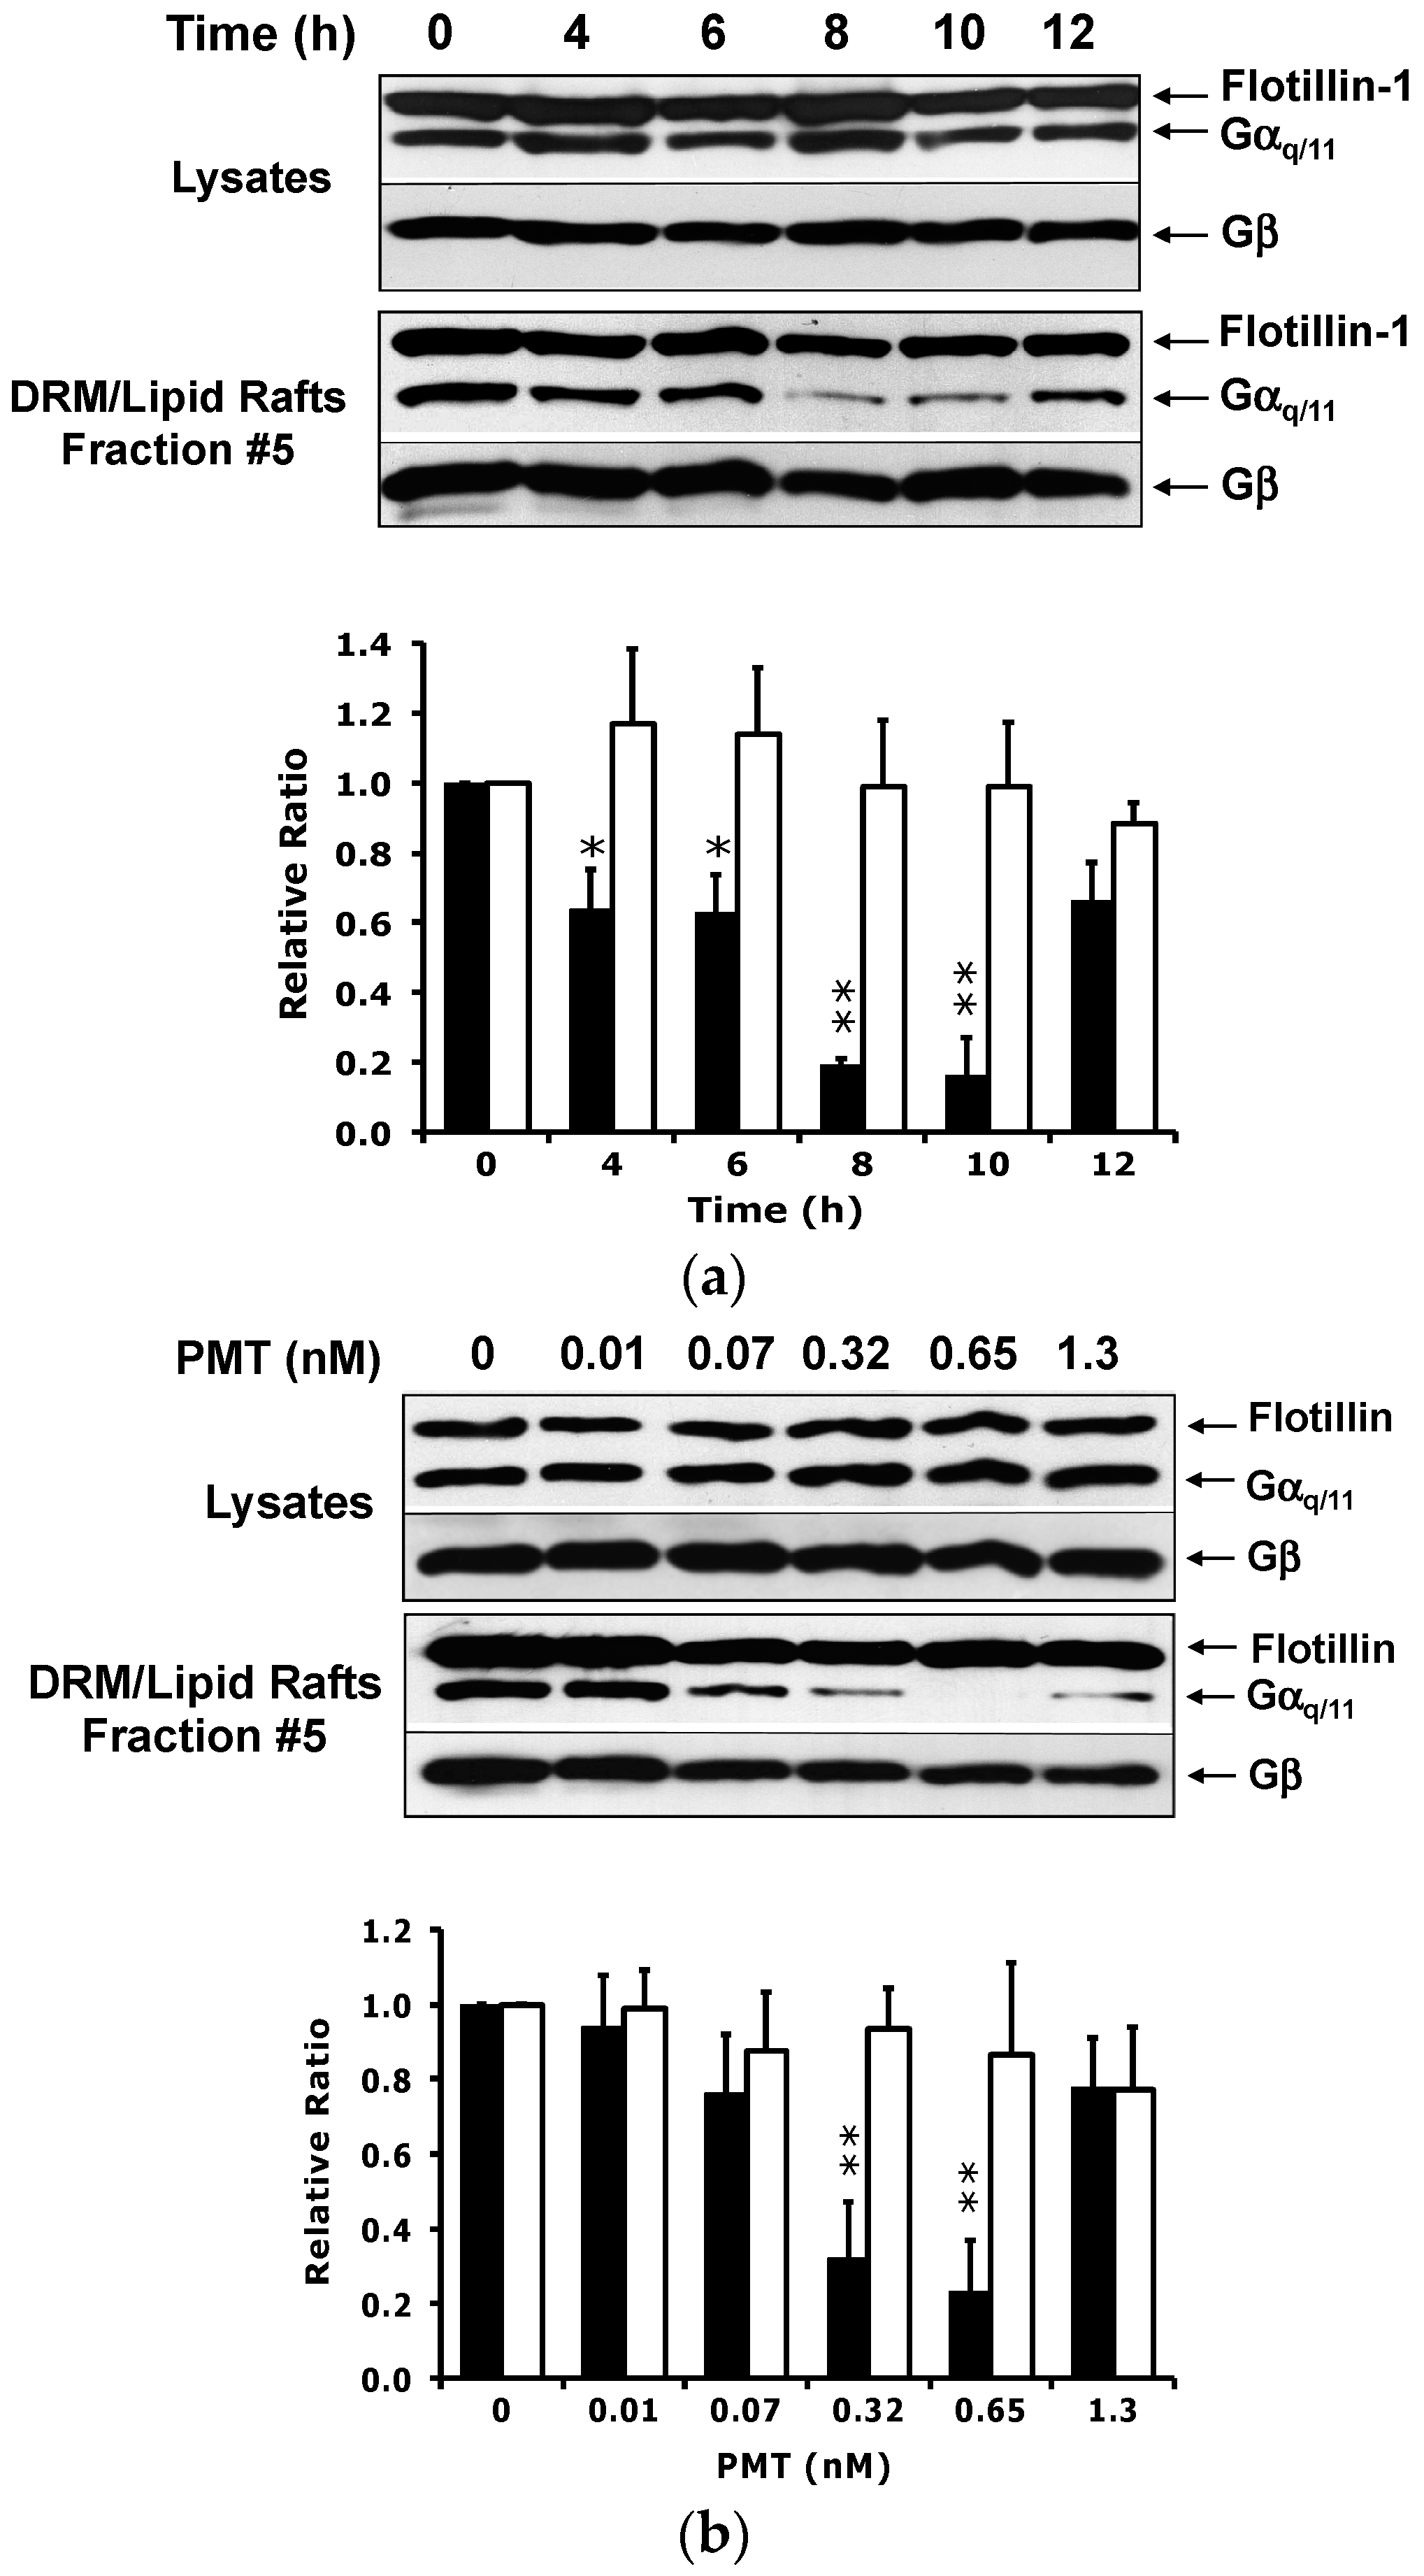
2.2. PMT Treatment Reduces Endogenous Gαq/11 Levels in Detergent Resistant Membranes (DRMs)

Because PMT acts directly on its Gα substrates and subsequent modulation of signaling is independent of agonist-receptor coupling to the G protein [9,40,41], we considered two possible mechanisms for PMT-mediated down-regulation of Gαq/11-PLCβ1 signaling: (1) PMT deamidation and activation of Gαq and/or Gα11 leads to degradation of the resulting constitutively active Gα subunit and loss of cellular levels of Gαq and/or Gα11; or (2) PMT deamidation and activation of Gαq and/or Gα11 leads to redistribution of the resulting constitutively active Gα subunit from DRMs to soluble membrane and/or cytosolic fractions. In agreement with a previous report [42], immunoblot analysis of total cell lysates using antibodies against the C-terminus of Gαq/11 showed that overnight treatment of the cells with PMT did not alter endogenous protein levels of Gαq/11 in total cell lysates (Figure 2). This result did not support the first proposed mechanism for PMT-mediated downregulation of Gαq/11 signaling, and so we next considered the second possibility that the downregulation of signaling might result from loss of the PMT-activated Gαq/11 from the membrane. Thus, we examined whether PMT treatment could cause loss of Gαq/11 protein from detergent-resistant membranes (DRMs, also called lipid rafts) since many membrane signaling molecules are enriched in these membrane micro-domains.
PMT-treated HEK-293T cells were lysed in the presence of detergent and the cellular contents were subjected to subcellular fractionation by separation using Optiprep density gradient centrifugation, followed by immunoblotting analysis of the gradient fractions. In the density gradient centrifugation profile, fractions #1–7 contain low-density lipid-rich membranes and vesicles, while fractions #8–12 contain high-density protein-rich soluble membrane and cytosolic fractions [43]. As shown in Figure 2, whereas the abundant Gβ and Gαs subunits were found throughout the gradient in both higher density (#8–12) and lower density fractions (#4–7) from untreated control cells, the majority of the less abundant Gαq/11 subunits were localized mostly to the low-density, DRM-containing fraction (#5), as evidenced by its co-localization with flotillin-1, a known specific marker for DRMs [44]. In contrast, PMT treatment resulted in the depletion of Gαq/11, but not Gβ or Gαs, from the DRM-containing fraction #5. With this loss was a concomitant increase of Gαq/11 in the soluble membrane and cytosolic fractions (#8–12), suggesting that PMT modification and activation of Gαq/11 results in the release of active form of the Gαq/11 protein from DRMs. That PMT treatment did not significantly alter the levels of Gαs or Gβ in DRMs, as compared with flotillin-1, confirms previous findings, indicating that Gαs protein is not a target substrate of PMT.
A time course revealed that while overall endogenous Gαq/11 protein levels in cells were not discernably affected by exposure to PMT over 12 h, the Gαq/11 levels in DRMs were reduced by over 80% by 8–10 h in cells treated with 0.3 nM PMT (Figure 3a). This result supports the notion that PMT action on Gαq/11 causes a redistribution of the protein, and not degradation within this timeframe. By 12 h, however, the Gαq/11 levels in DRMs were restored to nearly 80% that of untreated cells. Again, Gβ and flotillin levels remained unaffected by PMT treatment. The decrease in Gαq/11 levels in DRMs was also dose-dependent, exhibiting an EC50 value of ~70 pM (Figure 3b). Although the loss of Gαq/11 from DRMs was about 65% and 75% after 10 h of PMT treatment at a concentration of 320 pM and 650 pM, respectively, the Gαq/11 levels were again restored at higher PMT concentrations of 1.3 nM. Similar results were obtained using Swiss 3T3 cells (data not shown). Taken together, PMT selectively induces the loss of Gαq/11 proteins from DRMs in a time and dose dependent manner, although this loss can be masked or overcome at later times or higher toxin concentrations by PMT-stimulation of new protein synthesis.

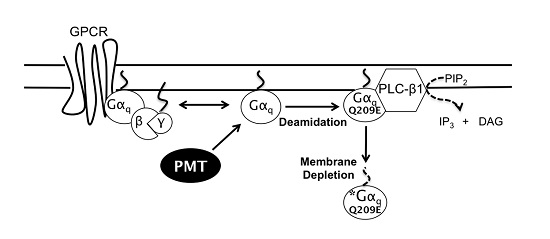
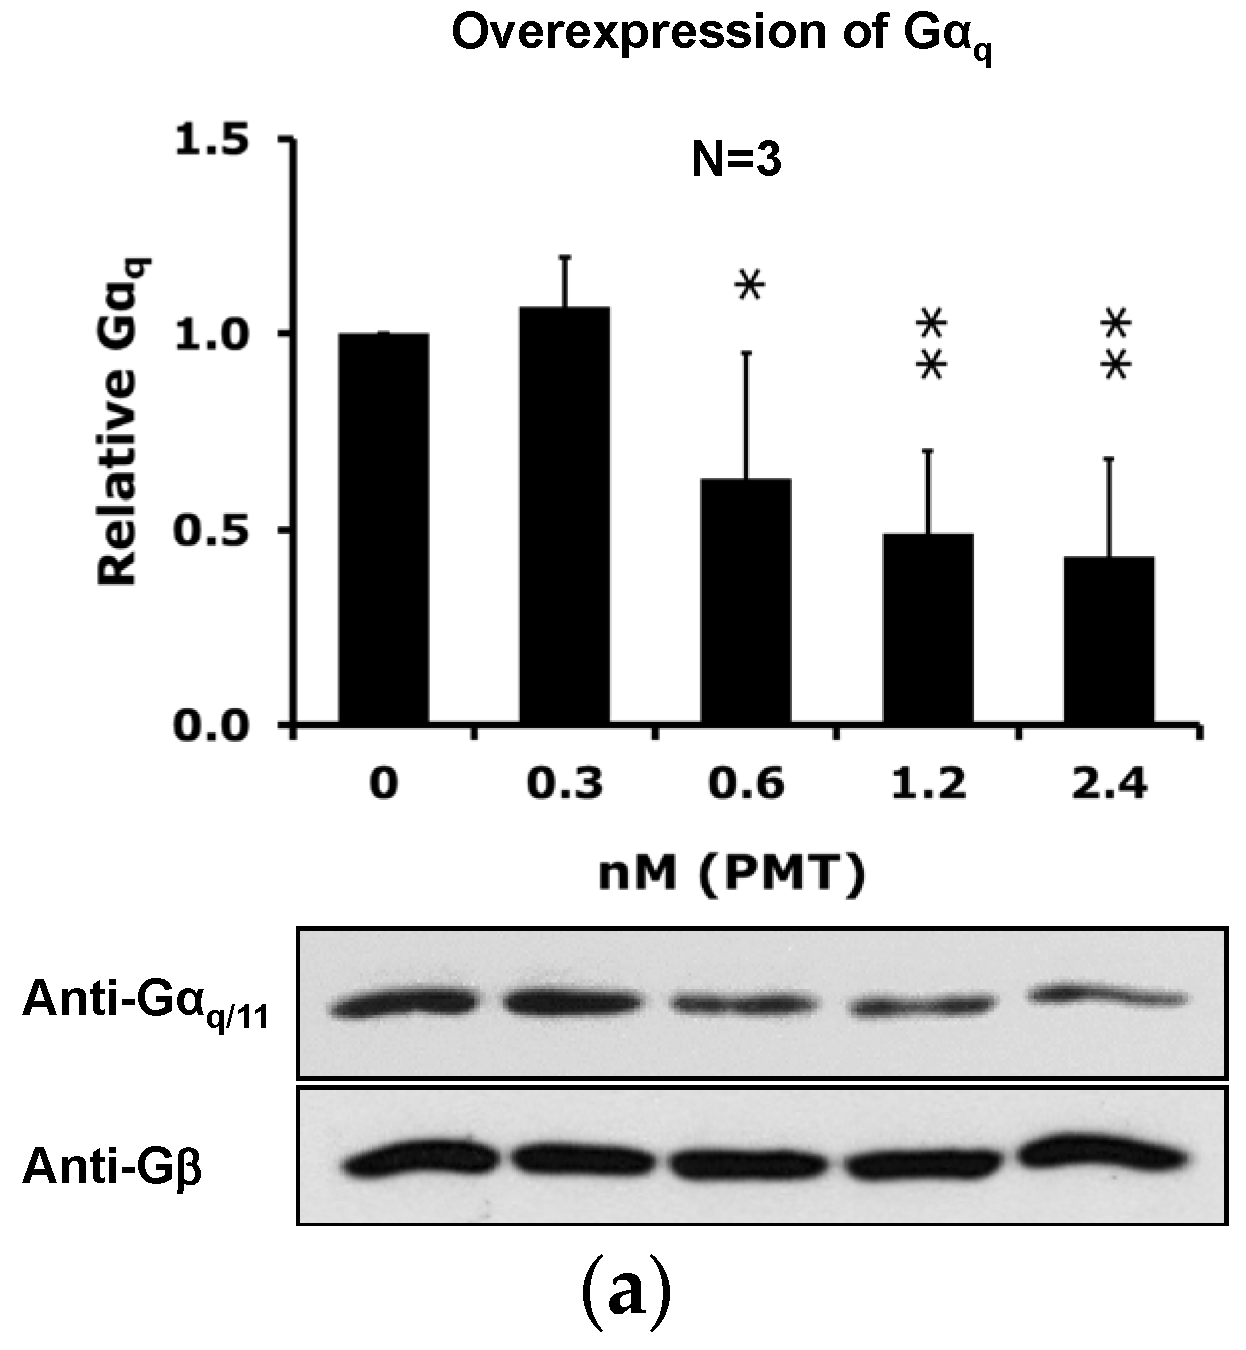
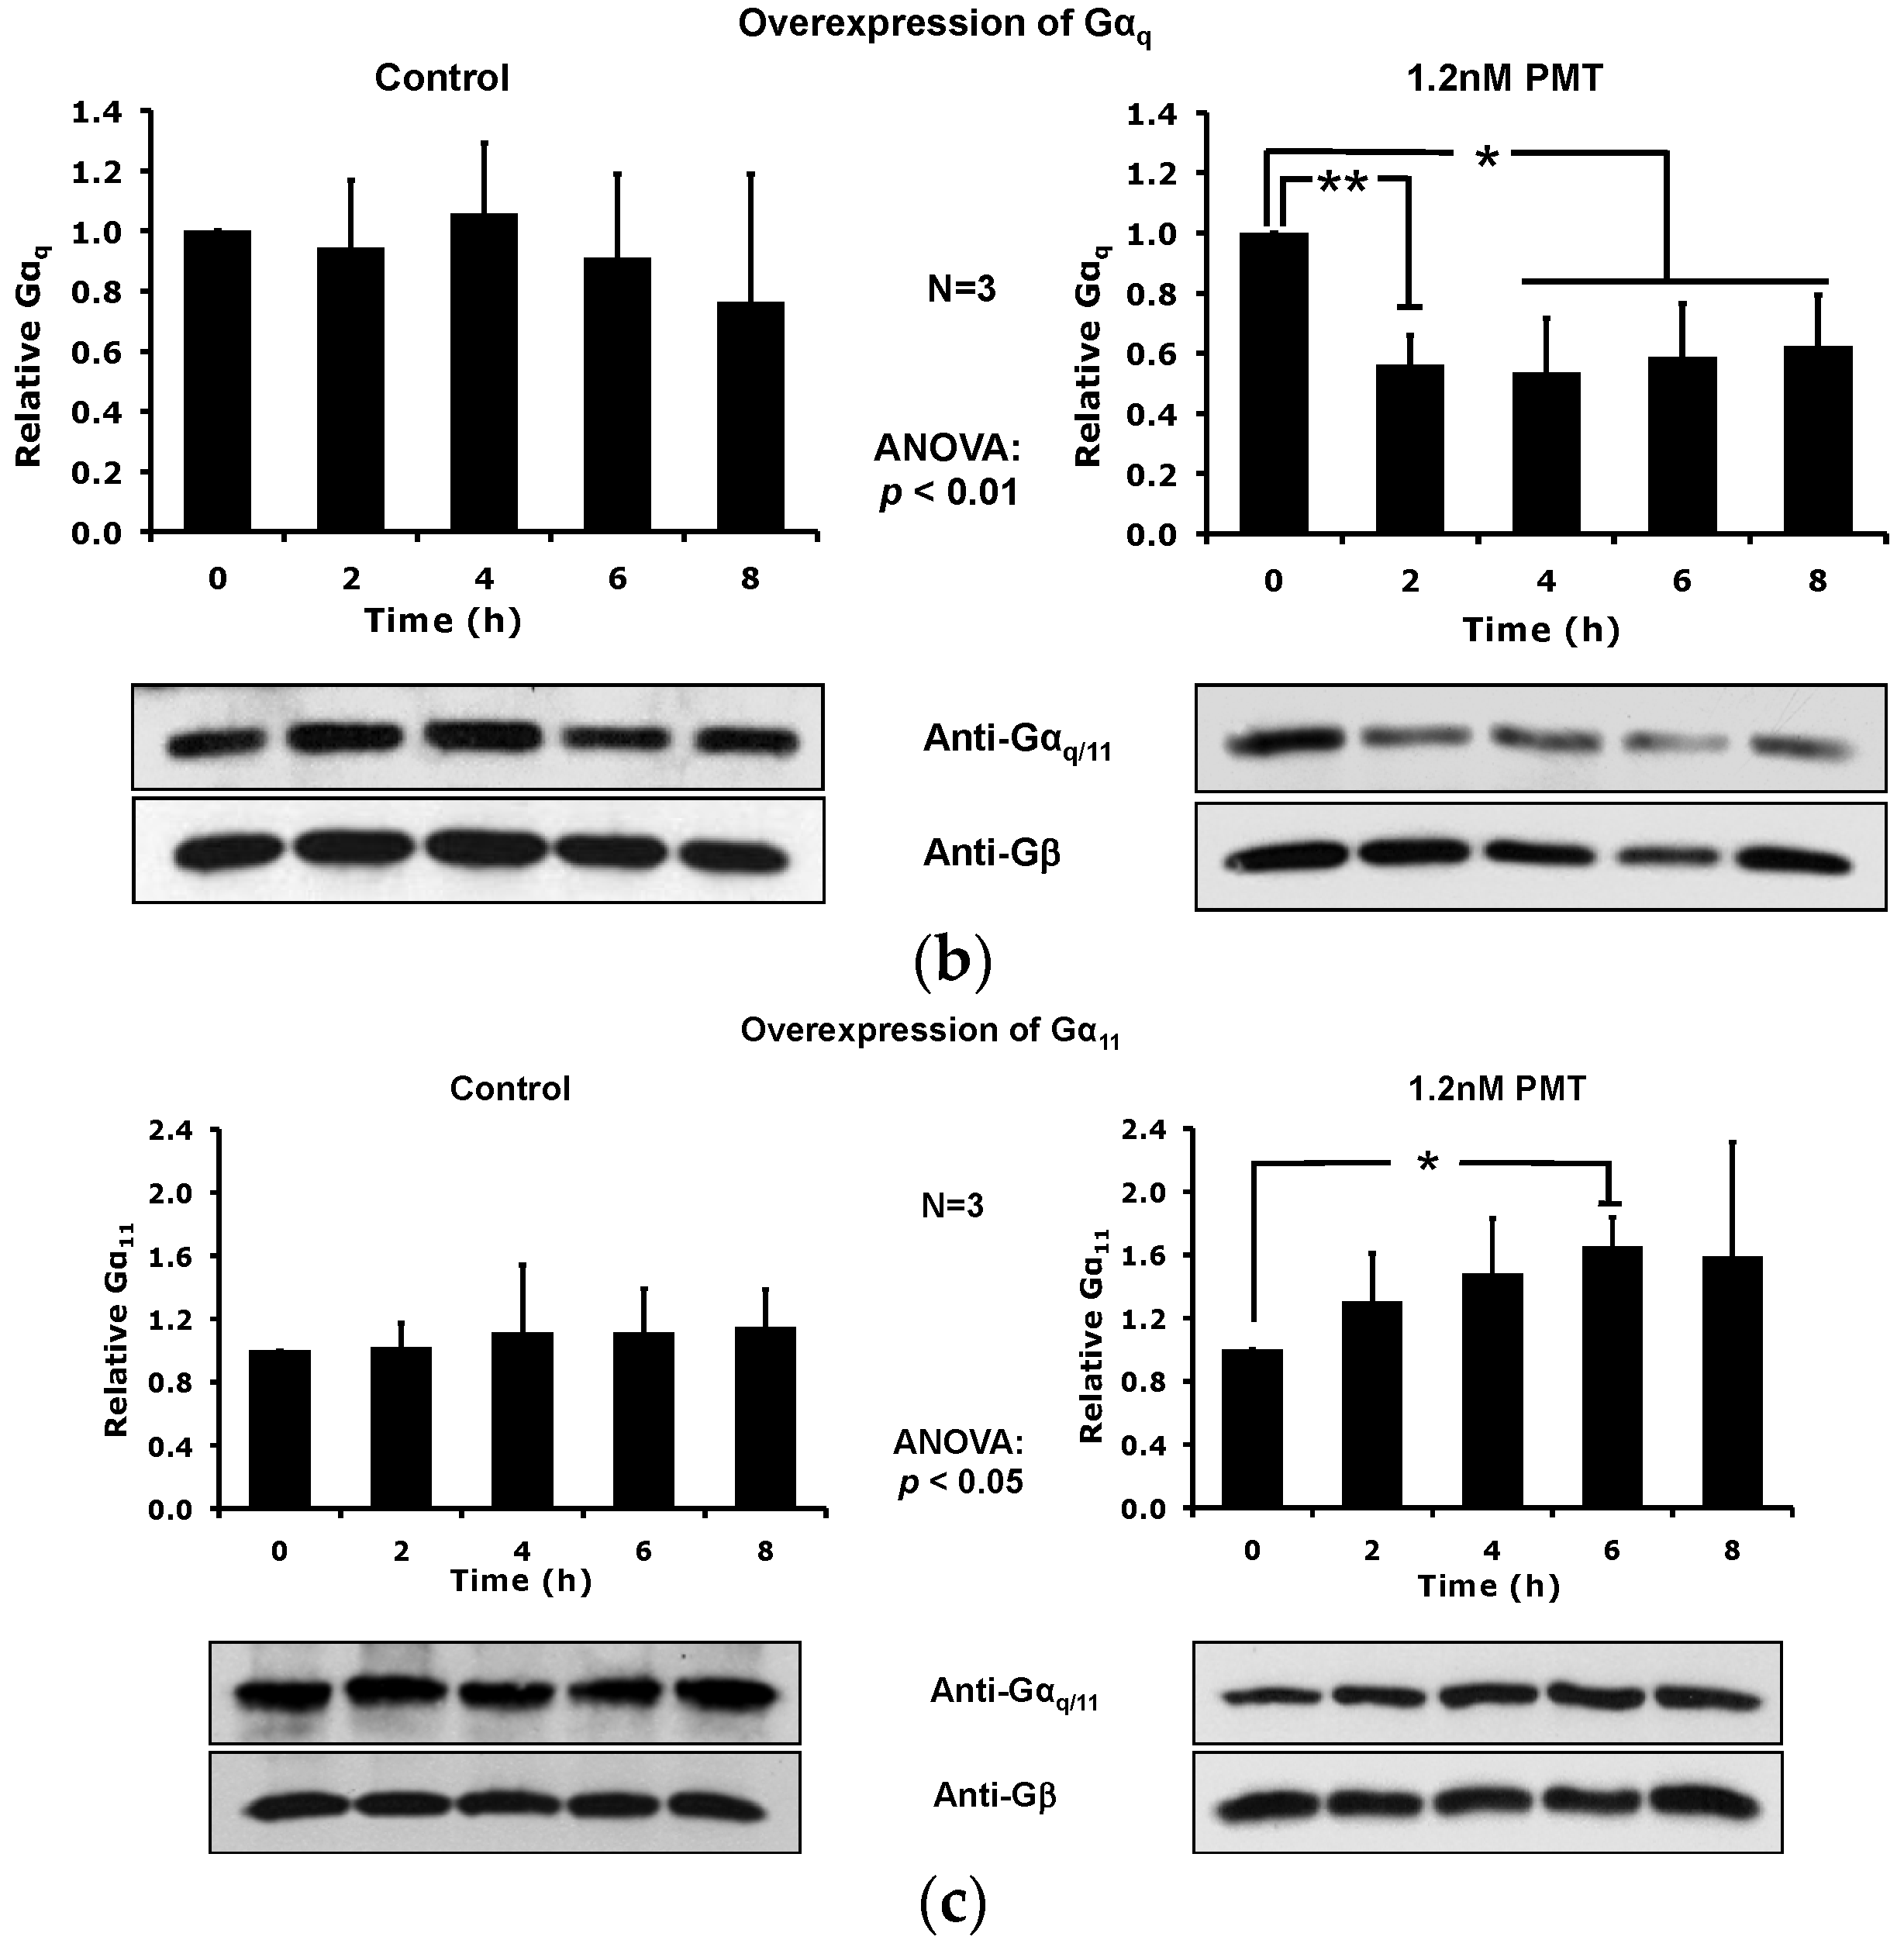
2.3. PMT Treatment Depletes Gαq, but Not Gα11, Protein Levels in DRMs and the Plasma Membrane

To distinguish the specificity of the PMT-mediated DRM depletion for Gαq and Gα11, we expressed exogenously either Gαq or Gα11 in HEK-293T cells over the endogenous background and detected the proteins using the anti-Gαq/11 antibodies under conditions where the corresponding endogenous proteins were negligible (Figure 4a). The transfected cells overexpressing Gαq or Gα11 were then used to determine the effect of PMT treatment on the DRM levels of overexpressed Gαq or Gα11 proteins vs. Gβ. Results of immunoblot analysis of the DRM-containing fractions from a time course of treatment with 1.2 nM PMT revealed that PMT treatment caused a transient DRM depletion of Gαq (Figure 4b) but not Gα11 (Figure 4c) after 2 h treatment.
Considering that PMT selectively depletes Gαq and not Gα11, we considered the possibility that one reason we did not observe discernable depletion of endogenous Gαq protein levels from total cell lysates (Figure 2 and Figure 3) might be due to masking by the remaining Gα11 present in the membranes, as well as by the replacement with newly synthesized protein. We thus investigated the effect of PMT on Gαq and Gα11 levels in total membrane preparations from cells selectively overexpressing each of the proteins. As shown in Figure 5, PMT treatment caused a dose- and time-dependent reduction of Gαq, but not Gα11, protein levels in total membrane preparations from cells overexpressing the respective Gα protein. In contrast, PMT treatment of cells overexpressing Gα11 resulted in a slight increase in overall Gα11 protein levels in membranes. However, unlike the case for DRMs, the loss of Gαq from membranes did not recover over the 8 h treatment period.
To further discern specificity for PMT-modified Gαq and not Gα11 as preferred target for membrane depletion, we transiently overexpressed FLAG-tagged Gαq or FLAG-tagged Gα11 separately in HEK-293T cells and investigated the effect of PMT on the corresponding protein levels in DRMs. Results shown in Figure 6 are similar to those obtained in Figure 4. PMT caused a dose- and time-dependent depletion of FLAG-Gαq but not FLAG-Gα11 from DRMs. Again the effect was transient with FLAG-Gαq levels recovering by 6–8 h (Figure 6c). Also consistent with data in Figure 4, cells overexpressing FLAG-Gα11 showed no PMT-mediated loss of the protein in DRMs, and instead the protein levels increased slightly (Figure 6c).

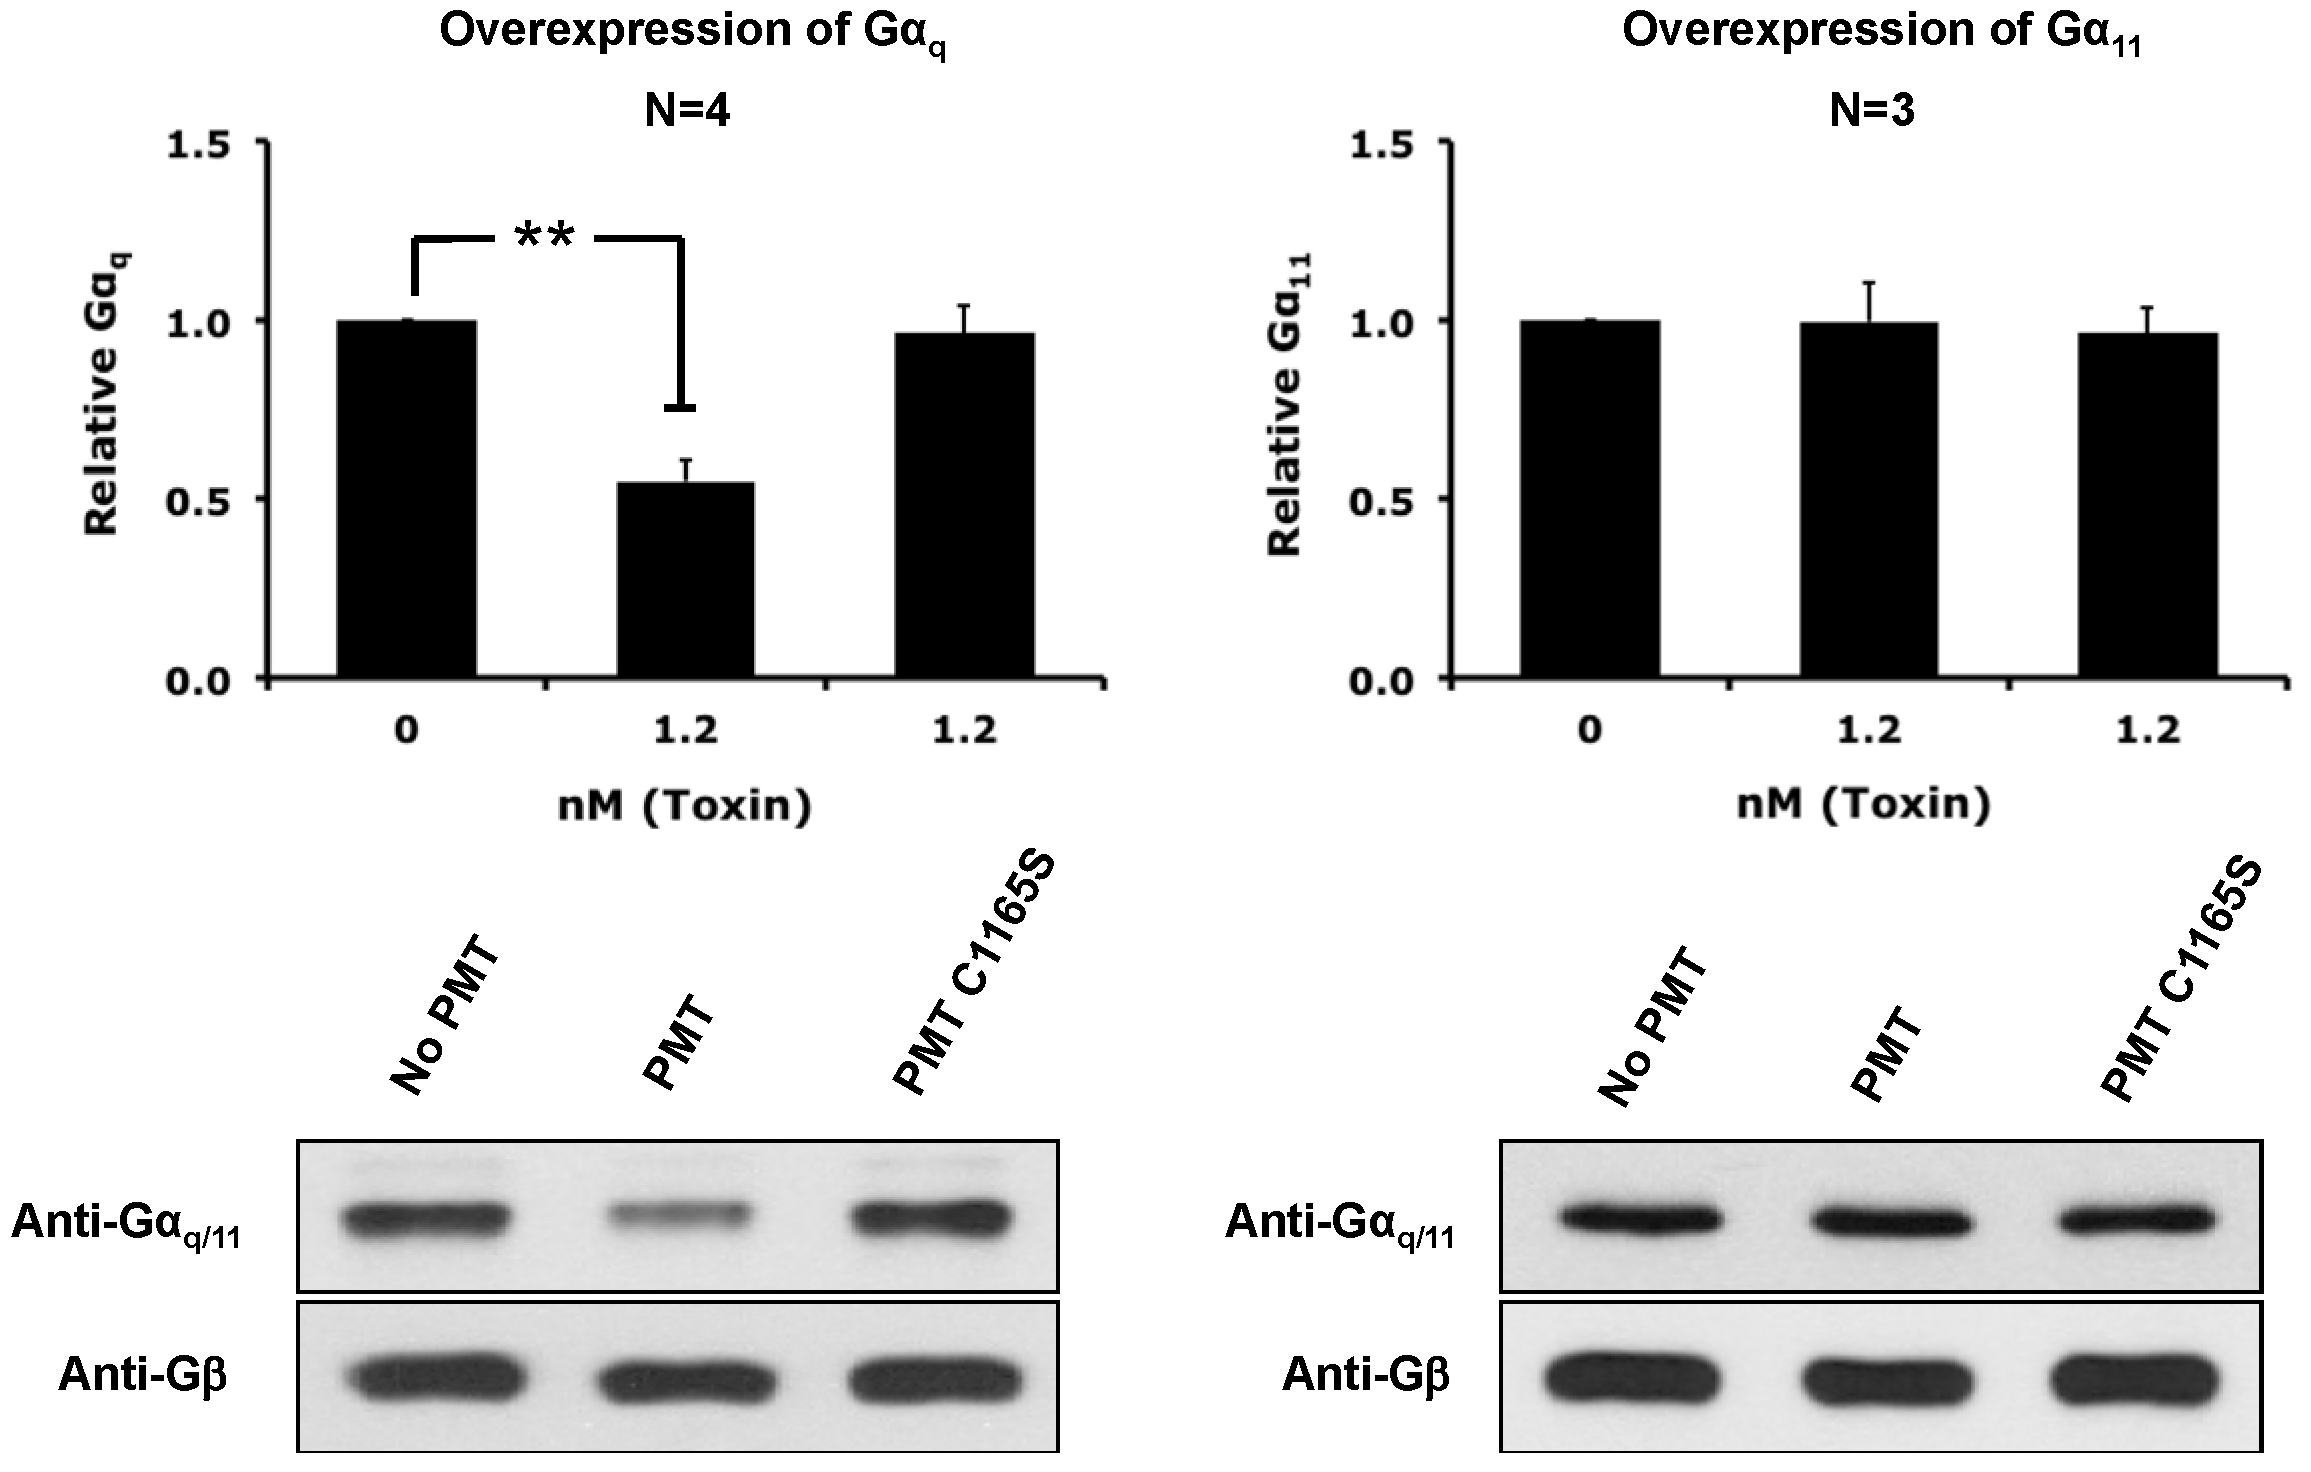
2.4. The Catalytic Activity of PMT Is Required for Membrane Depletion of Gαq

Since PMT specifically induces the depletion of only Gαq from the membrane even though Gα11 is also apparently a substrate for deamidation, we wanted to test if the deamidase activity of PMT is required for the depletion of Gαq from the membrane. The catalytic domain of PMT possesses a cysteine-histidine-aspartic acid catalytic triad in the active site, where mutation of the cysteine residue into serine (PMT C1165S) reduces the enzymatic deamidase activity by 1000-fold [45]. As shown in Figure 7, treatment of cells with PMT C1165S does not result in membrane depletion of Gαq, and neither PMT nor PMT C1165S caused the depletion of Gα11, confirming that the enzymatic activity of PMT is necessary for the depletion of Gαq from the host cell membrane.

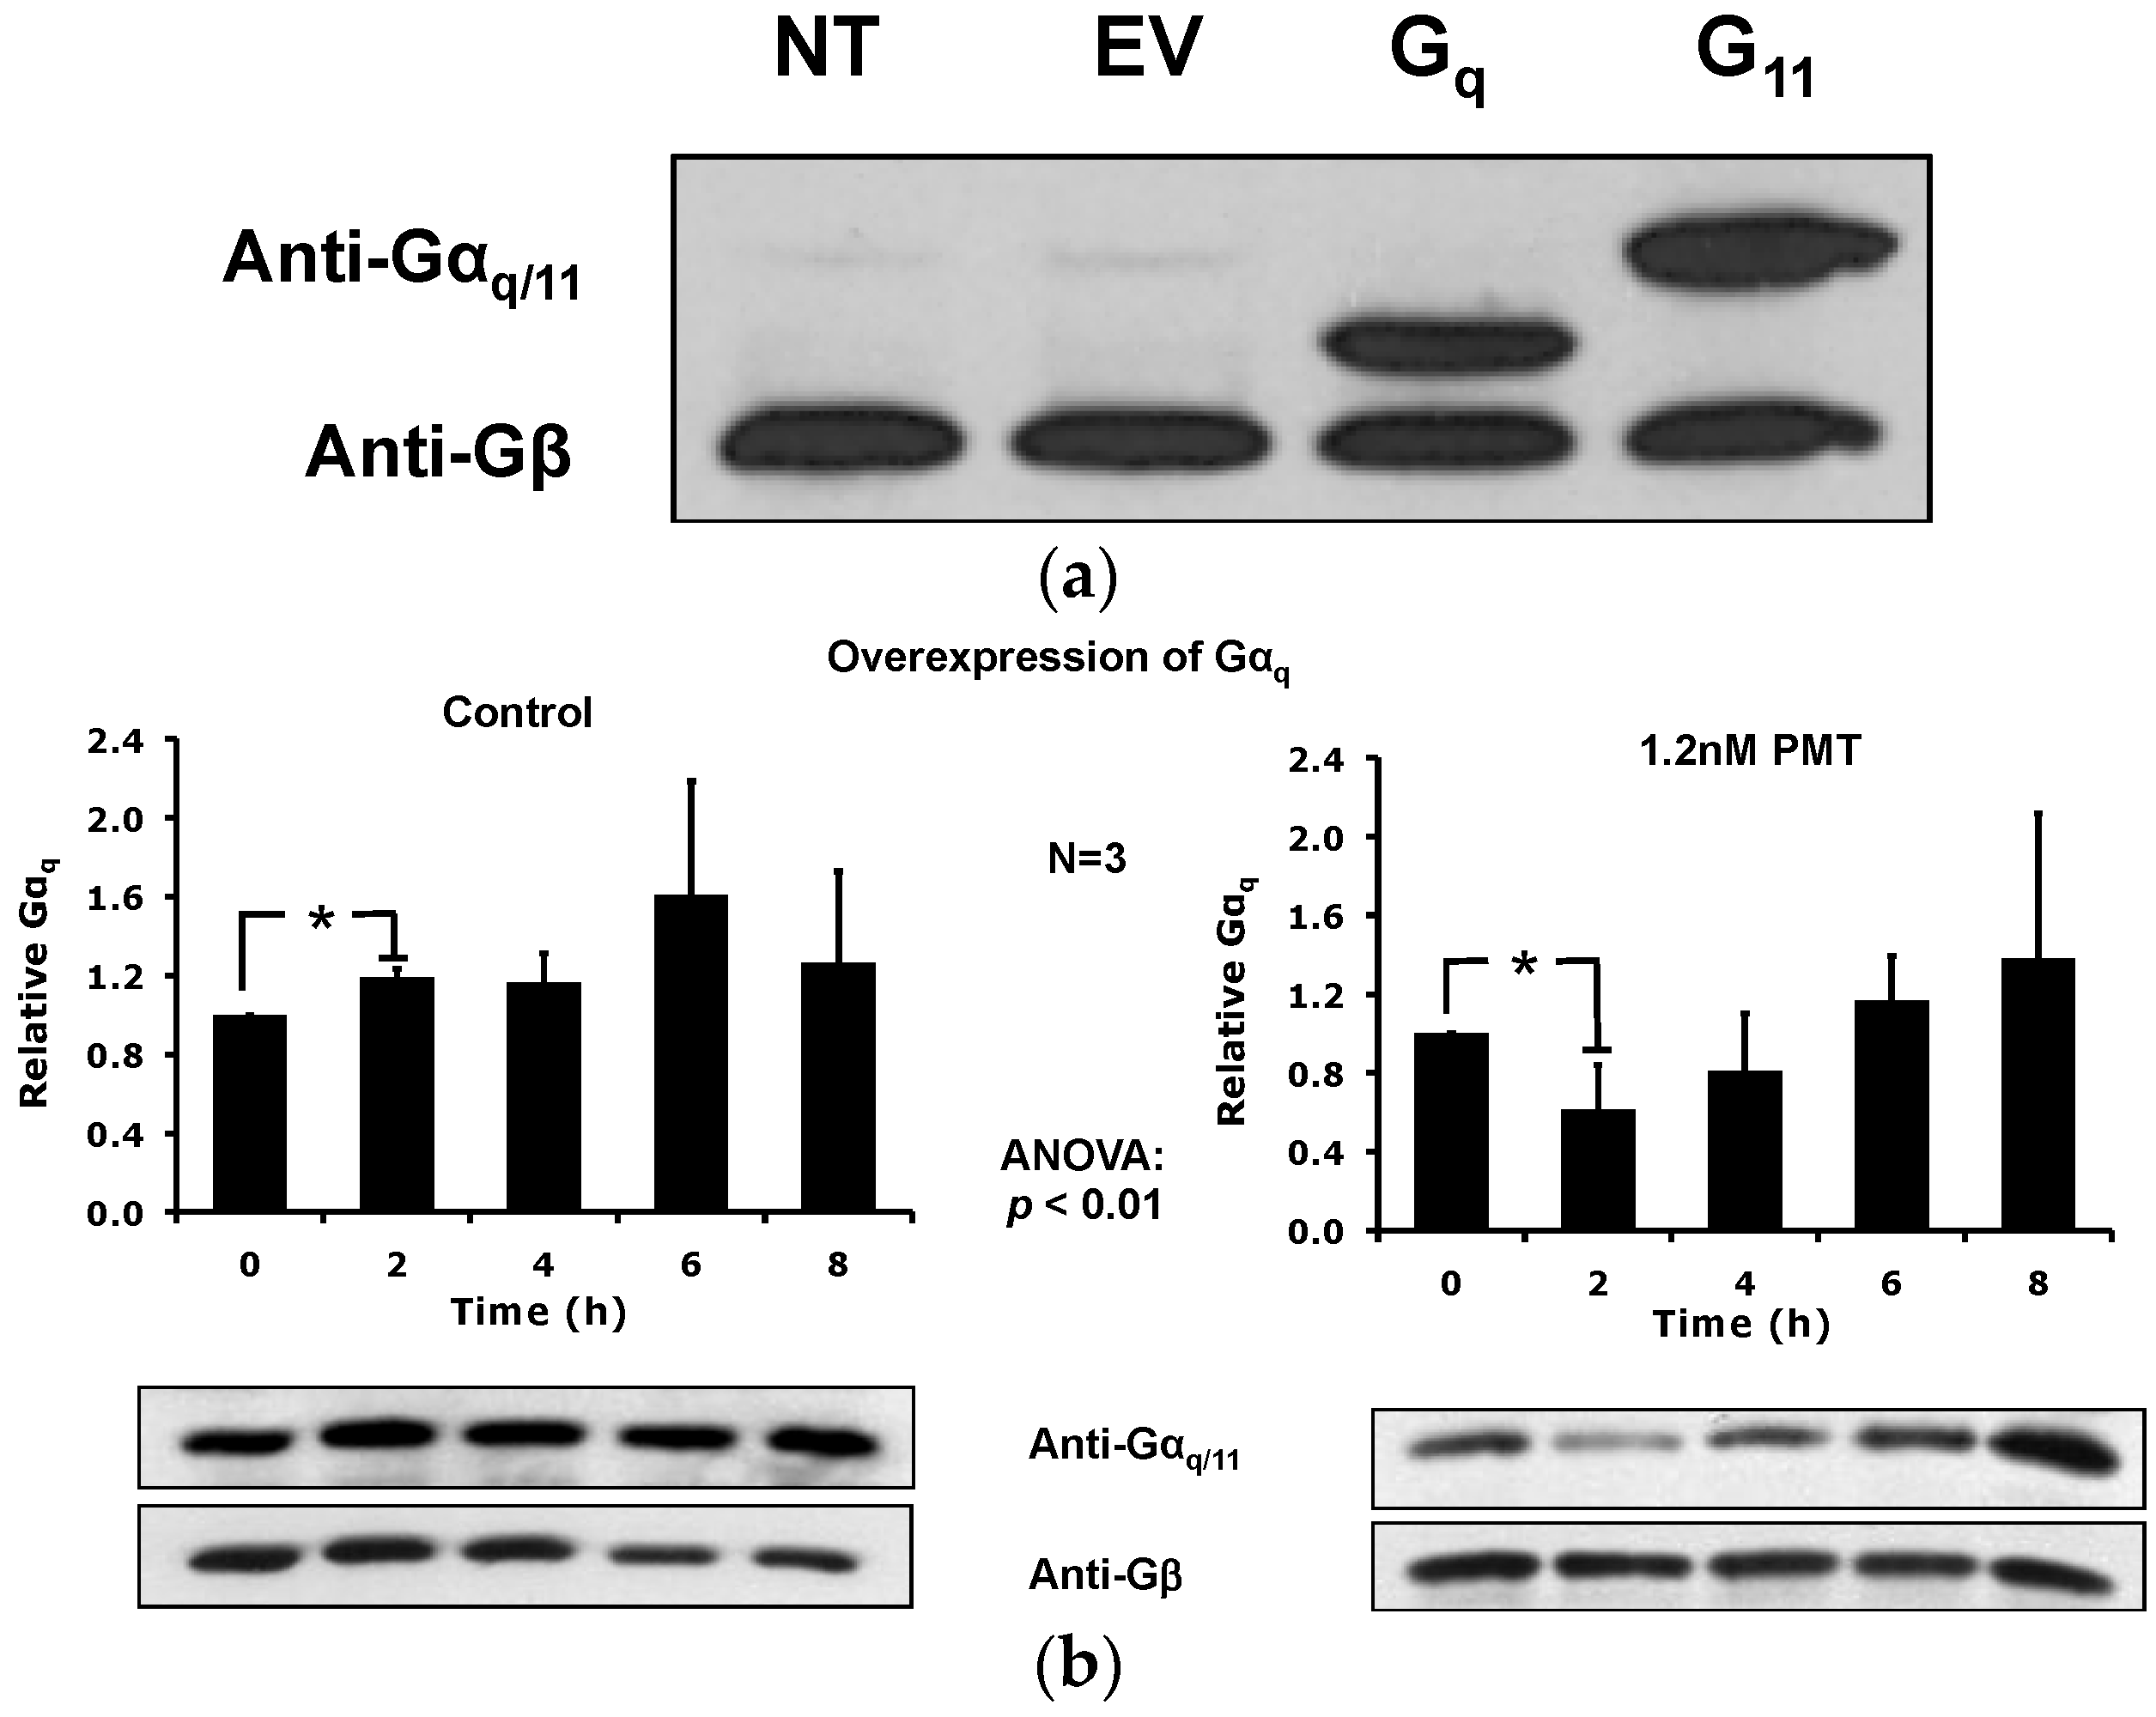
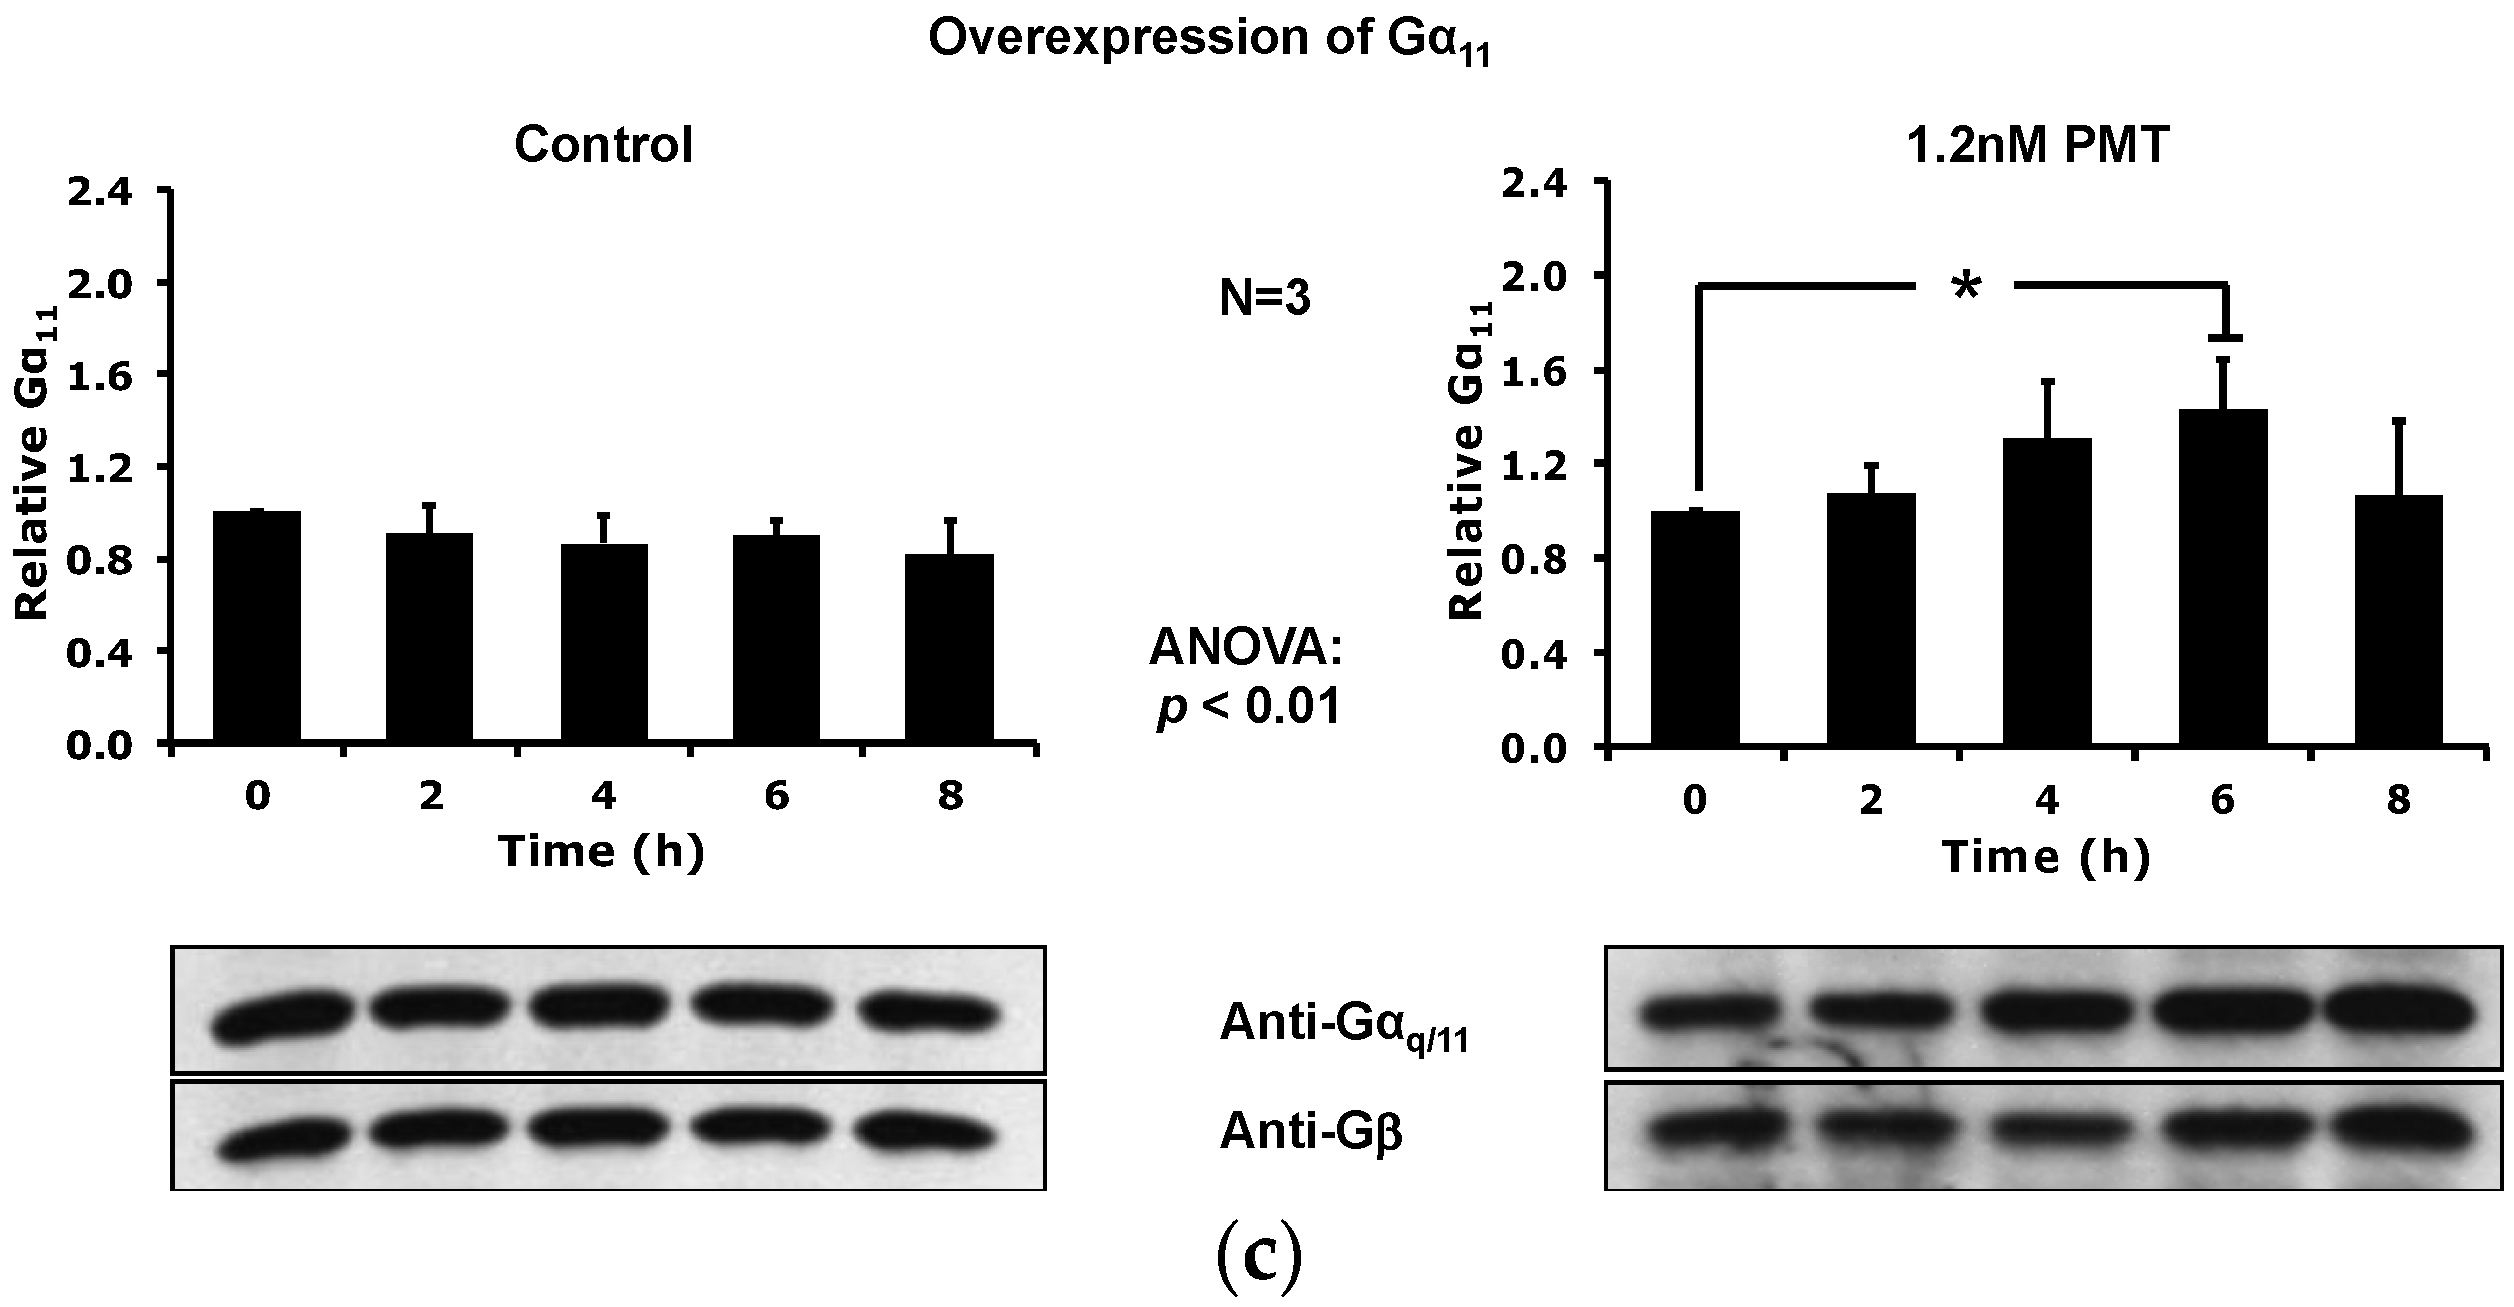
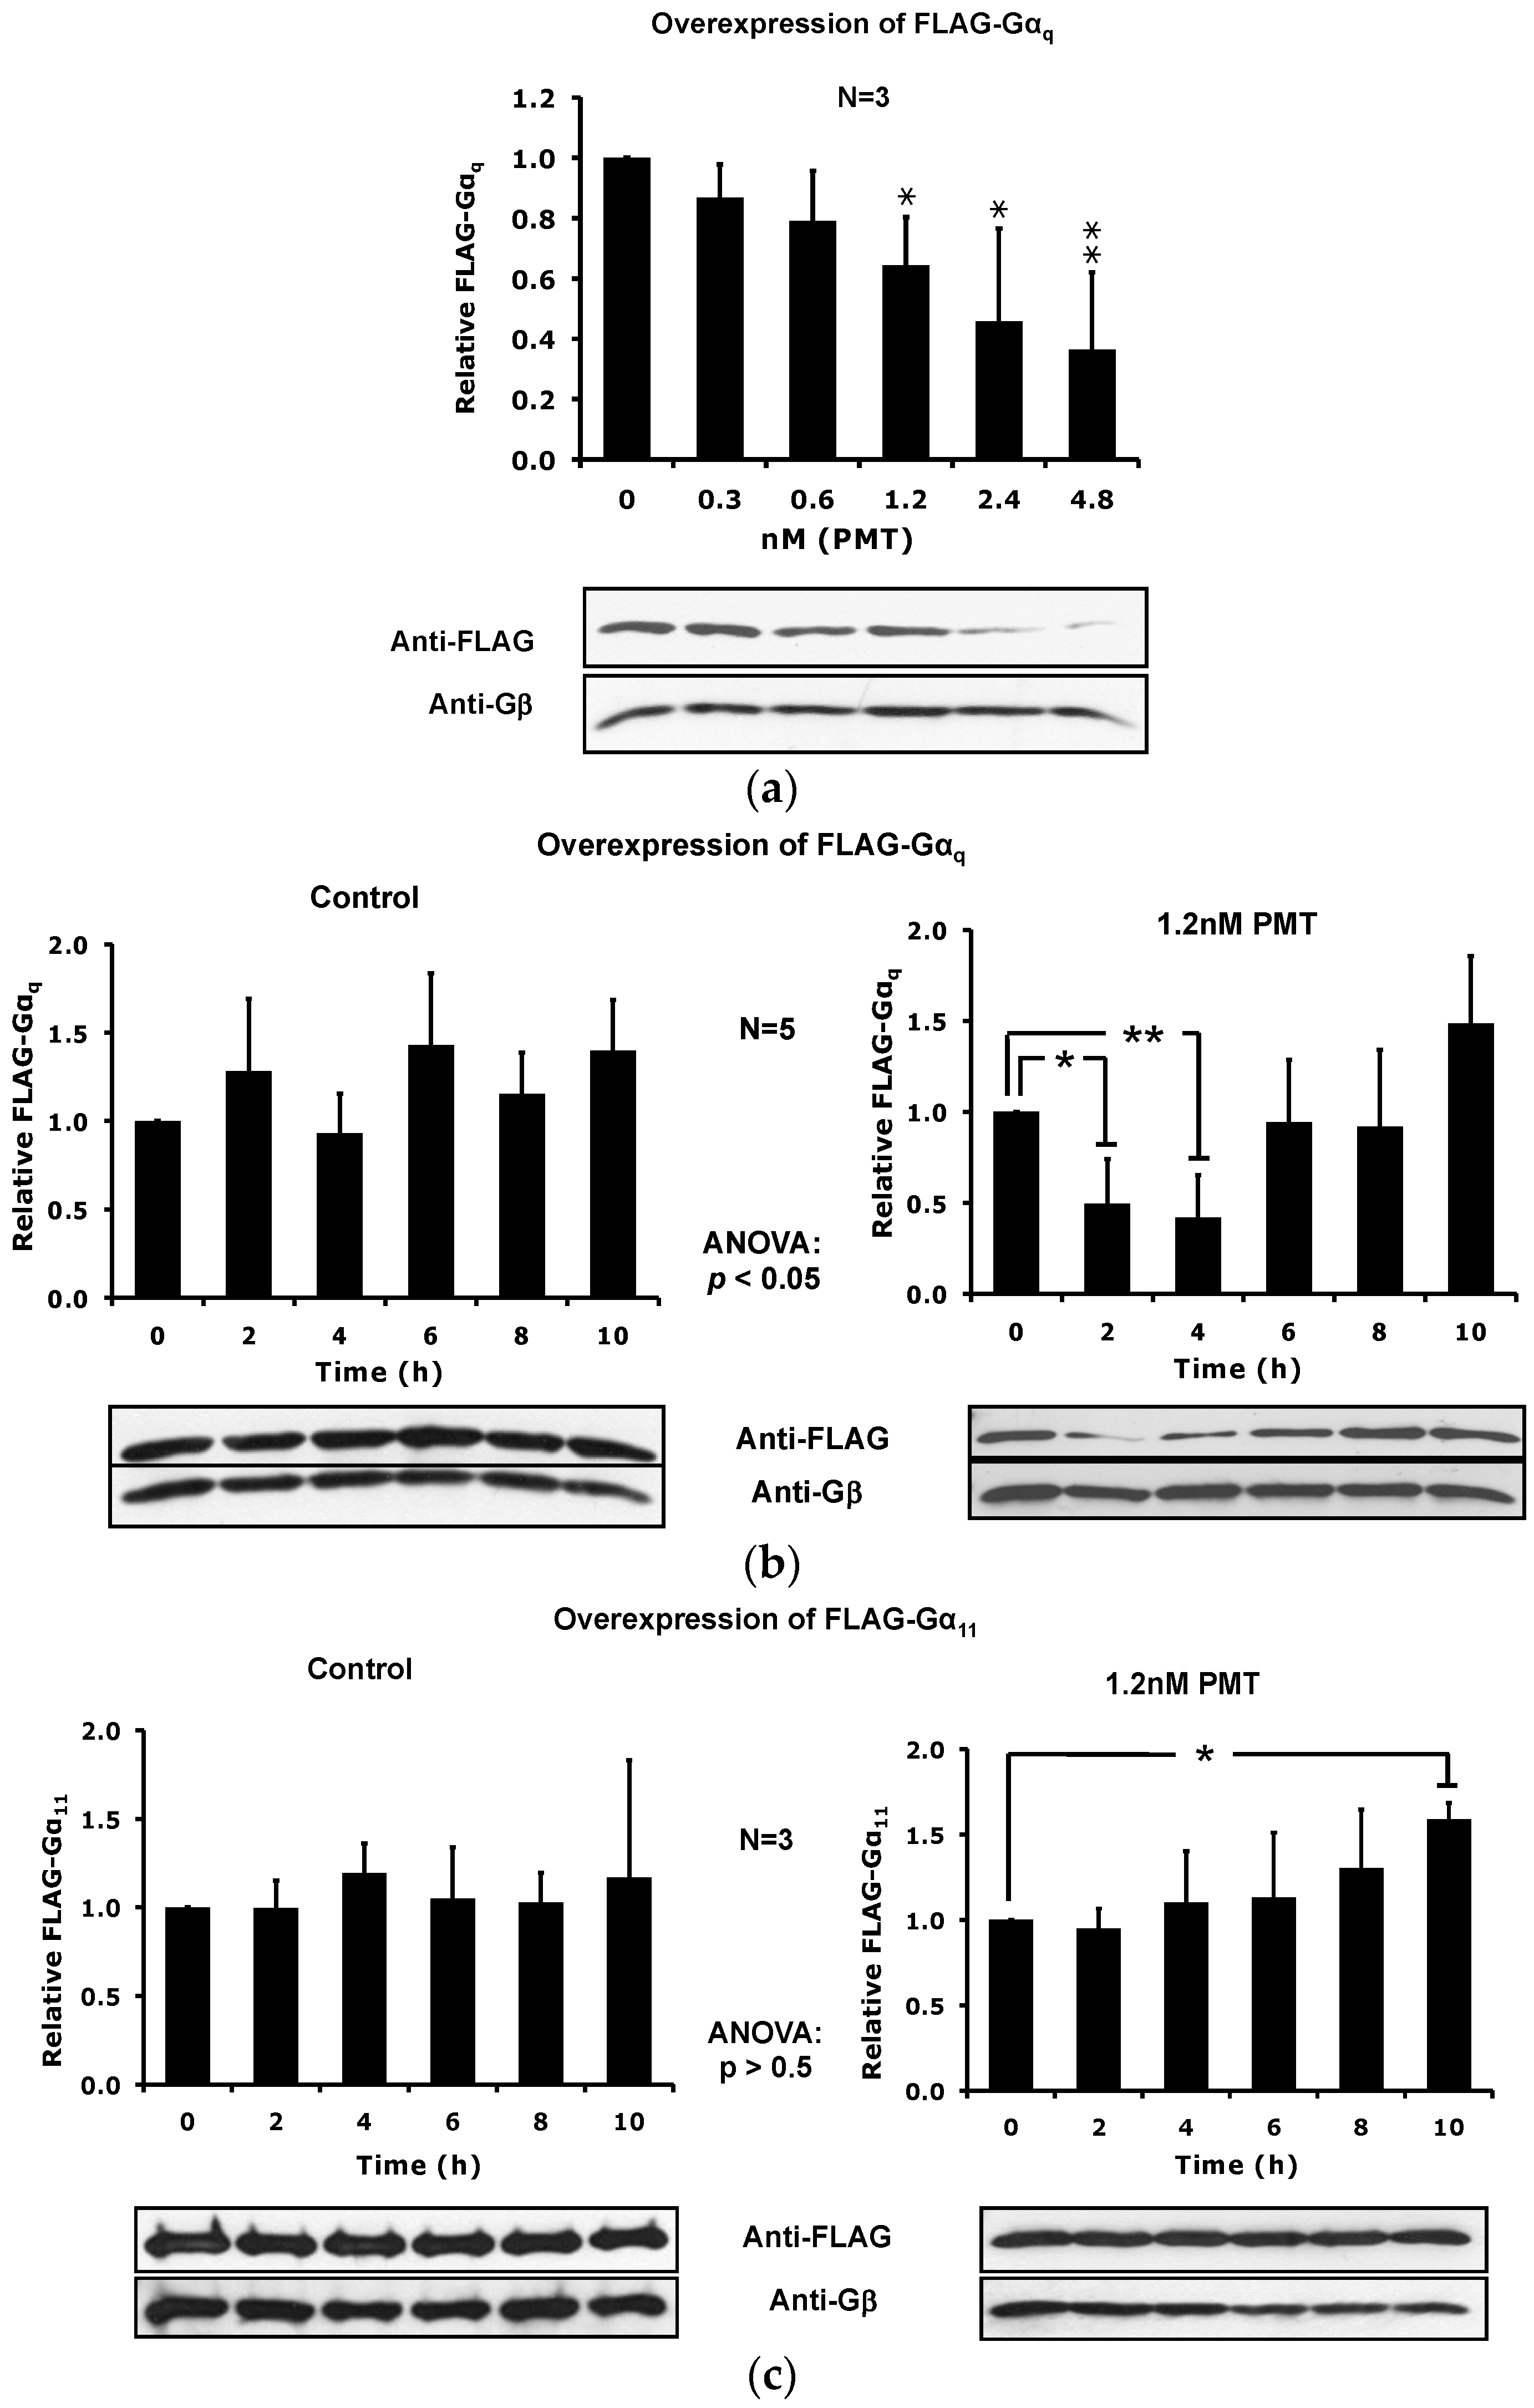
2.5. Overexpression of the Constitutively Active Forms of Gαq Alone nor in the Presence of PMT Is Sufficient to Induce Its Depletion from the Plasma Membrane

Since the catalytic activity of PMT is required for the depletion of Gαq from total membrane samples, and the consequence of PMT action renders the G-proteins constitutively active, we wanted to explore whether or not constitutive activity of Gαq alone was sufficient to induce the depletion or exclusion of the activated Gαq protein from the plasma membrane. We transfected HEK-293T cells separately with Gαq, Gα11, and their corresponding constitutively active mutants, with known dominant-active mutations, Gαq Q209L and Gα11 Q209L, and with mutations equivalent to that introduced by PMT action, Gαq Q209E and Gα11 Q209E (Figure 8a). First, we tested if overexpressing constitutively active Gα-proteins in HEK-293T cells causes similar cytotoxic morphological effects as PMT treatment. Exogenous expression of Gαq or Gα11 caused little effect on morphology after 24 h, but, as expected, overexpression of each of the four constitutively active mutants of Gαq or Gα11 results in the rounding up and clumping of cells, similar to that caused by PMT treatment (Figure 8b).
Unlike with the case of exogenous expression of Gαq protein, PMT treatment had no affect on the localization of the exogenously expressed constitutively active Gαq Q209E or Gαq Q209L mutant proteins in membranes (Figure 8c), suggesting that the presence of the activated form of the Gαq protein alone is not sufficient to cause its removal from the plasma membrane by PMT.

3. Discussion

We previously showed that microinjection of PMT into voltage-clamped Xenopus oocytes invoked a rapid (within 10 s) Ca2+-dependent Cl current, which involved activation of Gαq/11-PLCβ1 [9]. In this previous study, the response to PMT was transient, such that the initial strong response was followed by subsequent downregulation and unresponsiveness to further stimulation by PMT. A similar initial activation and subsequent downregulation of PMT-stimulated Ca2+ and mitogenic signaling was evidenced in mammalian cells through studies involving cell cycle analysis [21,46]. This downregulation of Gq signaling by PMT was reminiscent of receptor-mediated downregulation of Gq-protein signaling that occurs upon prolonged exposure to agonist [34,35,36,37,38], specifically the shift of Gαq proteins from DRMs to soluble membrane fractions or the cytosol during agonist-stimulated signal transduction [39]. This prompted us to explore the possibility that PMT-mediated activation of its Gα substrates, Gαq and/or Gα11, results in a similar uncoupling of the corresponding G-protein-signaling pathway.
We considered the possibility that although PMT might have little or no effect on total cellular content of Gαq/11 proteins, PMT deamidation and subsequent activation of the Gαq/11 proteins may cause downregulation of Gq/11 signaling through depletion of Gαq/11 levels in DRMs. The results presented here show for the first time that PMT induces both dose- and time-dependent depletion of Gαq but not Gα11 from membrane lipid rafts in HEK-293T cells with concomitant shift of Gαq to soluble membrane fractions or cytosol. Indeed, there was no significant decrease in Gαq or Gα11 observed for any of the time points in the control experiments with no PMT treatment or for the Gα11 protein in the PMT-treated experiments; a transient decrease in Gαq protein levels was observed only in PMT-treated cells. We further showed that this PMT-induced depletion occurs within DRM fractions from cells expressing endogenous levels of Gαq/11 proteins, as well as whole membranes and DRM fractions from cells overexpressing wildtype Gαq, and in DRM fractions from cells overexpressing FLAG-tagged Gαq, but not Gα11 proteins. Moreover, this PMT-mediated membrane redistribution of Gαq was dependent on the deamidase activity of PMT since a catalytic mutant PMT C1165S did not cause membrane depletion of Gαq.
Specifically, when cellular contents of PMT treated cells were separated into fractions by OptiPrep or sucrose density gradient centrifugation, we found that PMT treatment resulted in the loss of Gαq subunit from the flotillin-1-enriched DRM-containing fraction #5 with a concomitant increase of Gαq protein in the more soluble fractions (#8–12) of the gradient. The effect of PMT was specific for Gαq, and not for other Gα subunits that are not targets of PMT, such as Gαs or Gβ. Moreover, PMT-treatment caused membrane depletion of Gαq and not Gα11. Gαq and Gα11 share very similar structural homology and sequence identity of over 90%, and Gα11 can also be deamidated by PMT in cells [7,8]. The sensitive commercially available antibody that we used in this study to detect endogenous protein levels recognizes the C-terminus of both Gαq and Gα11. Thus, to distinguish the specificity of the PMT-mediated DRM and membrane depletion for Gαq vs. Gα11, we decided to use an overexpression approach, where we exogenously expressed either Gαq or Gα11 and detected the proteins using the anti-Gαq/11 antibodies. Under these conditions, endogenous levels of Gαq and Gα11 were not detectable in the resulting immunoblots.
The finding that the continued exposure to PMT was neither able to sustain the loss of nor perpetuate further loss of Gαq from DRMs suggests that the cellular Gαq levels in DRMs are replenished as a result of increased Gαq protein synthesis. Previous studies have shown that PMT induces protein synthesis and cellular proliferation in a cycloheximide-sensitive manner [47,48]. This notion is supported by the slight increase (not decrease) observed for Gα11 under similar conditions. Alternatively, it is possible that the observed replenishment of Gαq in the DRMs may also be due to a redistribution of the preexisting or newly synthesized monomeric Gαq protein that is in the membrane. However, unlike in the case for DRMs, the loss of Gαq from total membranes did not appear to replenish with time, suggesting that PMT modification and activation of Gαq uncouples the signaling pathway in such a way as to interfere with the ability of newly synthesized Gαq to interact with membranes, presumably through preventing reassociation with Gβγ subunits and coupling to GCPRs. The relatively faster response times for depletion and replenishment of the exogenously expressed Gαq protein, compared to that observed for endogenous protein, was presumably due to the increased levels of Gαq protein available as a substrate for PMT and saturation of the signaling system from enhanced protein synthesis of Gαq encoded by the expression plasmid. Further, this PMT-mediated loss of Gαq from DRMs and membranes is apparently masked at the total cell level (whole cell lysates) through redistribution to soluble membrane fractions or cytosol, as evidenced from the results shown in Figure 2 and Figure 3, and through synthesis of new Gαq protein, which counters the overall PMT-mediated loss of Gαq protein from membranes.
Since overexpression of Gαq Q209E or Gαq Q209L in HEK-293T cells resulted in similar morphological effects as PMT treatment, we explored whether exogenous expression of these constitutively active mutants would lead to their localization in the membrane and DRMs or would also result in their membrane depletion. Since we found that the presence of constitutively active Gαq mutant proteins alone was not sufficient to induce their depletion or exclusion from membranes, we next considered whether PMT treatment could induce the removal of pre-existing constitutively active Gαq from the cell plasma membrane. However, we found that PMT treatment had no effect on the membrane localization of exogenously expressed constitutively active Gαq mutant proteins.
Although the antibodies we used could not distinguish whether only the deamidated form of the Gαq is depleted from DRMs, our results clearly indicate the PMT catalytic activity is required. If PMT-mediated deamidation is required for depletion, and both Gαq and Gα11 can serve as substrates for deamidation by PMT [8], then PMT-deamidated Gα11 should also be depleted from DRMs. However, our results (Figure 4c) indicate that this is not the case. This suggests that either cellular Gα11 is a very poor substrate for PMT and does not get deamidated to any significant extent during the time studied or that the as-yet-undefined factor(s) responsible for depletion do not recognize the PMT-deamidated Gα11 as they do the PMT-deamidated Gαq. These possibilities might be explored further under endogenous conditions by using antibodies that distinguish Gαq from Gα11 coupled with those that recognize the deamidated forms of the Gα proteins, such as those previously reported [7,8].
These results suggest that PMT does not directly deplete the modified Gαq protein from the membrane, but PMT might indirectly activate an unknown cellular component at the membrane or expedite a cellular process responsible for the downregulation of membrane-associated PMT-modified Gαq. This further suggests that the depletion mechanism of PMT-modified Gαq proteins from the membrane has specificity and that PMT-catalyzed deamidation and activation of the Gαq protein is the not the sole signal for initiating the downregulation process. Whether similar membrane depletion occurs for other Gα substrates of PMT once they are deamidated and activated remains to be determined.

4. Materials and Methods

4.1. Materials

Human embryonic kidney 293-T (HEK-293T) cells were obtained from the American Type Culture Collection (ATCC# CRL-3216). Goat polyclonal antibodies against Gαs (A-16, sc-26766), mouse monoclonal antibody against β tubulin (D-10, sc-5274), rabbit polyclonal antibodies against Gαq/11 (C-19, cat# sc-392), Gβ (T-20, sc-378) and flotillin-1 (H-104, sc-25506), as well as horseradish peroxidase-conjugated donkey anti-goat IgG (sc-2020), goat anti-rabbit IgG (sc-2004), and goat anti-mouse IgG (sc-2005) antibodies, were purchased from Santa Cruz Biotechnology (Dallas, TX, USA). Mouse monoclonal anti-FLAG antibody (M2, F3165) and mammalian protease inhibitor cocktail was purchased from Sigma (St. Louis, MO, USA). All cell culture reagents were purchased from Life Technologies (Thermo Fisher Scientific, Grand Island, NY, USA). Restriction enzymes and other molecular biology reagents were obtained from Roche Biochemicals (Sigma-Aldrich, St. Louis, MO, USA) or New England Biolabs (Ipswich, MA, USA). OptiPrep was obtained from Axis-Shield PoCAS (Dundee, Scotland, UK). SuperSignal West Pico Chemiluminescent Substrate was purchased from Pierce Biotechnology (Thermo Fisher Scientific, Grand Island, NY, USA). Bio-Rad protein assay dye reagent was purchased from Bio-Rad Laboratories (Hercules, CA, USA). Full-length recombinant PMT and catalytically inactive mutant PMT C1165S were cloned, expressed, purified, quantified, and assayed for biological activity, as previously described [4,21,46].

4.2. Mammalian Expression Vectors Encoding Gα Proteins

DNA encoding human Gαq, Gα11, Gαq Q209L, and Gα11 Q209L genes (GB ACC# U43083; UMR cDNA Resource Center) [49] was cloned into the KpnI/XhoI sites of pcDNA3.1+ (Invitrogen, Thermo Fisher Scientific, Grand Island, NY, USA). For immunoblot detection, a FLAG-tag flanked at each end by a 6-residue linker sequence (SGGGGS) was introduced between residues 121 and 122 of Gαq and Gα11 by using the following primers:
qF1: 5′-GCTTGGTACCACCATGACTCTGGAGTCCAT-3′
qR1: 5′-GAGATATCCGCCGCCGCCAGACACCTTCCCACATCAAC-3′
qF4: 5′-GAGATATCCCGATACAAAGACGATGACGACAAGGGCGGAGGCGGC-3′
qF5: 5′-GACGACAAGGGCGGAGGCGGCTCTGCTTTTGAGAATCCATATGTAG-3′
qR2: 5′-GACTCGAGTTAGACCAGATTGTACTC-3′
11F1: 5′-GCTTGGTACCACCATGACTCTGGAGTC-3′
11R1: 5′-GAGATATCCGCCGCCGCCGGACACCTTCTCCACGTCCAC-3′
11F3: 5′-GACGACAAGGGCGGAGGCGGCTCTACCTTCGAGCATCAGTACGTC-3′
11R2: 5′-CTAGACTCGAGTCAGACCAGGTTGTAC-3′
(KpnI, EcoRV and XhoI restriction enzyme sites are underlined). All subcloning procedures were confirmed by using restriction enzyme and DNA sequencing analysis. Generation of the Q209E mutants of Gαq and Gα11 was completed by PCR cloning using the following primers:
qF1: 5′-CGATGTAGGCGGCGAAAGGTC-3′
qR1: 5′-GACCTTTCGCCGCCTACATCG-3′
qF2: 5′-TGTCGTAACAACTCCGCCCCA-3′
qR2: 5′-ACACCTACTCAGACAATGCGATGCA-3′
11F1: 5′-GTGGGCGGCGAGCGGTCGG-3′
11R1: 5′-CCGACCGCTCGCCGCCCAC-3′
11F2: 5′-TGTCGTAACAACTCCGCCCCA-3′
11R2: 5′-ACACCTACTCAGACAATGCGATGCA-3′

4.3. Transient Transfection

HEK-293T cells were maintained in Dulbecco’s modified Eagle’s medium (DMEM) supplemented with l-glutamine and 10% (v/v) bovine growth serum at 37 °C and 5% CO2. Cells grown to 60%–80% confluence (~4 × 10⁶ per 100-mm dish) were transiently transfected for 24 h with mammalian expression vectors: pcDNA3.1 (empty vector), pcDNA3.1/Gαq, pcDNA3.1/Gα11, pcDNA3.1/Gαq Q209E, pcDNA3.1/Gα11 Q209E, pcDNA3.1/Gαq Q209L, or pcDNA3.1/Gα11 Q209L, using LipofectAMINE 2000 reagent (Invitrogen), according to the manufacturer’s instructions, or using the CalPhos Mammalian Transfection protocol (Clonetech Laboratories, Takara Bio USA, Mountain View, CA, USA).

4.4. Cellular Fractionation

HEK-293T cells, transfected as described above, were treated with or without the indicated amounts of PMT for the indicated times, washed with 1× cold phosphate buffered saline, scraped and transferred into a microcentrifuge tube (Dot Scientific Inc., Burton, MI, USA), then lysed by 10 passages through a 27-gauge needle in 0.5 mL of an ice-cold lysis buffer A (50 mM Tris-HCl, pH 8.0, 2.5 mM MgCl2, 1 mM EDTA, 1 mM phenylmethylsulfonyl fluoride, 1 mM benzamidine, 1 mM dithiothreitol, and 10% glycerol) to generate whole cell lysates. Cellular fractionation was performed essentially, as described previously [50]. In brief, nuclei were pelleted by centrifugation at 4 °C and 750× g for 5 min, and the post-nuclear supernatant was fractionated into membrane pellets and supernatants by centrifugation at 4 °C and 18,000× g for 30 min. The membrane pellets were resuspended in 0.5 mL of lysis buffer A. Membrane proteins were quantified using the Bio-Rad protein assay. Samples containing 10 µg of total membrane proteins were resolved by SDS-PAGE and analyzed by immunoblotting, as described below.

4.5. Immunoblotting Analysis

Proteins in samples were separated by 10% SDS-PAGE and transferred onto nitrocellulose membranes, and the membranes were immunoblotted with the indicated primary antibody overnight at 4 °C, washed, then incubated with the appropriate horseradish peroxidase-conjugated secondary antibody. After washing, immunoreactive proteins were visualized by using enhanced chemiluminescence (Pierce Biotechnology, Thermo Fisher Scientific, Grand Island, NY, USA) and captured on autoradiographic film. Image analysis and quantification of protein bands was performed using NIH ImageJ (version 1.48u4, NIH, Bethesda, MD, USA) and Microsoft Excel software (Microsoft Office Professional Plus 2013).

4.6. OptiPrep or Sucrose Density Gradient Subcellular Fractionation

DRMs were prepared by density gradient centrifugation with OptiPrep or sucrose, as indicated, using a modification of previously described methods [38,43]. All procedures were carried out on ice. Briefly, four 100-mm culture dishes of subconfluent HEK-293T cells were treated with rPMT at the indicated concentrations for the indicated times. Cells were washed twice with modified Tyrode’s solution (20 mM HEPES, pH 7.4, containing 137 mM NaCl, 2.7 mM KCl, 1.0 mM MgCl2, 0.18 mM CaCl2, and 5.6 mM glucose). Cells were collected and washed twice with the ice-cold Tyrode’s solution, then centrifuged at 1000× g for 10 min. The pellet was solubilized in 1 mL of lysis buffer B (50 mM Tris-HCl, pH 7.4, containing 50 mM NaCl, 0.1% Triton X-100, 5 mM EDTA, 1.0 mM Na3VO4, 5.0 mM Na4P2O7, and protease inhibitor cocktail, comprised of 0.2 mM aminoethyl-benzene sulfonyl fluoride, 1 µg/mL aprotinin, 10 µM bestatin, 3 µM E-64, 10 µg/mL leupeptin, 2 µM pepstatin, and 50 µg/mL calpain inhibitor I). The cell were lysed via sonication, then incubated at 4 °C for 1 h with frequent agitation. Cell lysates (1 mL) were mixed with 3 mL of OptiPrep or sucrose solution (60% aqueous iodixanol or sucrose, respectively) in a 12-mL centrifuge tube, and the mixture was overlaid first with 4 mL of 35% OptiPrep/sucrose solution diluted in STE buffer (50 mM Tris-HCl, pH 7.6, containing 50 mM NaCl, 5 mM EDTA, and 1.0 mM Na3VO4,) and then 4 mL of 5% OptiPrep/sucrose solution. Ultracentrifugation was performed at 200,000× g and 4 °C for 20 h using a Beckman SW40Ti rotor (Beckman Coulter, Inc., Indianapolis, IN, USA) Fractions of 1.0 mL each were collected from the top of the gradient. Total protein content of each fraction was quantified using Bio-Rad protein assay. The distribution of various proteins in the fractions was assessed by SDS-PAGE and immunoblotting, as described above.

4.7. Data Analysis

All data are presented as the mean ± standard deviation (SD) from at least three independent experiments, or as indicated. The p values were determined using the unpaired two-tailed Student’s t-test. For Figure 4, Figure 5 and Figure 6, two-way ANOVA was also performed using data analysis tools in Microsoft Excel (Microsoft Office Professional Plus 2013) for the curves of control (no toxin treatment) vs. PMT-treated cells over the time course from 0 to 6 h. Statistical significance was set at the 95% confidence level.

Acknowledgments

This work was supported by National Institutes of Health/National Institute of Allergy and Infectious Diseases NIH/NIAID grant R01-AI038395 (to Brenda A. Wilson) and graduate fellowships from NIH/NIAID Infection Biology Training Program grant T32-AI078876 and University of Illinois at Urbana-Champaign UIUC Graduate College (to Nathan C. Clemons). We are grateful to Ankita Puri-Tanejah for construction of the FLAG-Gα11 plasmid.

Author Contributions

B.A.W. and M.H. conceived and designed the experiments; N.C.C. and S.L. performed the experiments; N.C.C., S.L., M.H., and B.A.W. analyzed the data; B.A.W. and M.H. contributed reagents/materials/support; and B.A.W., N.C.C., and M.H. wrote the paper.

Conflicts of Interest

The authors declare no conflict of interest.

Abbreviations

The following abbreviations are used in this manuscript:
DMEMDulbecco’s Modified Eagle’s Medium
DRMDetergent resistant membrane
EDTAEthylenediaminetetraacetic acid
EVEmpty vector
GPCRG-protein coupled receptor
NTNo transfection and/or treatment
PLCβ1Phospholipase C β-1
PMTPasteurella multocida toxin
SDStandard deviation
SDS-PAGESodium dodecyl sulfate polyacrylamide gel electrophoresis

References

  1. Wilson, B.A.; Ho, M. Pasteurella multocida: From zoonosis to cellular microbiology. Clin. Microbiol. Rev. 2013, 26, 631–655. [Google Scholar] [CrossRef] [PubMed]
  2. Brothers, M.C.; Ho, M.; Maharjan, R.; Clemons, N.C.; Bannai, Y.; Waites, M.A.; Faulkner, M.J.; Kuhlenschmidt, T.B.; Kuhlenschmidt, M.S.; Blanke, S.R.; et al. Membrane interaction of Pasteurella multocida toxin involves sphingomyelin. FEBS J. 2011, 278, 4633–4648. [Google Scholar] [CrossRef] [PubMed]
  3. Bergmann, S.; Jehle, D.; Schwan, C.; Orth, J.H.; Aktories, K. Pasteurella multocida toxin as a transporter of non-cell-permeating proteins. Infect Immun. 2013, 81, 2459–2467. [Google Scholar] [CrossRef] [PubMed]
  4. Repella, T.L.; Ho, M.; Chong, T.P.; Bannai, Y.; Wilson, B.A. Arf6-dependent intracellular trafficking of Pasteurella multocida toxin and pH-dependent translocation from late endosomes. Toxins 2011, 3, 218–241. [Google Scholar] [CrossRef] [PubMed]
  5. Rozengurt, E.; Higgins, T.; Chanter, N.; Lax, A.J.; Staddon, J.M. Pasteurella multocida toxin: Potent mitogen for cultured fibroblasts. Proc. Natl. Acad. Sci. USA 1990, 87, 123–127. [Google Scholar] [CrossRef] [PubMed]
  6. Wilson, B.A.; Bergmann, S.; Ho, M.; Orth, J.H.C. Pasteurella multocida toxin. In The Comprehensive Sourcebook of Bacterial Protein Toxins; Alouf, J.E., Ladant, D., Popoff, M.R., Eds.; Elsevier Science Publishers B.V.: New York, NY, USA, 2015; pp. 463–498. [Google Scholar]
  7. Kamitani, S.; Ao, S.; Toshima, H.; Tachibana, T.; Hashimoto, M.; Kitadokoro, K.; Fukui-Miyazaki, A.; Abe, H.; Horiguchi, Y. Enzymatic actions of Pasteurella multocida toxin detected by monoclonal antibodies recognizing the deamidated alpha subunit of the heterotrimeric GTPase Gq. FEBS J. 2011, 278, 2702–2712. [Google Scholar] [CrossRef] [PubMed]
  8. Orth, J.H.; Fester, I.; Siegert, P.; Weise, M.; Lanner, U.; Kamitani, S.; Tachibana, T.; Wilson, B.A.; Schlosser, A.; Horiguchi, Y.; et al. Substrate specificity of Pasteurella multocida toxin for alpha subunits of heterotrimeric G proteins. FASEB J. 2013, 27, 832–842. [Google Scholar] [CrossRef] [PubMed]
  9. Wilson, B.A.; Zhu, X.; Ho, M.; Lu, L. Pasteurella multocida toxin activates the inositol triphosphate signaling pathway in Xenopus oocytes via G(q)alpha-coupled phospholipase C-beta1. J. Biol. Chem. 1997, 272, 1268–1275. [Google Scholar] [CrossRef] [PubMed]
  10. Zywietz, A.; Gohla, A.; Schmelz, M.; Schultz, G.; Offermanns, S. Pleiotropic effects of Pasteurella multocida toxin are mediated by Gq-dependent and -independent mechanisms. involvement of Gq but not G11. J. Biol. Chem. 2001, 276, 3840–3845. [Google Scholar] [CrossRef] [PubMed]
  11. Orth, J.H.; Preuss, I.; Fester, I.; Schlosser, A.; Wilson, B.A.; Aktories, K. Pasteurella multocida toxin activation of heterotrimeric G proteins by deamidation. Proc. Natl. Acad. Sci. USA 2009, 106, 7179–7184. [Google Scholar] [CrossRef] [PubMed]
  12. Staddon, J.M.; Barker, C.J.; Murphy, A.C.; Chanter, N.; Lax, A.J.; Michell, R.H.; Rozengurt, E. Pasteurella multocida toxin, a potent mitogen, increases inositol 1,4,5-trisphosphate and mobilizes Ca2+ in Swiss 3T3 cells. J. Biol. Chem. 1991, 266, 4840–4847. [Google Scholar] [PubMed]
  13. Bannai, Y.; Aminova, L.R.; Faulkner, M.J.; Ho, M.; Wilson, B.A. Rho/ROCK-dependent inhibition of 3T3-L1 adipogenesis by G-protein-deamidating dermonecrotic toxins: Differential regulation of Notch1, Pref1/Dlk1, and beta-catenin signaling. Front. Cell. Infect. Microbiol. 2012, 2, 80. [Google Scholar] [CrossRef] [PubMed]
  14. Orth, J.H.; Lang, S.; Taniguchi, M.; Aktories, K. Pasteurella multocida toxin-induced activation of RhoA is mediated via two families of Gα proteins, Gαq and Gα12/13. J. Biol. Chem. 2005, 280, 36701–36707. [Google Scholar] [CrossRef] [PubMed]
  15. Sagi, S.A.; Seasholtz, T.M.; Kobiashvili, M.; Wilson, B.A.; Toksoz, D.; Brown, J.H. Physical and functional interactions of Galphaq with Rho and its exchange factors. J. Biol. Chem. 2001, 276, 15445–15452. [Google Scholar] [CrossRef] [PubMed]
  16. Vogt, S.; Grosse, R.; Schultz, G.; Offermanns, S. Receptor-dependent RhoA activation in G12/G13-deficient cells: Genetic evidence for an involvement of Gq/G11. J. Biol. Chem. 2003, 278, 28743–28749. [Google Scholar] [CrossRef] [PubMed]
  17. Dudet, L.I.; Chailler, P.; Dubreuil, J.D.; Martineau-Doize, B. Pasteurella multocida toxin stimulates mitogenesis and cytoskeleton reorganization in Swiss 3T3 fibroblasts. J. Cell. Physiol. 1996, 168, 173–182. [Google Scholar] [CrossRef]
  18. Lacerda, H.M.; Lax, A.J.; Rozengurt, E. Pasteurella multocida toxin, a potent intracellularly acting mitogen, induces p125FAK and paxillin tyrosine phosphorylation, actin stress fiber formation, and focal contact assembly in Swiss 3T3 cells. J. Biol. Chem. 1996, 271, 439–445. [Google Scholar] [PubMed]
  19. Siegert, P.; Schmidt, G.; Papatheodorou, P.; Wieland, T.; Aktories, K.; Orth, J.H. Pasteurella multocida toxin prevents osteoblast differentiation by transactivation of the MAP-kinase cascade via the Gα(q/11)-p63RhoGEF-RhoA axis. PLoS Pathog. 2013, 9, e1003385. [Google Scholar] [CrossRef] [PubMed]
  20. Thomas, W.; Pullinger, G.D.; Lax, A.J.; Rozengurt, E. Escherichia coli cytotoxic necrotizing factor and Pasteurella multocida toxin induce focal adhesion kinase autophosphorylation and Src association. Infect Immun. 2001, 69, 5931–5935. [Google Scholar] [CrossRef] [PubMed]
  21. Wilson, B.A.; Aminova, L.R.; Ponferrada, V.G.; Ho, M. Differential modulation and subsequent blockade of mitogenic signaling and cell cycle progression by Pasteurella multocida toxin. Infect Immun. 2000, 68, 4531–4538. [Google Scholar] [CrossRef] [PubMed]
  22. Babb, R.; Homer, K.; Robbins, J.B.; Lax, A.J. Modification of heterotrimeric G-Proteins in Swiss 3T3 cells stimulated with Pasteurella multocida toxin. PLoS ONE 2012, 7, e47188. [Google Scholar] [CrossRef] [PubMed]
  23. Orth, J.H.; Fester, I.; Preuss, I.; Agnoletto, L.; Wilson, B.A.; Aktories, K. Activation of Galpha (i) and subsequent uncoupling of receptor-Galpha(i) signaling by Pasteurella multocida toxin. J. Biol. Chem. 2008, 283, 23288–23294. [Google Scholar] [CrossRef] [PubMed]
  24. Wilson, B.A.; Ho, M. Cellular and molecular action of the mitogenic protein-deamidating toxin from Pasteurella multocida. FEBS J. 2011, 278, 4616–4632. [Google Scholar] [CrossRef] [PubMed]
  25. Bunemann, M.; Meyer, T.; Pott, L.; Hosey, M. Novel inhibition of Gbetagamma-activated potassium currents induced by M(2) muscarinic receptors via a pertussis toxin-insensitive pathway. J. Biol. Chem. 2000, 275, 12537–12545. [Google Scholar] [CrossRef] [PubMed]
  26. Lei, Q.; Talley, E.M.; Bayliss, D.A. Receptor-mediated inhibition of G protein-coupled inwardly rectifying potassium channels involves G(alpha)q family subunits, phospholipase C, and a readily diffusible messenger. J. Biol. Chem. 2001, 276, 16720–16730. [Google Scholar] [CrossRef] [PubMed]
  27. Meyer, T.; Oles, M.; Pott, L. Ca2+ entry but not Ca2+ release is necessary for desensitization of ETA receptors in airway apithelial cells. Naunyn-Schmiedeberg’s Arch. Pharmacol. 2000, 361, 120–126. [Google Scholar] [CrossRef]
  28. Kai, H.; Fukui, T.; Lassegue, B.; Shah, A.; Minieri, C.A.; Griendling, K.K. Prolonged exposure to agonist results in a reduction in the levels of the Gq/G11 alpha subunits in cultured vascular smooth muscle cells. Mol. Pharmacol. 1996, 49, 96–104. [Google Scholar] [PubMed]
  29. Lajat, S.; Harbon, S.; Tanfin, Z. Carbachol-induced desensitization of PLC-beta pathway in rat myometrium: Downregulation of Gqalpha/G11alpha. Am. J. Physiol. 1998, 275, C636–C645. [Google Scholar] [PubMed]
  30. Lee, T.W.; Wise, A.; Cotecchia, S.; Milligan, G. A constitutively active mutant of the alpha 1B-adrenergic receptor can cause greater agonist-dependent down-regulation of the G-proteins G9 alpha and G11 alpha than the wild-type receptor. Biochem. J. 1996, 320, 79–86. [Google Scholar] [CrossRef] [PubMed]
  31. Shi, J.; Damjanoska, K.J.; Singh, R.K.; Carrasco, G.A.; Garcia, F.; Grippo, A.J.; Landry, M.; Sullivan, N.R.; Battaglia, G.; Muma, N.A. Agonist induced-phosphorylation of Galpha11 protein reduces coupling to 5-HT2A receptors. J. Pharmacol. Exp. Ther. 2007, 323, 248–256. [Google Scholar] [CrossRef] [PubMed]
  32. Shi, J.; Zemaitaitis, B.; Muma, N.A. Phosphorylation of Galpha11 protein contributes to agonist-induced desensitization of 5-HT2A receptor signaling. Mol. Pharmacol. 2007, 71, 303–313. [Google Scholar] [CrossRef] [PubMed]
  33. Van de Westerlo, E.; Yang, J.; Logsdon, C.; Williams, J.A. Down-regulation of the G-proteins Gq alpha and G11 alpha by transfected human M3 muscarinic acetylcholine receptors in Chinese hamster ovary cells is independent of receptor down-regulation. Biochem. J. 1995, 310, 559–563. [Google Scholar] [CrossRef] [PubMed]
  34. Wise, A.; Lee, T.W.; MacEwan, D.J.; Milligan, G. Degradation of G11 alpha/Gq alpha is accelerated by agonist occupancy of alpha 1A/D, alpha 1B, and alpha 1C adrenergic receptors. J. Biol. Chem. 1995, 270, 17196–17203. [Google Scholar] [CrossRef] [PubMed]
  35. Haraguchi, K.; Rodbell, M. Isoproterenol stimulates shift of G proteins from plasma membrane to pinocytotic vesicles in rat adipocytes: A possible means of signal dissemination. Proc. Natl. Acad. Sci. USA 1990, 87, 1208–1212. [Google Scholar] [CrossRef] [PubMed]
  36. Mullaney, I.; Dodd, M.W.; Buckley, N.; Milligan, G. Agonist activation of transfected human M1 muscarinic acetylcholine receptors in CHO cells results in down-regulation of both the receptor and the alpha subunit of the G-protein Gq. Biochem. J. 1993, 289, 125–131. [Google Scholar] [CrossRef] [PubMed]
  37. Ransnas, L.A.; Svoboda, P.; Jasper, J.R.; Insel, P.A. Stimulation of beta-adrenergic receptors of S49 lymphoma cells redistributes the alpha subunit of the stimulatory G protein between cytosol and membranes. Proc. Natl. Acad. Sci. USA 1989, 86, 7900–7903. [Google Scholar] [CrossRef] [PubMed]
  38. Sugama, J.; Ohkubo, S.; Atsumi, M.; Nakahata, N. Mastoparan changes the cellular localization of Galphaq/11 and Gbeta through its binding to ganglioside in lipid rafts. Mol. Pharmacol. 2005, 68, 1466–1474. [Google Scholar] [CrossRef] [PubMed]
  39. Ostrom, R.S.; Insel, P.A. The evolving role of lipid rafts and caveolae in G protein-coupled receptor signaling: Implications for molecular pharmacology. Br. J. Pharmacol. 2004, 143, 235–45. [Google Scholar] [CrossRef] [PubMed]
  40. Aminova, L.R.; Luo, S.; Bannai, Y.; Ho, M.; Wilson, B.A. The C3 domain of Pasteurella multocida toxin is the minimal domain responsible for activation of Gq-dependent calcium and mitogenic signaling. Protein Sci. 2008, 17, 945–949. [Google Scholar] [CrossRef] [PubMed]
  41. Orth, J.H.; Lang, S.; Preuss, I.; Milligan, G.; Aktories, K. Action of Pasteurella multocida toxin on Galpha(q) is persistent and independent of interaction with G-protein-coupled receptors. Cell. Signal. 2007, 19, 2174–2182. [Google Scholar] [CrossRef] [PubMed]
  42. Baldwin, M.R.; Pullinger, G.D.; Lax, A.J. Pasteurella multocida toxin facilitates inositol phosphate formation by bombesin through tyrosine phosphorylation of G alpha q. J. Biol. Chem. 2003, 278, 32719–32725. [Google Scholar] [CrossRef] [PubMed]
  43. Macdonald, J.L.; Pike, L.J. A simplified method for the preparation of detergent-free lipid rafts. J. Lipid Res. 2005, 46, 1061–1067. [Google Scholar] [CrossRef] [PubMed]
  44. Langhorst, M.F.; Reuter, A.; Stuermer, C.A. Scaffolding microdomains and beyond: The function of reggie/flotillin proteins. Cell. Mol. Life Sci. 2005, 62, 2228–2240. [Google Scholar] [CrossRef] [PubMed]
  45. Ward, P.N.; Miles, A.J.; Sumner, I.G.; Thomas, L.H.; Lax, A.J. Activity of the mitogenic Pasteurella multocida toxin requires an essential C-terminal residue. Infect. Immun. 1998, 66, 5636–5642. [Google Scholar] [PubMed]
  46. Aminova, L.R.; Wilson, B.A. Calcineurin-independent inhibition of 3T3-L1 adipogenesis by Pasteurella multocida toxin: Suppression of Notch1, stabilization of beta-catenin and pre-adipocyte factor 1. Cell. Microbiol. 2007, 9, 2485–2496. [Google Scholar] [CrossRef] [PubMed]
  47. Oubrahim, H.; Wong, A.; Wilson, B.A.; Chock, P.B. Pasteurella multocida toxin (PMT) upregulates CTGF which leads to mTORC1 activation in Swiss 3T3 cells. Cell. Signal. 2013, 25, 1136–1148. [Google Scholar] [CrossRef] [PubMed]
  48. Oubrahim, H.; Wong, A.; Wilson, B.A.; Chock, P.B. Mammalian target of rapamycin complex 1 (mTORC1) plays a role in Pasteurella multocida toxin (PMT)-induced protein synthesis and proliferation in Swiss 3T3 cells. J. Biol. Chem. 2013, 288, 2805–2815. [Google Scholar] [CrossRef] [PubMed]
  49. UMR cDNA Resource Center. Available online: http://www.cdna.org (accessed on 26 July 2016).
  50. Medina, R.; Grishina, G.; Meloni, E.G.; Muth, T.R.; Berlot, C.H. Localization of the effector-specifying regions of Gi2alpha and Gqalpha. J. Biol. Chem. 1996, 271, 24720–24727. [Google Scholar] [CrossRef] [PubMed]
Figure 1. Effect of Pasteurella multocida toxin (PMT) on the morphology of HEK-293T cells. Shown are representative phase-contrast micrographs of HEK-293T cells treated overnight with varying concentrations of PMT: (a) no toxin; (b) 0.01 nM; (c) 0.07 nM; (d) 0.65 nM; (e) 1.6 nM; and (f) 3.2 nM. Bar, 10 µm.
Toxins 08 00233 g001
Figure 2. PMT-mediated downregulation of endogenous Gαq/11 levels in detergent resistant membranes (DRMs). HEK-293T cells were incubated without or with 0.3 nM PMT for 10 h. Preparation of cell lysates and fractionation by OptiPrep density gradient centrifugation was performed, as described in Methods Section. Each sample was separated into 121-mL fractions from low density (top, fraction #1) to high density (bottom, fraction #12), with fraction #5 containing the DRMs, as evidenced by the presence of the DRM-specific marker flotillin-1. The proteins were resolved by 10% SDS-PAGE gel and subsequently analyzed by immunoblotting using antibodies against Gαq/11, Gαs, Gβ, and flotillin-1 present in the cell lysates (Lys) and fractions #4–12 from the density gradient.
Toxins 08 00233 g002
Figure 3. Time course and dose–response of PMT-mediated downregulation of endogenous Gαq/11 levels in detergent resistant membranes (DRMs). (a) Time course of PMT-mediated downregulation of Gαq/11 levels in DRMs. HEK-293T cells were incubated with 0.3 nM PMT for the indicated times. (b) Dose–response of PMT-mediated downregulation of Gαq/11 levels in DRMs. HEK-293T cells were incubated with the indicated concentrations of PMT for 10 h. Shown are representative immunoblots of the lysates and the DRM-containing fraction #5 of the density gradients, prepared, separated by density gradient fractionation, and analyzed by immunoblotting, as described in Figure 2. Shown below the immunoblots are the corresponding plots of the quantification of the protein bands, where the data are presented as the mean ± SD of the relative ratio of the intensity of the Gαq/11 or Gβ bands to the corresponding flotillin-1 bands. Filled bars: Relative ratio of Gαq/11/flotillin-1. Open bars: Relative ratio of Gβ/flotillin-1. * p < 0.01; ** p < 0.001, PMT treatment vs. no treatment for each blot (unpaired two-tailed Student’s t-test). All data are from three or more independent experiments.
Toxins 08 00233 g003
Figure 4. PMT-mediated downregulation of Gαq and Gα11 levels in detergent resistant membranes (DRMs) from HEK-293T cells overexpressing Gαq or Gα11. (a) Shown is a representative immunoblot of whole cell membranes from HEK-293T cells transfected for 24 h with either no transfection (NT), pcDNA3.1/Gαq, pcDNA3.1/Gα11, or empty vector pcDNA3.1 (EV). The proteins were resolved by 10% SDS-PAGE gel and subsequently analyzed by immunoblotting using antibodies against Gαq/11 and Gβ. (b) Time course of PMT-treated HEK-293T cells overexpressing Gαq. (c) Time course of PMT-treated HEK-293T cells overexpressing Gα11. Shown are representative immunoblots (bottom panels) and the corresponding quantification plots (top panels) of DRMs, prepared using sucrose density gradient fractionation as described in Methods, and analyzed as described in Figure 2. Cells overexpressing Gαq or Gα11 were treated without PMT (left panel) or with 1.2 nM PMT (right panel) for the indicated times. Proteins in the DRM-containing fraction #5 of the density gradient were resolved by 10% SDS-PAGE gel and analyzed by immunoblotting using antibodies against Gαq/11 or Gβ. Plotted data are presented as the mean ± SD. Filled bars: relative ratio of Gαq/11/Gβ. N is the number of independent experiments performed. * p < 0.05, PMT treatment vs. time 0 h for each blot.
Toxins 08 00233 g004aToxins 08 00233 g004b
Figure 5. PMT-mediated downregulation of Gαq and Gα11 levels in membrane preparations from HEK-293T cells overexpressing Gαq or Gα11. (a) Dose course of PMT-mediated downregulation of Gαq levels in membrane preparations from HEK-293T cells overexpressing Gαq treated with the indicated dosages of PMT for 3 h. (b) Time course of PMT-mediated downregulation of Gαq levels in membrane preparations from HEK-293T cells overexpressing Gαq treated without PMT (left panels) or with 1.2 nM PMT (right panels) for the indicated times. (c) Time course of PMT-mediated downregulation of Gα11 levels in whole membrane preparations from HEK-293T cells overexpressing Gα11 treated without or with PMT, as in (b). Shown are representative immunoblots (bottom panels) and the corresponding quantification plots (top panels) of whole cell membranes, prepared and analyzed as described in the Methods Section. The proteins in the membrane fractions were resolved by 10% SDS-PAGE gel and subsequently analyzed by immunoblotting using antibodies against Gαq/11 and Gβ. Filled bars: Relative ratio of Gαq/11/Gβ. N is the number of independent experiments performed. * p < 0.05, ** p < 0.01, PMT treatment vs. time 0 h or dose 0 for each blot.
Toxins 08 00233 g005aToxins 08 00233 g005b
Figure 6. PMT-mediated downregulation of FLAG-Gαq and FLAG-Gα11 protein levels in detergent resistant membranes (DRMs) from HEK-293T cells overexpressing FLAG-Gαq or FLAG-Gα11. (a) Dose-response of PMT-treated HEK-293T cells overexpressing FLAG-Gαq were treated with the indicated dosages of PMT for 3 h. (b) Time course of PMT-treated HEK-293T cells overexpressing FLAG-Gαq were treated without (left panel) or with 1.2 nM PMT (right panel) for the indicated times. (c) Time course of PMT-treated HEK-293T cells overexpressing FLAG-Gα11 treated with PMT, as in (b). Shown are representative immunoblots (bottom panels) and the corresponding quantification plots (top panels) of DRMs, prepared using OptiPrep density gradient fractionation and analyzed as described in Figure 2. Proteins in the DRM-containing fraction #5 of the density gradient were resolved by 10% SDS-PAGE gel and analyzed by immunoblotting using antibodies against the FLAG-tag or Gβ. Plotted data are presented as the mean ± SD. Filled bars: Relative ratio of FLAG/Gβ. N is the number of independent experiments performed. * p < 0.05, ** p < 0.01, PMT treatment vs. time 0 h or dose 0 for each blot.
Toxins 08 00233 g006
Figure 7. Dependence of PMT-mediated downregulation of membrane levels of Gαq protein on the catalytic activity of PMT. HEK-293T cells overexpressing Gαq (left panels) or Gα11 (right panels) were treated for 2 h without or with 1.2 nM PMT or the catalytically inactive mutant PMT C1165S. Shown are representative immunoblots (bottom panels) and the corresponding quantification plots (top panels) of whole cell membranes, prepared and analyzed as described in Figure 3. The proteins in the membrane fractions were resolved by 10% SDS-PAGE gel and subsequently analyzed by immunoblotting using antibodies against Gαq/11 or Gβ. Plotted data are presented as the mean ± SD. Filled bars: relative ratio of Gαq/11/Gβ. N is the number of independent experiments performed. ** p < 0.01, PMT treatment vs. no treatment for each blot.
Toxins 08 00233 g007
Figure 8. Morphology of HEK-293T cells exogenously expressing constitutively active Gα-proteins and the effect of PMT on membrane levels of constitutively active Gαq proteins. (a) Representative immunoblots of membrane preparations of HEK-293T cells overexpressing Gαq, Gα11, or their constitutively active Q209E and Q209L counterparts, using antibodies against Gαq/11 or Gβ. Control membranes were from cells transfected with empty vector pcDNA3.1 (EV). (b) Shown are phase-contrast micrographs of HEK-293T cells overexpressing the indicated Gα-protein, or without or with 1.2 nM PMT treatment, as indicated. NT, no transfection or treatment. Bar, 200 µm. (c) Representative immunoblots of membrane preparations showing protein levels of Gαq Q209E, Gαq Q209L, or Gβ in cells without or with 1.2 nM PMT treatment for 3 h PMT. Shown above the immunoblots are the corresponding plots of the quantification of the bands, where data are presented as the mean ± SD of the relative ratios of Gαq/11/Gβ. N is number of independent experiments performed. p > 0.6, PMT treatment vs. no treatment for each plot.
Toxins 08 00233 g008

