Article

Palladium Nanoparticles-Based Fluorescence Resonance Energy Transfer Aptasensor for Highly Sensitive Detection of Aflatoxin M1 in Milk

1
Oil Crops Research Institute, Chinese Academy of Agricultural Sciences, Wuhan 430062, China
2
Laboratory of Quality & Safety Risk Assessment for Oilseed Products (Wuhan), Ministry of Agriculture, Wuhan 430062, China
3
Key Laboratory of Detection for Mycotoxins, Ministry of Agriculture, Wuhan 430062, China
4
Quality Inspection & Test Center for Oilseed Products, Ministry of Agriculture, Wuhan 430062, China
*
Authors to whom correspondence should be addressed.
Toxins 2017, 9(10), 318; https://doi.org/10.3390/toxins9100318
Submission received: 12 September 2017 / Revised: 5 October 2017 / Accepted: 6 October 2017 / Published: 13 October 2017
(This article belongs to the Collection Aflatoxins)

Abstract

:
A highly sensitive aptasensor for aflatoxin M1 (AFM1) detection was constructed based on fluorescence resonance energy transfer (FRET) between 5-carboxyfluorescein (FAM) and palladium nanoparticles (PdNPs). PdNPs (33 nm) were synthesized through a seed-mediated growth method and exhibited broad and strong absorption in the whole ultraviolet-visible (UV-Vis) range. The strong coordination interaction between nitrogen functional groups of the AFM1 aptamer and PdNPs brought FAM and PdNPs in close proximity, which resulted in the fluorescence quenching of FAM to a maximum extent of 95%. The non-specific fluorescence quenching caused by PdNPs towards fluorescein was negligible. After the introduction of AFM1 into the FAM-AFM1 aptamer-PdNPs FRET system, the AFM1 aptamer preferentially combined with AFM1 accompanied by conformational change, which greatly weakened the coordination interaction between the AFM1 aptamer and PdNPs. Thus, fluorescence recovery of FAM was observed and a linear relationship between the fluorescence recovery and the concentration of AFM1 was obtained in the range of 5–150 pg/mL in aqueous buffer with the detection limit of 1.5 pg/mL. AFM1 detection was also realized in milk samples with a linear detection range from 6 pg/mL to 150 pg/mL. The highly sensitive FRET aptasensor with simple configuration shows promising prospect in detecting a variety of food contaminants.

1. Introduction

Aflatoxins (AFs), which are highly toxic mycotoxins produced by Aspergillus parasiticus, Aspergillus flavus and Aspergillus nomius (rarely), present in a wide range of food and feed commodities [1,2]. The exposure of aflatoxin B1 (AFB1)-contaminated feed to lactating mammals will lead to the conversion of AFB1 into aflatoxin M1 (AFM1) through hydroxylation under liver cytochrome P450 catalysis [3,4]. AFM1, which have intense hepatotoxic and carcinogenic effects and have been designated as group1 carcinogen by the International Agency for Research on Cancer (IARC) of the World Health Organization (WHO) in 2002 [5], will subsequently be secreted in the milk of lactating mammals. As AFM1 is quite stable during general pasteurization and storage process and will not be destroyed until the temperature exceeds 299 °C, it will enter human body through milk drinking and endanger human health [6,7]. Therefore, many countries have stipulated the maximum residue limit (MRL) of AFM1 in dairy and dairy products. In the European Community, the MRL level for the presence of AFM1 in milk has been set at 0.05 ng/mL [8]. According to regulations of the U.S. Food and Drug Administration [9] and the Chinese government [10], the MRL level of AFM1 in milk and milk products should not exceed 0.5 ng/mL. Hence it is very important to monitor the concentration of AFM1 in dairy products to ensure human health and consumption safety.
In the past few years, various testing methods have been developed for AFM1 detection, which includes thin-layer chromatography (TLC) [11,12], enzyme-linked immunosorbent assay (ELISA) [13,14], high-performance liquid chromatography (HPLC) [15,16], liquid chromatography-tandem mass spectrometry (LC-MS) [17,18] and immunosensors [19,20]. Compared with those mentioned above, the aptasensor, which exhibits unique advantages such as being less expensive, easier to operate and suitable for on-site analyses, has attracted increasing attention recently. The aptasensor is referred to as a new category of biosensor constructed with aptamers as recognition elements, which show noticeable advantages over antibodies such as small size, good reproducibility, high stability, easy chemical fabrication with signal moieties and low immunogenicity [21]. Recently, Dinçkaya et al. developed an impedimetric AFM1 biosensor based on a 21-mer aptamer sequence for AFM1 and gold nanoparticles [22]. Afterwards, electrochemical [23,24] and fluorescent [25] aptasensors have also been developed for AFM1 detection. Despite the achievements made in the AFM1 aptasensors, it is still a challenge to develop new techniques for AFM1 detection with improved sensitivity, simplicity and stability.
Fluorescence resonance energy transfer (FRET), which is a non-radiative energy transfer process occurring between energy donor and acceptor in close proximity (normally 1–10 nm) through long-range dipole-dipole interactions, has been widely used in quantitative determination of biomolecules [26,27], small molecules [28,29] and metal ions [30,31] because of its homogeneous nature and high sensitivity. The fluorescence quenching ability of energy acceptors plays an important role in determining the analytical sensitivity in the FRET-based analysis. Larger palladium nanoparticles (PdNPs ≥ 30 nm), which exhibit broad and strong absorption in the whole ultraviolet-visible (UV-Vis) spectrum range with high molar extinction coefficient [32], have received great attention as an energy acceptor for FRET-based biological analysis application in recent years. Additionally, an ultrasensitive biosensing platform for DNA and protein detection have been developed based on the excellent luminescence quenching ability of PdNPs towards different fluorescent dyes, such as FAM and rhodamine [32].
Herein, we combined the excellent luminescence quenching ability of PdNPs towards fluorescent dyes with the highly specific binding ability of the AFM1 aptamer towards AFM1 to develop a highly sensitive PdNPs-based FRET aptasensor for AFM1 detection. When a FAM-labeled AFM1 aptamer is incubated with PdNPs, the energy donor was brought close to the energy acceptor in the range from 1 nm to 10 nm through the strong coordination interaction between the nitrogen functional groups of the AFM1 aptamer and PdNPs, thus resulting in the fluorescence quenching of FAM. However, after the introduction of AFM1 into the FRET quenching system, AFM1 aptamer preferentially bound with AFM1 accompanied with its conformational change, which greatly weakened the coordination interaction between AFM1 aptamer and PdNPs. Thus, the distance between FAM and PdNPs was enlarged and thereby the fluorescence recovery of FAM was observed in a AFM1 concentration-dependent manner. The AFM1 aptasensor also performed well in milk samples.

2. Results and Discussion

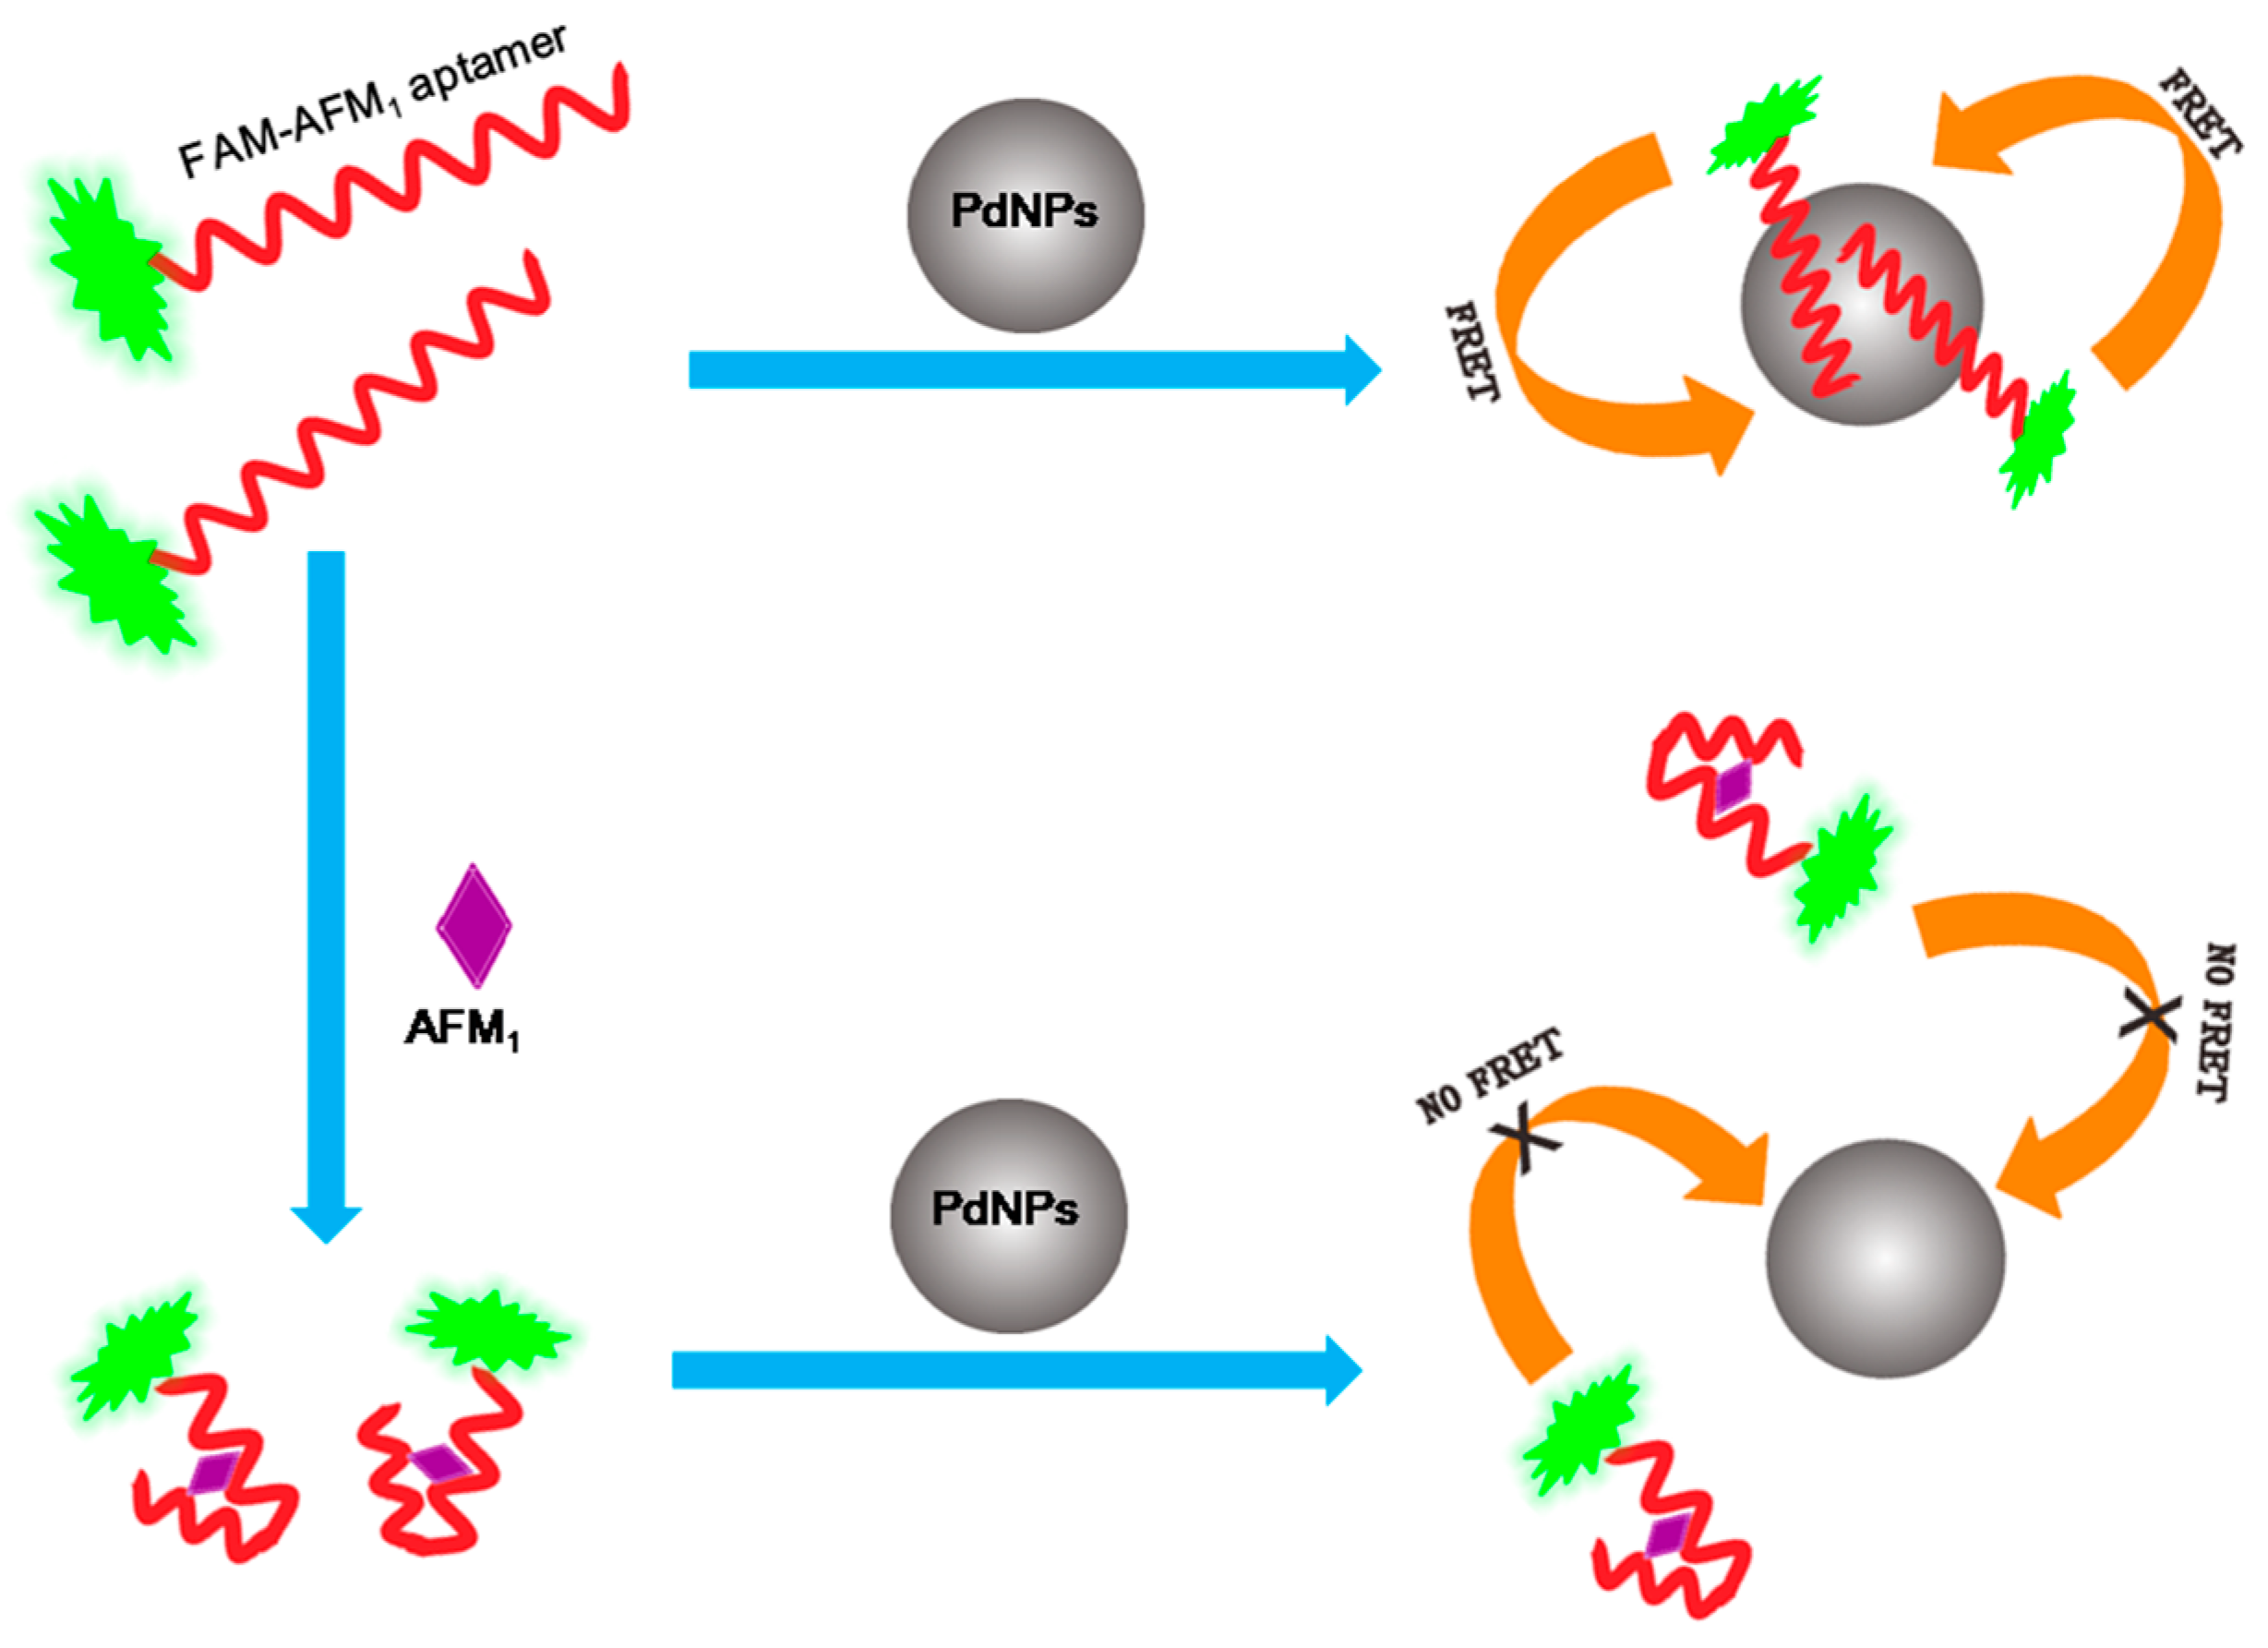
2.1. Construction of the FRET Aptasensor for AFM1

The AFM1 aptasensor was constructed based on aptamer-bridged FRET between FAM and PdNPs, as shown in Scheme 1. It has been reported that there was a strong coordination effect between nitrogen functional groups of single-stranded DNA (ssDNA) and PdNPs [32,33]. However, after the hybridization between ssDNA and its complementary chains occurred, the coordination effect was greatly weakened as fewer heteroatoms were exposed to PdNPs in the double helix structure of DNA. In our design, the strong coordination effect between the 5′-FAM-labeled AFM1 aptamer and PdNPs brought the fluorescence donor FAM close to the fluorescence acceptor PdNPs, which resulted in the occurrence of FRET, and the fluorescence quenching of FAM was observed. After AFM1 was introduced into the FAM-AFM1 aptamer-PdNPs FRET system, AFM1 aptamer preferentially bound to AFM1 accompanied with its conformational change, which largely weakened the coordination effect between the AFM1 aptamer and PdNPs. Thus FAM was separated from PdNPs and the FRET process was blocked. Therefore, the fluorescence recovery of FAM was observed and the degree of fluorescence recovery was in a positive AFM1 concentration-dependent manner.

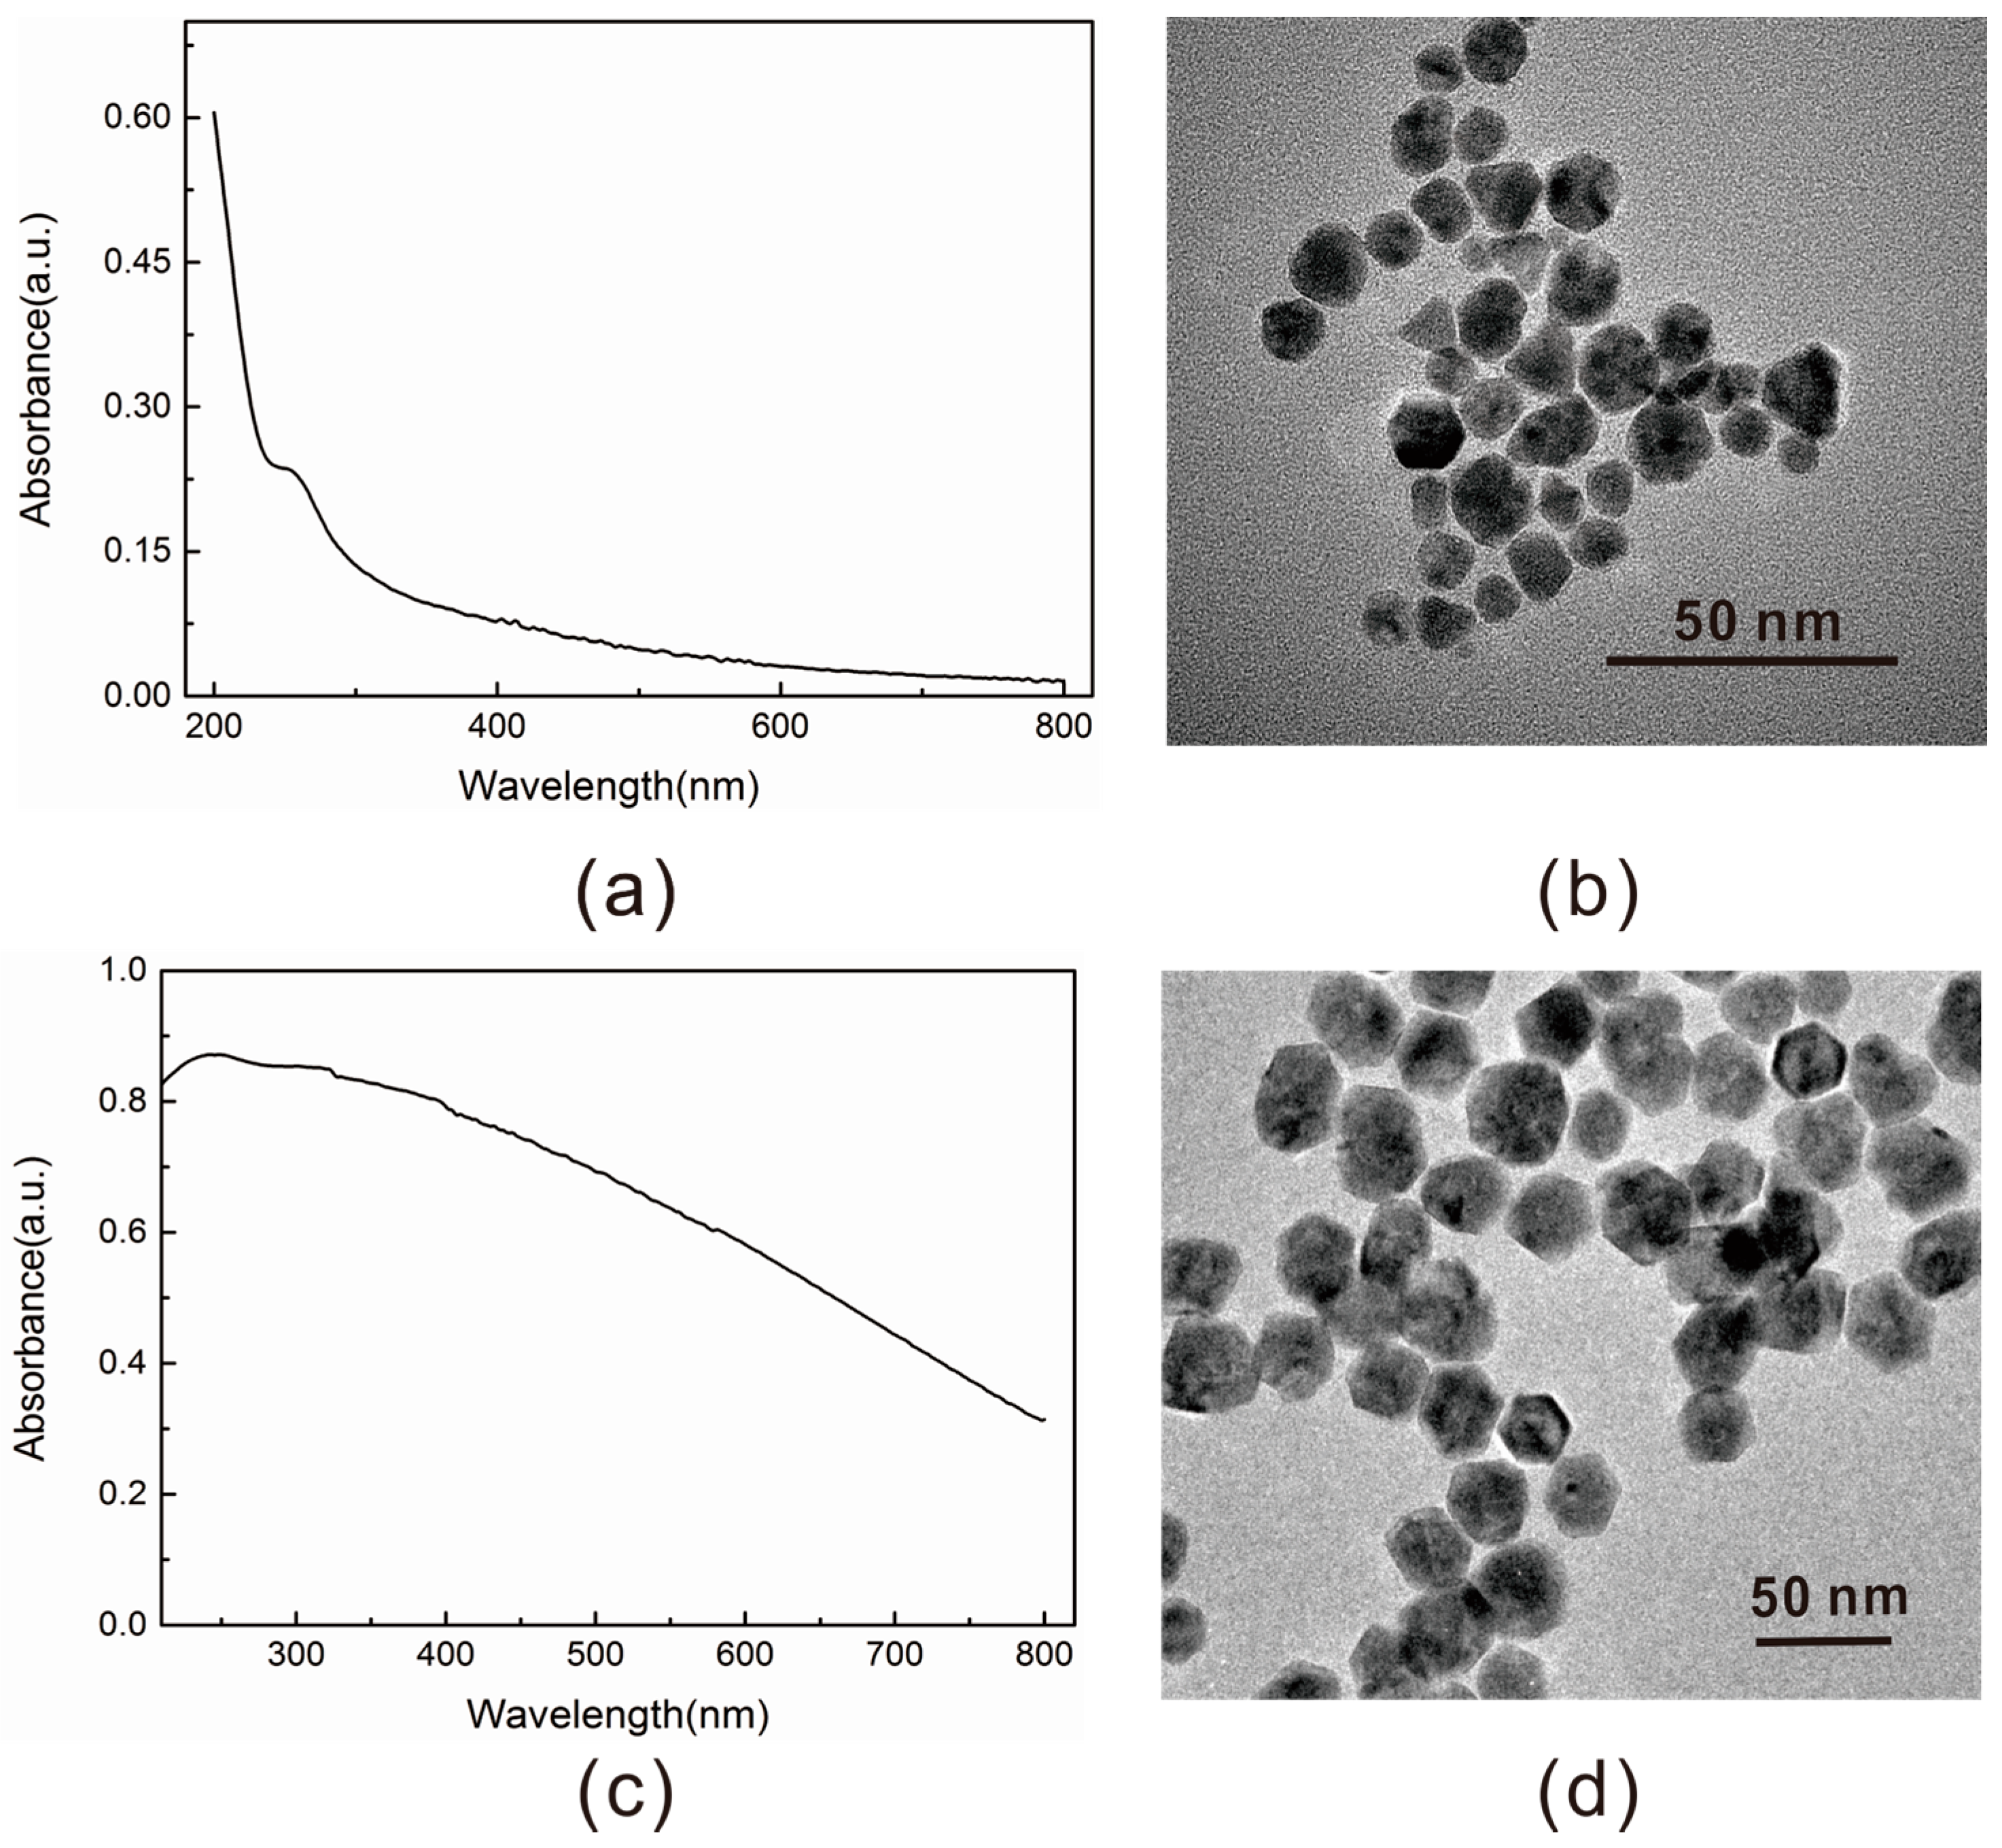
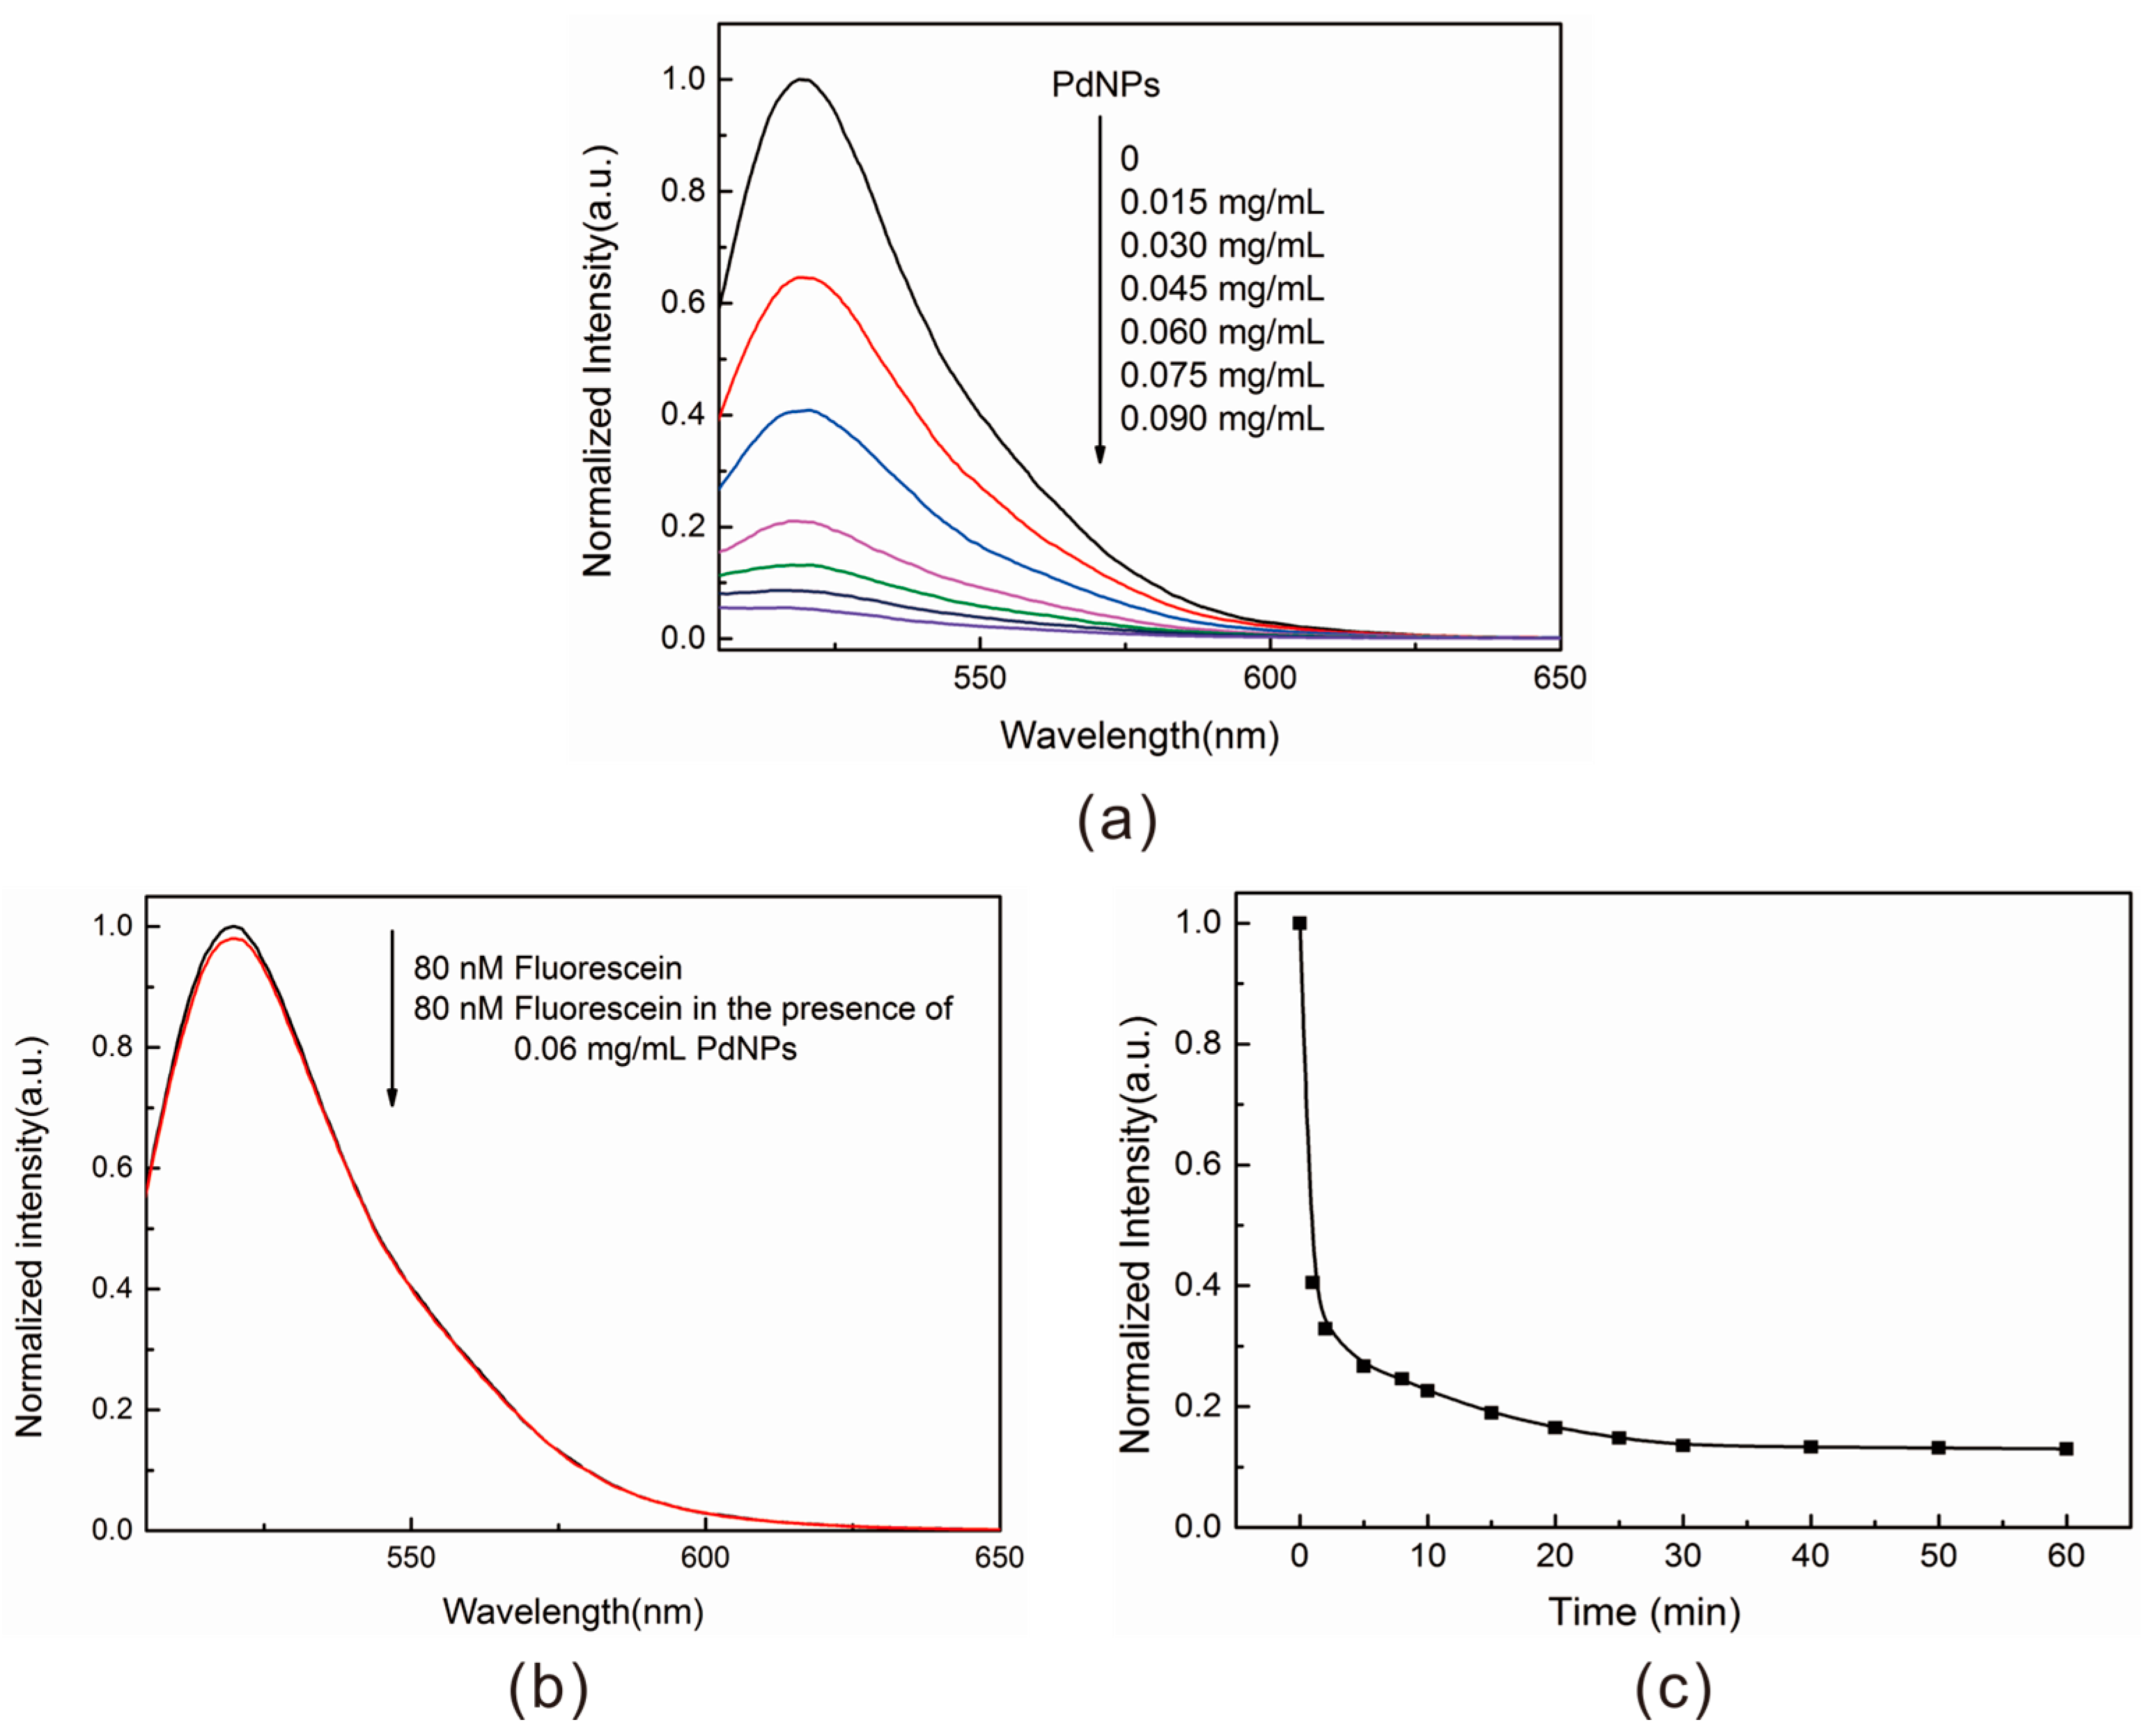
2.2. Properties Characterization of the Energy Acceptor

As the 5′-FAM-labeled AFM1 aptamer was negatively charged, sodium citrate-modified PdNPs with negative charge were used in this biosensor to avoid the side effect caused by electrostatic attraction which would also bring FAM close to PdNPs. Firstly, 12 nm Pd seeds (Figure 1b) whose light absorption was centered in the ultraviolet region and was very weak in the visible range (Figure 1a) were synthesized using a sodium ascorbate reduction method. Then, larger PdNPs with an average diameter of 33 nm (Figure 1d) were synthesized on the basis of the 12 nm Pd seeds according to a seed-mediated growth method. The UV-Vis absorption spectrum of the 33 nm PdNPs in Figure 1c clearly showed that it exhibited strong absorption in nearly the whole UV-Vis spectral range, which overlaps well with the emission spectrum of FAM, which was essential for FRET occurrence between FAM and PdNPs.

2.3. Construction of the AFM1 Aptasensor

To investigate the energy transfer efficiency between the FAM donor and PdNPs acceptor pair, an increasing concentration of 33 nm PdNPs were added into a fixed amount of 5′-FAM-labeled AFM1 aptamer (80 nM). After incubation in HEPES buffer (20 mM, pH = 7.0) containing 5 mM KCl and 5 mM MgCl2 for a short while, a PdNPs concentration-dependent fluorescence quenching phenomenon of 5′-FAM-labeled AFM1 aptamer was observed with the maximum quenching efficiency reaching 95%, as indicated in Figure 2a. In order to investigate the non-specific fluorescence quenching caused by PdNPs towards fluorescein dye, fluorescein dye at a final concentration of 80 nM was mixed with PdNPs (0.060 mg/mL) in HEPES buffer for 1 h and then the fluorescence intensity of fluorescein was measured. From Figure 2b it clearly indicated that the non-specific fluorescence quenching caused by PdNPs towards fluorescein could be eliminated. Therefore, the effective fluorescence quenching of FAM caused by PdNPs was ascribed to the strong coordination effect between nitrogen functional groups of the AFM1 aptamer and PdNPs, which brought FAM close to PdNPs resulting the occurrence of FRET. The time dependence of fluorescence quenching efficiency indicated in Figure 2c suggested that it only took 30 min to reach the quenching equilibrium. In the following fluorescence recovery experiments, In order to ensure reaching the quenching equilibrium and obtain stable fluorescence signal, 1 h incubation time was chosen for the fluorescence quenching experiment.

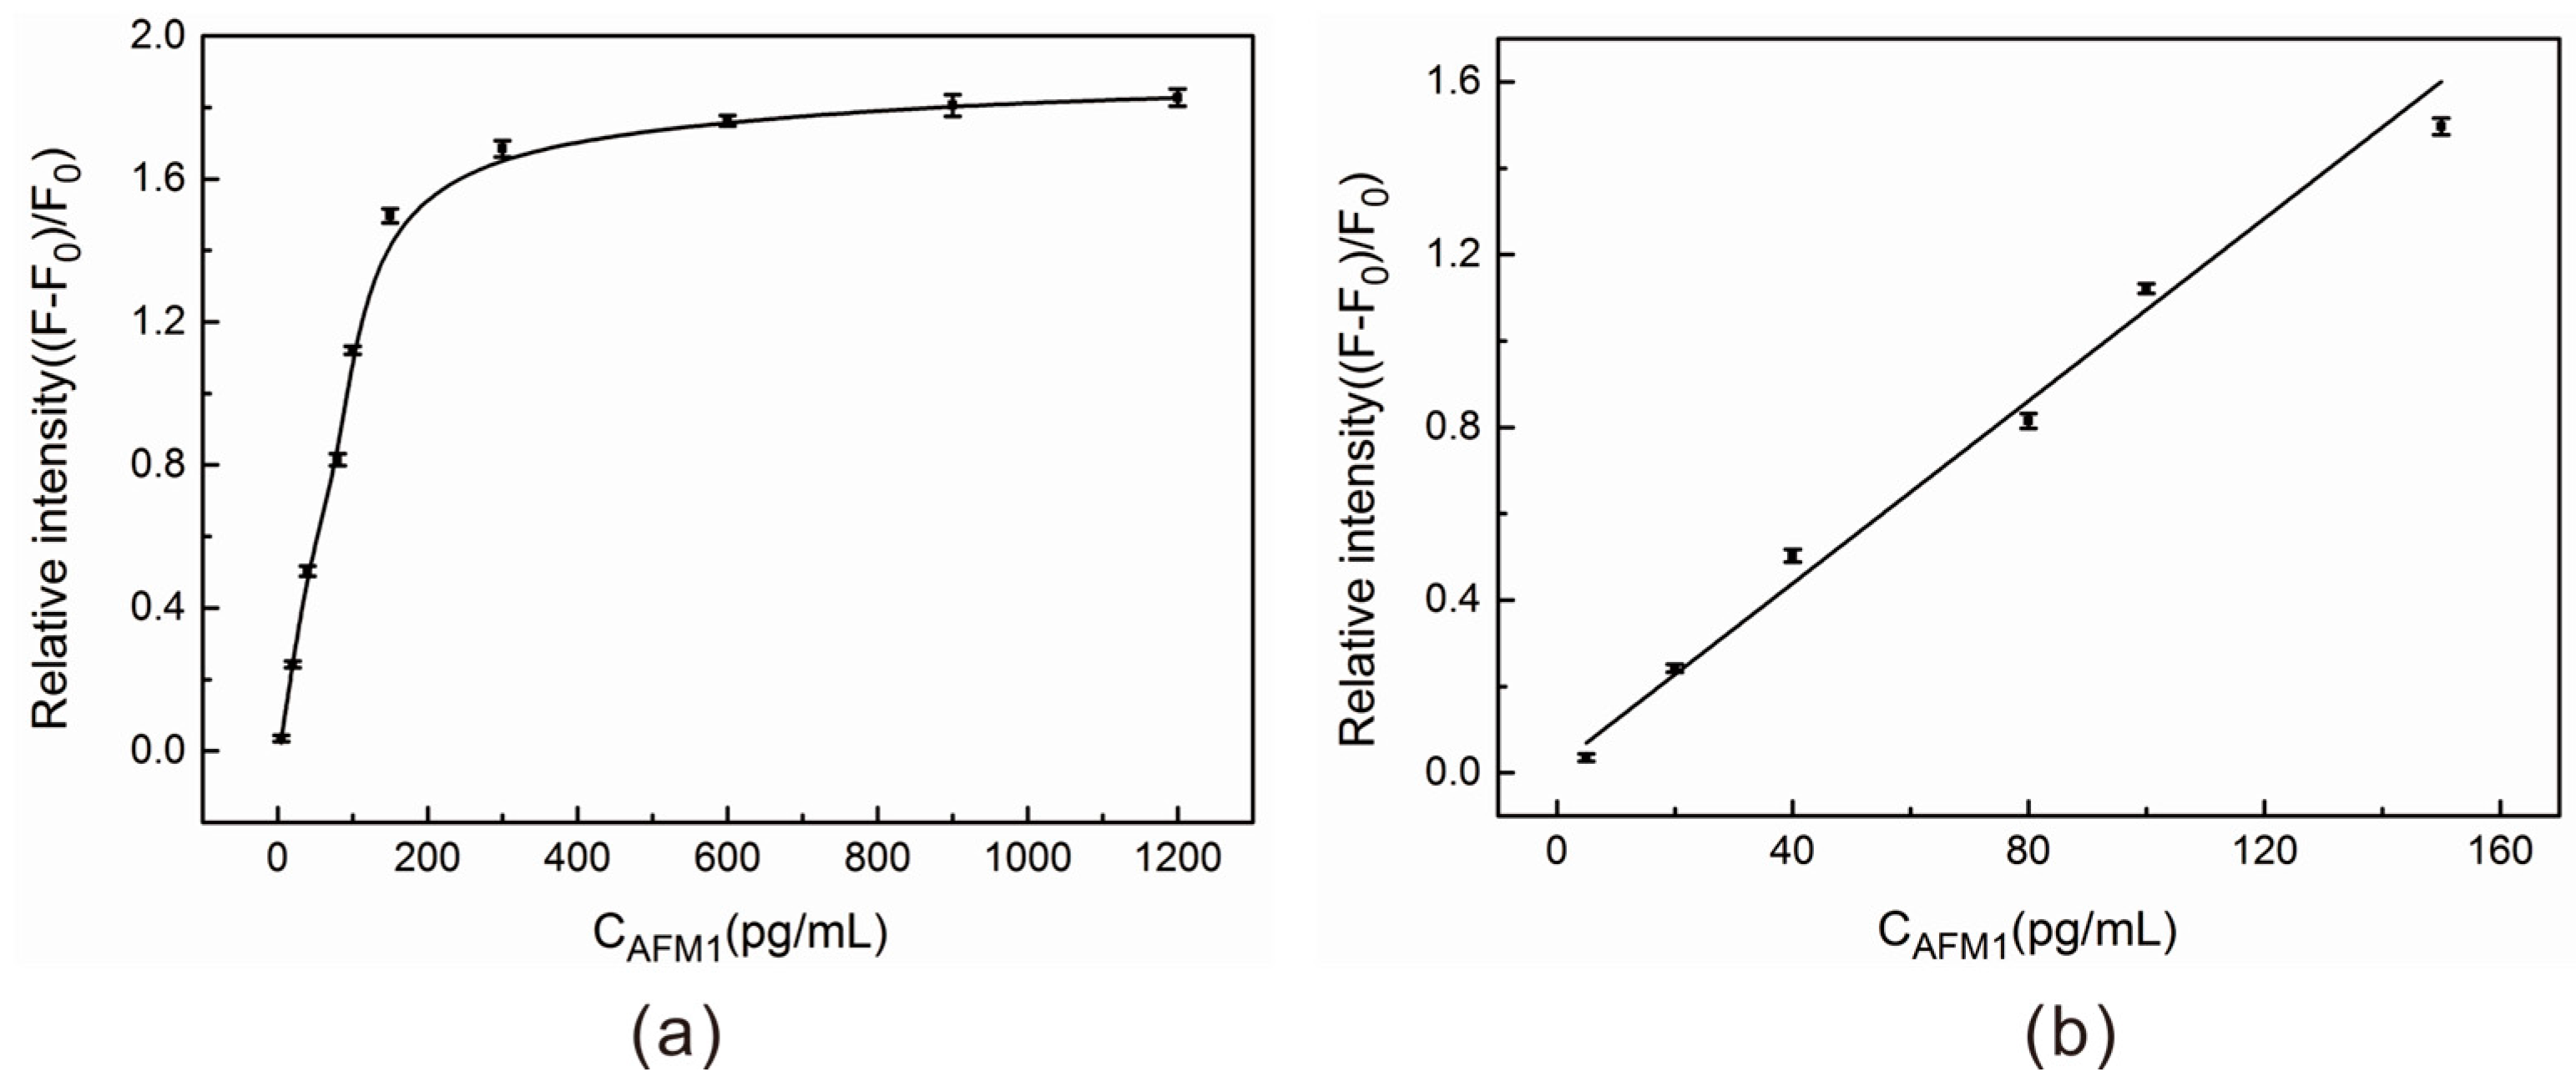
2.4. AFM1 Detection in Aqueous Buffer Solution

As illustrated in Scheme 1, after AFM1 was introduced into the 5′-FAM-AFM1 aptamer-PdNPs FRET system in the HEPES buffer, the AFM1 aptamer preferentially bound to AFM1 accompanied by its conformational change, which greatly weakened the coordination effect between the AFM1 aptamer and PdNPs. Therefore, FAM was separated from PdNPs and the FRET process was inhibited. Meanwhile, the fluorescence of FAM was restored and the degree of fluorescence recovery was in an AFM1 concentration-dependent manner, as indicated in Figure 3a. A linear relationship between the fluorescence recovery of FAM and the concentration of AFM1 in the range from 5 pg/mL to 150 pg/mL was obtained in the HEPES buffer, with the detection limit of 1.5 pg/mL (calculated as the concentration corresponding to three times of the standard deviation of the background signal from seven independent measurements) (Figure 3b). Compared to the previously reported structure, switching aptamer-based FRET assay for AFM1 detection with a linear detection range from 25 ng/kg to 2000 ng/kg [25], and the time-resolved fluorescent competitive immunochromatographic assay for AFM1 detection in milk with a linear dynamic range of 0.1–2.0 ng/mL [34], the sensitivity of the present sensor is significantly improved, which shows great potential to detect lower concentration of AFM1 in milk samples. The performance improvement of this FRET largely relied on the excellent fluorescence quenching ability of PdNPs towards FAM, with almost negligible non-specific fluorescence quenching. Other interfering toxins, including AFB1, OTA, ZEN, FB1 and T-2 toxin, were added individually into the FAM-AFM1 aptamer-PdNPs FRET system in the place of AFM1 under the same experimental procedures to examine the specificity of this FRET biosensor for AFM1. It can be seen from Figure 4 that the interference toxins all cause negligible fluorescence variation of FAM compared to AFM1, which firmly indicated the excellent specificity of this developed FRET biosensor towards AFM1 as a result of the high binding affinity between AFM1 aptamer and AFM1.

2.5. AFM1 Detection in Milk Samples

In order to ensure consumption safety and human health, it is very important to monitor the concentration of AFM1 in milk. In this paper, AFM1 detection was also realized in 100-fold diluted milk sample with HEPES buffer under the same experimental procedures as that in the aqueous buffer solution. It can be seen from Figure 5a that the fluorescence of FAM was restored in a AFM1 concentration-dependent manner. And the degree of fluorescence restoration was linear related to the concentration of AFM1 in the range from 6 pg/mL to 150 pg/mL, with a detection limit of 1.8 pg/mL (calculated as the concentration corresponding to three times of the standard deviation of the background signal from seven independent measurements) (Figure 5b). The relatively narrower linear range and higher detection limit may be ascribed to the complexity of the milk sample. Standard addition experiments were conducted to examine the feasibility of this AFM1 biosensor in practical AFM1-free milk samples. The satisfactory recoveries from 92% to 106.5% in Table 1 convincingly demonstrates that this FRET biosensor based on the efficient fluorescence resonance energy transfer between FAM and PdNPs has great potential in practical application.

3. Conclusions

In summary, a highly sensitive FRET aptasensor for AFM1 detection has been constructed based on the excellent fluorescence quenching ability of PdNPs towards FAM with negligible non-specific fluorescence quenching. The application of AFM1 aptamer with high affinity and specificity towards AFM1 also contributes to the good performance of this biosensor in both aqueous buffer solution and milk samples. In consideration of its simple configuration and operation, the homogeneous FRET aptasensor can be widely used to detect a variety of food contaminants, such as other biotoxins in the future.

4. Materials and Methods

4.1. Materials

Standard solutions of AFM1, AFB1, ochratoxin A (OTA), zearalenone (ZEN), fumonisin B1 (FB1) and T-2 toxin were purchased from Sigma-Aldrich (St. Louis, MO, USA). 5′-FAM-labeled AFM1 aptamer (5′-FAM-ACTGCTAGAGATTTTCCACAT-3′) was provided by Sangon Biotechnology Co., Ltd. (Shanghai, China). The other reagents were all from Sinopharm Chemical Reagent Co., Ltd. (Shanghai, China). The solvents and reagents were used as received without further purification. All aqueous solutions were prepared in ultrapure water obtained from a Milli-Q purification system (Millipore, Kankakee, IL, USA).

4.2. Instrumentation

The size and morphology of palladium seeds and larger PdNPs were characterized by a FEI Tecnai G2 F30 transmission electron microscope with an acceleration voltage of 200 kV. The UV-vis absorption measurements were conducted on a Thermo-Spectronic Unicam UV500 spectrometer (Thermo Spectronic, Waltham, MA, USA). The fluorescence spectra were recorded on a HITACHI F-4500 fluorescence spectrometer (HITACHI, Tokyo, Japan).

4.3. Synthesis of Sodium Citrate Capped Palladium Seeds

Palladium seeds were synthesized according to a reported procedure [35]. 20% freshly prepared aqueous solutions of sodium citrate (100 µL) and 1% Na2PdCl4 in water (735 µL) were both added into 47 mL ultrapure water. After the solution was heated to boiling, 0.1% hot sodium ascorbate (2.5 mL) was introduced quickly into the mixture. Boiling under reflux was continued for another 30 min. Then the solution was cooled down to room temperature naturally and filtered through a 0.22 um Millipore membrane filter.

4.4. The Synthesis of 33 nm PdNPs

The synthesis of 33 nm PdNPs was accomplished by a seed-mediated growth method reported by Lu et al. [36]. 10 mL aqueous solution of H2PdCl4 with a concentration of 1 mM was placed in a 50 mL round-bottom flask. And 3 mL of the synthesized palladium seeds were added. Then an excess amount of aqueous solution of ascorbic acid (100 mM, 1.2 mL) was introduced into the above solutions under extensive stirring. The color of the solution readily changed from pale yellow to a dark brown color, which suggested the formation of larger PdNPs. The resultant solution was stirred for another 5 min at room temperature. Next, the obtained PdNPs were centrifuged and washed with ultrapure water for three times. Finally, the products were redispersed in 3 mL of ultrapure water for further use.

4.5. Quenching Measurements

The concentration of PdNPs used in the FRET system were optimized against a fixed concentration of 5′-FAM-labeled AFM1 aptamer, that is, 80 nM. For optimization, the concentrations of PdNPs were set at 0, 0.015 mg/mL, 0.030 mg/mL, 0.045 mg/mL, 0.060 mg/mL, 0.075 mg/mL, 0.090 mg/mL. They were incubated in HEPES buffer (20 mM, pH = 7.0) containing 5 mM KCl and 5 mM MgCl2 for 1 h and then the fluorescence intensities were recorded under excitation at 480 nm and emission at 520 nm. The time-dependent fluorescence intensities were obtained by incubating a fixed concentration of 5′-FAM-labeled AFM1 aptamer (80 nM) with PdNPs in a concentration of 0.060 mg/mL from 1 min to 60 min.

4.6. AFM1 Detection in Aqueous Buffer Solution

In a typical FRET analysis process, various concentrations of AFM1 (0, 5 pg/mL, 20 pg/mL, 40 pg/mL, 80 pg/mL, 100 pg/mL, 150 pg/mL, 300 pg/mL, 600 pg/mL, 900 pg/mL, 1200 pg/mL) were first mixed with the 5′-FAM-labeled AFM1 aptamer (80 nM) in HEPES buffer, respectively, and the mixtures were all incubated at room temperature for 2 h. Afterwards PdNPs was added individually into the above mixtures with an ultimate concentration of 0.060 mg/mL, followed by incubation for another 1 h at room temperature. Finally, the fluorescence intensity of the reaction mixture was recorded under excitation at 480 nm and emission at 520 nm. To examine the specificity of the FRET aptasensor, a list of other mycotoxins including AFB1, OTA, ZEN, FB1 and T-2 toxin were added into the FAM-AFM1 aptamer-PdNPs FRET system in place of AFM1 following the same experimental procedures.

4.7. AFM1 Detection in Milk Samples

The milk samples (7% fat content) were purchased from the local market of Wuhan, China. They were first centrifuged at 5000 rpm for 10 min at 25 °C to remove the fat and the supernatant were collected respectively. For the determination of AFM1 in milk samples, the supernatant was 100-fold diluted with HEPES buffer without further processing, and the same assay procedure as in the HEPES buffer solution was followed. Standard addition method was adopted to determine the concentration of AFM1 in AFM1-free milk samples.

Acknowledgments

This work was supported by the Natural Science Foundation of Hubei Province (ZRMS2017001647) and the National Key Research and Development Program of China (2016YFE0119900).

Author Contributions

Peiwu Li and Qi Zhang conceived and designed the experiments; Hui Li and Daibin Yang performed the experiments; Hui Li, Wen Zhang and Xiaoxia Ding analyzed the data; Hui Li, Jin Mao and Jing Wu contributed reagents/materials/analysis tools; Hui Li wrote the paper.

Conflicts of Interest

The authors declare no conflict of interest.

References

  1. Torres, A.M.; Barros, G.G.; Palacios, S.A.; Chulze, S.N.; Battilani, P. Review on pre- and post-harvest management of peanuts to minimize aflatoxin contamination. Food Res. Int. 2014, 62, 11–19. [Google Scholar] [CrossRef]
  2. Bakirci, I. A study on the occurrence of aflatoxin M1 in milk and milk products produced in Van province of Turkey. Food Control 2001, 12, 47–51. [Google Scholar] [CrossRef]
  3. Richard, J.L. Some major mycotoxins and their mycotoxicoses-an overview. Int. J. Food Microbiol. 2007, 119, 3–10. [Google Scholar] [CrossRef] [PubMed]
  4. Kanungo, L.; Pal, S.; Bhand, S. Miniaturised hybrid immunoassay for high sensitivity analysis of aflatoxin M1 in milk. Biosens. Bioelectron. 2011, 26, 2601–2606. [Google Scholar] [CrossRef] [PubMed]
  5. International Agency for Research on Cancer. Monograph on the Evaluation of Carcinogenic Risks in Humans: Some Traditional Herbal Medicines, Some Mycotoxins; IARC: Lyon, France, 2002; pp. 171–274. [Google Scholar]
  6. Iha, M.H.; Barbosa, C.B.; Okada, I.A.; Trucksess, M.W. Aflatoxin M1 in milk and distribution and stability of aflatoxin M1 during production and storage of yoghurt and cheese. Food Control 2013, 29, 1–6. [Google Scholar] [CrossRef]
  7. Badea, M.; Micheli, L.; Messia, M.C.; Candigliota, T.; Marconi, E.; Mottram, T.; Velasco-Garcia, M.; Moscone, D.; Palleschi, G. Aflatoxin M1 determination in raw milk using a flow-injection immunoassay system. Anal. Chim. Acta 2004, 520, 141–148. [Google Scholar] [CrossRef] [Green Version]
  8. European Commission, Commission Regulation (EC) No 1881/2006 of 19 December 2006 setting maximum levels for certain contaminants in foodstuffs. Off. J. Eur. Union 2006, 364, 5–24.
  9. US Food and Drug Administration. 400 Whole Milk, Low Fat Milk, Skim Milk-Aflatoxin M1 (cpg 7106.210), FDA Compliance Policy Guides; FDA: Washington, DC, USA, 2005; p. 219.
  10. MoH (Ministry of Health) P.R. China. Maximum Residue Level of Mycotoxin in Food-National Regulations for Food Safety; National Standard No. 2761-2011; Ministry of Health: Beijing, China, 2011.
  11. Lin, L.M.; Zhang, J.; Wang, P.; Wang, Y.S.; Chen, J.P. Thin-layer chromatography of mycotoxins and comparison with other chromatographic methods. J. Chromatogr. A 1998, 815, 3–20. [Google Scholar] [CrossRef]
  12. Filazi, A.; Ince, S.; Temamogullari, F. Survey of the occurrence of aflatoxin M1 in cheeses produced by dairy ewe’s milk in Urfa city, Turkey. Ankara Üniv. Vet. Fak. Derg. 2010, 57, 197–199. [Google Scholar] [CrossRef]
  13. Anfossi, L.; Calderara, M.; Baggiani, C.; Giovannoli, C.; Arletti, E.; Giraudi, G. Development and application of solvent-free extraction for the detection of aflatoxin M1 in dairy products by enzyme immunoassay. J. Agric. Food Chem. 2008, 56, 1852–1857. [Google Scholar] [CrossRef] [PubMed]
  14. Chadseesuwan, U.; Sangdokmai, A.; Pimpitak, U.; Puthong, S.; Palaga, T.; Komolpis, K. Production of a monoclonal antibody against aflatoxin M1 and its application for detection of aflatoxin M1 in fortified milk. J. Food Drug Anal. 2016, 24, 780–787. [Google Scholar] [CrossRef] [PubMed]
  15. Shuib, N.S.; Makahleh, A.; Salhimi, S.M.; Saad, B. Determination of aflatoxin M1 in milk and dairy products using high performance liquid chromatography-fluorescence with post column photochemical derivatization. J. Chromatogr. A 2017, 1510, 51–56. [Google Scholar] [CrossRef] [PubMed]
  16. Hashemi, M.; Taherimaslak, Z. Determination of aflatoxin M-1 in liquid milk using high performance liquid chromatography with fluorescence detection after magnetic solid phase extraction. RSC Adv. 2014, 4, 33497–33506. [Google Scholar] [CrossRef]
  17. Huang, S.M.; Hu, D.; Wang, Y.; Zhu, F.; Jiang, R.F.; Ouyang, G.F. Automated hollow-fiber liquid-phase microextraction coupled with liquid chromatography/tandem mass spectrometry for the analysis of alfatoxin M-1 in milk. J. Chromatogr. A 2015, 1416, 137–140. [Google Scholar] [CrossRef] [PubMed]
  18. Campone, L.; Piccinelli, A.L.; Celano, R.; Russo, M.; Rastrelli, L. Rapid analysis of aflatoxin M-1 in milk using dispersive liquid-liquid microextraction coupled with ultrahigh pressure liquid chromatography tandem mass spectrometry. Anal. Bioanal. Chem. 2013, 405, 8645–8652. [Google Scholar] [CrossRef] [PubMed]
  19. Parker, C.O.; Lanyon, Y.H.; Manning, M.; Arrigan, D.W.M.; Tothill, I.E. Electrochemical immunochip sensor for aflatoxin M1 detection. Anal. Chem. 2009, 81, 5291–5298. [Google Scholar] [CrossRef] [PubMed]
  20. Gan, N.; Zhou, J.; Xiong, P.; Hu, F.T.; Cao, Y.T.; Li, T.H.; Jiang, Q.L. An ultrasensitive electrochemiluminescent immunoassay for aflatoxin M1 in milk, based on extraction by magnetic graphene and detection by antibody-labeled CdTe quantum dots-carbon nanotubes nanocomposite. Toxins 2013, 5, 865–883. [Google Scholar] [CrossRef] [PubMed]
  21. Chen, A.L.; Yang, S.M. Replacing antibodies with aptamers in lateral flow immunoassay. Biosens. Bioelectron. 2015, 71, 230–242. [Google Scholar] [CrossRef] [PubMed]
  22. Dinçkaya, E.; Kınık, Ö.; Sezgintürk, M.K.; Altuğ, Ҫ.; Akkoca, A. Development of an impedimetric aflatoxin M1 biosensor based on a DNA probe and gold nanoparticles. Biosens. Bioelectron. 2011, 26, 3806–3811. [Google Scholar] [CrossRef]
  23. Nguyen, B.H.; Tran, L.D.; Do, Q.P.; Nguyen, H.L.; Tran, N.H.; Nguyen, P.X. Label-free detection of aflatoxin M1 with electrochemical Fe3O4/polyaniline-based aptasensor. Mater. Sci. Eng. C 2013, 33, 2229–2234. [Google Scholar] [CrossRef] [PubMed]
  24. Liu, J.L.; Zhao, M.; Zhuo, Y.; Chai, Y.Q.; Yuan, R. Highly efficient intramolecular electrochemiluminescence energy transfer for ultrasensitive bioanalysis of alfatoxin M1. Chem. Eur. J. 2017, 23, 1853–1859. [Google Scholar] [CrossRef] [PubMed]
  25. Sharma, A.; Catanante, G.; Hayat, A.; Istamboulie, G.; Rejeb, I.B.; Bhand, S.; Marty, J.L. Development of structure switching aptamer assay for detection of aflatoxin M1 in milk sample. Talanta 2016, 158, 35–41. [Google Scholar] [CrossRef] [PubMed]
  26. Wegner, K.D.; Lindén, S.; Jin, Z.; Jennings, T.L.; Khoulati, R.; van Bergen en Henegouwen, P.M.P.; Hildebrandt, N. Nanobodies and nanocrystals: Highly sensitive quantum dot-based homogeneous FRET immunoassay for serum-based EGFR detection. Small 2014, 10, 734–740. [Google Scholar] [CrossRef] [PubMed]
  27. Lao, Y.H.; Chi, C.W.; Friedrich, S.M.; Peck, K.; Wang, T.H.; Leong, K.W.; Chen, L.C. Signal-on protein detection via dye translocation between aptamer and quantum dot. ACS Appl. Mater. Interfaces 2016, 8, 12048–12055. [Google Scholar] [CrossRef] [PubMed]
  28. Wang, Y.H.; Jiang, K.; Zhu, J.L.; Zhang, L.; Lin, H.W. A FRET-based carbon dot-MnO2 nanosheet architecture for glutathione sensing in human whole blood samples. Chem. Commun. 2015, 51, 12748–12751. [Google Scholar] [CrossRef] [PubMed]
  29. Arola, H.O.; Tullila, A.; Kiljunen, H.; Campbell, K.; Siitari, H.; Nevanen, T.K. Specific noncompetitive immunoassay for HT-2 mycotoxin detection. Anal. Chem. 2016, 88, 2446–2452. [Google Scholar] [CrossRef] [PubMed]
  30. Chen, G.Z.; Jin, Y.; Wang, L.; Deng, J.; Zhang, C.X. Gold nanorods-based FRET assay for ultrasensitive detection of Hg2+. Chem. Commun. 2011, 47, 12500–12502. [Google Scholar] [CrossRef] [PubMed]
  31. Maity, D.; Karthigeyan, D.; Kundu, T.K.; Govindaraju, T. FRET-based rational strategy for ratiometric detetction of Cu2+ and live cell imaging. Sensor Actuators B Chem. 2013, 176, 831–837. [Google Scholar] [CrossRef]
  32. Li, H.; Sun, D.E.; Liu, Z.H. Ultrasensitive biosensing platform based on the luminescence quenching ability of plasmonic palladium nanoparticles. Chem. Eur. J. 2015, 21, 4944–4948. [Google Scholar] [CrossRef] [PubMed]
  33. Li, H.; Shi, L.; Sun, D.E.; Li, P.W.; Liu, Z.H. Fluorescence resonance energy transfer biosensor between upconverting nanoparticles and palladium nanoparticles for ultrasensitive CEA detection. Biosens. Bioelectron. 2016, 86, 791–798. [Google Scholar] [CrossRef] [PubMed]
  34. Tang, X.Q.; Zhang, Z.W.; Li, P.W.; Zhang, Q.; Jiang, J.; Wang, D.; Lei, J.W. Sample-pretreatment-free based high sensitive determination of aflatoxin M1 in raw milk using a time-resolved fluorescent competitive immunochromatographic assay. RSC Adv. 2015, 5, 558–564. [Google Scholar] [CrossRef]
  35. Meyer, D.A.; Albrecht, R.M. Sodium ascorbate method for the synthesis of colloidal palladium particles of different sizes. Microsc. Microanal. 2003, 9, 1190–1191. [Google Scholar] [CrossRef]
  36. Lu, L.H.; Wang, H.S.; Xi, S.Q.; Zhang, H.J. Improved size control of large palladium nanoparticles by a seeding growth method. J. Mater. Chem. 2002, 12, 156–158. [Google Scholar] [CrossRef]
Scheme 1. Schematic illustration of the biosensor for aflatoxin M1 (AFM1) detection based on aptamer-bridged fluorescence resonance energy transfer (FRET) from 5-carboxyfluorescein (FAM) to palladium nanoparticles (PdNPs).
Toxins 09 00318 sch001
Figure 1. (a) Ultraviolet-visible (UV/Vis) absorption spectra of the 12 nm PdNPs; (b) transmission electron microscope (TEM) images of the 12 nm PdNPs; (c) UV/Vis absorption spectra of the 33 nm PdNPs; (d) TEM images of the 33 nm PdNPs.
Toxins 09 00318 g001
Figure 2. (a) Fluorescence quenching of 5′-FAM-labeled AFM1 aptamer after incubated with different concentrations of 33 nm PdNPs (0, 0.015 mg/mL, 0.030 mg/mL, 0.045 mg/mL, 0.060 mg/mL, 0.075 mg/mL, 0.090 mg/mL). (b) Fluorescence quenching of fluorescein in the presence of 0.060 mg/mL PdNPs (33 nm). (c) Time dependence of the fluorescence quenching degree for 80 nM 5′-FAM-labeled AFM1 aptamer caused by 0.060 mg/mL PdNPs (33 nm). All experiments were performed in HEPES buffer under excitation at 480 nm and emission at 520 nm.
Toxins 09 00318 g002
Figure 3. (a) The fluorescence recovery trend line in accordance with different concentrations of AFM1 (5, 20, 40, 80, 100, 150, 300, 600, 900, 1200 pg/mL). F0 represents the fluorescence intensity in the absence of AFM1. (b) The linear relationship between the fluorescence recovery degree (at 520 nm) and the concentration of AFM1 within the range from 5 pg/mL to 150 pg/mL, data were presented as average ± SD from three independent measurements. Experiments were conducted in the presence of 80 nM 5′-FAM-labeled AFM1 aptamer and 0.060 mg/mL PdNPs in HEPES buffer under excitation at 480 nm.
Toxins 09 00318 g003
Figure 4. Relative fluorescence intensity ((Fother mycotoxinsF0)/(FAFM1F0)) of the aptamer-bridged FRET biosensor for AFM1 detection in the presence of different mycotoxins, where F0 is the fluorescence intensity in the absence of AFM1 or other mycotoxins. Data were presented as average ±SD from three independent measurements. The concentration of mycotoxins were all 150 pg/mL. Experiments were conducted in HEPES buffer under excitation at 480 nm.
Toxins 09 00318 g004
Figure 5. (a) Fluorescence recovery of the biosensor with the introduction of different amounts of AFM1 (6, 30, 60, 90, 120, 150, 300, 600, 900, 1200 pg/mL) in 100-diluted milk sample. (b) The linear relationship between the fluorescence recovery (at 520 nm) and the concentration of AFM1 within the range of 6–150 pg/mL in diluted milk, data were presented as average ±SD from three independent measurements. All experiments were performed in the presence of 80 nM 5′-FAM-labeled AFM1 aptamer and 0.060 mg/mL PdNPs under excitation at 480 nm.
Toxins 09 00318 g005
Table 1. Determination of AFM1 in three milk samples.
Sample No.Added (pg/mL)Found (pg/mL) aRecovery (%)Relative Standard Deviation (RSD) (%) n = 3
1109.2092.03.4
27065.6493.84.8
3120127.85106.54.9
a Mean value of three determinations by the aptasensor.

