Article

Biodegradation Mechanisms of Patulin in Candida guilliermondii: An iTRAQ-Based Proteomic Analysis

1
Key Laboratory of Plant Resources, Institute of Botany, Chinese Academy of Sciences, Beijing 100093, China
2
University of Chinese Academy of Sciences, Beijing 100049, China
3
Department of Ecology and Evolution, The University of Chicago, Chicago, IL 60637, USA
*
Author to whom correspondence should be addressed.
Toxins 2017, 9(2), 48; https://doi.org/10.3390/toxins9020048
Submission received: 27 November 2016 / Revised: 15 January 2017 / Accepted: 20 January 2017 / Published: 8 February 2017

Abstract

:
Patulin, a potent mycotoxin, contaminates fruits and derived products worldwide, and is a serious health concern. Several yeast strains have shown the ability to effectively degrade patulin. However, the mechanisms of its biodegradation still remain unclear at this time. In the present study, biodegradation and involved mechanisms of patulin by an antagonistic yeast Candida guilliermondii were investigated. The results indicated that C. guilliermondii was capable of not only multiplying to a high population in medium containing patulin, but also effectively reducing patulin content in culture medium. Degradation of patulin by C. guilliermondii was dependent on the yeast cell viability, and mainly occurred inside cells. E-ascladiol was the main degradation product of patulin. An iTRAQ-based proteomic analysis revealed that the responses of C. guilliermondii to patulin were complex. A total of 30 differential proteins involved in 10 biological processes were identified, and more than two-thirds of the differential proteins were down-accumulated. Notably, a short-chain dehydrogenase (gi|190348612) was markedly induced by patulin at both the protein and mRNA levels. Our findings will provide a foundation to help enable the commercial development of an enzyme formulation for the detoxification of patulin in fruit-derived products.

1. Introduction

Contamination of food and feed by fungal secondary metabolites, known as mycotoxins, is a global health issue [1]. Patulin is one of the important mycotoxins, and is produced by several species belonging to Penicillium, Aspergillus, Paecilomyces, Byssochlamys, and Scopulariopsis [2,3]. Among them, Penicillium expansum infects a wide range of fruits and vegetables and is the main producer of patulin [4]. Recently, the gene cluster involved in patulin biosynthesis pathway has been reported in P. expansum [5,6,7]. Since patulin is known to induce immunological, neurological and gastrointestinal diseases, long-term exposure to patulin may cause serious health issues in humans because [8,9].
The acceptable level of patulin in food has been limited in many countries worldwide. The European Commission [10] has set maximum permitted levels in apple juices (50 μg/kg), solid apple products (25 μg/kg) and, above all, fruity baby foods (10 μg/kg). Various strategies have been developed for patulin removal, including physical adsorption, chemical decontamination, and electromagnetic irradiation. However, several complications still remained in the application of available physical and chemical methods for the removal of patulin, such as safety issues, possible losses in the nutritional quality, limited efficacy and high costs [11]. As an alternative strategy, microbial degradation is considered as a potentially powerful method as compared to previously used approaches [12].
Many species of bacteria and fungi have the ability to degrade mycotoxins, including aflatoxin, fumonisin, ochratoxin-A and patulin [13,14]. It has been reported that patulin could be degraded by various yeast and bacteria strains [15,16]. Interestingly, some antagonistic yeast strains were also used to detoxify patulin, in addition to preventing infection of fungal pathogens on harvested fruits. For example, Rhodosporidium kratochvilovae LS11 and Pichia caribbica could degrade a high concentration of patulin both in vitro and in P. expansum-infected apple fruits [17,18]. Furthermore, some biodegradation products by those antagonistic yeasts have also been identified. For example, the major patulin degradation product formed in vitro by R. kratochvilovae LS11 was desoxypatulinic acid (DPA), which was reported to be nontoxic to different microorganisms [19]. However, at the present time, the mechanisms of biodegradation of patulin within yeast cells are still poorly understood.
Candida guilliermondii (teleomorph Meyerozyma guilliermondii) is an ascomycetous yeast that is widely distributed in the natural environment [20]. Due to its potential for biological control and biotechnological applications, this particular yeast has been intensively studied over the past 40 years [20]. As an antagonistic yeast, C. guilliermondii exhibited good biocontrol efficacy on various postharvest diseases [21,22,23,24]. The aim of the present study was (1) to investigate the degradation effect of C. guilliermondii on patulin; (2) to determine the major biodegradation products of patulin by C. guilliermondii; and (3) to explore the possible degradation mechanisms of patulin by C. guilliermondii.

2. Results

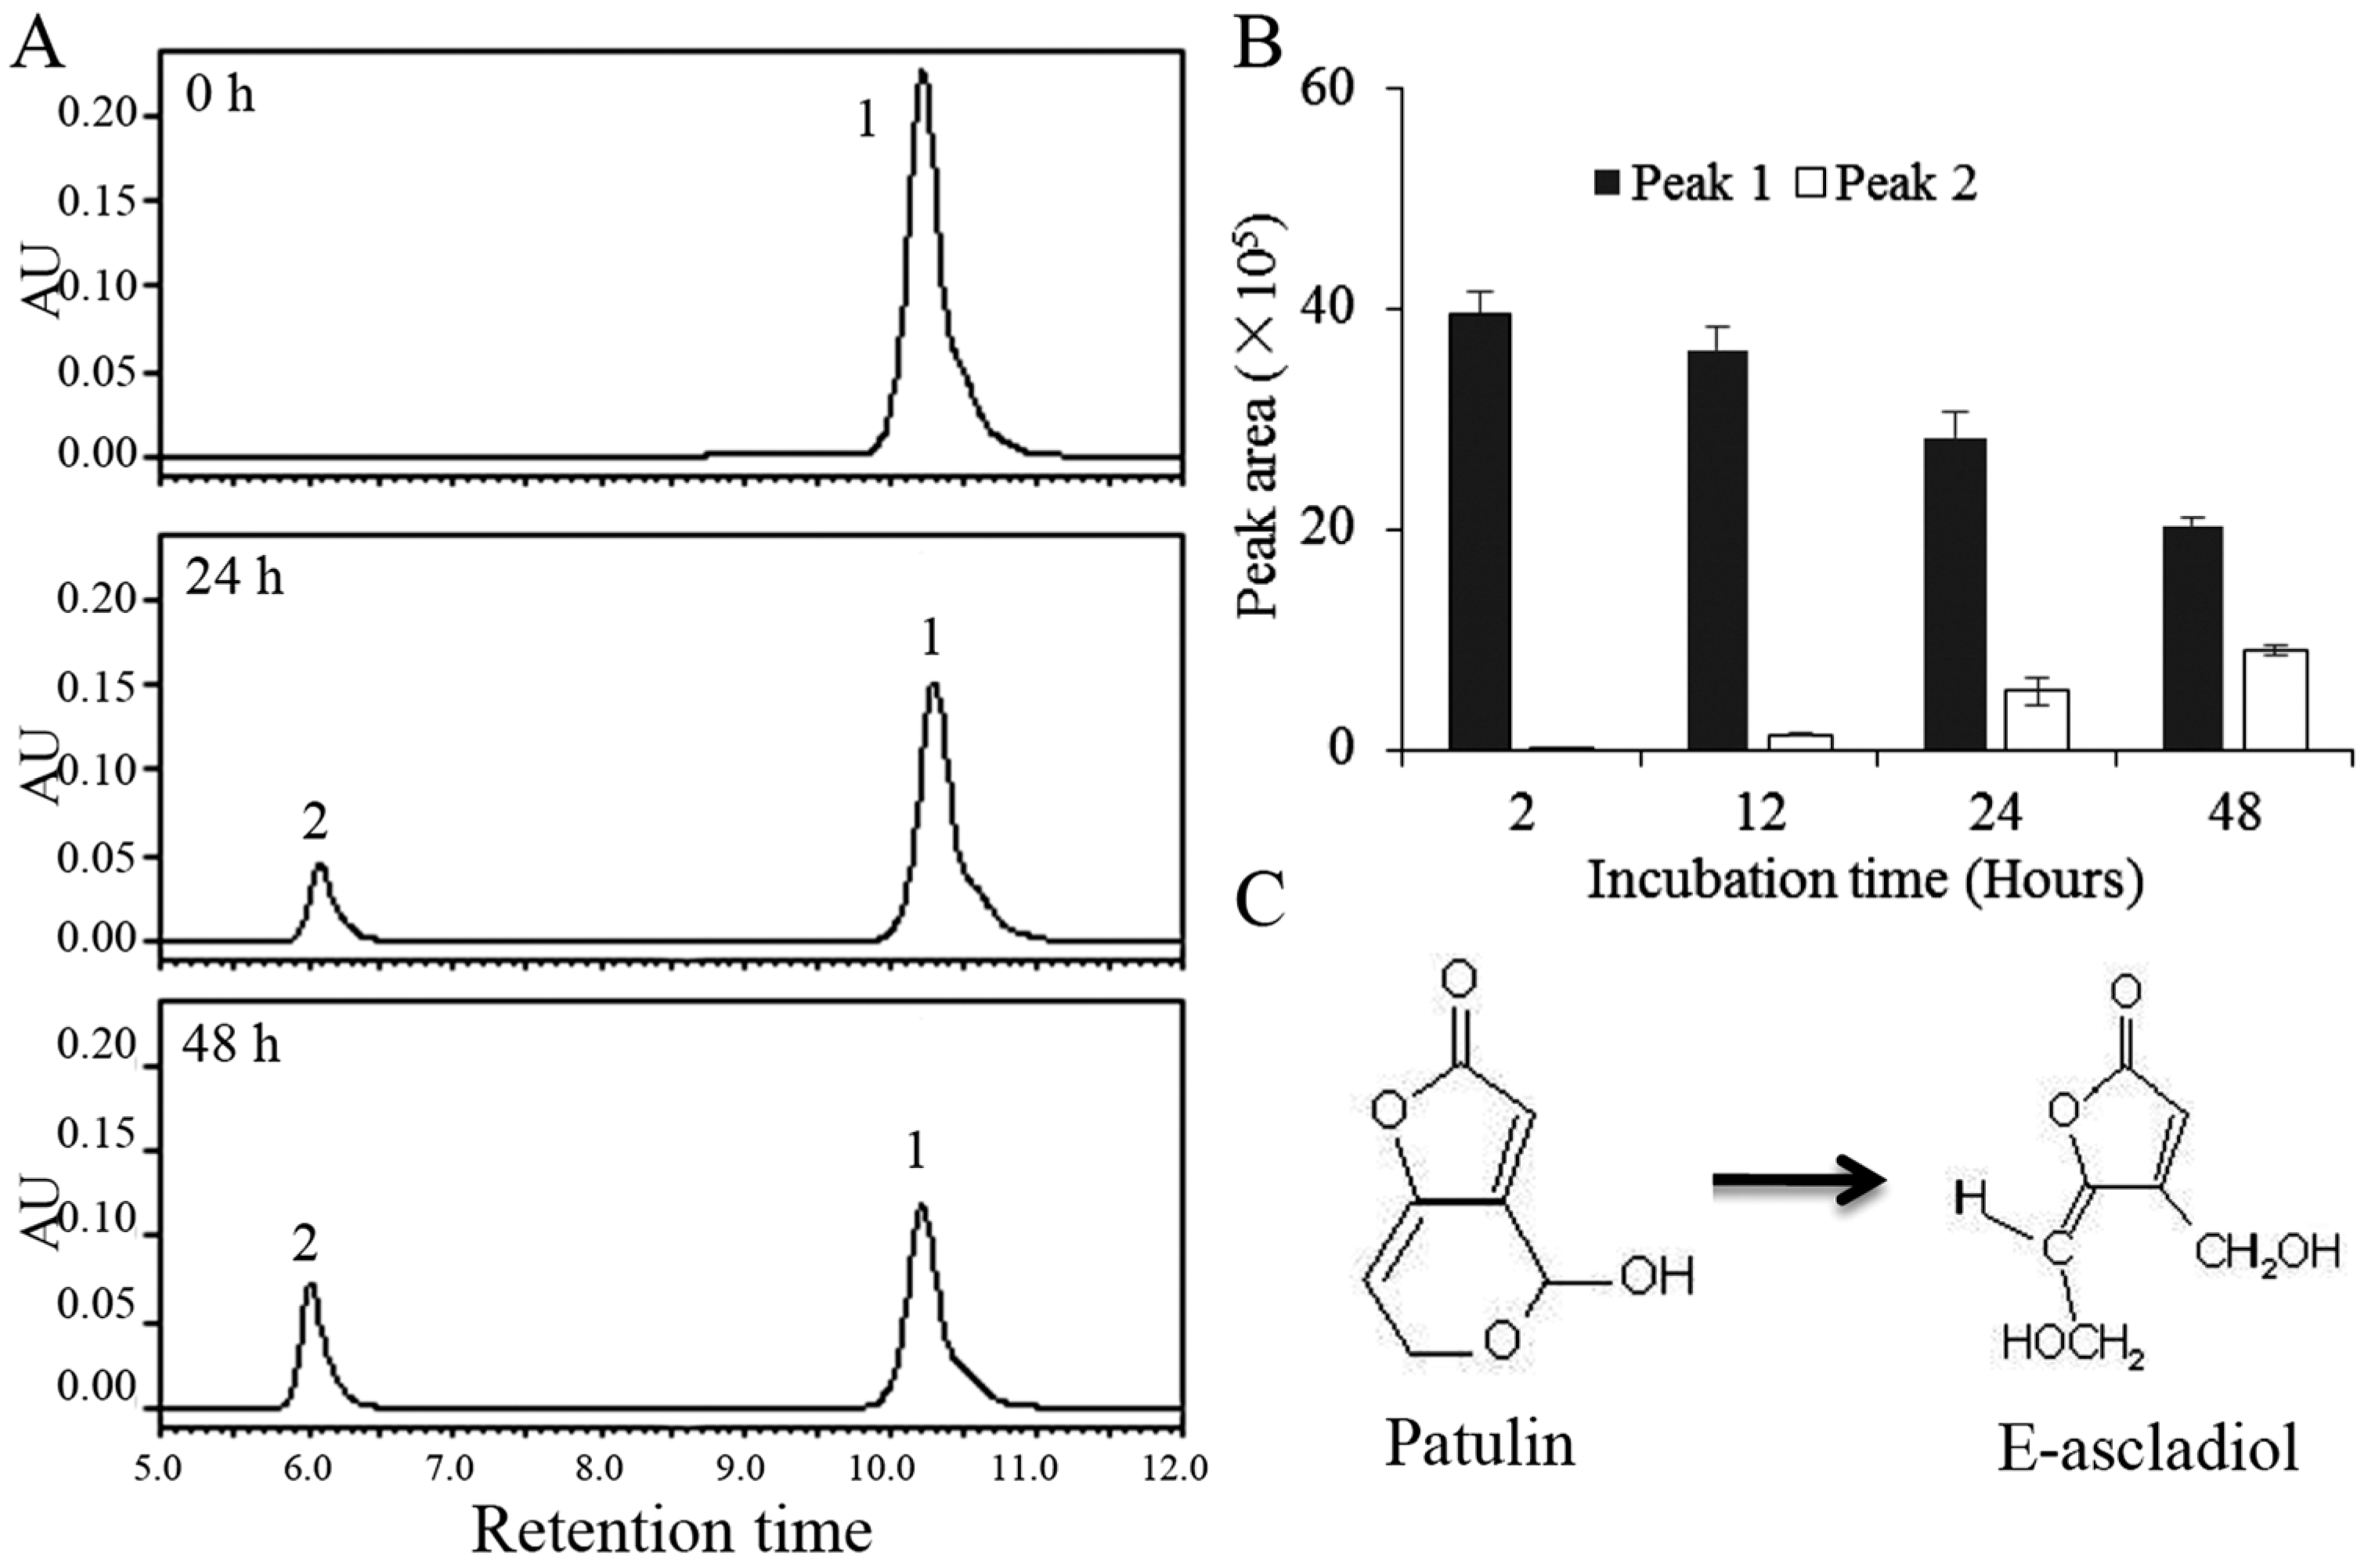
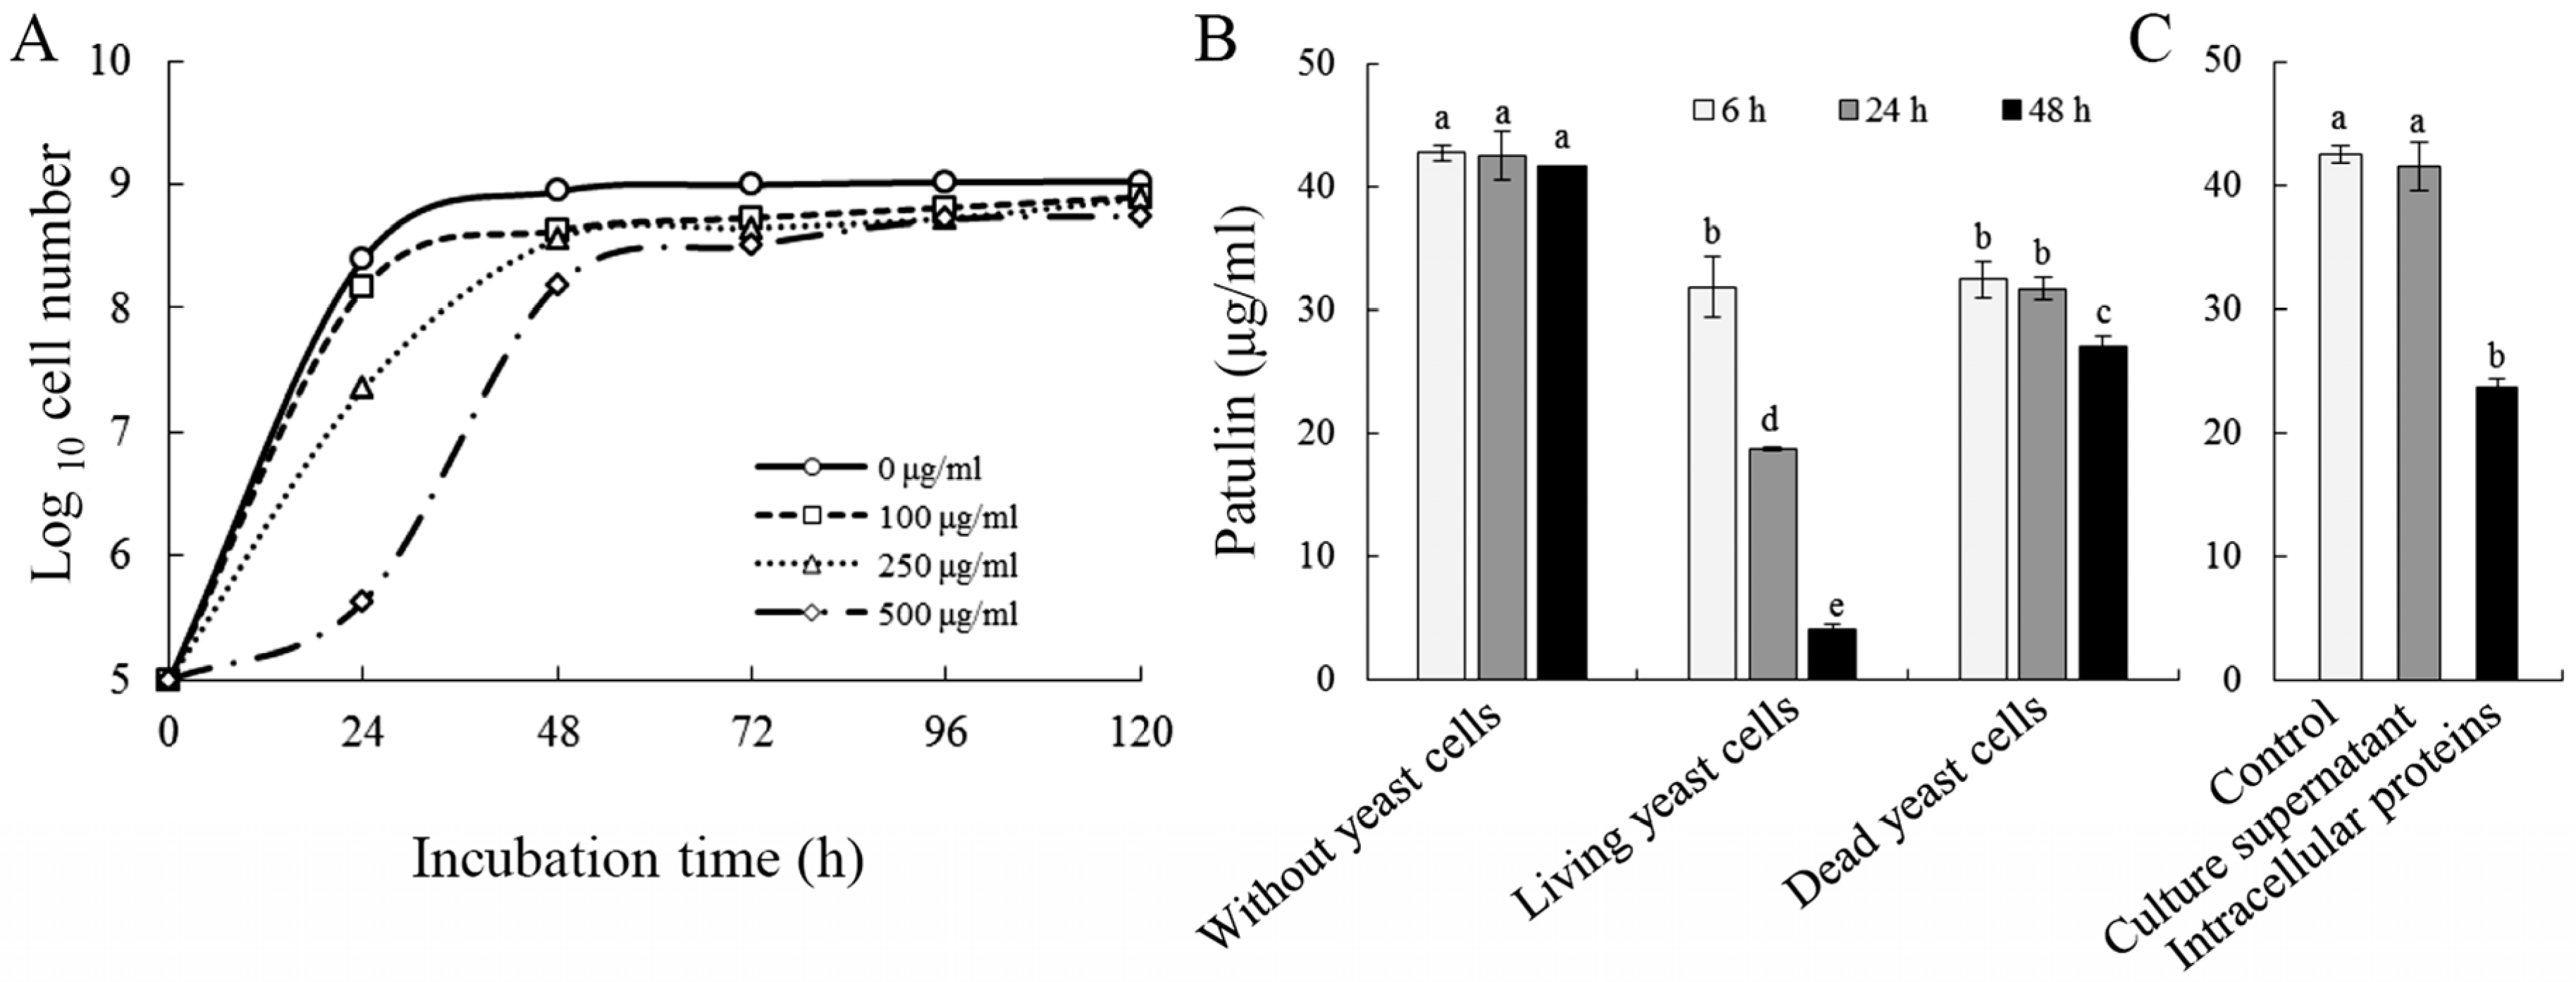
2.1. Biodegradation of Patulin by C. guilliermondii

The growth curve of C. guilliermondii in nutrient yeast dextrose broth (NYDB) medium with or without patulin was displayed in Figure 1A. At a concentration of 100 μg/mL, patulin slightly inhibited the growth of C. guilliermondii; this inhibitory effect improved as the concentration of patulin increased in the culture medium. A high concentration of patulin (500 μg/mL) markedly decreased the multiplication rate of the yeast, especially during the first 48 h of yeast culture growth. However, the population of yeast cells still reached a level of approximately 8 × 10⁸ cells/mL after an incubation period of 120 h.
The biodegradation effect of C. guilliermondii against patulin was determined by co-incubating patulin with yeast cells. During the incubation period, patulin content gradually decreased when living yeast cells were inoculated (Figure 1B). After 48 h, the concentration of patulin was reduced from 50 μg/mL to 4 μg/mL. When patulin was co-incubated with heat-killed dead cells, a slight decrease in patulin concentration was also observed. To further determine the localization of patulin biodegradation (intra- or extracelluar), patulin was co-incubated with supernatant of yeast culture or intracellular protein extract. As shown in Figure 1C, supernatant of the yeast culture did not reduce patulin concentration after 24 h of incubation. On the other hand, patulin was reduced by approximately 50% when patulin was co-incubated with intracellular protein extracts.

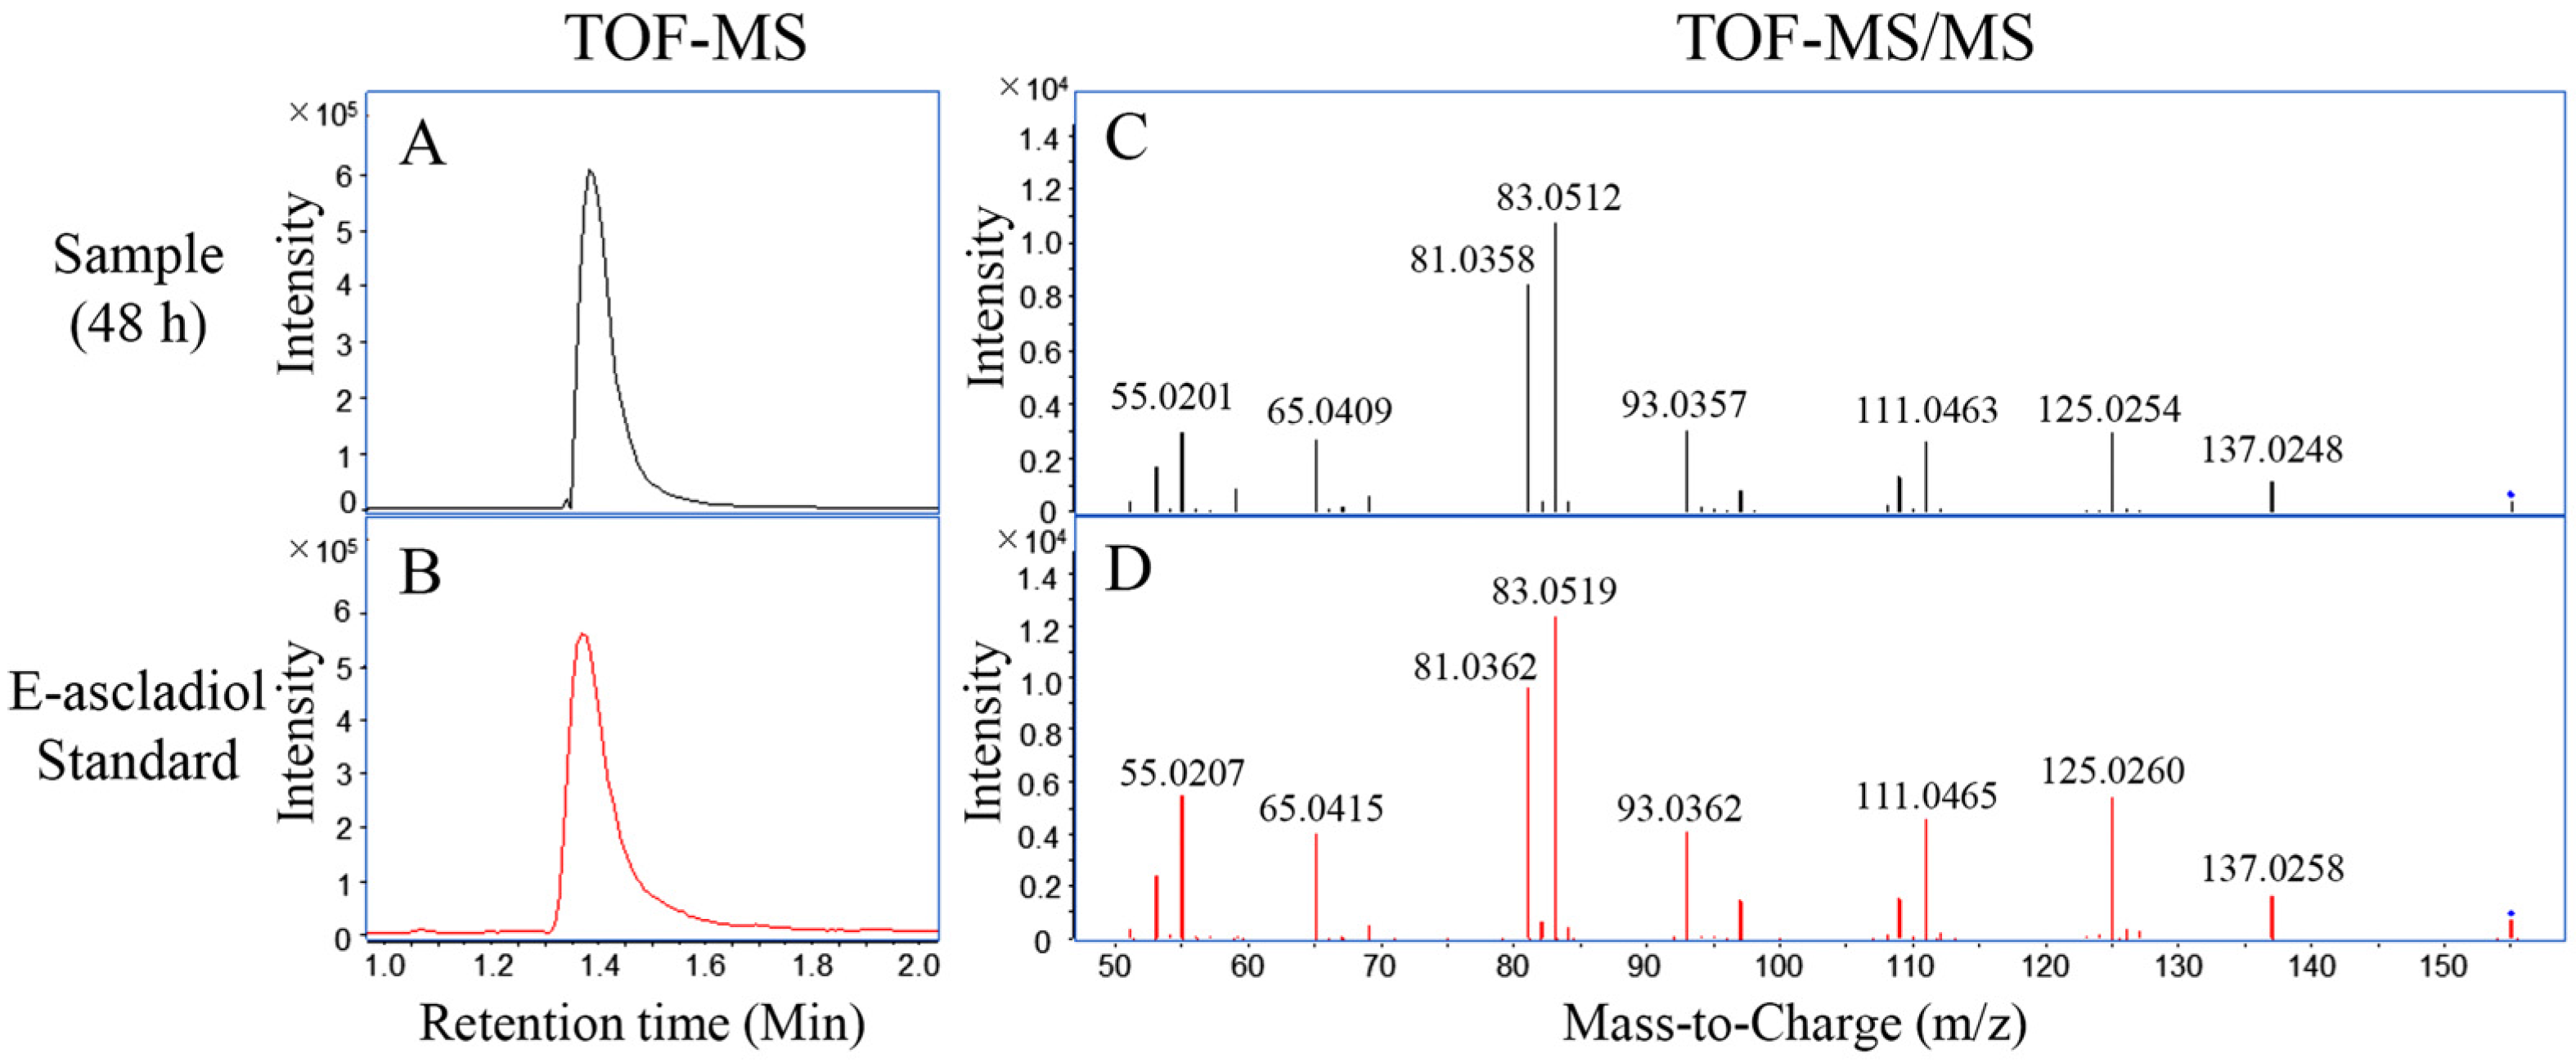
2.2. Biodegradation Products of Patulin by C. guilliermondii

A biodegradation assay was performed by co-incubating patulin with living yeast cells, and HPLC profiles were examined to identify major breakdown products of patulin by C. guilliermondii. At 0 h, only a patulin peak with retention time of 10.2 min (peak 1) was detected (Figure 2A). After 24 h of co-incubation, a new peak with retention time of 6.0 min (peak 2) appeared, along with a decrease in the peak value of patulin. The retention time of the new product was consistent with an E-ascladiol standard. As the time of incubation increased, the area of peak 1 (patulin) decreased. Conversely, the area of peak 2 exhibited a gradual increase (Figure 2B). Meanwhile, no additional peaks appeared after patulin within the retention time of 20 min (Data not shown). Collectively, these results indicated that E-ascladiol is likely the main degradation product of patulin by C. guilliermondii (Figure 2C).
In order to further confirm the major degradation product, LC-TOF-MS and MS/MS analyses were performed for the E-ascladiol standard and a degradation sample from the 48 h time point. The peaks of E-ascladiol in the sample and standard were associated with the ion m/z 155.0358 and 155.0360 in the negative ionisation mode, respectively, and were identified as the [M − H] precursor. In comparison to the theoretical value (155.0350), errors of experimental m/z were below 2 ppm, which supported the assignment of the formulae C7H8O4. Profiles in Figure 3A,B show the extracted ion chromatogram (EIC) for these experimental m/z values. Signals in both the sample and standard were detected at a retention time of 1.4 min. Moreover, their MS/MS profiles were well matched as shown in Figure 3C,D. Collectively, these results confirmed that E-ascladiol was the main degradation product of patulin by C. guilliermondii.

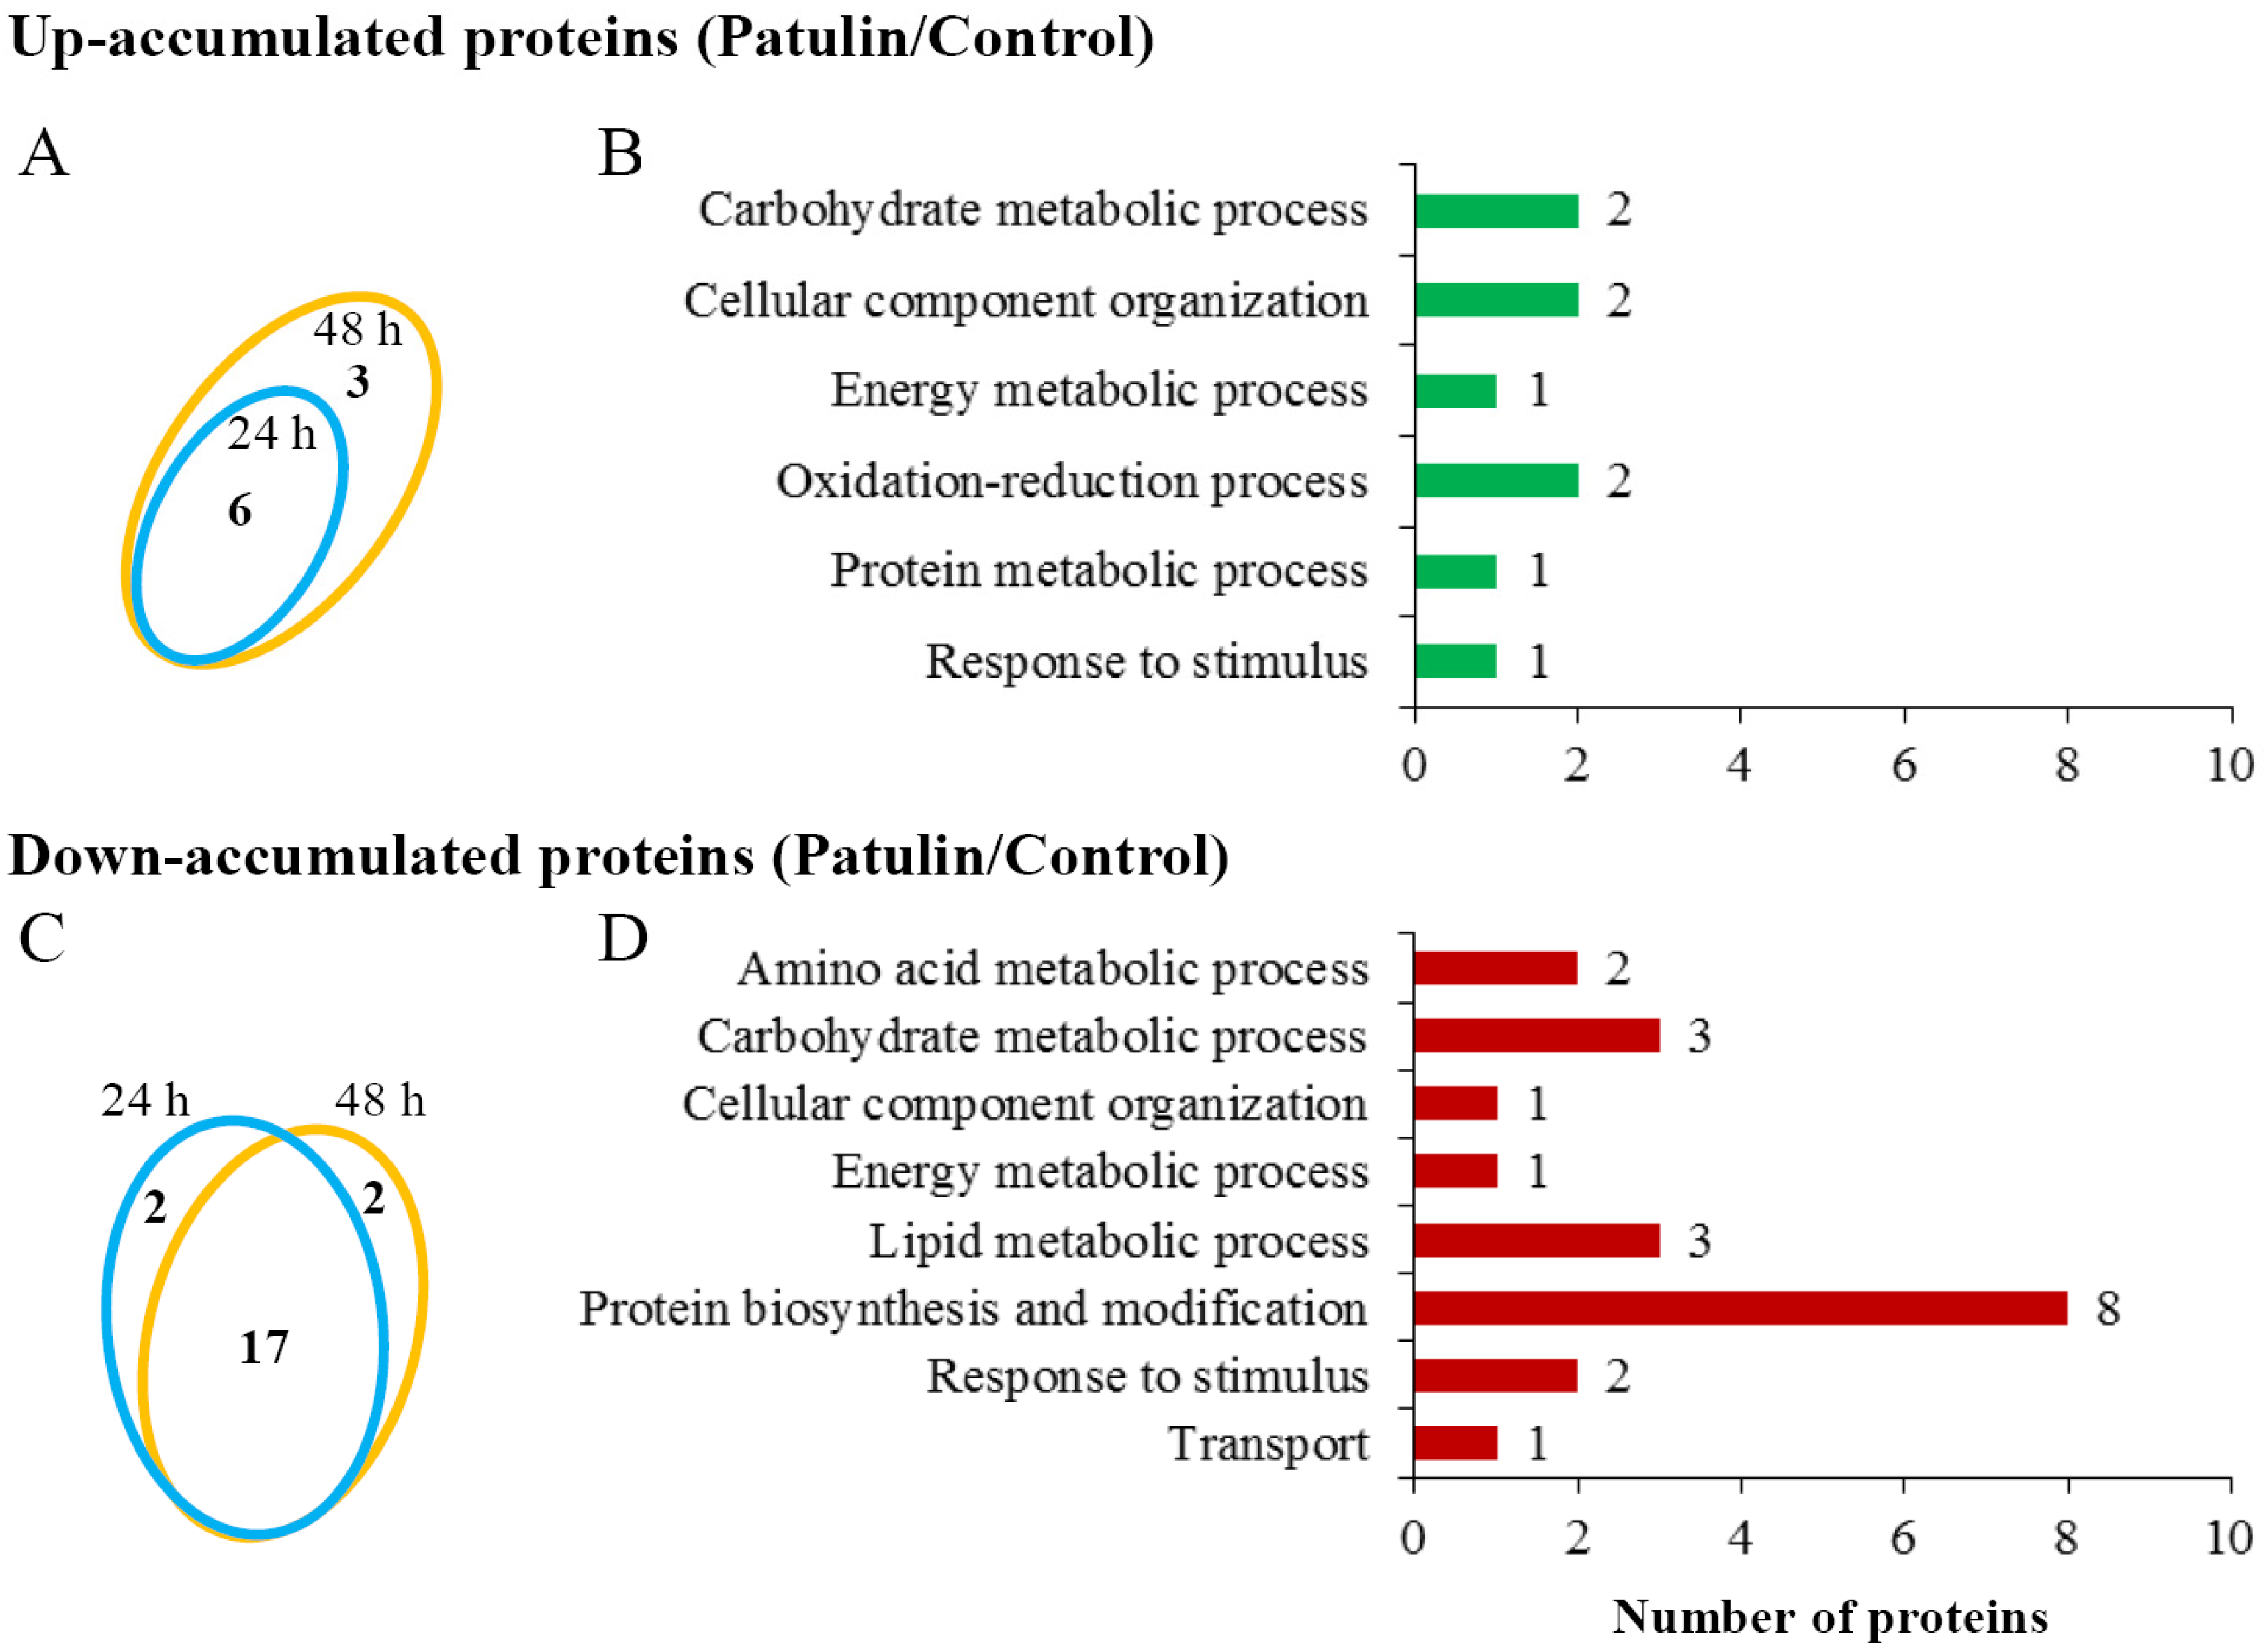
2.3. Proteomic Responses of C. guilliermondii to Patulin

An iTRAQ-based quantitative proteomic analysis was performed to investigate the proteomic responses of C. guilliermondii to patulin. In addition, this approach was also performed to identify the candidate proteins that are involved in patulin degradation. Using the C. guilliermondii protein database, a total of 928 and 1006 non-redundant proteins were identified with a global false discovery rate (FDR) below one percent in the two respective biological replicates. Among them, a total of 30 proteins (up: 9 proteins; down: 21 proteins) were differentially accumulated based upon having a fold change of >1.50 or <0.67 (patulin treatment vs. control) (Figure 4A,C).
Nine up-accumulated proteins were classified into six groups according to Blast2GO analysis (Biological process), including carbohydrate metabolic process (two proteins), cellular component organization (two proteins), energy metabolic process (one protein), oxidation-reduction process (two proteins), protein metabolic process (one protein), and response to stimulus (one protein) (Figure 4B and Table 1). Notably, the abundance of protein U7 (gi|190348612; Short-chain dehydrogenase) distinctly increased by 51 and 24 folds after co-incubation with patulin for 24 and 48 h, respectively. Down-accumulated proteins were classified into seven groups (Figure 4D and Table 2). Among the 21 down-accumulated proteins, eight proteins belong to the biological process of protein biosynthesis and modification; including components of ribosome (proteins D12–D16), elongation factor (D17), and a protein involved in biogenesis of ribosome (D18). Other proteins were involved in amino acid metabolic process, carbohydrate metabolic process, cellular component organization, energy metabolic process, lipid metabolic process, response to stimulus, and transport.

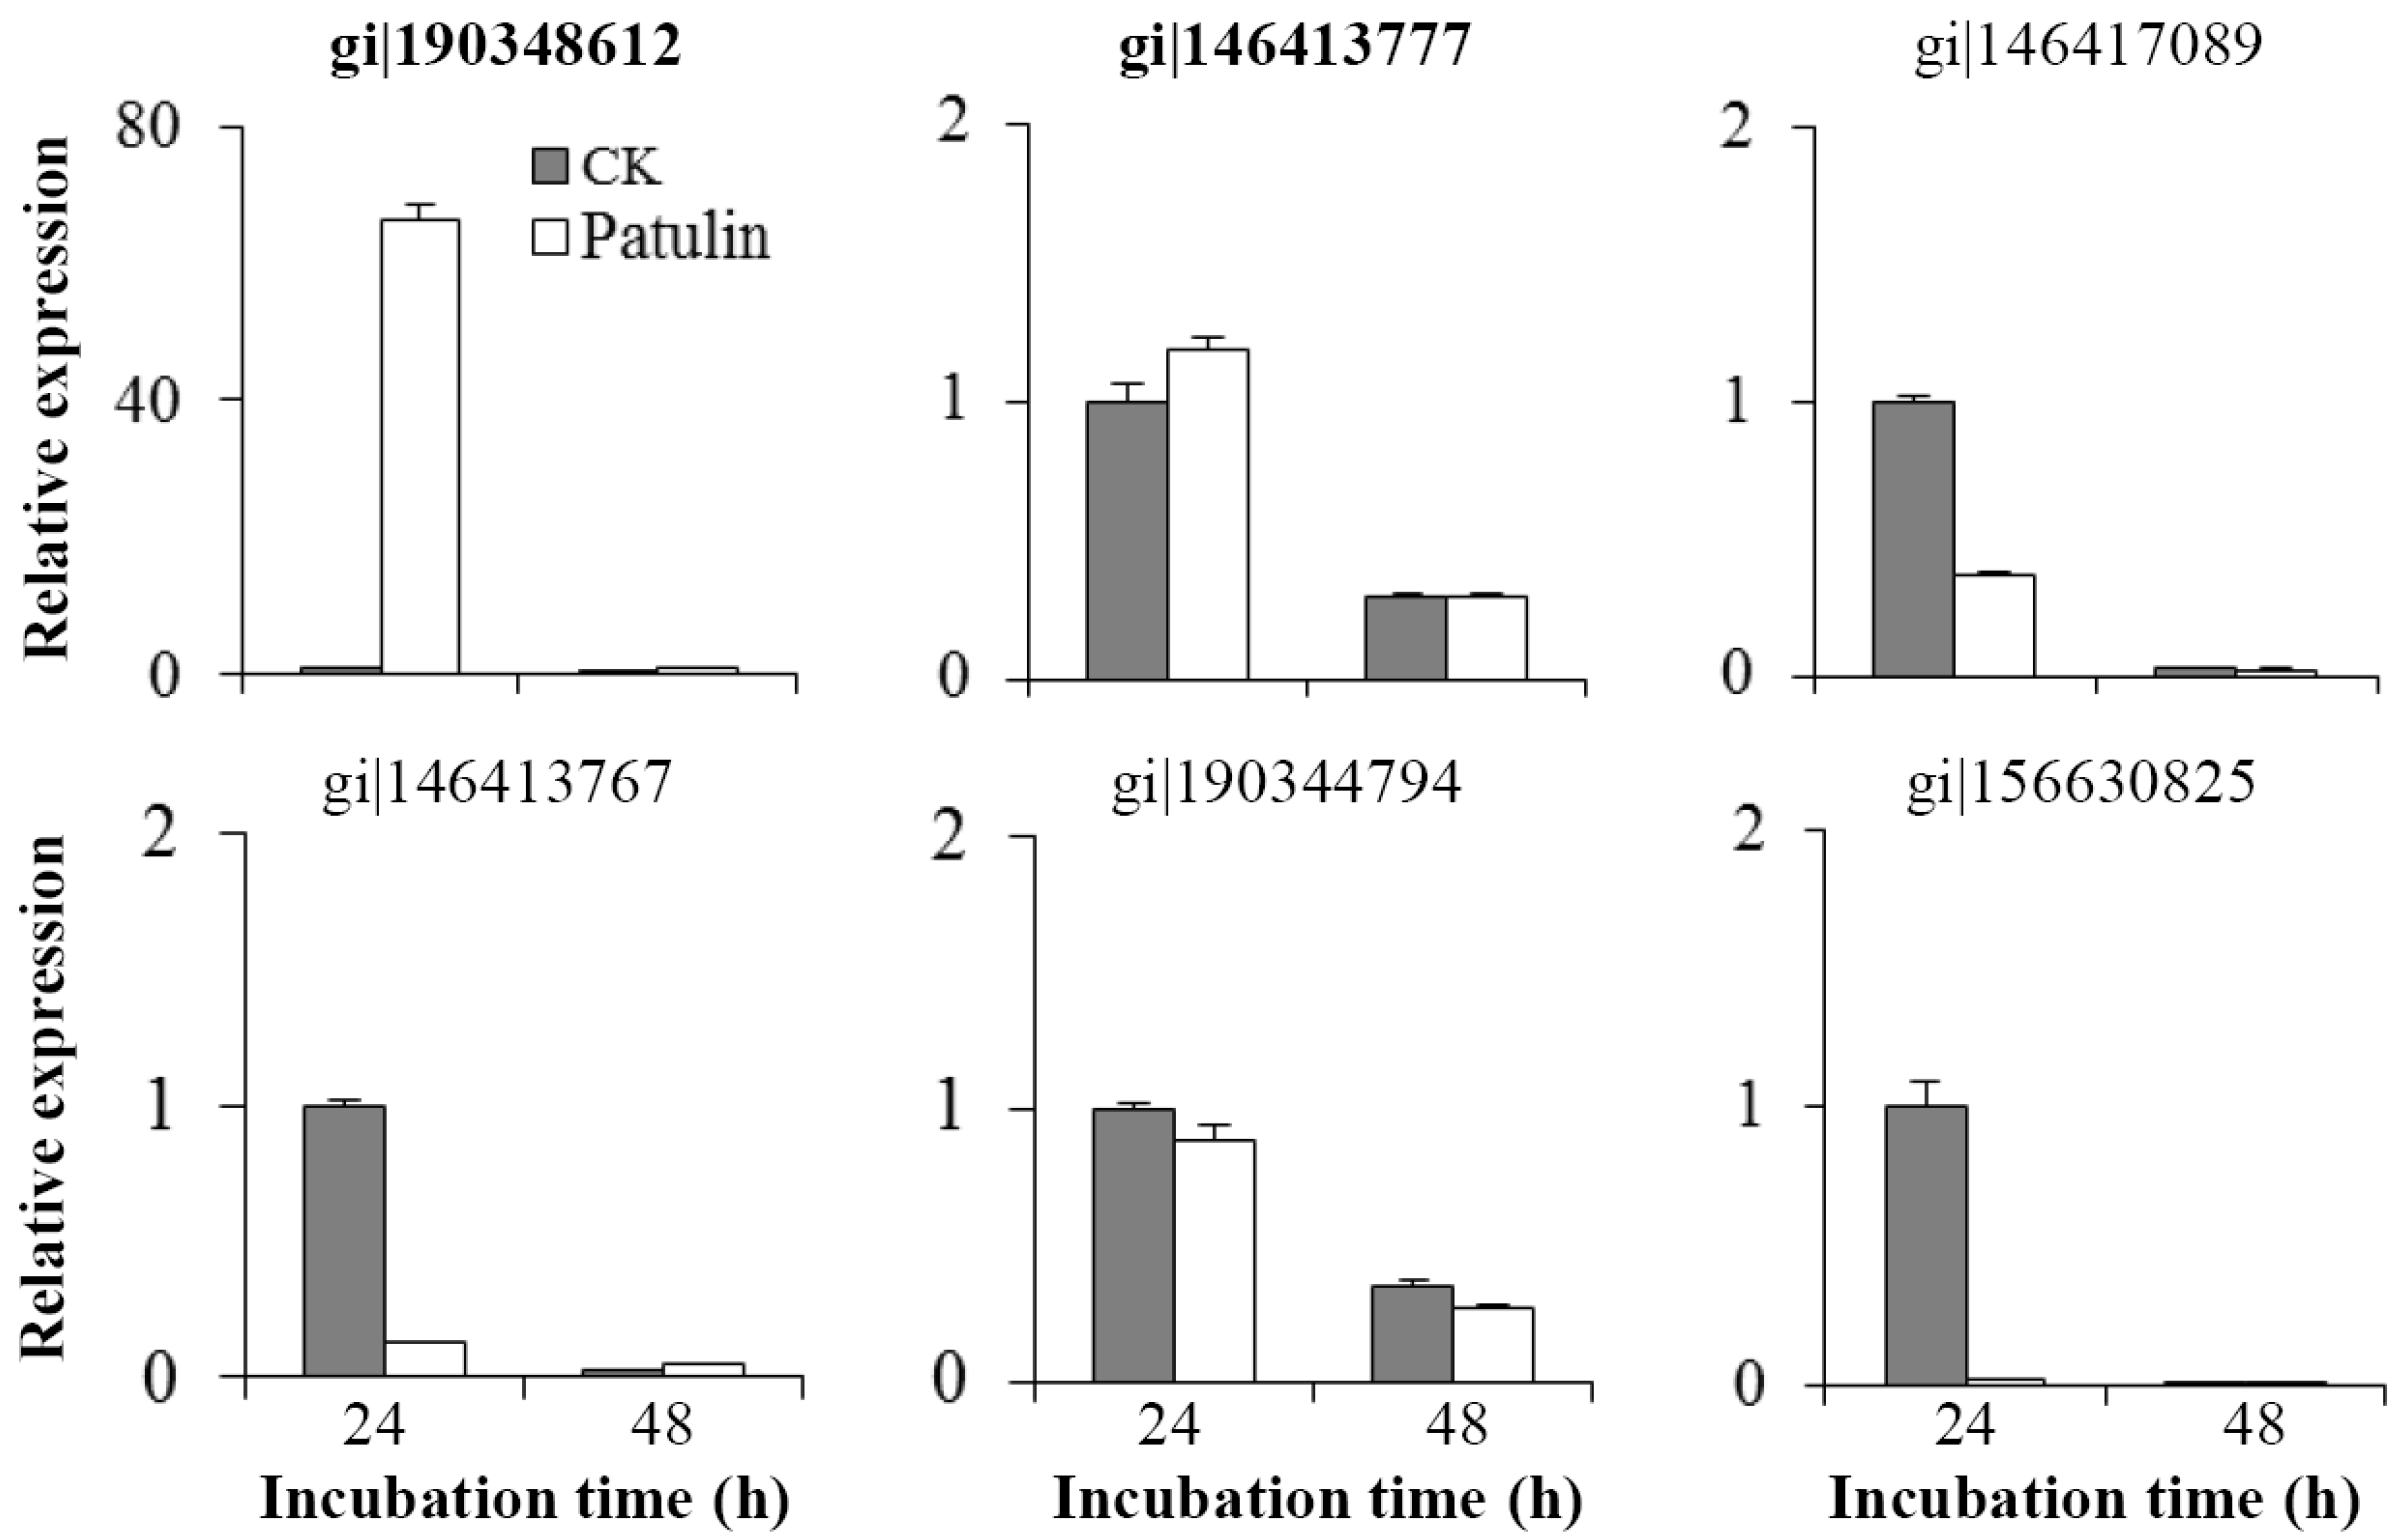
2.4. Changes in mRNA Abundances of Related Genes

The abundance of mRNA corresponding to six selected differential proteins was analyzed by RT-qPCR (Figure 5). The expression patterns of four gene encoding proteins gi|190348612, gi|146417089, gi|146413767, and gi|156630825 were in accordance with their patterns at the protein level. The relative expression of the gene encoding the short-chain dehydrogenase (gi|190348612) increased by 66 folds in patulin treated C. guilliermondii cells at 24 h. On the other hand, no significant changes were observed in mRNA abundances of two gene encoding proteins gi|146413777 and gi|190344794. These results suggested that the differential patterns of protein abundance in response to patulin are likely regulated at the transcriptional and/or post-transcriptional levels.

3. Discussion

Biodegradation is a promising strategy to remove mycotoxins in food and feed. Recently, a number of microorganisms, especially yeasts, have been reported to have the ability to remove patulin [25,26]. In the present study, an antagonistic yeast C. guilliermondii strain 2.63 was observed to multiply to a high population in medium containing patulin at concentrations ranging from 100–500 μg/mL; however, the growth rate was inhibited at the early stage (Figure 1A). These data suggested that C. guilliermondii may have the ability to resist or remove patulin. Subsequently, HPLC analysis revealed that the patulin concentration was significantly reduced when it was co-incubated with C. guilliermondii, and the living yeast cells showed a greater efficacy for removing patulin as compared to dead cells (Figure 1B). Yeast cells remove patulin through two mechanisms: adsorption and biodegradation [26]; and the latter is dependent on yeast viability. A similar decrease in the patulin concentration was observed at six hours in both living and dead yeast treatments. It is plausible that adsorption on patulin might occur at this stage in both treatments. After that, the level of patulin exhibited a rapid reduction in treatments with living yeast cells; whereas minimal change was observed in the treatment containing dead cells. These results indicated that C. guilliermondii reduced ambient patulin levels primarily through a biodegradation in living cells. Furthermore, we found that intracellular proteins, rather than cell culture supernatant, demonstrated patulin degradation activity, indicating that patulin biodegradation is an intracellular event in C. guilliermondii (Figure 1C). These data are consistent with a previous study in Rhodosporidium paludigenum [27].
Prior to the application of biodegradation technology for controlling mycotoxin contamination, it is essential to identify degradation products and to also evaluate their toxicity. At the present time, two major biodegradation products of patulin have been identified as DPA and ascladiol [25]. Specifically, R. kratochvilovae and R. paludigenum are known to convert patulin to DPA [19,27], while Saccharomyces cerevisiae and Kodameae ohmeri transform patulin into ascladiol [12,28]. Ascladiol peak appears earlier than patulin peak in the HPLC-UV/DAD chromatogram, while DPA peak was eluted closely following the patulin peak [1,19,27]. In the present study, after co-incubation of patulin and C. guilliermondii, a new peak with a retention time of 6.0 min was eluted prior to patulin (Figure 2A), and had a maximum UV absorption of approximately 268 nm (Data not shown). Both the retention time and maximum UV absorption wavelength were consistent with E-ascladiol standard. Meanwhile, HPLC analysis did not reveal any additional new peaks after the patulin peak. Thus, we assumed that E-ascladiol was the main degradation product of patulin by C. guilliermondii. E-ascladiol is immediate biosynthetic precursor of patulin and has reduced toxicity compared with patulin [15]. We identified an EIC of m/z 155.0358 from biodegradation sample of patulin by LC-TOF-MS analysis, which corresponds to the molecular formula of C7H8O4. Although E-ascladiol and DPA have the same formula of C7H8O4, information gained from the retention time of EIC and the MS/MS profile confirmed that the degradation product was E-ascladiol (Figure 3). Ianiri et al. [29] reported that the production of DPA was only found in the Pucciniomycotina species of basidiomycetes, while the ascomycete S. cerevisiae and the bacteria Gluconobacter oxydans convert patulin to ascladiols. Here, we also found that C. guilliermondii, an ascomycetous yeast, degraded patulin into E-ascladiol instead of DPA.
Elucidation of the degradation mechanisms and identification of key functional factors in yeasts will help to enable the development of methodologies for the efficient removal of patulin in food. Ianiri et al. [29] studied the transcriptomic responses of yeast Sporobolomyces sp. to patulin and found that complex mechanisms were involved. In addition, they also generated a library of T-DNA insertional mutants to search genes that are functionally involved in patulin degradation [1]. The biodegradation mechanism of patulin is an enzymatic reaction. In S. cerevisiae, proteins involved in patulin degradation were induced by the addition of patulin. In contrast, cyclohexamide, which is a potent blocker of protein synthesis in yeast, was capable of preventing the biodegradation of patulin [30]. However, proteins that possess specific activity for the degradation of patulin have not been identified and functionally characterized until now. In the present study, the responses of C. guilliermondii to patulin were investigated using an iTRAQ-based quantitative proteomic analysis. A total of 30 differential proteins that are involved in 10 different biological processes were identified, and more than two-thirds of differential proteins (21 proteins) were down-accumulated in patulin treated yeast cells (Figure 4). Patulin treatment decreased the abundance of eight proteins that are involved in the processes of protein biosynthesis and modification. Additionally, proteins involved in other biological processes, such as amino acid metabolism, carbohydrate metabolism, and energy metabolism, were down-accumulated. These results indicated that patulin exposure as a stress could affect various metabolic pathways of yeast cells, which might explain the inhibitory effect of patulin on growth of C. guilliermondii at the early growth stage.
More attention was paid to the up-accumulated proteins that may be directly related to the resistance and degradation of patulin in yeast cells. Patulin is considered to damage cells and cellular processes via multiple electrophilic reactivity which leads to the formation of adducts with nucleophiles, such as sulfhydryl (-SH) of the antioxidant peptide glutathione (GSH) [31]. In the fission yeast Schizosaccharomyces pombe, patulin treatment led to GSH depletion, accumulation of reactive oxygen species (ROS), and the activation of antioxidant systems [31]. In S. cerevisiae and Sporobolomyces sp., patulin induced the up-regulation of a series of genes that are involved in oxidation-reduction process [29,32]. In the present study, the abundance of two proteins (U6 and U7) involved in oxidation-reduction process was also markedly induced by treatment with patulin (Table 1); suggesting the potential responses against oxidative stress. Notably, comparing with the control, the abundance of protein U7 (gi|190348612, short-chain dehydrogenase) in C. guilliermondii increased by 51 and 24 folds in the patulin treatment at 24 and 48 h, respectively. Expression of the corresponding gene was also strongly induced at 24 h (Figure 5). A decrease in the abundance of short-chain dehydrogenase at 48 h might be related to the reduction of the patulin concentration. Short-chain dehydrogenases/reductases (SDRs) constitute a large family of NAD(P)(H)-dependent oxidoreductases and have critical roles in lipid, amino acid, carbohydrate, cofactor, hormone and xenobiotic metabolisms [33]. The SDR superfamily consists of at least 140 different enzymes that are active on a wide spectrum of substrates. Ianiri et al. [29] found that genes encoding short or medium chain dehydrogenases were up-regulated under patulin stress in Sporobolomyces sp. It was suggested in the aforementioned study that short or medium chain dehydrogenases were potentially able to degrade xenobiotic compounds. Our study revealed additional evidence to support the hypothesis that a short-chain dehydrogenase may be directly involved in the biodegradation of patulin. Heterogeneous expression and purification of the protein are on-going, in order to verify activity of the protein in patulin degradation. Patulin as a toxic stress also induced the accumulation of a heat shock protein 70 (U9, gi|146413777). The result agreed with a recent report by Zheng et al. [34]. Heat shock protein 70 is one of the most important and conserved molecular chaperone families which protects proteins against environmental and physiologic stress [35].

4. Conclusions

In the present study, we found that C. guilliermondii could grow in the presence of various concentrations of patulin and reduce the content of patulin in culture medium. Degradation of patulin by C. guilliermondii was dependent on the yeast cell viability and mainly occurred inside cells. E-ascladiol was the main degradation product of patulin. An iTRAQ-based proteomic analysis identified 30 differential proteins, belonging to 10 different biological processes, that are involved in the responses of C. guilliermondii to patulin. Among them, nine proteins were up-accumulated and 21 proteins were down-accumulated in patulin treated yeast cells. Notably, a short-chain dehydrogenase was significantly induced by patulin at both the protein and mRNA levels, suggesting its importance to enable the biodegradation of patulin in C. guilliermondii. The findings presented in this study will serve as a foundation for the development of novel technologies to control patulin contamination. In the future, we envision that commercially formulated patulin-degrading enzymes can be cost effectively produced and applied in fruit-derived products in an effort to remove patulin.

5. Materials and Methods

5.1. Yeast Strain

The Candida guilliermondii strain 2.63 was obtained from the Institute of Microbiology, Chinese Academy of Sciences, Beijing. The strain was preserved in glycerol and stored at −80 °C. According to the description by Fan et al. [22], the strain was inoculated and maintained in nutrient yeast dextrose broth (NYDB, 1 g of beef extract, 5 g of soybean peptone, 5 g of NaCl, 7 g of yeast extract, and 10 g of glucose within 1000 mL distilled water) medium at 28 °C prior to the experiment.

5.2. Effect of Patulin on the Growth of C. guilliermondii

The assay was performed according to the method of Dong et al. [12] with some modifications. Yeast cells of C. guilliermondii were cultured in NYDB at 28 °C on a rotary shaker at 200 rpm, and collected at the late log phase by centrifugation at 8000× g for 3 min. The harvested yeast cells were resuspended at a concentration of 1 × 10⁵ cells/mL in NYDB (pH 5.0) with patulin (Sigma-Aldrich, St. Louis, MO, USA) ranging from 0, 100, 250, and 500 μg/mL. The yeast was cultured at 28 °C and 200 rpm, and sampled every 24 h. The cell concentration of each sample was counted using a hemacytometer. There were three replicates per treatment and each experiment was repeated twice.

5.3. Biodegradation Assay of Patulin

A biodegradation assay was carried out according to the method of Dong et al. [12] and Zhu et al. [27] with some modifications. Yeast cells cultured in NYDB for 48 h were collected by centrifugation at 8000× g for 3 min. After washing three times using sterile distilled water, the yeast cells were divided into two groups. Yeast cells in group I were resuspended in 50 mM MES buffer (pH 5.0) containing 50 μg/mL patulin at a concentration of 1 × 10⁹ cells/mL. Yeast cells in group II were initially boiled for 20 min in order to kill all cells. The dead cells were then suspended in 50 mM MES buffer (pH 5.0) containing 50 μg/mL patulin at a concentration of 1 × 10⁹ cells/mL. The MES buffer (pH 5.0) containing 50 μg/mL patulin without yeast cells was used as control. Aliquots of 2 mL above mixtures were added into 10 mL tubes, cultured at 28 °C (200 rpm), and sampled at 6, 24 and 48 h. The sampled cultures were centrifuged at 8000× g for 5 min. Then, the supernatants were filtered through a 0.22 μm filter for patulin detection. There were three replicates per treatment and each experiment was repeated twice.
In order to determine the localization of patulin biodegradation, yeast cells and culture supernatant were separated after 48 h of incubation in NYDB by centrifugation at 8000× g for 10 min. Sample I: Aliquot of 2 mL culture supernatant was mixed with 0.5 mL of 250 mM MES buffer (pH 5.0) and filtered through a 0.22 μm filter. Sample II: yeast cells (1 × 10⁹ cells) were suspended with 2 mL 50 mM MES buffer (pH 5.0), and broken with glass beads (Sigma-G8772) by vortexing (10 times, 1 min for each time). Intracellular protein extracts were collected by centrifugation at 15,000× g for 30 min at 4 °C. Aliquots of 2 mL Sample I and Sample II were co-incubated with patulin at a final concentration of 50 μg/mL, respectively. The MES buffer (pH 5.0) containing 50 μg/mL patulin was used as a control. The mixtures were incubated at 28 °C (200 rpm), and sampled at 24 h for patulin detection. There were three replicates per treatment and each experiment was repeated twice.

5.4. HPLC Analysis for Patulin and Biodegradation Products

Patulin and biodegradation products were determined by high-performance liquid chromatography (HPLC) according the methods described by Zong et al. [36]. For determination of patulin degradation products, a biodegradation assay was performed according to the above methods. Yeast cells at a concentration of 1 × 10⁹ cells/mL were co-incubated with 50 μg/mL patulin in MES buffer (pH 5.0), and sampled at 2, 12, 24 and 48 h. HPLC analysis was performed by injecting 10 μL of the filtrate extract into a liquid chromatography (Waters Corp., Milford, MA, USA) equipped with an auto sampler (Waters 2498), binary HPLC pump (Waters 1525), and an UV/Visible Detector (Waters 2487). A C18 column (5 μm, 250 × 4.6 mm, Intersil ODS-3, GL Sciences, Tokyo, Japan) was used and the column oven was set at 25 °C. The mobile phase consisted of a mixture of water and acetonitrile (90:10, v/v) at a flow rate of 1 mL/min in the isocratic elution mode and the detection wavelength was 276 nm. For the identification biodegradation products, a standard of E-ascladiol (prepared in our lab) was used.

5.5. LC-TOF/MS and LC-TOF-MS/MS Analysis for Biodegradation Products

The assay was carried out according to the method of Dong et al. [12] with slight modifications. The identification and confirmation of the major degradation product of patulin was performed by an Agilent 1290 Series containing a degasser, quaternary pump, column oven and automatic sampler, and interfaced with an Agilent 6540 Q-TOF accurate mass spectrometer with an electrospray ionization source. Samples were analyzed in the negative ionisation mode. An Agilent Zorbax SB-C18 column (100 × 2.1 mm, 1.8 μm) was used and the mobile phase was a mixture of water and acetonitrile (90:10, v/v) with a flow rate of 0.3 mL/min. The mass spectrometer conditions were as follows: gas temperature, 325 °C; drying gas (nitrogen), 12 L/min; nebuliser pressure, 40 psi; capillary voltage, 3500 V; skimmer, 65 V; and octopole radiofrequency voltage, 750 V. The mass scan was over the range of m/z 50–1000. Data analysis was performed with Agilent Mass Hunter Workstation software. For MS/MS analysis, collision-induced dissociation (CID) of 10 eV was used to obtain a distinct fragmentation.

5.6. Protein Extraction

Yeast cells were co-incubated with patulin at a concentration of 50 μg/mL and collected after culture period of 24 and 48 h. Approximately 5 × 10⁸ cells were harvested by centrifugation at 10,000× g for 10 min at 4 °C. After the removal of supernatant, the cell suspension was washed with PBS, transferred to a 1.5 mL microcentrifuge tube and was re-centrifuged under the same conditions. The cell pellet was suspended in 300 μL of extraction buffer (0.5 M TEAB, 7 M Urea, 2 M Thiourea, 20 mM MgCl2, 10 mM Tris-(2-carboxyethyl) phosphine (TCEP) and 1 mM PMSF) and was broken by vortexing (10 times, 1 min for each time) in the presence of glass beads. Then, the samples were centrifuged at 15,000× g for 30 min at 4 °C to remove cell debris, and the supernatant was collected. The concentration of protein was measured using the Bradford method.

5.7. Protein Digestion and iTRAQ Labeling

The procedures of protein digestion were modified from the previously described method of Liu et al. [37]. A total of 50 μg proteins from each sample was reduced with 1 mM TCEP for 4 h at 37 °C, and alkylated with 1 mM methylmethanethiosulfonate (MMTS) for 1 h at room temperature. Samples were then digested with sequencing grade modified trypsin (Promega, Madison, WI, USA) for 16 h at 37 °C at a 1:50 trypsin-to-protein mass ratio. The resulting tryptic peptides were vacuum concentrated and re-suspended in 30 μL of iTRAQ dissolution buffer and labeled using an iTRAQ Reagents 4-plex Kit (Applied Biosystems, Framingham, MA, USA) according to the manufacturer’s instructions.
Each iTRAQ™ 4-plex reagent vial (114 to 117) was resuspended in 70 μL of ethanol and incubated at room temperature for 1 h with the respective peptide sample, as follows: 114-CK-24 h (peptides from C. guilliermondii un-treated with patulin for 24 h); 115-Patulin-24 h (C. guilliermondii treated with patulin for 24 h); 116-CK-48 h (C. guilliermondii un-treated with patulin for 48 h); 117-Patulin-48 h (from C. guilliermondii treated with patulin for 48 h). After 2 h of incubation at room temperature, the labeling reaction was quenched by adding 100 μL of ultrapure water to each vial. Samples were incubated at room temperature for 1 h. Subsequently, the peptide mixtures were pooled, desalted using a ZipTip C18 micropipette tip (EMD Millipore, Billerica, MA, USA), dried with a SpeedVac (Thermo Fisher, San Jose, CA, USA), and stored at −80 °C prior to LCMS/MS analysis. Two independent biological replicates were processed and analyzed.

5.8. NanoLC-MS/MS and Bioinformatic Analysis

Peptides were analyzed in a Triple TOF 5600+ mass spectrometer (AB SCIEX, Foster City, CA, USA), coupled with a NanoLC system (NanoLC-2D Ultra Plus, Eksigent, Dublin, CA, USA) following the method described by Liu et al. [37] with some modifications. Peptides were dissolved in 100 μL solvent A (0.1% TFA in 2% ACN). Ten μL of each sample was loaded into a C18 trap column (100 μm × 20 mm) and subsequently eluted from the trap column over the C18 analytic column (75 μm × 150 mm) at a flow rate of 300 nL/min in a 90 min linear gradient ranging from 5% to 30% mobile phase B (0.1% FA in 98% ACN). The information dependent acquisition (IDA) mode was used to acquire MS/MS data. Precursor ions were selected across the mass range of 350–1500 m/z using a 250-ms accumulation time per spectrum. Tandem mass spectra were recorded in high sensitivity mode (resolution > 15,000) with both the rolling collision energy and iTRAQ reagent collision energy adjustment on.
Protein identification and quantification were performed with ProteinPilot™ Software 4.5 (AB SCIEX, Foster City, CA, USA), and database searches were carried out using the C. guilliermondii protein database (NCBI). The utilized search parameters used were as follows: (1) Sample Type: iTRAQ 4-plex (Peptide Labeled); (2) Cysteine Alkylation: MMTS; (3) Digestion: Trypsin; (4) Instrument: Triple TOF 5600; (5) ID Focus: Biological modifications; (6) Quantitate: Yes; (7) Bias Correction: Yes; (8) Background Correction: Yes; (9) Search effort: Thorough; (10) FDR Analysis: Yes. For iTRAQ quantification, the peptide for quantification was automatically selected by the Pro Group algorithm to calculate the reporter peak area, error factor (EF) and the p-value. A reverse database search strategy was adopted to estimate the false discovery rate (FDR) for peptide identification and FDR were all set as lower than 1% at the protein level. Proteins with fold change >1.5 or <0.67 (p-value < 0.05) between any two samples were considered to be differentially expressed proteins. The final fold change was calculated as the average value obtained from two replicates.
Blast2GO Software was used for functional analysis of the identified proteins (Bioinformatics Department, CIPF, Valencia, Spain,) [38]. Proteins were categorized according to biological process within their GO annotation [39].

5.9. RNA Isolation and Reverse Transcription-Quantitative PCR (RT-qPCR)

Total RNA was isolated from 5 × 10⁸ yeast cells of each sample using TRIzol (Tiangen Biotech, Beijing, China). Genomic DNA elimination and first-strand cDNAs generation were performed using PrimeScript RT reagent Kit with gDNA Eraser (Perfect Real Time, TaKaRa Code. DRR047, Dalian, China). The RT-qPCR reactions were carried out in a total volume of 20 μL, containing 10 μL of SYBR Premix Ex TaqTM (TaKaRa Code. RR820), 0.4 μL of each primer (10 μM), 0.4 μL of ROX Reference Dye, 2 μL of cDNA, and 6.8 μL of RNase-free water. An ABI Step One Plus Real-Time PCR Systems (Applied Biosystems, Foster City, CA, USA) was used. The primers used for amplification were designed using Primer Express software 3.0 (Applied Biosystems), and the sequences were listed in Table 3. Transcript levels were normalized against the 5.8S rRNA (GenBank accession number AB568347.1) according to Li et al. [40] and relative expression levels were calculated using the 2−ΔΔCT method [41].

5.10. Statistical Analysis

Statistical analyses were performed with SPSS version 11.5 (SPSS Inc., Chicago, IL, USA) and analyzed by a one-way analysis of variance (ANOVA). Mean separations were performed by Duncan’s multiple range tests. Differences at p ≤ 0.05 were considered significant.

Acknowledgments

This work was supported by The National Key Research and Development Program of China (2016YFD0400902), National Nature Science Foundation of China (31371863, 31530057), and Youth Innovation Promotion Association CAS (2015063).

Author Contributions

B.-Q.L. and S.-P.T. conceived and designed the experiments; Y.C., H.-M.P. and X.W. performed the experiments; Y.C., H.-M.P. and B.-Q.L. analyzed the data; Y.C., B.-Q.L., M.-Y.L. and S.-P.T. wrote the paper.

Conflicts of Interest

The authors declare no conflict of interest.

References

  1. Ianiri, G.; Idnurm, A.; Wright, S.A.; Durán-Patrón, R.; Mannina, L.; Ferracane, R.; Ritieni, A.; Castoria, R. Searching for genes responsible for patulin degradation in a biocontrol yeast provides insight into the basis for resistance to this mycotoxin. Appl. Environ. Microbiol. 2013, 79, 3101–3115. [Google Scholar] [CrossRef] [PubMed]
  2. Bosso, L.; Scelza, R.; Varlese, R.; Meca, G.; Testa, A.; Rao, M.R.; Cristinzio, G. Assessing the effectiveness of Byssochlamys. nivea and Scopulariopsis. brumptii in pentachlorophenol removal and biological control of two Phytophthora. species. Fungal Biol. 2016, 120, 645–653. [Google Scholar] [CrossRef] [PubMed]
  3. Puel, O.; Galtier, P.; Oswald, I.P. Biosynthesis and toxicological effects of patulin. Toxins 2010, 2, 613–631. [Google Scholar] [CrossRef] [PubMed]
  4. Andersen, B.; Smedsgaard, J.; Frisvad, J.C. Penicillium. expansum: Consistent production of patulin, chaetoglobosins, and other secondary metabolites in culture and their natural occurrence in fruit products. J. Agric. Food Chem. 2004, 52, 2421–2428. [Google Scholar] [CrossRef] [PubMed]
  5. Tannous, J.; El Khoury, R.; Snini, S.P.; Lippi, Y.; El Khoury, A.; Atoui, A.; Lteifc, R.; Oswald, I.P.; Puel, O. Sequencing, physical organization and kinetic expression of the patulin biosynthetic gene cluster from Penicillium. expansum. Int. J. Food Microbiol. 2014, 189, 51–60. [Google Scholar] [CrossRef] [PubMed]
  6. Ballester, A.R.; Marcet-Houben, M.; Levin, E.; Sela, N.; Selma-Lazaro, C.; Carmona, L.; Wisniewski, M.; Droby, S.; González-Candelas, L.; Gabaldón, T. Genome, transcriptome, and functional analyses of Penicillium. expansum provide new insights into secondary metabolism and pathogenicity. Mol. Plant-Microbe Interact. 2015, 28, 232–248. [Google Scholar] [CrossRef] [PubMed]
  7. Li, B.; Zong, Y.; Du, Z.; Chen, Y.; Zhang, Z.; Qin, G.; Zhao, W.; Tian, S. Genomic characterization reveals insights into patulin biosynthesis and pathogenicity in Penicillium. species. Mol. Plant-Microbe Interact. 2015, 28, 635–647. [Google Scholar] [CrossRef] [PubMed]
  8. Bennett, J.W.; Klich, M. Mycotoxins. Clin. Microbiol. Rev. 2003, 16, 497–516. [Google Scholar] [CrossRef] [PubMed]
  9. Pfeiffer, E.; Gross, K.; Metzler, M. Aneuploidogenic and clastogenic potential of the mycotoxins citrinin and patulin. Carcinogenesis 1998, 19, 1313–1318. [Google Scholar] [CrossRef] [PubMed]
  10. Commission Regulation. European Commission Regulation. EC 1881/2006, setting maximum levels for certain contaminants in foodstuffs. Available online: http://ec.europa.eu/dgs/health_food-safety/index_en.htm (accessed on 24 January 2017).
  11. Kabak, B.; Dobson, A.D.W.; Var, I. Strategies to prevent mycotoxin contamination of food and animal feed: A review. Crit. Rev. Food Sci. Nutr. 2006, 46, 593–619. [Google Scholar] [CrossRef] [PubMed]
  12. Dong, X.; Jiang, W.; Li, C.; Ma, N.; Xu, Y.; Meng, X. Patulin biodegradation by marine yeast Kodameae. ohmeri. Food Addit. Contam. Part A 2015, 32, 352–360. [Google Scholar]
  13. Bata, A.; Lásztity, R. Detoxification of mycotoxin-contaminated food and feed by microorganisms. Trends Food Sci. Technol. 1999, 10, 223–228. [Google Scholar] [CrossRef]
  14. Shetty, P.H.; Jespersen, L. Saccharomyces cerevisiae and lactic acid bacteria as potential mycotoxin decontaminating agents. Trends Food Sci. Technol. 2006, 17, 48–55. [Google Scholar] [CrossRef]
  15. Moake, M.M.; Padilla-Zakour, O.I.; Worobo, R.W. Comprehensive review of patulin control methods in foods. Compr. Rev. Food Sci. Food Saf. 2005, 4, 8–21. [Google Scholar] [CrossRef]
  16. Ricelli, A.; Baruzzi, F.; Solfrizzo, M.; Morea, M.; Fanizzi, F.P. Biotransformation of patulin by Gluconobacter oxydans. Appl. Environ. Microbiol. 2007, 73, 785–792. [Google Scholar] [CrossRef] [PubMed]
  17. Castoria, R.; Morena, V.; Caputo, L.; Panfili, G.; De Curtis, F.; De Cicco, V. Effect of the biocontrol yeast Rhodotorula. glutinis strain LS11 on patulin accumulation in stored apples. Phytopathology 2005, 95, 1271–1278. [Google Scholar] [CrossRef] [PubMed]
  18. Cao, J.; Zhang, H.; Yang, Q.; Ren, R. Efficacy of Pichia. caribbica in controlling blue mold rot and patulin degradation in apples. Int. J. Food Microbiol. 2013, 162, 167–173. [Google Scholar] [CrossRef] [PubMed]
  19. Castoria, R.; Mannina, L.; Durán-Patrón, R.; Maffei, F.; Sobolev, A.P.; De Felice, D.V.; Pinedo-Rivilla, C.; Ritieni, A.; Ferracane, R.; Wright, S.A.I. Conversion of the mycotoxin patulin to the less toxic desoxypatulinic acid by the biocontrol yeast Rhodosporidium. kratochvilovae strain LS11. J. Agric. Food Chem. 2011, 59, 11571–11578. [Google Scholar] [CrossRef] [PubMed]
  20. Papon, N.; Savini, V.; Lanoue, A.; Simkin, A.J.; Crèche, J.; Giglioli-Guivarc’h, N.; Clastre, M.; Courdavault, V.; Sibirny, A.A. Candida guilliermondii: Biotechnological applications, perspectives for biological control, emerging clinical importance and recent advances in genetics. Curr. Genet. 2013, 59, 73–90. [Google Scholar] [CrossRef] [PubMed]
  21. Mcguire, R.G. Application of Candida guilliermondii in commercial citrus coatings for biocontrol of Penicillium. digitatum on grapefruits. Biol. Control. 1994, 4, 1–7. [Google Scholar] [CrossRef]
  22. Fan, Q.; Tian, S.P.; Xu, Y.; Wang, Y.; Jiang, A.L. Biological control of Rhizopus. rot of peach fruits by Candida guilliermondii. Acta Bot. Sin. 2000, 42, 1033–1038. [Google Scholar]
  23. Saligkariasa, I.D.; Gravanis, F.T.; Epton, H.A.S. Biological control of Botrytis cinerea on tomato plants by the use of epiphytic yeasts Candida guilliermondii strains 101 and US 7 and Candida oleophila strain I-182: II. A study on mode of action. Biol. Control. 2002, 25, 151–161. [Google Scholar] [CrossRef]
  24. Xu, X.; Qin, G.; Tian, S. Effect of microbial biocontrol agents on alleviating oxidative damage of peach fruit subjected to fungal pathogen. Int. J. Food Microbiol. 2008, 126, 153–158. [Google Scholar] [CrossRef] [PubMed]
  25. McCormick, S. Microbial detoxification of mycotoxins. J. Chem. Ecol. 2013, 39, 907–918. [Google Scholar] [CrossRef] [PubMed]
  26. Mahunu, G.K.; Zhang, H.; Yang, Q.; Li, C.; Zheng, X. Biological control of patulin by antagonistic yeast: A case study and possible model. Crit. Rev. Microbiol. 2015, 42, 643–655. [Google Scholar] [CrossRef] [PubMed]
  27. Zhu, R.; Feussner, K.; Wu, T.; Yan, F.; Karlovsky, P.; Zheng, X. Detoxification of mycotoxin patulin by the yeast Rhodosporidium. paludigenum. Food Chem. 2015, 179, 1–5. [Google Scholar] [CrossRef] [PubMed]
  28. Moss, M.O.; Long, M.T. Fate of patulin in the presence of the yeast Saccharomyces cerevisiae. Food Addit. Contam. 2002, 19, 387–399. [Google Scholar] [CrossRef] [PubMed]
  29. Ianiri, G.; Idnurm, A.; Castoria, R. Transcriptomic responses of the basidiomycete yeast Sporobolomyces. sp. to the mycotoxin patulin. BMC Genom. 2016, 17. [Google Scholar] [CrossRef] [PubMed]
  30. Sumbu, Z.L.; Thonart, P.; Bechet, J. Action of patulin on a yeast. Appl. Environ. Microbiol. 1983, 45, 110–115. [Google Scholar] [PubMed]
  31. Papp, G.; Horváth, E.; Mike, N.; Gazdag, Z.; Belágyi, J.; Gyöngyi, Z.; Bánfalvi, G.; Hornok, L.; Pesti, M. Regulation of patulin-induced oxidative stress processes in the fission yeast Schizosaccharomyces. pombe. Food Chem. Toxicol. 2012, 50, 3792–3798. [Google Scholar] [CrossRef] [PubMed]
  32. Iwahashi, Y.; Hosoda, H.; Park, J.H.; Lee, J.H.; Suzuki, Y.; Kitagawa, E.; Murata, S.M.; Jwa, N.S.; Gu, M.B.; Iwahashi, H. Mechanisms of patulin toxicity under conditions that inhibit yeast growth. J. Agric. Food Chem. 2006, 54, 1936–1942. [Google Scholar] [CrossRef] [PubMed]
  33. Kavanagh, K.L.; Jörnvall, H.; Persson, B.; Oppermann, U. Medium- and short-chain dehydrogenase/reductase gene and protein families: The SDR superfamily: Functional and structural diversity within a family of metabolic and regulatory enzymes. Cell. Mol. Life Sci. 2008, 65, 3895–3906. [Google Scholar] [CrossRef] [PubMed]
  34. Zheng, X.; Yang, Q.; Zhang, H.; Cao, J.; Zhang, X.; Apaliya, M.T. The Possible Mechanisms Involved in Degradation of Patulin by Pichia. caribbica. Toxins 2016, 8. [Google Scholar] [CrossRef] [PubMed]
  35. Da Silva, K.P.; Borges, J.C. The molecular chaperone Hsp70 family members function by a bidirectional heterotrophic allosteric mechanism. Protein Pept. Lett. 2011, 18, 132–142. [Google Scholar] [CrossRef] [PubMed]
  36. Zong, Y.; Li, B.; Tian, S. Effects of carbon, nitrogen and ambient pH on patulin production and related gene expression in Penicillium. expansum. Int. J. Food Microbiol. 2015, 206, 102–108. [Google Scholar] [CrossRef] [PubMed]
  37. Liu, R.; Wang, Y.; Qin, G.; Tian, S. iTRAQ-based quantitative proteomic analysis reveals the role of the tonoplast in fruit senescence. J. Proteom. 2016, 146, 80–89. [Google Scholar] [CrossRef] [PubMed]
  38. Blast2GO. Available online: https://www.blast2go.com/ (accessed on 20 April 2016).
  39. GO annotation. Available online: http://www.geneontology.org/ (accessed on 22 April 2016).
  40. Li, Q.Q.; Skinner, J.; Bennett, J.E. Evaluation of reference genes for real-time quantitative PCR studies in Candida glabrata following azole treatment. BMC Mol. Biol. 2012, 13. [Google Scholar] [CrossRef] [PubMed]
  41. Livak, K.J.; Schmittgen, T.D. Analysis of relative gene expression data using real-time quantitative PCR and the 2−∆∆CT Method. Methods 2001, 25, 402–408. [Google Scholar] [CrossRef] [PubMed]
Figure 1. Biodegradation of patulin by C. guilliermondii. (A) Effects of patulin on the growth of C. guilliermondii; (B) Biodegradation assay of patulin by co-incubating with living and dead yeast cells; (C) Biodegradation assay of patulin by co-incubating with supernatant of the yeast culture and intracellular protein extracts. Error bars indicate standard deviations of the means from three replicates. Values followed by different letters are significantly different according to a Duncan’s multiple range test (p < 0.05).
Toxins 09 00048 g001
Figure 2. Biodegradation product of patulin by C. guilliermondii. (A) HPLC profiles of filtered mixtures before and after co-incubation of C. guilliermondii and patulin; (B) Changes in the peak area of peak 1 and peak 2 during the co-incubation; Error bars indicate standard deviations of the means from three replicates; (C) Conversion from patulin to E-ascladiol.
Toxins 09 00048 g002
Figure 3. LC-TOF-MS and MS/MS analysis on the biodegradation product of patulin. (A,B) Extracted ion chromatograms of the 48 h sample (at m/z 155.035) and E-ascladiol standard (at m/z 155.0360); (C,D) Corresponding MS/MS profiles of the 48 h sample and E-ascladiol standard.
Toxins 09 00048 g003
Figure 4. Differential proteins and their functional categories in iTRAQ-based quantitative proteomic analysis. (A,C) Numbers of up- and down- accumulated proteins at 24 and 48 h, respectively; (B,D), functional categories of up- and down-accumulated proteins according to Blast2GO analysis.
Toxins 09 00048 g004
Figure 5. Changes in the relative expression patterns of genes encoding differential proteins. Bolded gi numbers represent up-accumulated proteins, as based upon proteomic analysis. The non-bolded gi numbers represent proteins that were down-accumulated in the proteomic analysis. Error bars indicate the standard deviations of the means from three replicates.
Toxins 09 00048 g005
Table 1. Identification of differentially up-accumulated proteins with an iTRAQ-based quantitative proteomic analysis of C. guilliermondii that was treated with or without patulin.
Protein IDGI NumberProtein NameFold Change (Patulin/Control)
24 h48 h
Carbohydrate metabolic process
U1gi|190345021Glucose-6-phosphate isomerase1.391.56
U2gi|190348104Glyceraldehyde 3-phosphate dehydrogenase2.974.09
Cellular component organization
U3gi|146411959NADPH-dependent methylglyoxal reductase 6.704.33
U4gi|146420860NADPH-dependent methylglyoxal reductase 1.891.64
Energy metabolic process
U5gi|146416915Phosphoglycerate kinase1.101.83
Oxidation-reduction process
U6gi|146414467Potential oxidoreductase6.839.54
U7gi|190348612Short-chain dehydrogenase51.124.0
Protein metabolic process
U8gi|190347960Cell division control protein 481.511.61
Response to stimulus
U9gi|146413777Heat shock protein 70 1.421.63
Table 2. Identification of differentially down-accumulated proteins with an iTRAQ-based quantitative proteomic analysis of C. guilliermondii treated with or without patulin.
Protein IDGI NumberProtein NameFold Change (Patulin/Control)
24 h48 h
Amino acid metabolic process
D1gi|146417089NADP-specific glutamate dehydrogenase0.520.45
D2gi|146417813Serine hydroxymethyltransferase0.240.65
Carbohydrate metabolic process
D3gi|146413757Isocitrate lyase0.600.57
D4gi|146414542Mannose-1-phosphate guanyltransferase0.630.49
D5gi|146415901S-adenosylmethionine synthase0.540.53
Cellular component organization
D6gi|146413767Histone H40.500.38
Energy metabolic process
D7gi|190345530Ketol-acid mitochondrial0.130.63
Lipid metabolic process
D8gi|190344794Acyl-Coenzyme A oxidase 40.240.46
D9gi|146416129Cytochrome P450 (Lanosterol 14-alpha demethylase)0.390.60
D10gi|190346072Fatty acid synthase subunit beta0.390.74
Protein biosynthesis and modification
D11gi|1464236893-isopropylmalate dehydratase0.660.58
D12gi|26996960140S ribosomal protein s10.380.66
D13gi|14641501640S ribosomal protein S19-B0.080.91
D14gi|14641966760S ribosomal protein L17-B0.600.95
D15gi|14641820660S ribosomal protein L300.280.45
D16gi|14641769760S ribosomal protein L4-b0.100.57
D17gi|152032427Elongation factor 1-alpha0.480.31
D18gi|190346643Nucleolar protein 560.900.58
Response to stimulus
D19gi|1464209555-methyltetrahydropteroyltriglutamate homocysteine methyltransferase0.370.60
D20gi|156630825Histone H3.1/H3.20.460.48
Transport
D21gi|146412540ABC transporter ATP-binding protein ARB10.980.48
Table 3. Primers used for RT-qPCR.
GenePrimer Sequences (5′–3′)
5.8S rRNAF: GCTGTCGACCTCTCAATGTATTAGG
R: TAAGGCCGGGCCAACAAT
gi|190348612F: TCTTTCGGCCCACTTTTGAA
R: AAGCGAATGGGTCCCAAGAC
gi|146413777F: CCACCAACCAAAGAGCATTGA
R: GGTTTGAGCAGAAGAAGACAAGGT
gi|146417089F: AAAGGCCACTGGTGGAAAGG
R: CAGCGTATTGGGCAACGTTA
gi|146413767F: ATTAGGAAAGGGAGGCGCTAA
R: TTCTAATAGCTGGCTTGGTGATACC
gi|190344794F: CGAAGCCACCGAGGAGTTT
R: AAGAATGAGCAGCACCACCAA
gi|156630825F: CAAGAAAGTCCACTGGTGGTAAGG
R: TCCAGTAGAAGGAGCGGATTTT

