
Sterigmatocystin Occurrence in Paddy and Processed Rice Produced in Italy in the Years 2014–2015 and Distribution in Milled Rice Fractions


Abstract
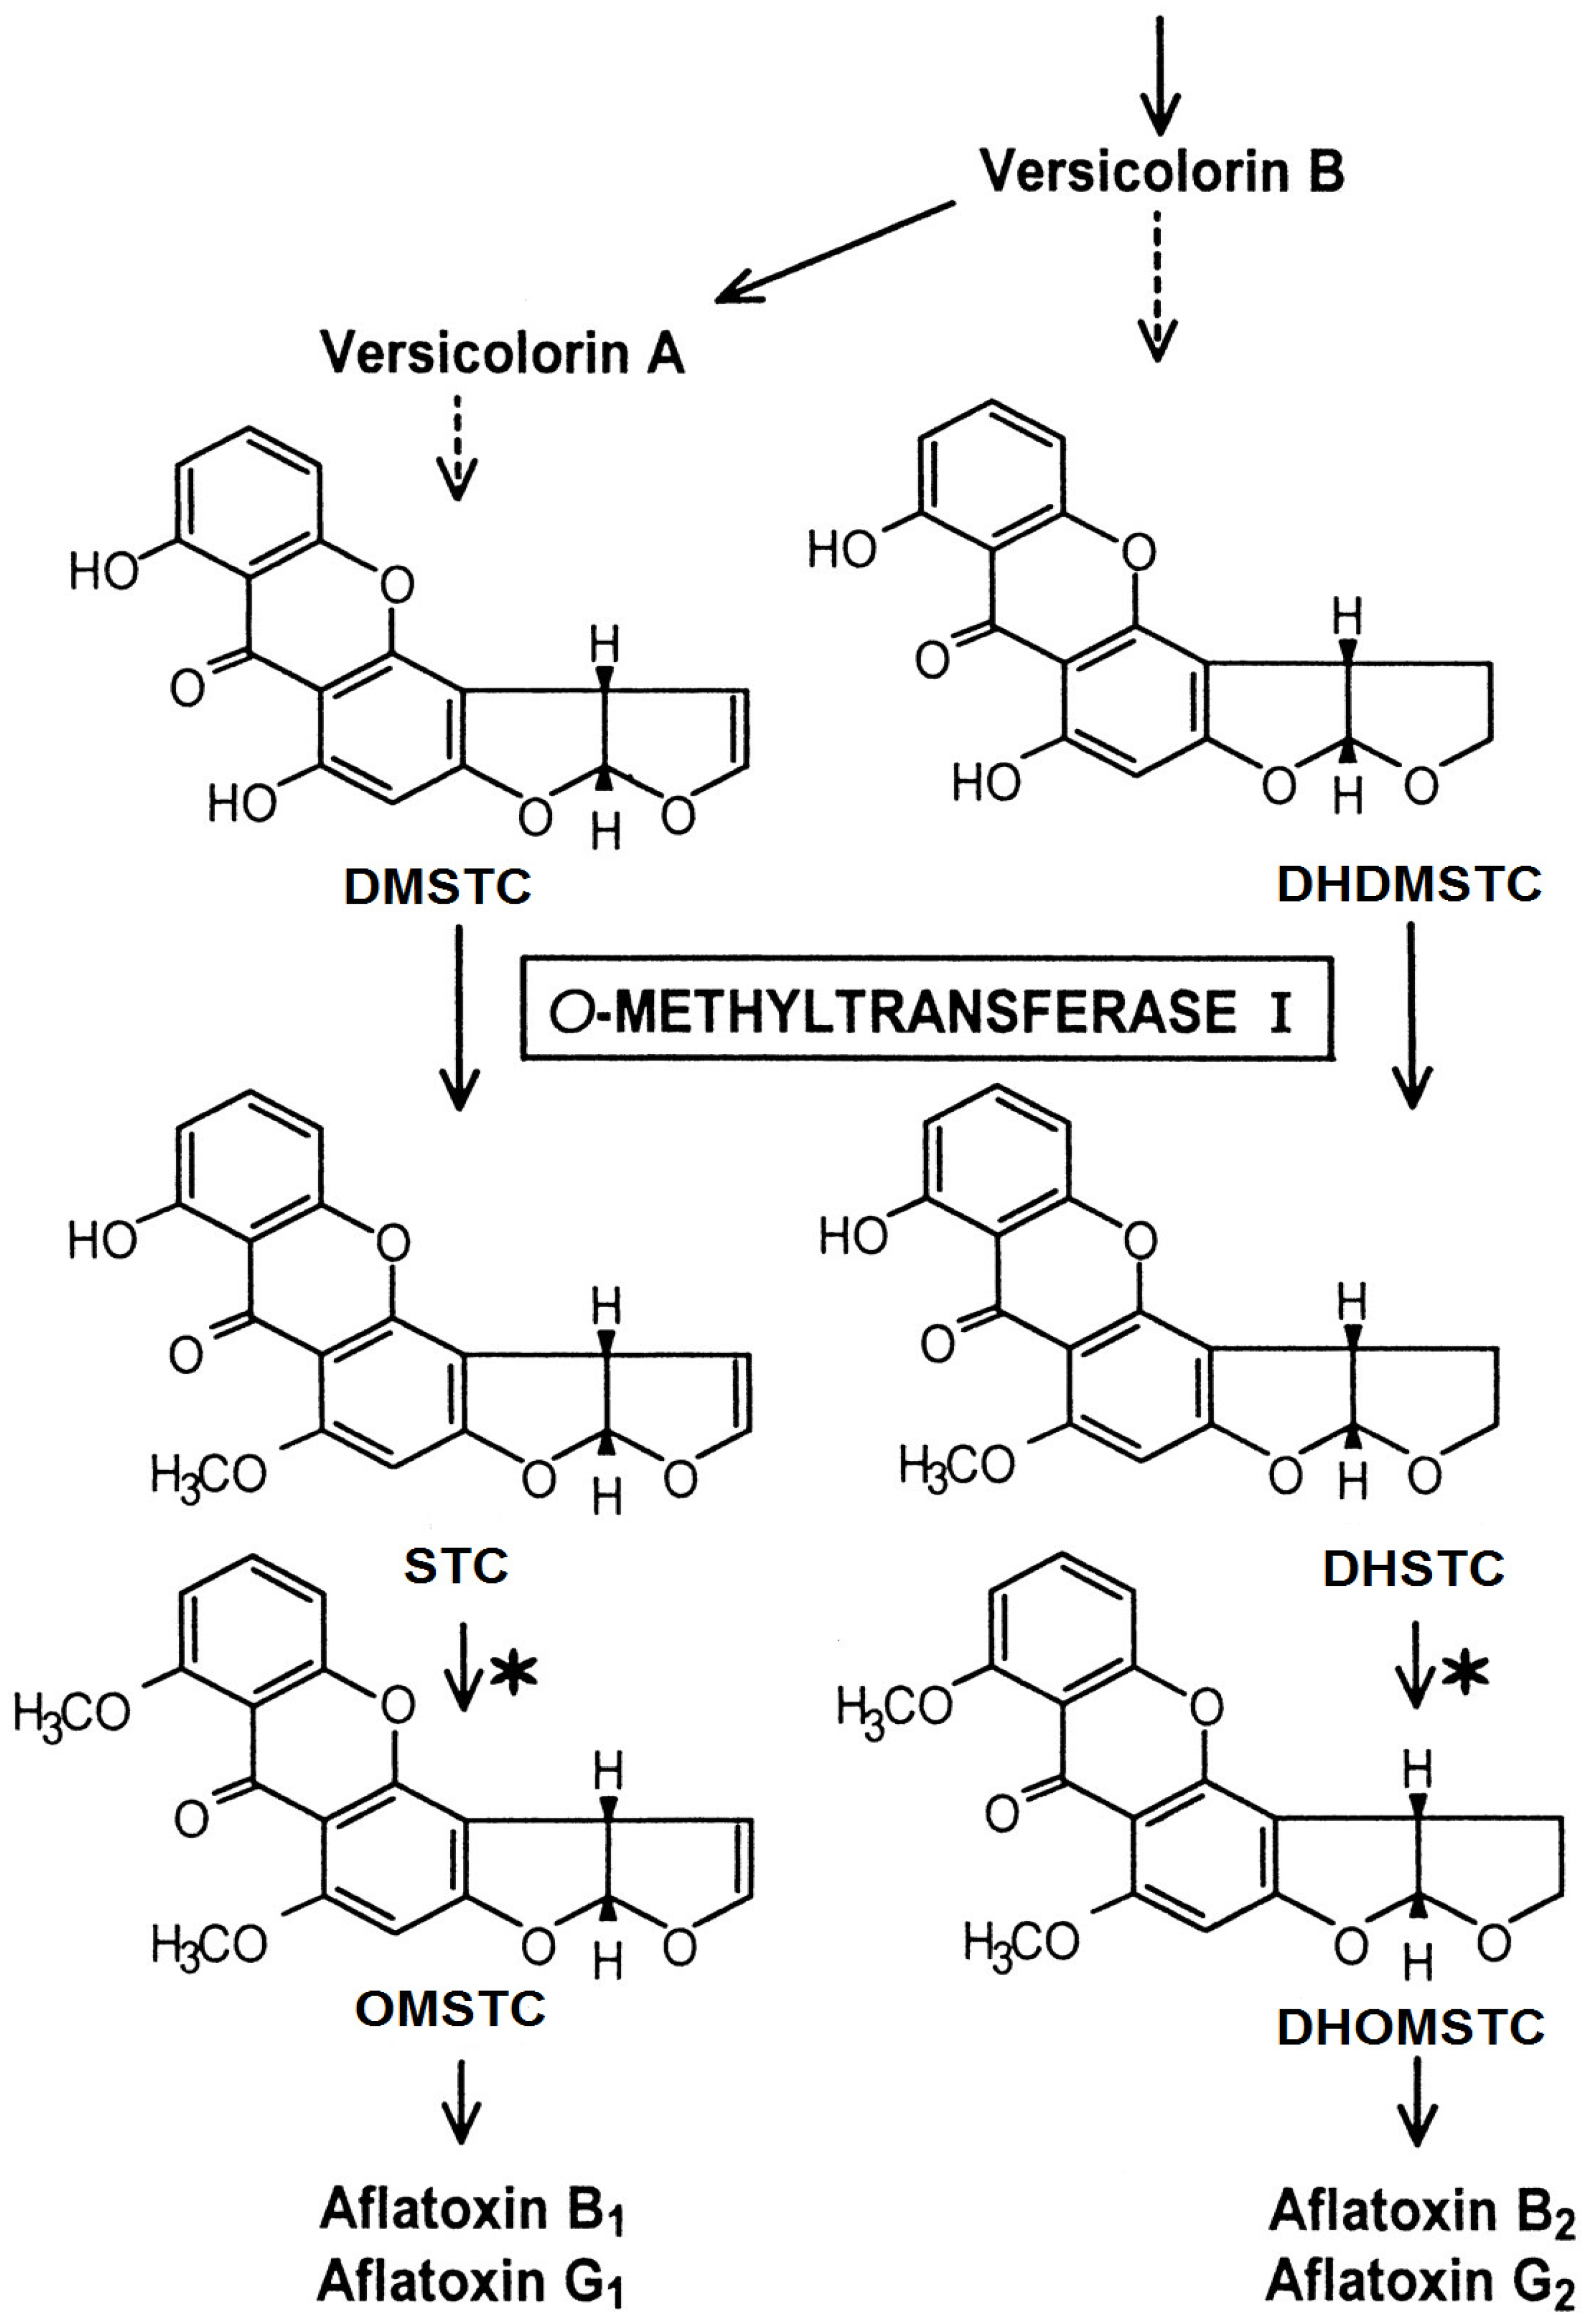
:1. Introduction
2. Results and Discussion
2.1. Occurrence of STC in Paddy and Processed Rice
2.2. Distribution of STC during De-Hulling and Polishing Processes
3. Conclusions
4. Materials and Methods
4.1. Sampling
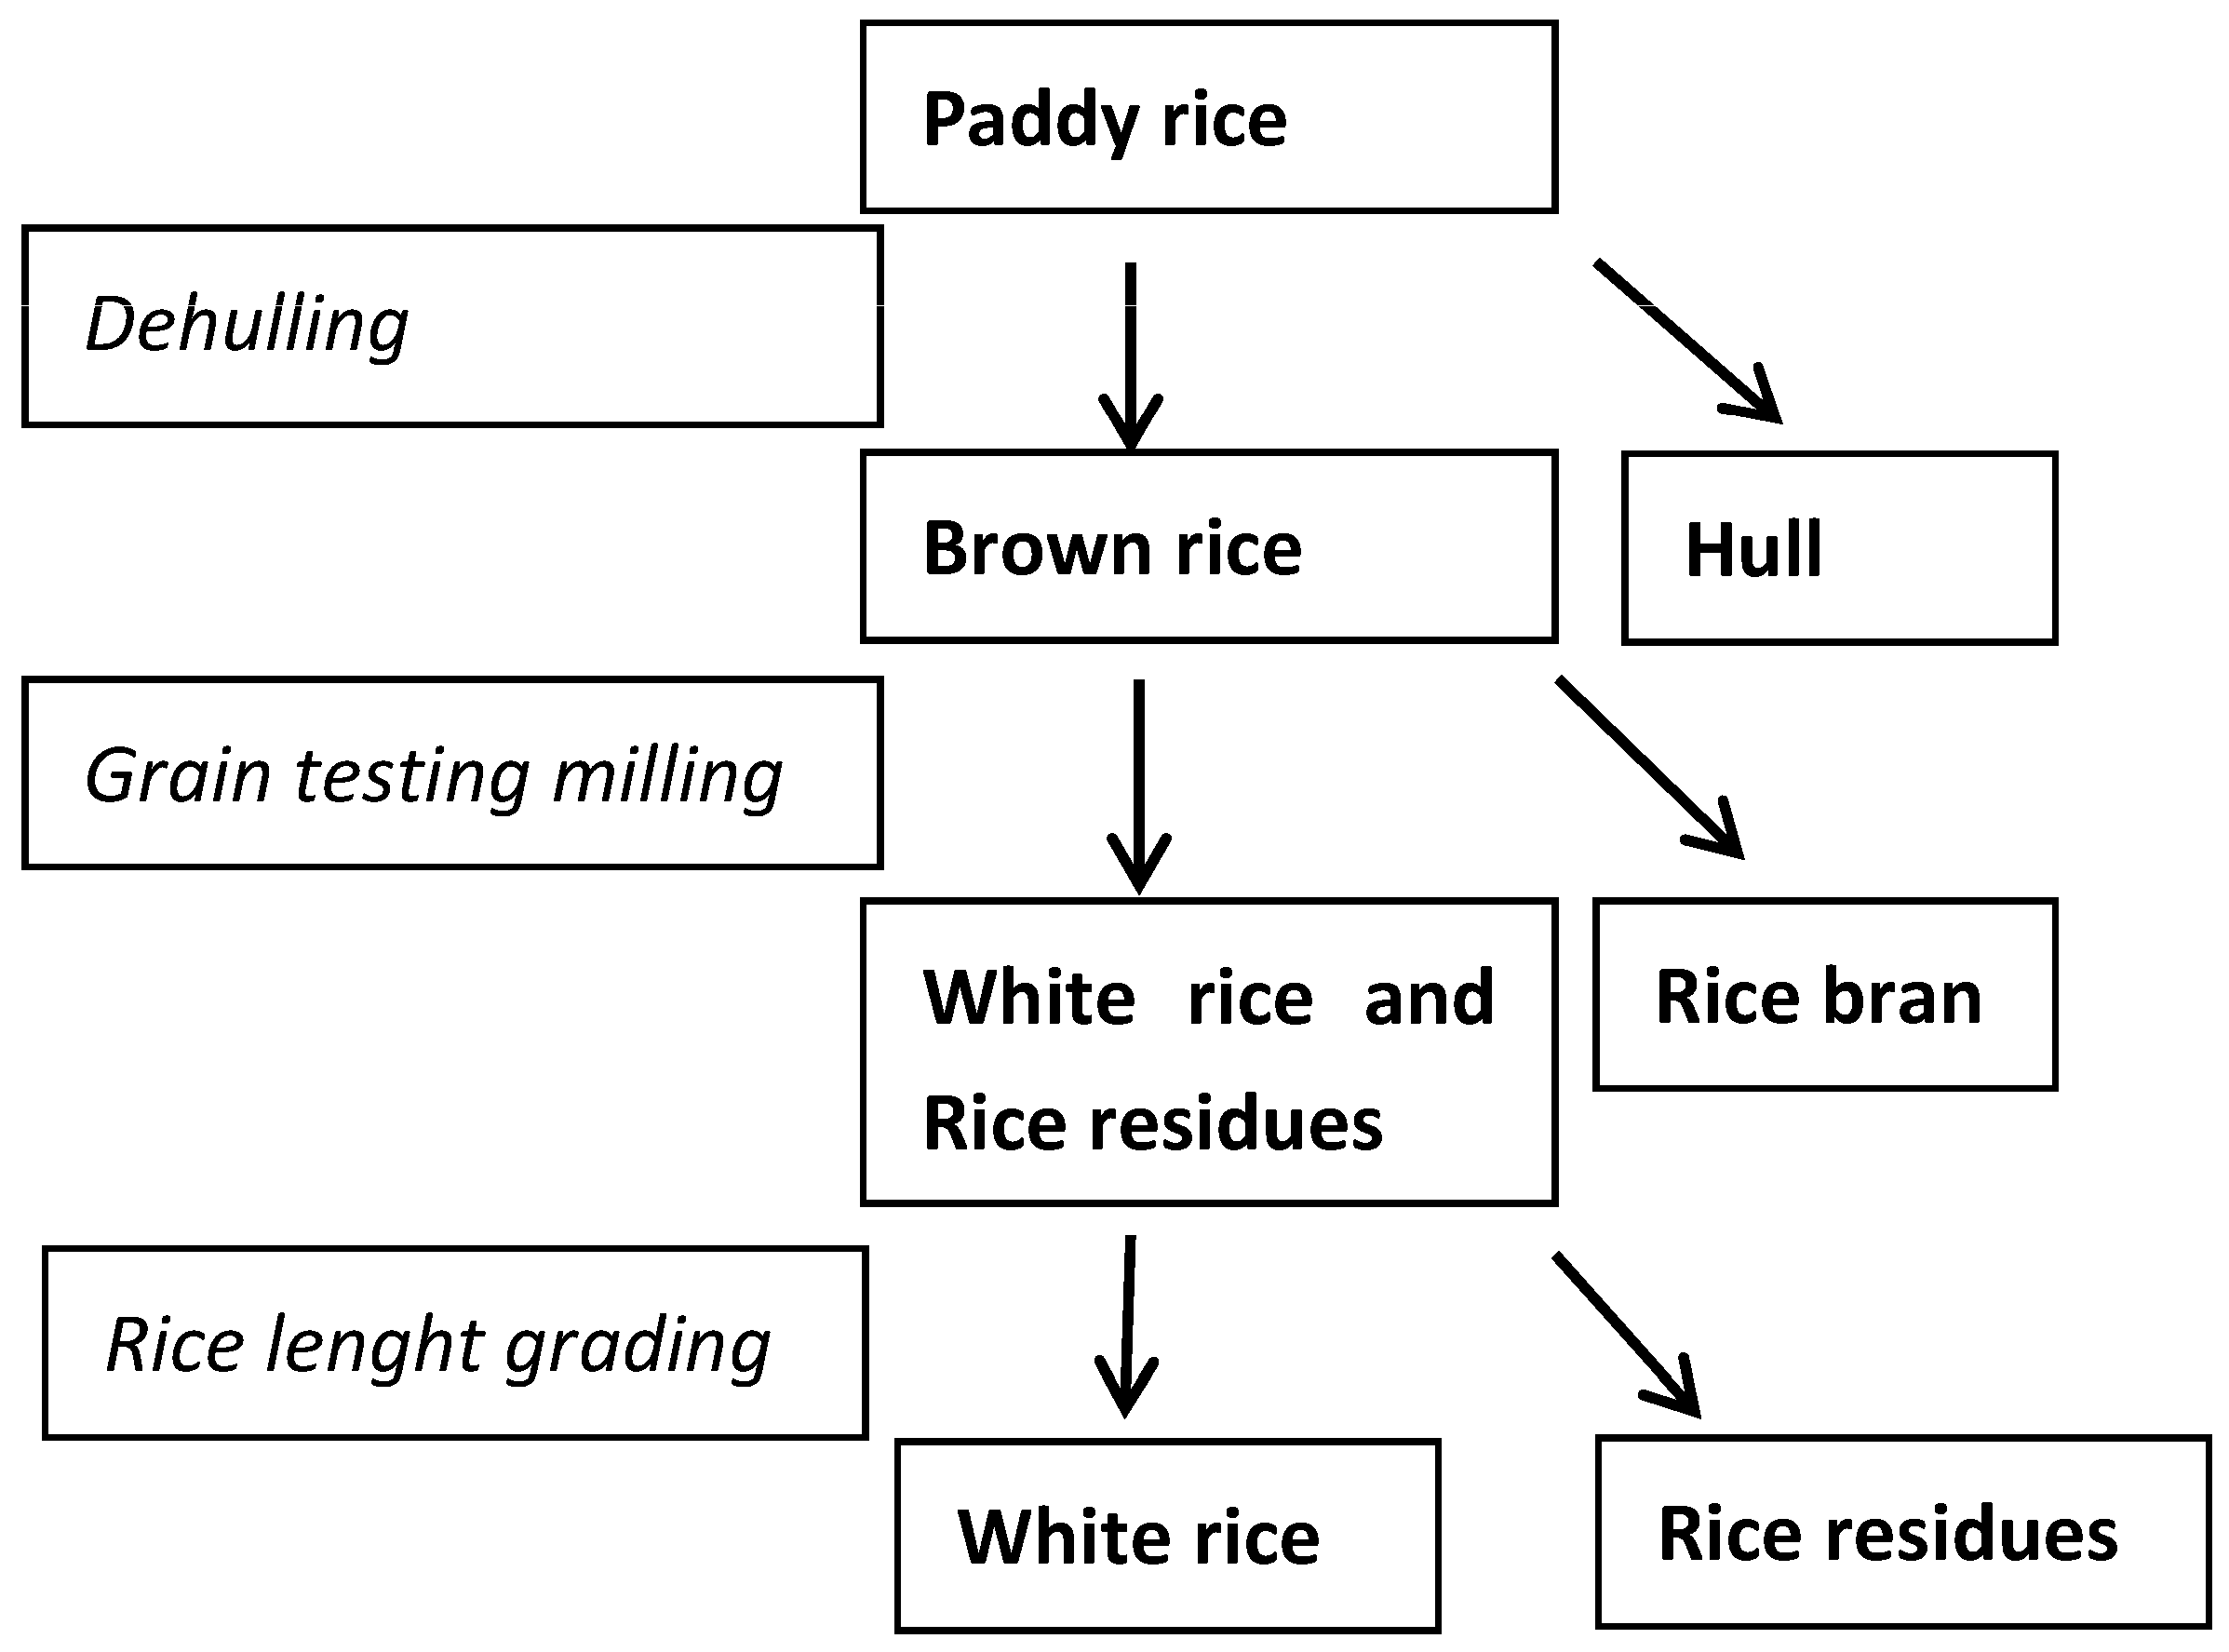
4.2. Rice Processing
4.3. Chemicals and Standards
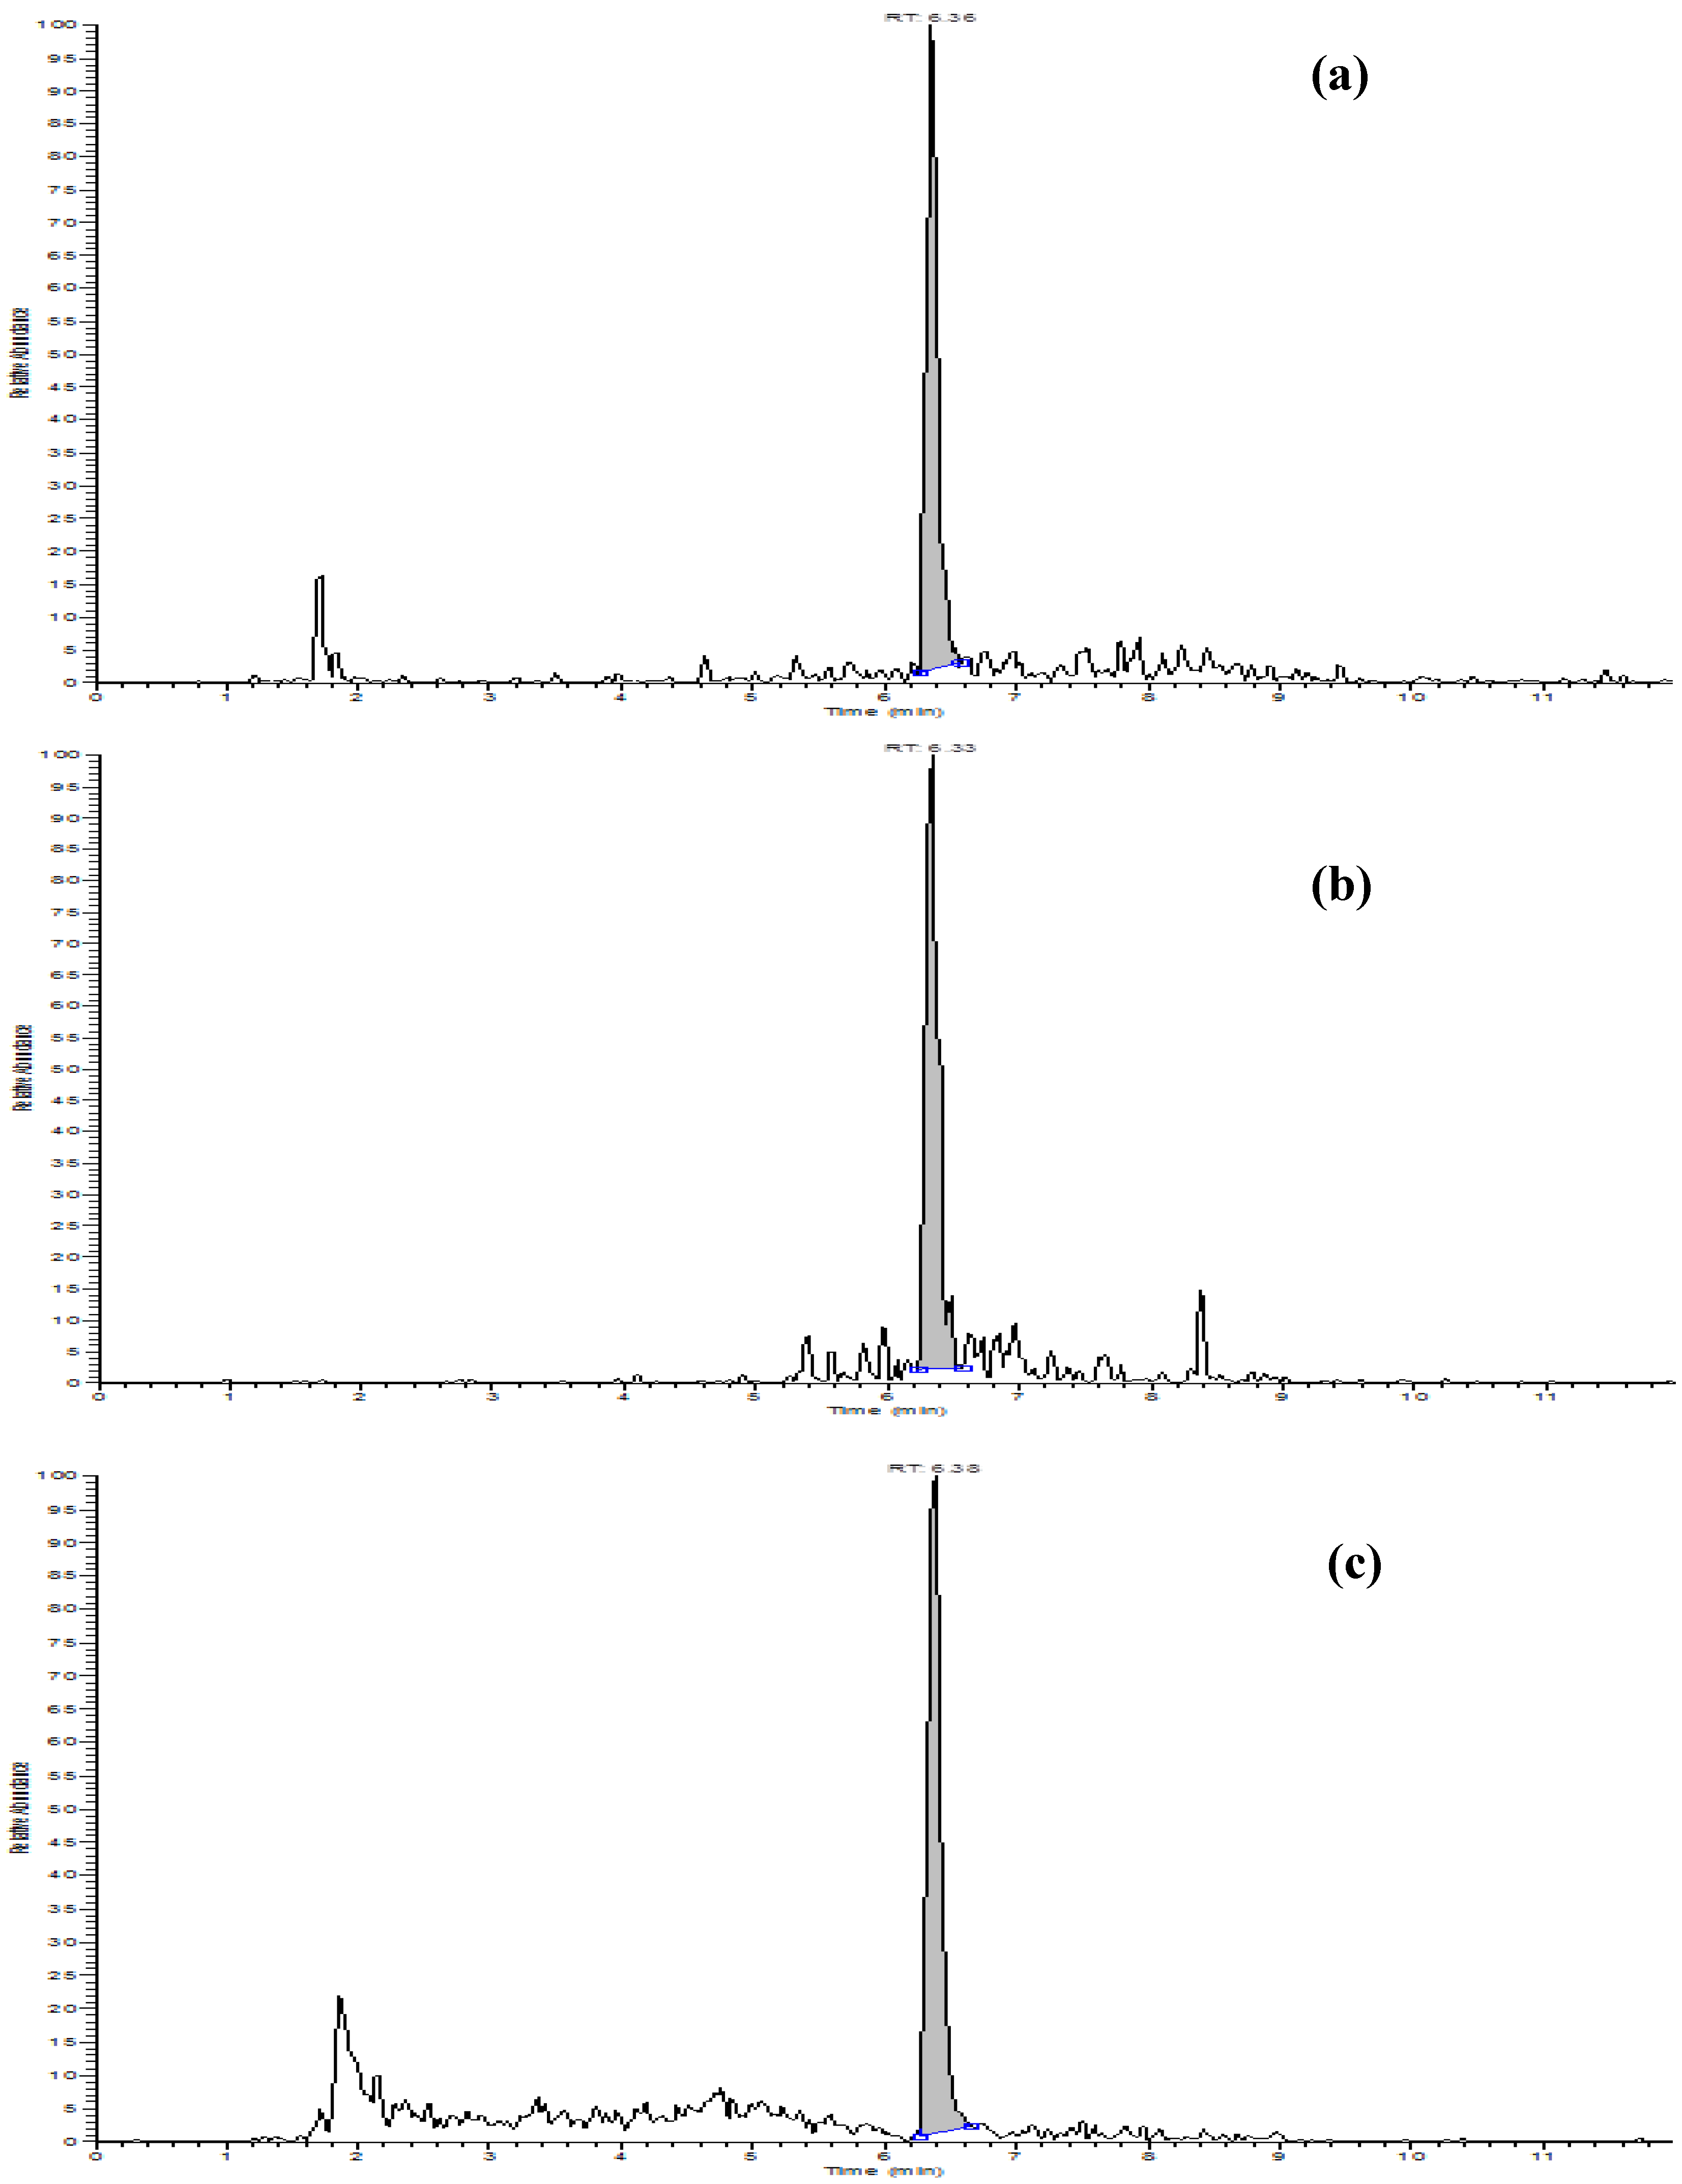
4.4. Analysis for STC Determination
4.5. Method Performances
4.5.1. Matrix Effect
4.5.2. Calibration and Quantification
4.5.3. Accuracy and Precision
4.6. Statistical Data Analysis
Author Contributions
Conflicts of Interest
References
- Sweeney, M.J.; Dobson, A.D.W. Molecular biology of mycotoxin biosynthesis. FEMS Microbiol. Lett. 1999, 175, 149–163. [Google Scholar] [CrossRef] [PubMed]
- Yu, J.; Chang, P.-K.; Ehrlich, K.C.; Cary, J.W.; Bhatnagar, D.; Cleveland, T.E.; Payne, G.A.; Linz, J.E.; Woloshuk, C.P.; Bennet, J.W. Clustered pathway genes in aflatoxin biosynthesis. Appl. Environ. Microbiol. 2004, 70, 1253–1262. [Google Scholar] [CrossRef] [PubMed]
- Rank, C.; Nielsen, K.F.; Larsen, T.O.; Varga, J.; Samson, R.A.; Frisvad, J.C. Distribution of sterigmatocystin in filamentous fungi. Fungal Biol. 2011, 115, 406–420. [Google Scholar] [CrossRef] [PubMed]
- Essigmann, J.M.; Donahue, P.R.; Story, D.L.; Wogan, G.N.; Brunengraber, H. Use of the isolated perfused rat liver to study carcinogen-DNA adduct formation from aflatoxin B1 and sterigmatocystin. Cancer Res. 1980, 40, 4085–4091. [Google Scholar] [PubMed]
- Mc Connell, I.R.; Garner, R.C. DNA adducts of aflatoxins, sterigmatocystin and other mycotoxins. IARC Sci. Publ. 1994, 125, 49–55. [Google Scholar]
- Shimada, T.; Hayes, C.L.; Yamazaki, H.; Amin, S.; Hecht, S.S.; Guengerich, F.P.; Sutter, T.R. Activation of chemically diverse procarcinogens by human cytochrome P-450 1B1. Cancer Res. 1996, 56, 2979–2984. [Google Scholar] [PubMed]
- Gao, W.; Jiang, L.; Ge, L.; Chen, M.; Geng, C.; Yang, G.; Li, Q.; Ji, F.; Yan, Q.; Zou, Y. Sterigmatocystin-induced oxidative DNA damage in human liver-derived cell line through lysosomal damage. Toxicol. In Vitro 2015, 29, 1–7. [Google Scholar] [CrossRef] [PubMed]
- IARC (International Agency for Research on Cancer). Some Naturally Occurring Substances. IARC Monographs on the Evaluation of Carcinogenic Risks to Humans. Summaries and Evaluations, Sterigmatocystin; Monographs; IARC: Lyon, France, 1987; Volume 10, p. 72. [Google Scholar]
- Pfeiffer, E.; Fleck, S.C.; Metzler, M. Catechol Formation: A Novel Pathway in the Metabolism of Sterigmatocystin and 11-Methoxysterigmatocystin. Chem. Res. Toxicol. 2014, 27, 2093–2099. [Google Scholar] [CrossRef] [PubMed]
- Audebert, M.; Theumeur, M.; Henneb, Y.; Payros, D.; Borin, C.; Tadrist, S.; Beltz, S.; Puel, O.; Oswald, I. Genotoxicity of aflatoxin precursors. In Abstracts of Lectures and Posters of the World Mycotoxin Forum 8th Conference, Wien, Austria, 10–12 November 2014; 2014. P43: 102. [Google Scholar]
- Versilovskis, A.; Bartkevics, V.; Mikelsone, V. Sterigmatocystin presence in typical Latvian grains. Food Chem. 2008, 109, 243–248. [Google Scholar] [CrossRef] [PubMed]
- Uhlig, S.; Eriksen, G.S.; Hofgaard, I.S.; Krska, R.; Beltrán, E.; Sulyok, M. Faces of a changing climate: Semi-quantitative multi-mycotoxin analysis of grain grown in exceptional climatic conditions in norway. Toxins 2013, 5, 1682–1697. [Google Scholar] [CrossRef] [PubMed]
- Veršilovskis, A.; De Saeger, S.; Miķelsone, V. Determination of sterigmatocystin in beer by high performance liquid chromatography with ultraviolet detection. World Mycotoxin J. 2008, 1, 161–166. [Google Scholar] [CrossRef]
- Battilani, P.; Costa, L.G.; Dossena, A.; Gullino, M.L.; Marchelli, R.; Galaverna, G.; Pietri, A.; Dall’Asta, C.; Giorni, P.; Spadaro, D.; et al. Scientific information on mycotoxins and natural plant toxicants. EFSA Supporting Publ. 2009, 6. [Google Scholar] [CrossRef]
- Versilovskis, A.; De Saeger, S. Sterigmatocystin: Occurrence in foodstuffs and analytical methods—An overview. Mol. Nutr. Food Res. 2010, 54, 136–147. [Google Scholar] [CrossRef] [PubMed]
- Varga, E.; Glauner, T.; Berthiller, F.; Krska, R.; Schuhmacher, R.; Sulyok, M. Development and validation of a (semi-)quantitative UHPLC-MS/MS method for the determination of 191 mycotoxins and other fungal metabolites in almonds, hazelnuts, peanuts and pistachios. Anal. Bioanal. Chem. 2013, 405, 5087–5104. [Google Scholar] [CrossRef] [PubMed]
- Yogendrarajah, P.; Jacxsens, L.; Lachat, C. Public health risk associated with the co-occurrence of mycotoxins in spices consumed in Sri Lanka. Food Chem. Toxicol. 2014, 74, 240–248. [Google Scholar] [CrossRef] [PubMed]
- Veršilovskis, A.; Bartkevičs, V.; Miķelsone, V. Analytical method for the determination of sterigmatocystin in grains using high-performance liquid chromatography-tandem mass spectrometry with electrospray positive ionization. J. Chromatogr. A 2007, 1157, 467–471. [Google Scholar] [CrossRef] [PubMed]
- Veršilovskis, A.; Van Peteghem, C.; de Saeger, S. Determination of sterigmatocystin in cheese by high-performance liquid chromatography-tandem mass spectrometry. Food Addit. Contam. A 2009, 26, 127–133. [Google Scholar] [CrossRef] [PubMed]
- Mol, H.G.; Mac Donald, S.; Anagnostopoulos, C.; Spanjer, M.; Bertuzzi, T.; Pietri, A. European survey on sterigmatocystin in cereals, cereals-based products, beer and nuts. World Mycotoxin J. 2016, 9, 633–642. [Google Scholar] [CrossRef]
- Biancardi, A.; Dall’Asta, C. Determination of sterigmatocystin in feed by LC-MS/MS. Food Addit. Contam. A 2015, 32, 2093–2100. [Google Scholar] [CrossRef] [PubMed]
- Monbaliu, S.; Van Poucke, C.; Van Peteghem, C.; Van Poucke, K.; Heungens, K.; de Saeger, S. Development of a multimycotoxin liquid chromatography/tandem mass spectrometry method for sweet pepper analysis. Rapid Commun. Mass Spectrom. 2009, 23, 3–11. [Google Scholar] [CrossRef] [PubMed]
- Arroyo-Manzanares, N.; Huertas-Pérez, J.F.; García-Campaña, A.M.; Gámiz-Gracia, L. Simple methodology for the determination of mycotoxins in pseudocereals, spelt and rice. Food Control 2014, 36, 94–101. [Google Scholar] [CrossRef]
- Hickert, S.; Gerding, J.; Ncube, E.; Hübner, F.; Flett, B.; Cramer, B.; Humpf, H.-U. A new approach using micro HPLC-MS/MS for multi-mycotoxin analysis in maize samples. Mycotoxin Res. 2015, 31, 109–115. [Google Scholar] [CrossRef] [PubMed]
- Marley, E.; Brown, P.; Mackie, J.; Donnelly, C.; Wilcox, J.; Pietri, A.; Mac Donald, S. Analysis of sterigmatocystin in cereals, animal feed, seeds, beer and cheese by immunoaffinity column clean-up and HPLC and LC-MS/MS quantification. Food Addit. Contam. A 2015, 32, 2131–2137. [Google Scholar] [CrossRef] [PubMed]
- Mol, H.G.; Mac Donald, S.; Anagnostopoulos, C.; Spanjer, M.; Pietri, A. Survey on sterigmatocystin in food. EFSA Supporting Publ. 2015, 12. [Google Scholar] [CrossRef]
- Sugimoto, T.; Minamisawa, M.; Takano, K.; Sasamura, Y.; Tsuruta, O. Detection of ochratoxin A, citrinin and sterigmatocystin from stored rice by natural occurrence of Penicillum viridicatum and Aspergillus versicolor. J. Food Hyg. Soc. Jpn. 1977, 18, 176–181. [Google Scholar]
- Takahashi, H.; Yasaki, H.; Nanayama, U.; Manabe, M.; Matsuura, S. Distribution of sterigmatocystin and fungal mycelium in individual brown rice kernels naturally infected by Aspergillus versicolor. Cereal Chem. 1984, 61, 48–52. [Google Scholar]
- Tanaka, K.; Sago, Y.; Zheng, Y.; Nakagawa, H.; Kushiro, M. Mycotoxins in rice. Int. J. Food Microbiol. 2007, 119, 59–66. [Google Scholar] [CrossRef] [PubMed]
- Rofiat, A.S.; Fanelli, F.; Atanda, O.; Sulyok, M.; Cozzi, G.; Bavaro, S.; Krska, R.; Logrieco, A.; Ezekiel, C.N. Fungal and bacterial metabolites associated with natural contamination of locally processed rice (Oryza sativa L.) in Nigeria. Food Addit. Contam. 2015, 32, 950–959. [Google Scholar] [CrossRef] [PubMed]
- Ente Nazionale Risi. 2015. Available online: www.enterisi.it (accessed on 19 October 2016).
- Commission of the European Communities. Commission Regulation (EU) No 165/2010 of 26 February 2010 amending Regulation (EC) No 1881/2006 setting maximum levels for certain contaminants in foodstuffs as regards aflatoxins. Off. J. Eur. Communites 2010, L50, 8–12. [Google Scholar]
- Bertuzzi, T.; Rastelli, S.; Mulazzi, A.; Pietri, A. Evaluation and improvement of extraction methods for the analysis of aflatoxins B1, B2, G1 and G2 from naturally contaminated maize. Food Anal. Methods 2012, 5, 512–519. [Google Scholar] [CrossRef]
- UK, Food Standards Agency. Survey of Retail Rice for a Range of Mycotoxins; Food Survey Information Sheet No. 22-02; Food Standards Agency: London, UK, 2002.
- Ferre, F.S. Worldwide occurrence of mycotoxins in rice. Food Control 2016, 62, 291–298. [Google Scholar] [CrossRef]
- Kumar, V.; Basu, M.S.; Rajendran, T.P. Mycotoxin research and mycoflora in some commercially important agricultural commodities. Crop Protect. 2008, 27, 891–905. [Google Scholar] [CrossRef]
- Surekha, M.; Saini, K.; Reddy, V.K.; Reddy, A.R.; Reddy, S.M. Fungal succession in stored rice (Oryza sativa Linn.) fodder and mycotoxin production. Afr. J. Biotechnol. 2011, 10, 550–555. [Google Scholar]
- Commission of the European Communities. Commission regulation (EC) No. 401/2006 of 23 February 2006 laying down the methods of sampling and analysis for the official control of the levels of mycotoxins in foodstuffs. Off. J. Eur. Union 2006, L70, 12–34. [Google Scholar]
- Davies, J.E.; Kirkaldy, D.; Roberts, J.C. Studies in mycological chemistry. Part VII. Sterigmatocystin, a metabolite of Aspergillus versicolor. J. Chem. Soc. 1960, 2169–2178. [Google Scholar] [CrossRef]
- Commission of the European Communites. Commission Decision 2002/657/EC of 12 August 2002 implementing Council Directive 96/23/EC concerning the performance of analytical methods and the interpretation of results. Off. J. Eur. Communites 2002, L221, 8–36. [Google Scholar]


| Sample | Year | Incidence | Mean | Median | Range |
|---|---|---|---|---|---|
| Paddy rice | 2014 | 18/18 | 1.65 | 1.15 | 0.29–5.32 |
| 2015 | 31/31 | 2.06 | 1.11 | 0.36–15.85 | |
| Overall | 1.91 a | 1.15 | |||
| Brown rice | 2014 | 14/14 | 0.48 | 0.29 | 0.12–1.32 |
| 2015 | 10/10 | 0.46 | 0.34 | 0.13–1.10 | |
| Overall | 0.47 b | 0.32 | |||
| Parboiled rice | 2014 | 9/10 | 0.46 | 0.39 | <0.05–1.09 |
| 2015 | 11/12 | 0.30 | 0.27 | <0.05–0.66 | |
| Overall | 0.37 b | 0.31 | |||
| White rice | 2014 | 18/27 | 0.12 | 0.06 | <0.05–0.98 |
| 2015 | 10/10 | 0.20 | 0.21 | 0.09–0.30 | |
| Overall | 0.14 c | 0.08 |
| Sample | Loto a (Long-Grain A) b | CL 26 a (Long-Grain B ) b | Sole a (Short-Grain) b | Selenio a (Short-Grain) b | Sole a (Short-Grain) b | ||||||||||
|---|---|---|---|---|---|---|---|---|---|---|---|---|---|---|---|
| % (w/w) | STC μg·kg−1 | Distrib. (%) | % (w/w) | STC μg·kg−1 | Distrib. (%) | % (w/w) | STC μg·kg−1 | Distrib. (%) | % (w/w) | STC μg·kg−1 | Distrib. (%) | % (w/w) | STC μg·kg−1 | Distrib. (%) | |
| Paddy rice | 100.0 | 3.47 | 100 | 100.0 | 1.15 | 100 | 100.0 | 1.27 | 100 | 100.0 | 0.46 | 100 | 100.0 | 1.56 | 100 |
| Hull | 18.2 | 10.89 | 57.1 | 19.4 | 4.03 | 67.8 | 18.3 | 4.91 | 70.8 | 17.3 | 1.58 | 58.7 | 18.3 | 6.56 | 76.9 |
| Brown rice | 81.8 | 1.32 | 30.8 (100) | 80.6 | 0.31 | 21.7 (100) | 81.7 | 0.33 | 21.2 (100) | 82.7 | 0.17 | 30.4 (100) | 81.7 | 0.43 | 22.4 (100) |
| Rice bran | 9.3 | 8.46 | 22.5 (72.9) | 9.7 | 1.84 | 15.6 (72.0) | 9.4 | 1.98 | 15.0 (70.4) | 9.5 | 0.92 | 18.9 (62.1) | 9.4 | 2.00 | 12.2 (54.3) |
| White rice | 60.5 | 0.13 | 2.2 (7.3) | 61.6 | 0.06 | 3.2 (14.8) | 61.1 | 0.07 | 3.4 (15.9) | 65.0 | <LOD | - | 61.1 | 0.21 | 8.3 (37.1) |
| Rice residues | 12.1 | 0.32 | 1.1 (3.6) | 9.3 | 0.08 | 0.6 (2.8) | 11.2 | 0.13 | 1.2 (5.5) | 8.2 | 0.11 | 1.9 (6.4) | 11.2 | 0.13 | 1.0 (4.3) |
| Sample | STC Distribution (%) | Concentration Ratio |
|---|---|---|
| Paddy rice | 100 | 1 |
| Hull | 66.2 ± 8.3 | 3.62 ± 0.42 |
| Brown rice | 25.1 ± 4.8 | 0.31 ± 0.06 |
| Rice bran | 16.8 ± 4.1 | 1.77 ± 0.45 |
| White rice | 4.4 ± 2.3 | 0.07 ± 0.04 |
| Rice residues | 1.1 ± 0.4 | 0.11 ± 0.06 |
© 2017 by the authors. Licensee MDPI, Basel, Switzerland. This article is an open access article distributed under the terms and conditions of the Creative Commons Attribution (CC BY) license ( http://creativecommons.org/licenses/by/4.0/).
Share and Cite
Bertuzzi, T.; Romani, M.; Rastelli, S.; Mulazzi, A.; Pietri, A. Sterigmatocystin Occurrence in Paddy and Processed Rice Produced in Italy in the Years 2014–2015 and Distribution in Milled Rice Fractions. Toxins 2017, 9, 86. https://doi.org/10.3390/toxins9030086
Bertuzzi T, Romani M, Rastelli S, Mulazzi A, Pietri A. Sterigmatocystin Occurrence in Paddy and Processed Rice Produced in Italy in the Years 2014–2015 and Distribution in Milled Rice Fractions. Toxins. 2017; 9(3):86. https://doi.org/10.3390/toxins9030086
Chicago/Turabian StyleBertuzzi, Terenzio, Marco Romani, Silvia Rastelli, Annalisa Mulazzi, and Amedeo Pietri. 2017. "Sterigmatocystin Occurrence in Paddy and Processed Rice Produced in Italy in the Years 2014–2015 and Distribution in Milled Rice Fractions" Toxins 9, no. 3: 86. https://doi.org/10.3390/toxins9030086