Article

The Influence of Piezoelectric Transducer Stimulating Sites on the Performance of Implantable Middle Ear Hearing Devices: A Numerical Analysis

1
School of Mechatronic Engineering, China University of Mining and Technology, Xuzhou 221116, China
2
State Key Laboratory of Mechanical System and Vibrations, Shanghai Jiao Tong University, Shanghai 200240, China
*
Author to whom correspondence should be addressed.
Micromachines 2019, 10(11), 782; https://doi.org/10.3390/mi10110782
Submission received: 10 October 2019 / Revised: 8 November 2019 / Accepted: 12 November 2019 / Published: 14 November 2019
(This article belongs to the Special Issue Piezoelectric Transducers: Materials, Devices and Applications)

Abstract

:
To overcome the inherent deficiencies of hearing aids, implantable middle ear hearing devices (IMEHDs) have emerged as a new treatment for hearing loss. However, clinical results show that the IMEHD performance varies with its transducer’s stimulating site. To numerically analyze the influence of the piezoelectric transducer’s stimulating sites on its hearing compensation performance, we constructed a human ear finite element model and confirmed its validity. Based on this finite element model, the displacement stimulation, which simulates the piezoelectric transducer’s stimulation, was applied to the umbo, the incus long process, the incus body, the stapes, and the round window membrane, respectively. Then, the stimulating site’s effect of the piezoelectric transducer was analyzed by comparing the corresponding displacements of the basilar membrane. Besides, the stimulating site’s sensitivity to the direction of excitation was also studied. The result of the finite element analysis shows that stimulating the incus body is least efficient for the piezoelectric transducer. Meanwhile, stimulating the round window membrane or the stapes generates a higher basilar membrane displacement than stimulating the eardrum or the incus long process. However, the performance of these two ideal sites’ stimulation is sensitive to the changes in the excitation’s direction. Thus, the round window membrane and the stapes is the ideal stimulating sites for the piezoelectric transducer regarding the driving efficiency. The direction of the excitation should be guaranteed for these ideal sites.

1. Introduction

Hearing loss, affecting around 466 million people worldwide, is one of the six leading causes of disease burden in our society [1]. Up to now, there is still no effective medical treatment to sensorineural hearing loss (SNHL), which is the main type of hearing loss taking up approximately 90% of reported hearing loss [2]. The patients with SNHL mainly turn to hearing aids for restoring audibility [3]. Although sophisticated hearing aids have been developed, hearing aids still have a number of inherent shortcomings, such as a limited high-frequency amplification gain, ear canal occlusion, and feedback annoyance [4]. To overcome these problems, many researchers proposed and designed the implantable middle ear hearing devices (IMEHDs), which restores audibility by the mechanical vibration of their implanted transducers [5].
IMEHD primarily comprises four components: the microphone, the sound processor, the transducer, and the battery. A typical schematic illustration of the IMEHD is shown in Figure 1 [6]. Briefly, the microphone, which is implanted closer to the ear canal, receives the outside sound and transmits to the sound processor. Then, the sound processor processes the input signal according to patients’ hearing loss and outputs a driving signal to the piezoelectric transducer. The piezoelectric transducer mainly consists of three parts: the piezoelectric stack, the rod, and the support sleeve. One side of the piezoelectric stack is stuck to the rod, which is attached to the incus body. While the other side of the piezoelectric stack is held to the support sleeve, which is fixed to the skull. Under the electrical driving signal’s stimulation, the piezoelectric stack, which is a monolithic ceramic construction of many thin piezoelectric ceramic layers, expands and contracts. Finally, the vibration of the piezoelectric stack is transmitted to the incus body by the rod and compensates for hearing loss. All these parts are powered by the battery. Among these IMEHD parts, the transducer is a key component as it is responsible for stimulating the human ear. Based on actuation mechanisms, the IMEHDs’ transducers are divided into two types: the electromagnetic transducer and the piezoelectric transducer [5]. Compared with the electromagnetic transducer, the piezoelectric transducer has the advantages of a lower power consumption, compatibility with external magnetic field, and ease of fabrication [4]. Owing to these advantages, piezoelectric transducer have been widely used in IMEHDs, especially the totally implanted type IMEHDs [7]. In terms of the stimulating sites, the transducer can be further classified into five categories: the eardrum driving [8,9], the incus body driving [6], the incus long process driving [10], the stapes driving [11,12], and the round window (RW) membrane driving [13,14].
Clinical study shows that the stimulating site influence the transducer’s hearing compensation performance [15]. To uncover this influence and optimize the transducer’s design, some preliminary studies have been carried out. Based on numerical analysis, Zhang et al. found that stimulating the round window membrane is more efficient than stimulating the incus long process [16]. The human temporal bone experiment conducted by Deveze et al. demonstrates that stimulating the stapes is superior to stimulating the incus body and incus long process [17]. However, the above researches only focus on the electromagnetic transducer. A numerical study shows that the stimulating site’s influence on the electromagnetic transducer is different from that on the piezoelectric transducer [18]. To investigate the stimulating site’s effect on the piezoelectric transducer’s performance, Bornitz et al. constructed a human ear finite element (FE) model and compared the stapes displacements under different piezoelectric transducers’ stimulation [18]. Their result demonstrates that the incus body is the least effective stimulating site for the piezoelectric transducer. However, auditory response measurements show that the stapes response is unreliable for evaluating round window stimulation [19]. Besides this, stimulating the incus long process, which is widely utilized clinically, was not investigated.
Accordingly, in the present study, we carried out a systematic study on the influence of piezoelectric transducer’s stimulating sites. To facilitate this study, we built a human ear FE model and confirmed its validity. Then, the stimulating site’s effect was analyzed based on the basilar membrane’s displacement, which is reliable for evaluating IMEHD performance. The result could help the surgeon choose a piezoelectric transducer and aid the designer to optimize the piezoelectric transducer.

2. Materials and Methods

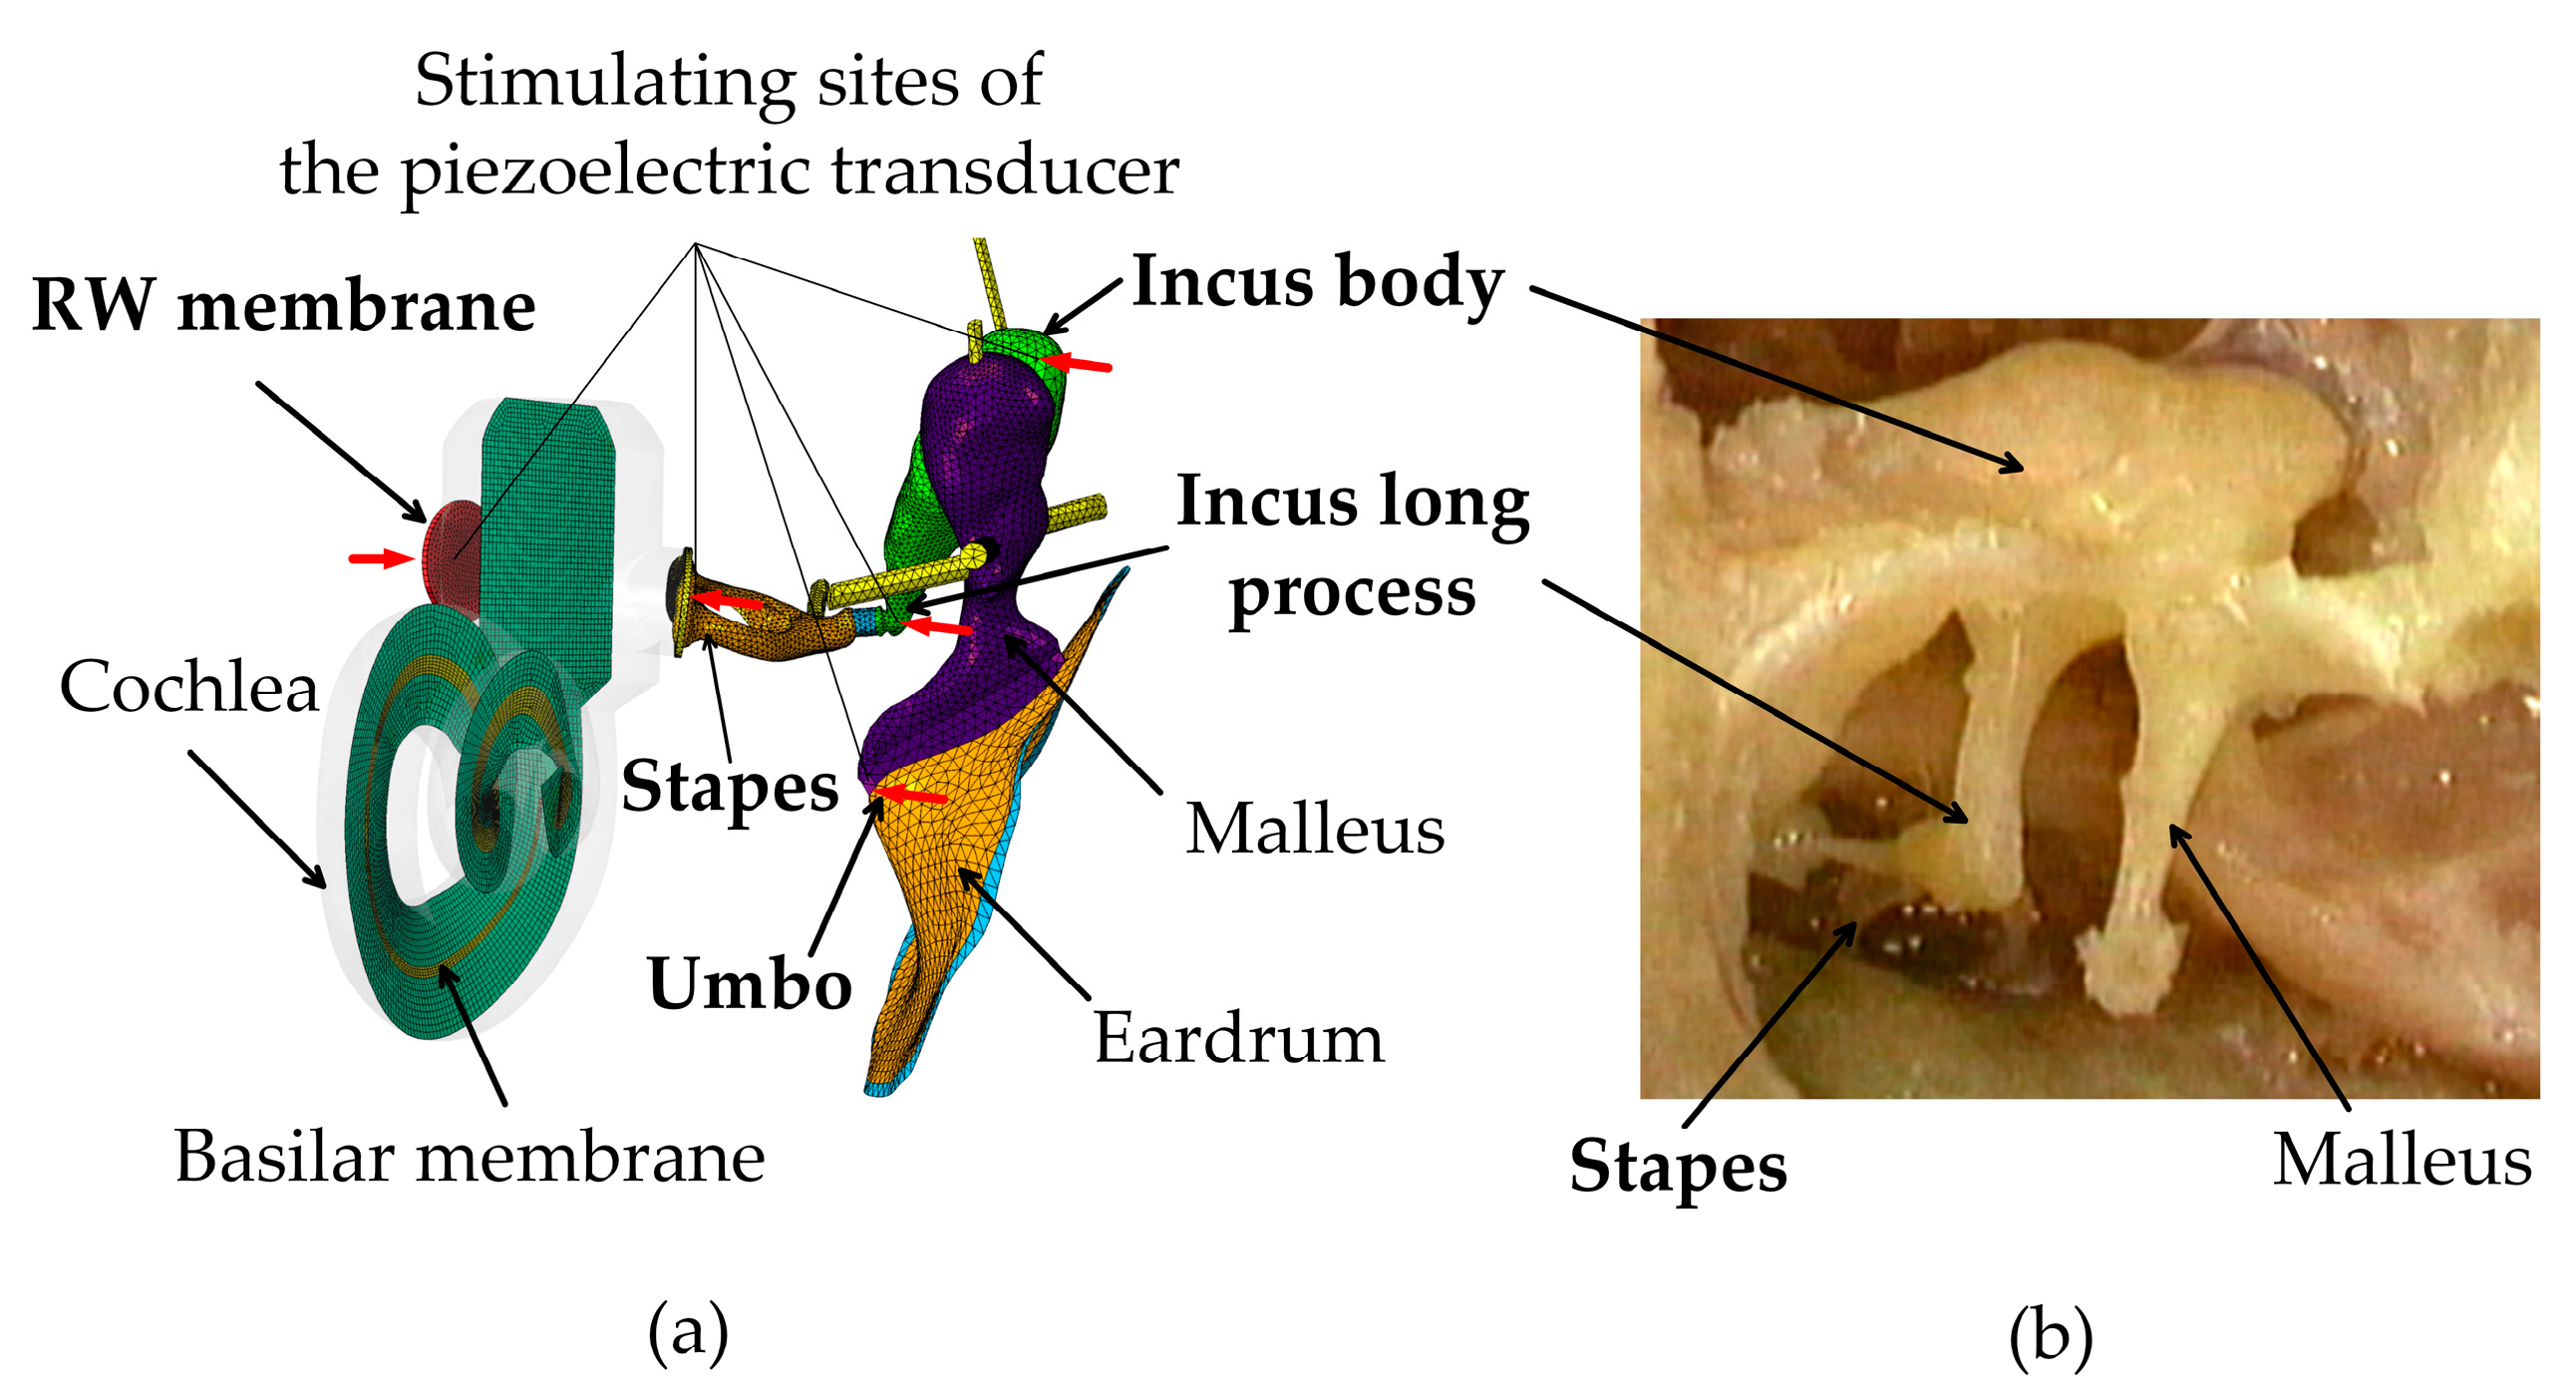
2.1. Constructions of the Human Ear FE Model

A 3D FE model of the human ear was built using CT scanning and reverse modelling techniques based on a fresh human temporal bone specimen. Figure 2 shows the constructed model, consisting of the external ear canal, the middle ear (middle ear cavity, ossicular chain, and supporting ligaments and tendons), and the cochlea. The middle ear was separated from the external ear canal by the eardrum. The ossicular chain (malleus, incus, stapes and the joints) was connected to the wall of the middle ear cavity by the ligaments and tendons. The air in the middle ear cavity and the ear canal was meshed by acoustic tetrahedral elements, with a total of 277,863 elements. The eardrum was divided into the eardrum pars tensa and the eardrum pars flaccida. The eardrum pars tensa was established as a three-layer structure [20]. The inner layer and outer layer of the pars tensa was assumed to be isotropic, while the middle layer of the pars tensa was assumed to be orthotropic, with fibers in circumferential and radial directions. The eardrum pars tensa’s inner layer, middle layer, and the outer layer had a thickness of 0.017 mm, 0.016 mm, and 0.017 mm, respectively. The thickness of the eardrum annulus ligament and the eardrum pars flaccida were 0.2 mm and 0.1 mm, respectively. A total of 1939 three-noded shell elements were created to mesh the eardrum. The other middle ear structures were meshed by 45,609 four-noded tetrahedral elements.
The middle ear connects to the spiral cochlea with the stapes footplate attached to the oval window. The model’s cochlea consists of two fluid-filled chambers: the scala vestibuli (SV) and the scala tympani (ST). These chambers were separated by the basilar membrane (BM) and the bony spiral plate. A total of 361,589 four-noded acoustic tetrahedral elements were created to mesh the fluid in the cochlea. The BM and the bony spiral plate were meshed by 7666 shell elements. The BM thickness and width vary approximately linearly from the base of the cochlea to the apex of the cochlea. The BM length is 34 mm. The thickness of the BM varies from 5.2 μm to 0.6 μm, and the width varies from 0.1 mm to 0.5 mm. The round window membrane was meshed by 851 three-noded tetrahedral elements. The RW membrane has a thickness of 0.1 mm and an area of 2 mm2, which is close to the size of 2.08 mm2 reported by Atturo et al. [21].
Considering the ligaments and tendons connect to the bony wall of middle ear cavity, we fixed the end nodes of these components in our FE model. The surfaces of the acoustic elements, which attached to the bony wall in the ear canal, the middle ear cavity, and the cochlea, were defined as rigid walls. The outer edges of the round window membrane and the cochlear spiral plate were set as fixed constraints since they are anchored to the bony wall of the cochlea. Fluid structure interfaces were defined for the surfaces of the acoustic elements attached to the movable structures, i.e., the eardrum, the ossicles, the ligaments, the tendons, the oval window, the BM, and the round window membrane.

2.2. Material Properties

The middle layer of the eardrum pars tensa and the BM were assumed to be orthotropic. Other components of the FE model were assumed to be isotropic. Poisson’s ratios were assumed to be 0.3 for all components in the middle ear. The material properties of each component of the middle ear in the FE model were mainly referred to Gentil et al. et al. [20] and Zhang et al. [22], as listed in Table 1.
The components of the middle ear and the cochlea were modelled as elastic properties, except for the eardrum, eardrum annulus ligament, incudostapedial joint, incudomallear joint, stapedial annulus ligament, and RW membrane, which were modelled as linear viscoelastic materials. The Rayleigh damping was specified for the elastic components. The Rayleigh damping parameters were taken as α = 0 s−1, β = 0.0001 s [23]. The relaxation modulus of the linear viscoelastic materials was expressed as Equation (1):
E ( t ) = E 0 ( 1 + e 1 exp ( t τ 1 ) )
where E0, e1, and τ1 were viscoelastic parameters with constant values for each type of soft tissue, and t is the time. E0 is the elastic modulus listed in Table 1. e1, and τ1 are listed in Table 2. The viscoelastic parameters were referenced to Zhang et al.’s report [24]. These parameters were obtained by dynamic material tests on these components and the cross-calibration method.
The BM is assumed to be the anisotropic membrane with a density of 1200 kg/m3. The stiffness of BM was decreased from the base to the apex. The BM’s longitudinal modulus was assumed as 600 MPa at the base, linearly decreased to 10 MPa at the apex along the BM length. Similarly, the transverse modulus and the vertical modulus of the BM decrease linearly from 6 MPa, and 12 MPa at the base to 0.1 MPa, and 0.2 MPa at the apex, respectively. The density of the RW membrane was set to 1200 kg/m3 with an elastic modulus of 2.32 MPa [25]. The bulk modulus of the cochlear fluid and the air in the external ear canal and the middle ear cavity were set as 2250 MPa and 0.142 MPa, respectively. The viscosity of the cochlear fluid is 0.001 Ns/m2 [22].

2.3. Piezoelectric Transducer Simulation

Since the purpose of this paper is to study the stimulating site’s influence rather than the piezoelectric transducer’s structural design, we simplified the piezoelectric transducer as an ideal displacement-driven transducer. This idealized representation of the piezoelectric transducer is possible as small displacements and forces are required for hearing compensation in IMEHDs [18]. Based on this simplification, a displacement excitation with the magnitude of 0.1 μm was applied at the commonly used stimulating sites, i.e., the eardrum’s umbo, the incus long process, the incus body, the stapes, and the RW membrane, respectively. The magnitude of the applied displacement excitation was ascertained as it can produce a sound pressure level equivalent to 100 dB, which is a design criterion for an IMEHD transducer [4]. The stimulating sites were plotted in Figure 3. When stimulating the eardrum’s umbo, the incus long process, the incus body, the stapes, and the direction of the applied displacement excitation was along the longitudinal axis of the stapes, which is efficient for IMEHD stimulation [18]. For stimulating the round window membrane, the excitation’s direction was normal to the surface of the round window membrane. Under these forces’ stimulation, harmonic analysis was conducted over the frequency range of 0.25–6 kHz using the finite element software package ABAQUS (Dassault Systèmes, Johnston, RI, USA).
The surgical procedure, e.g., the transmastoidal approach for the piezoelectric transducer’s implantation, will possibly change the direction of the excitation. To study the stimulating site’s sensitivity to the direction changes of their excitations, the excitations were also applied in different directions at each stimulating site with the same magnitude of 0.1 μm. For stimulating the ossicular chain (umbo, incus long process, incus body, stapes), the reference direction was along the stapes’ longitudinal axis. The other directions are defined by rotating the direction relative to the reference direction in the plane based on the longitudinal axis and the long axis of the stapes’ footplate. The rotation is 20°, 45°, and 60° off the reference direction to crus posterior (20°, 45°, and 60° to CP). For stimulating the RW membrane, the reference direction is the normal direction of the RW membrane. The other directions are rotated 20°, 45°, and 60° off the reference direction.

2.4. Equivalent Sound Pressure Level

The sound transmission property via normal air conduction is different from that by a piezoelectric transducer’s stimulation. Considering the basilar membrane inside the cochlea is responsible for sensing the input vibration energy, we used its response to assess the transducer’s hearing compensation performance.
The vibration transmitted into the cochlea propagates in the form of a traveling wave from the base to the apex along the basilar membrane. For excitations of different frequencies, the maximum amplitude position of the traveling wave formed on the basilar membrane is different, with high frequencies maximally activating basal regions of the BM and low frequencies maximally activating apical areas of the BM. For a specific frequency excitation, the position of the basilar membrane that is most responsive in the longitudinal direction is referred to as the characteristic place of this frequency. The frequency is called the characteristic frequency of that position on the basilar membrane. The cochlea senses a pure tone sound of a specific frequency through its corresponding characteristic place along the basilar membrane. Therefore, in order to make the sound-perceived effect of the transducer’s stimulation of a specific frequency equivalent to that excited by normal sound stimulation (sound pressure applied at the eardrum), the displacements of the BM’s characteristic place of the frequency under the two excitations should be equal.
Based on above principle, in the normal sense of sound, when a sound with the frequency of ω and amplitude of PE is applied at the eardrum, its stimulated BM displacement at the characteristic place x CF is d BM ac ( ω , x CF ) :
d BM ac ( ω , x CF ) = T F d ac ( ω ) · P E
where T F d ac ( ω ) is the transfer function of the normal human ear sensation from the pressure applied at the eardrum to the displacement of the basilar membrane. The human ear functions as a linear system under the normal acoustic sound pressure excitation [26]. Therefore, based on the model-calculated basilar membrane’s displacement under 100 dB SPL sound stimulation applied at the eardrum, we can obtain the transfer function:
T F d ac ( ω ) = d BM ac 100 ( ω , x CF ) 2 × 10 5 × 10 100 20 .
Under the excitation of the ideal piezoelectric transducer, its stimulated BM displacement at the characteristic place d BM piezo ( ω , x CF ) can be calculated by the FE model. Since the basilar membrane vibration is responsible for transmitting the input energy to hair cells, the transducer-stimulated effect is equivalent to that excited by a normal acoustic stimulation P E applied at the eardrum, which produces the same displacement amplitude d BM ac ( ω , x CF ) at the characteristic place of the basilar membrane:
d BM piezo ( ω , x C F ) = d BM ac ( ω , x CF ) = T F d ac ( ω ) · P E = d BM ac 100 ( ω , x CF ) 2 × 10 5 × 10 100 20 · P E .
Based on Equation (4), the transducer’s corresponding equivalent sound pressure P E applied at the eardrum can be derived as
P E = d BM piezo ( ω , x C F ) d BM ac _ 100 ( ω , x CF ) × 2 × 10 5 × 10 100 20 .
Thus, the performance of the transducer’s excitation can be evaluated by L EQ , which is the equivalent sound pressure level (ESPL) of the piezoelectric transducer:
L EQ = 20 log P E 2 × 10 5 = 100 + 20 log ( d BM piezo ( ω , x CF ) d BM ac _ 100 ( ω , x CF ) ) .

3. Results

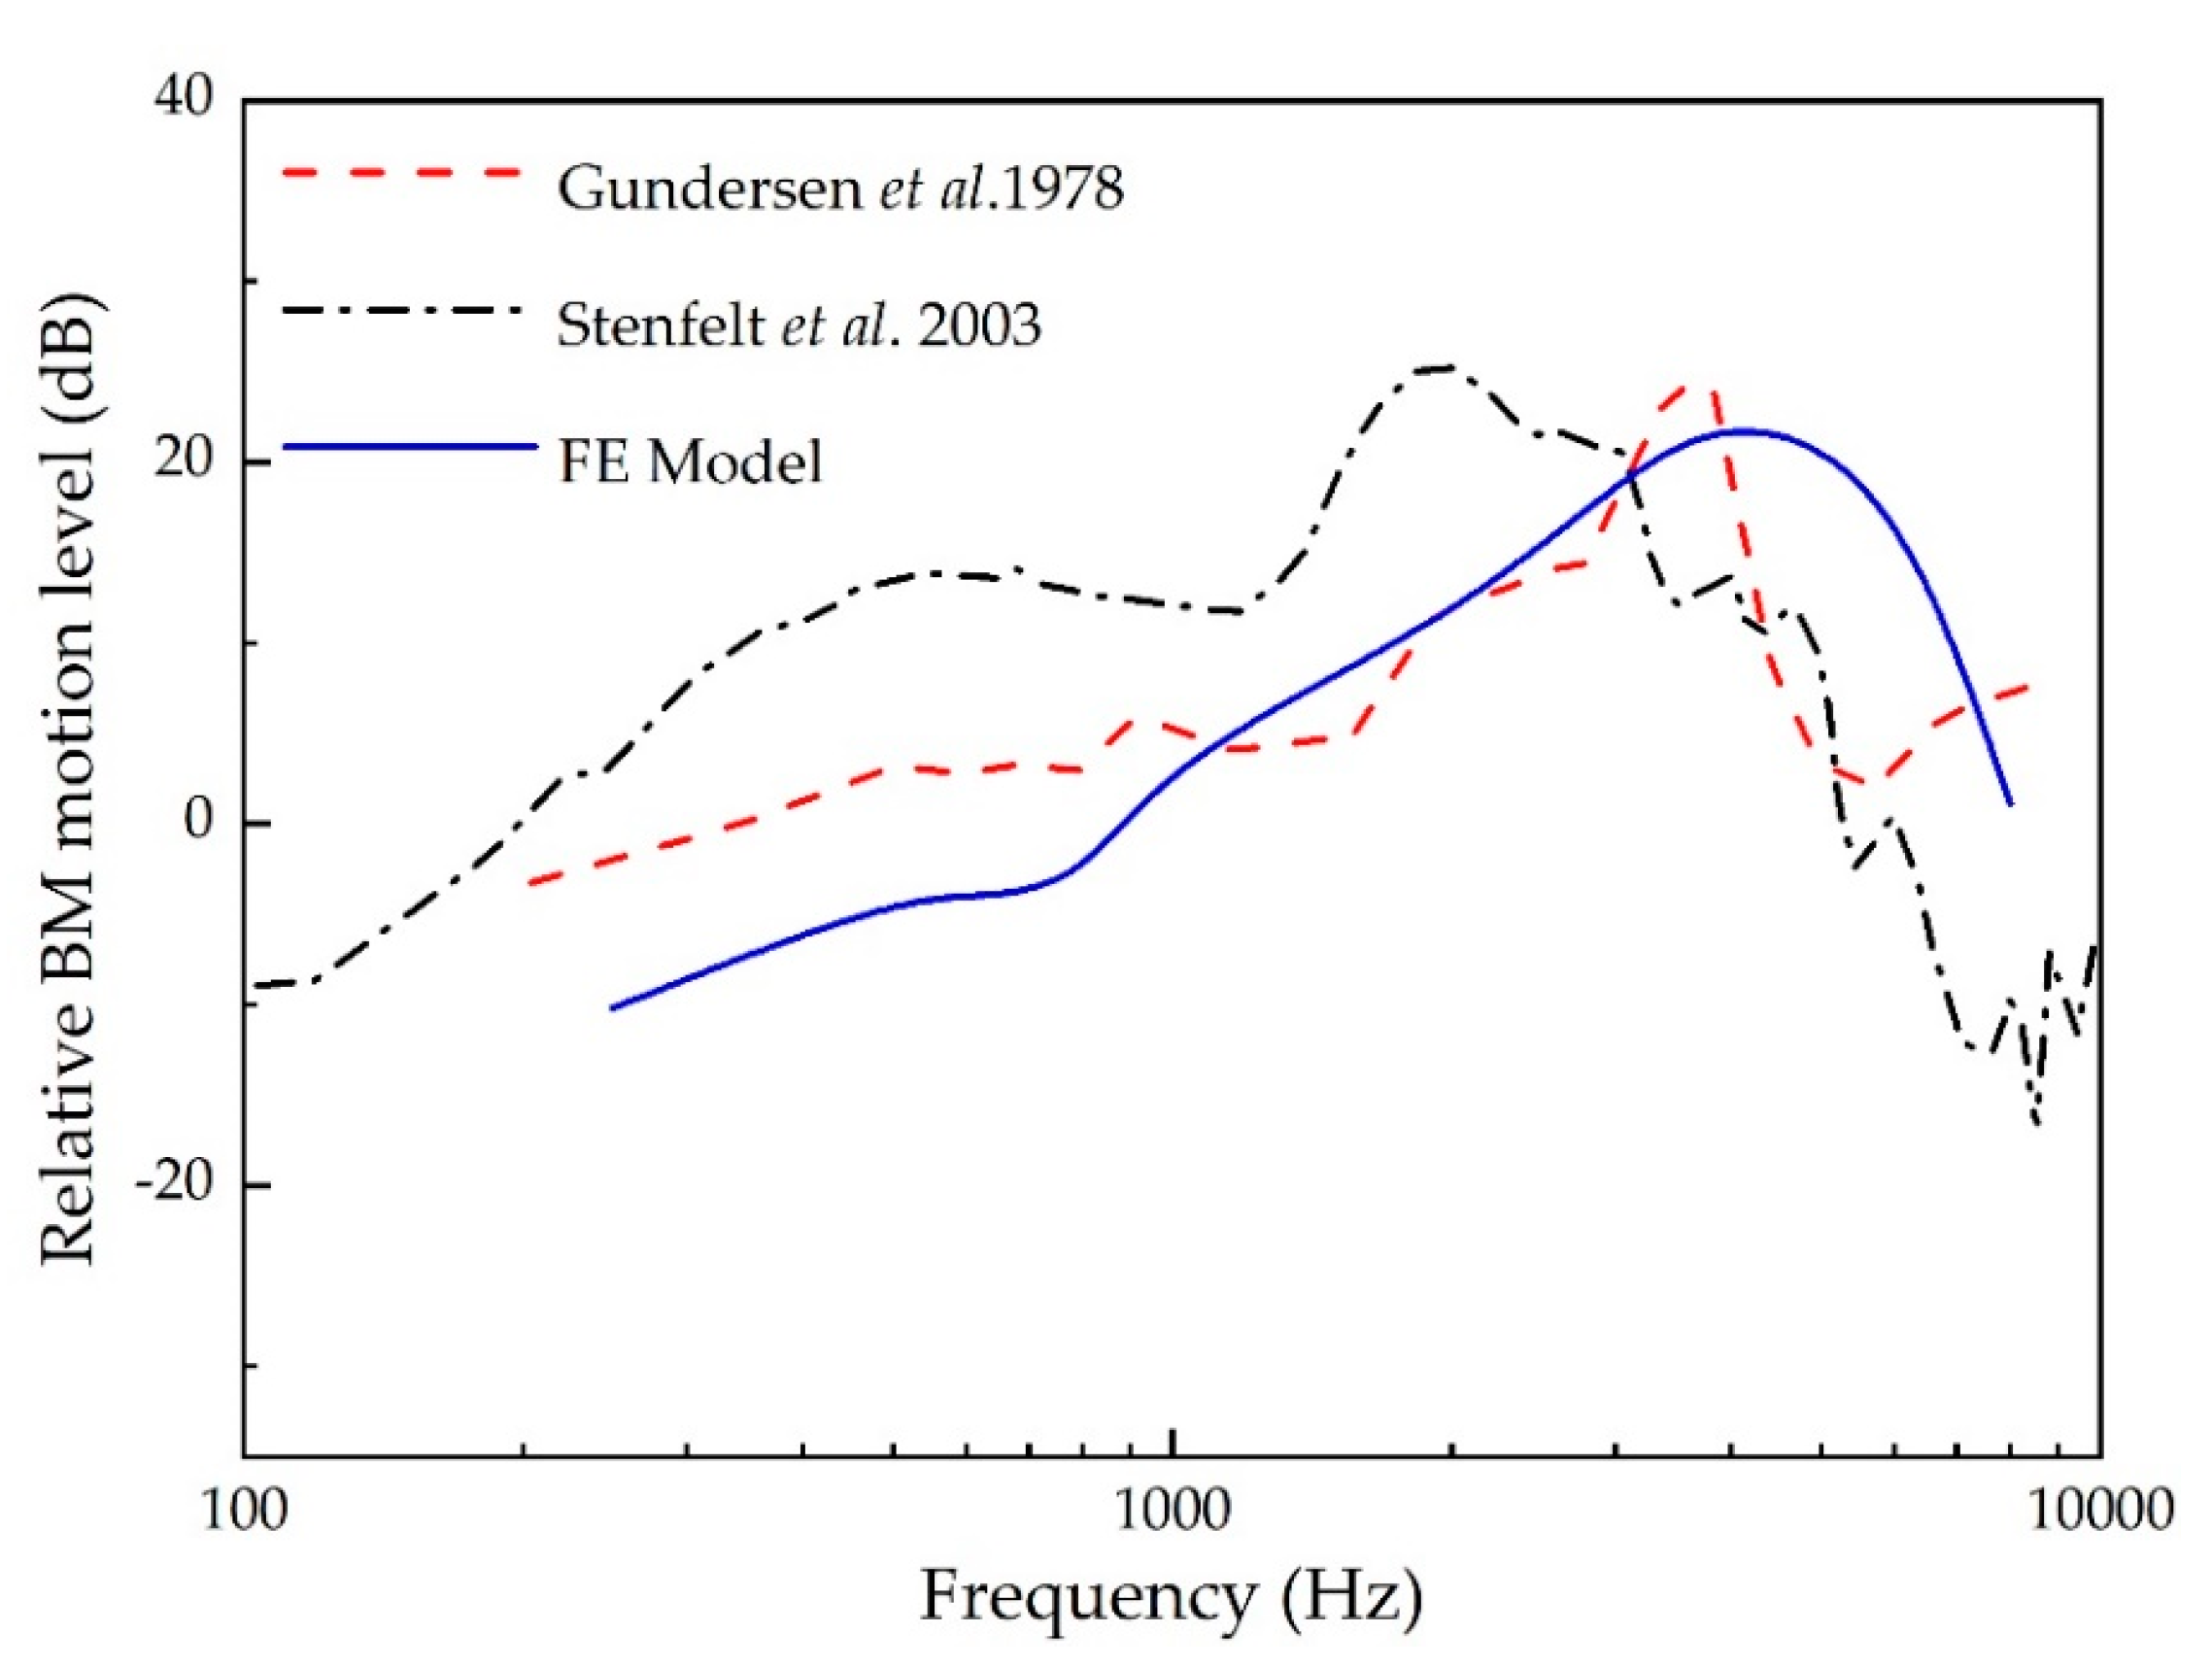
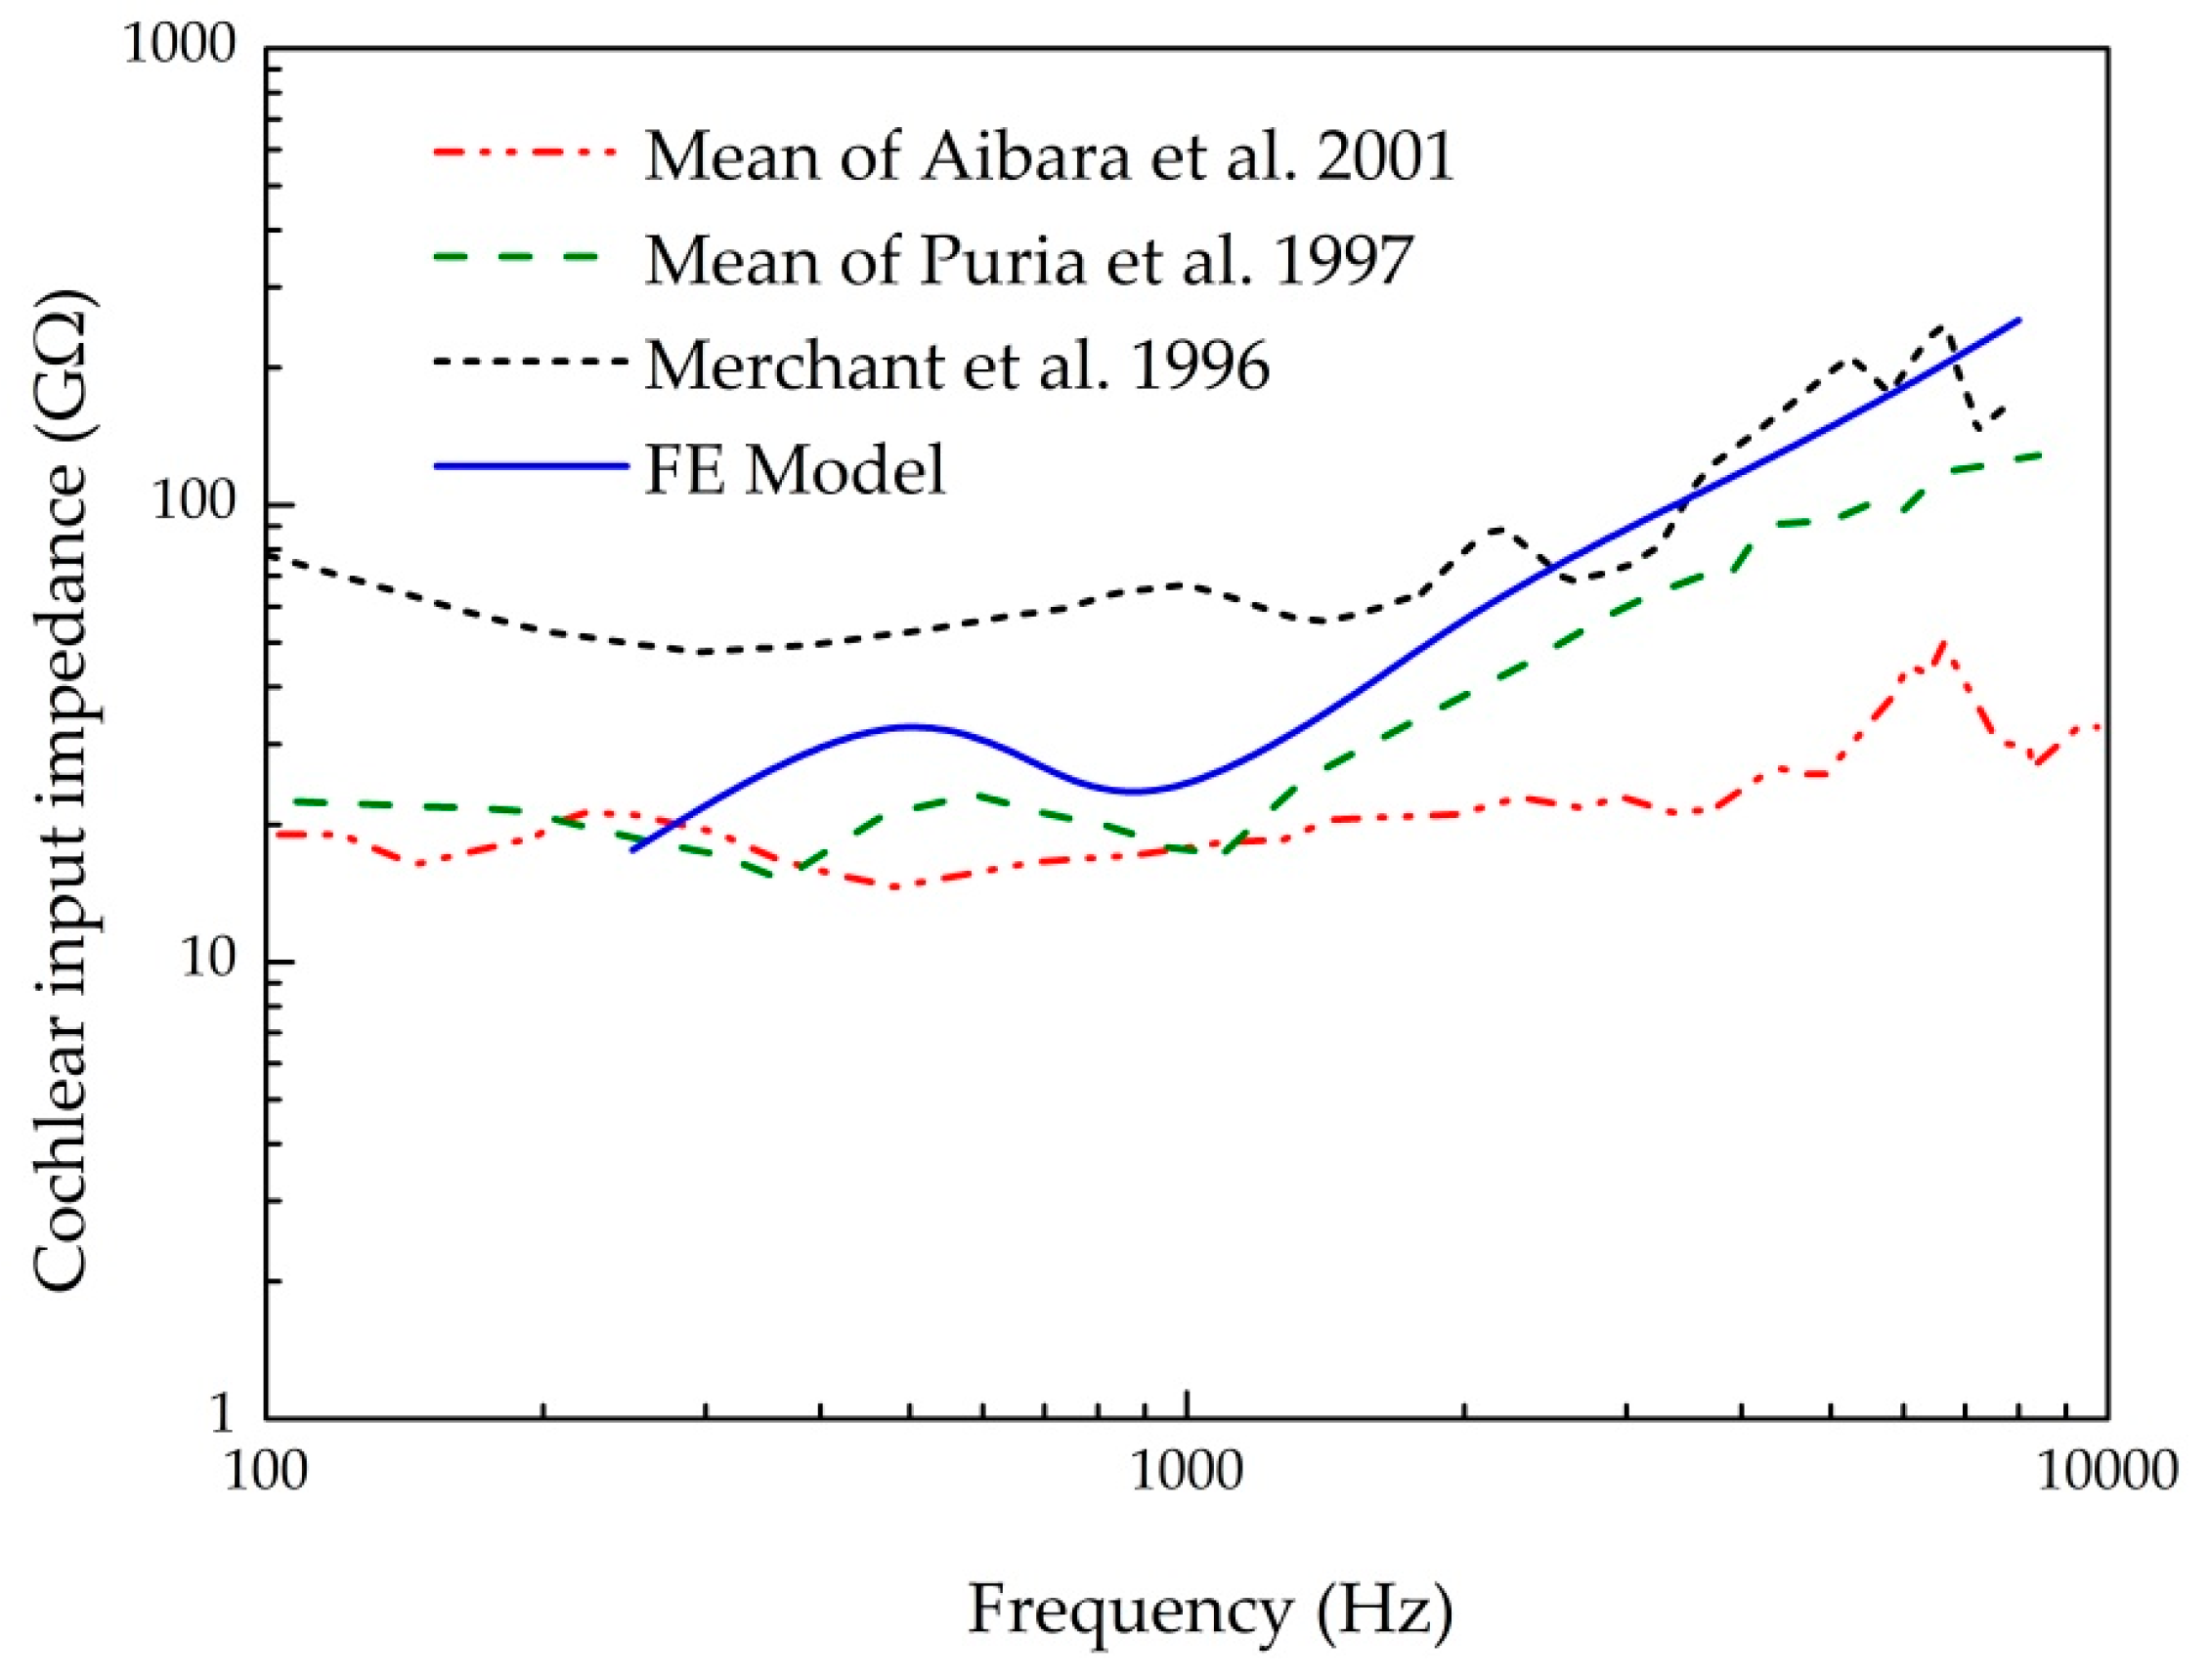
3.1. Validation of the Human Ear Finite Element Model

To confirm the validity of the established human ear finite element model, three sets of comparisons with the published experimental data were conducted. Since the stapes response is the input of the cochlea, we firstly selected the stapes’ footplate displacement to verify our model. Figure 4 shows the mean value of experimental measurements on five temporal bones reported by Gan et al. [27]. In this experiment, a set of pure tone sounds of 90 dB SPL were applied to the eardrum, and the displacement of the stapes footplate was measured using a laser vibrometer. For comparison, we carried out a harmonic analysis across the frequency range of 250–8000 Hz under the same sound pressure applied to the lateral side of the eardrum of our FE model. The model-predicted result was also plotted in Figure 4. It demonstrates that our model-derived displacement of the stapes footplate agrees well with the experimental curve.
The BM’s response was also selected for our model’s validation as it responsible for sensing the cochlear input vibration. Figure 5 displays the experimental curves of the ratio of the BM’s velocity at 12 mm from the stapes to the stapes’ velocity. The experimental tests were conducted by Gundersen et al. [26] and Stenfelt et al. [28] with a 90 dB SPL input sound pressure applied to the eardrum. Similarly, with a uniform sound pressure applied at the lateral side of the eardrum in our model, a harmonic analysis was conducted across the frequency range of 250–8000 Hz. The model-calculated result was plotted with the experimental curves in Figure 5. It shows that the maximum peak appears at 3500 Hz, which conforms to the experimental data of Gundersen et al. [26]. Besides, our model-predicted result has the same trend as Stenfelt et al.’s [28] data.
Finally, we compared the model-derived cochlear input impedance, which is a measure to represent the cochlear resistance of transmitted vibration from the middle ear, with the experimental data measured by Aibara et al. [29], Puria et al. [30], and Merchant et al. [31], as shown in Figure 6. The cochlear input impedance was calculated from the ratio of the pressure in the SV to the stapes volume velocity (product of the stapes’ footplate velocity and the stapes’ footplate area). It shows that our predicted result is in the range of these experimental data, and has the same trend with these experimental data, especially the data of Puria et al. [30]. These above comparisons prove that our model can be utilized to predict the sound transmission properties of the human ear.

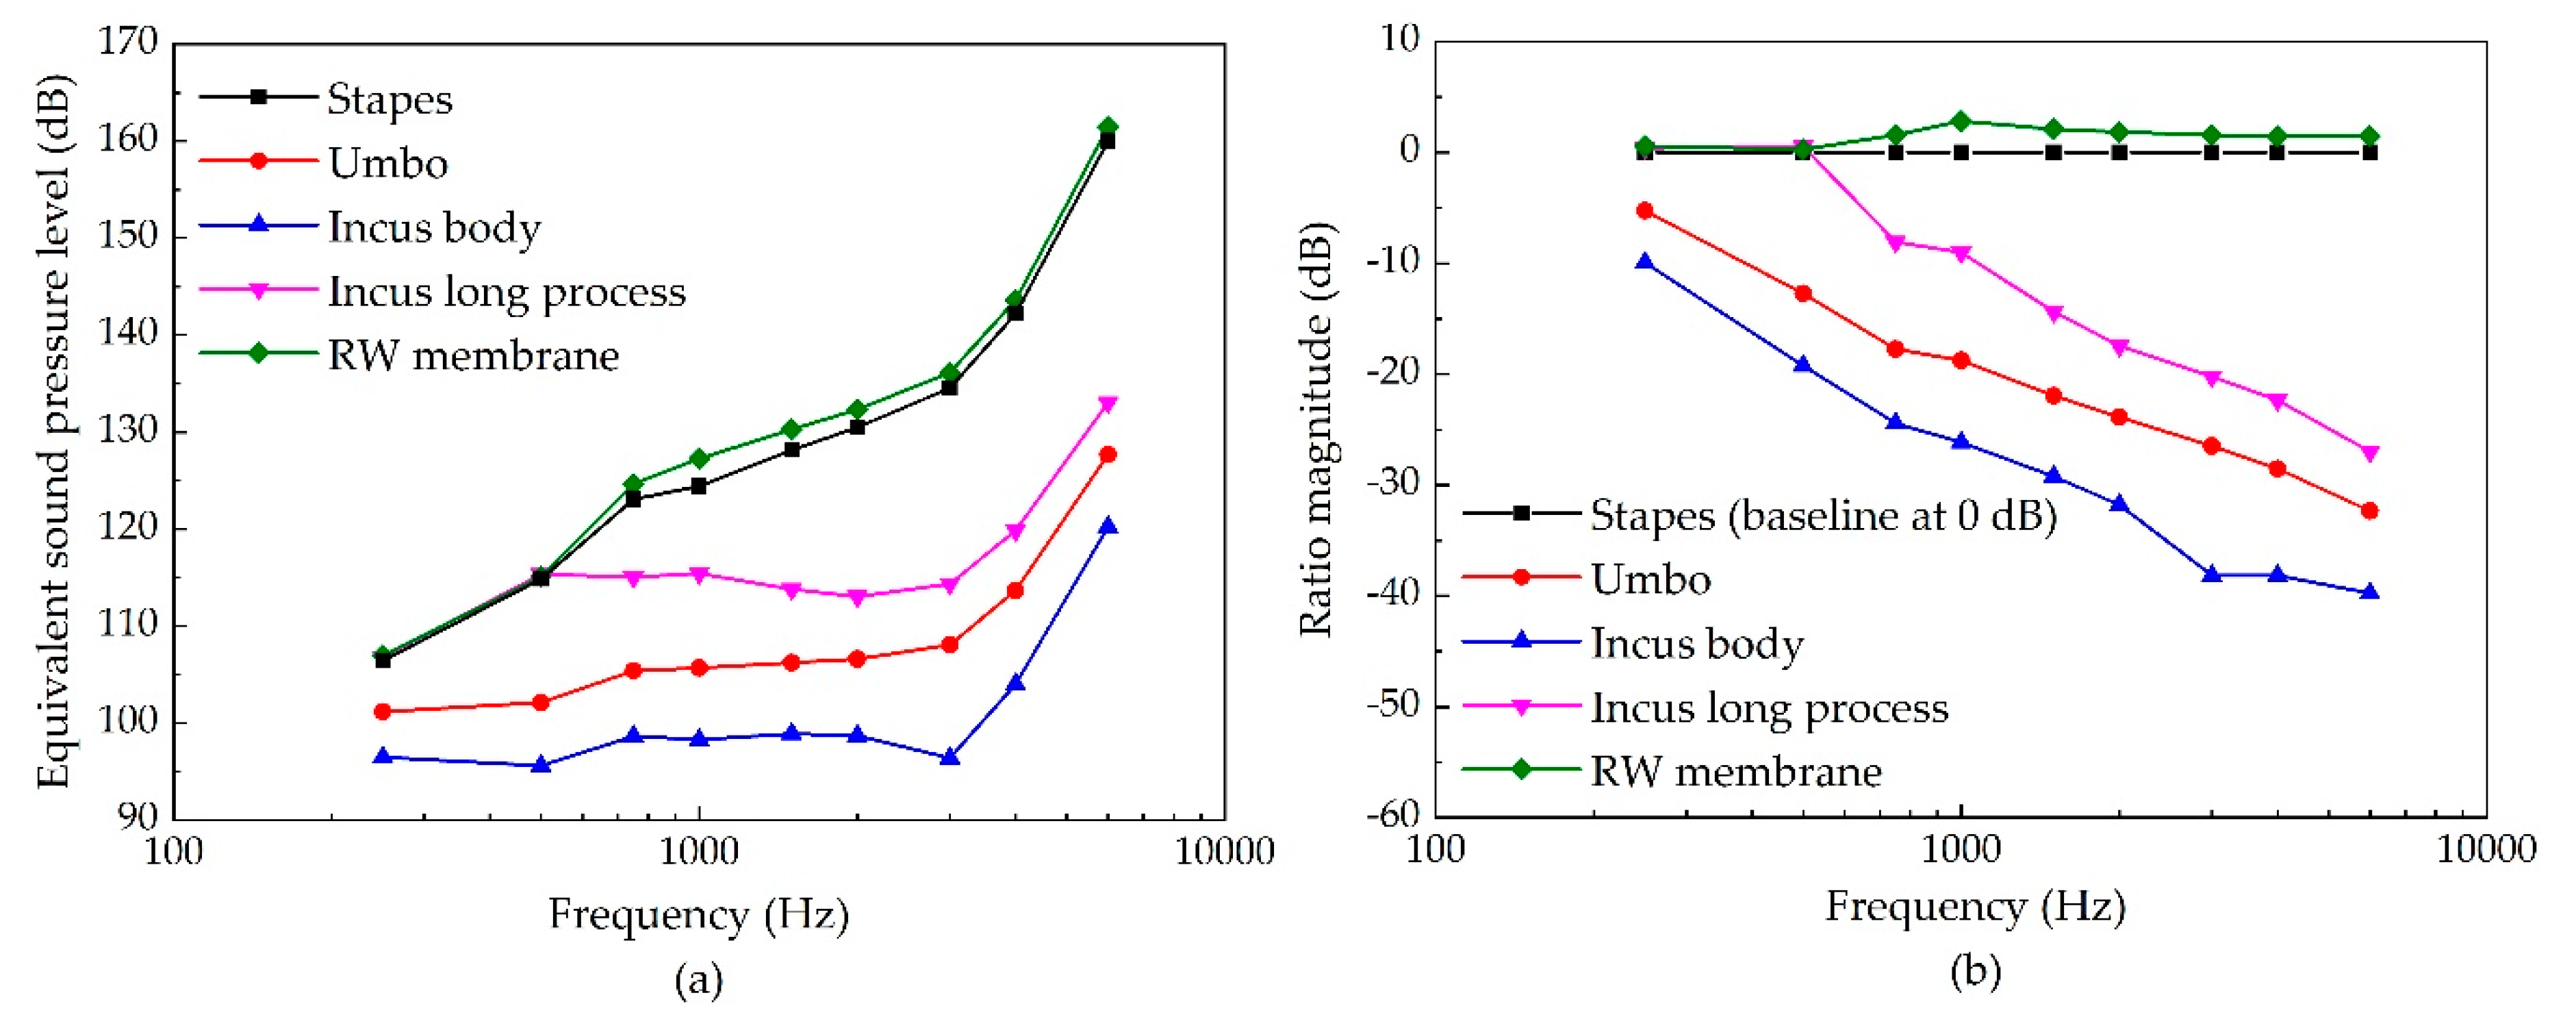
3.2. The Stimulating Site’s Influence on the Piezoelectric Transducer’s Performance

Figure 7 shows the influence of the piezoelectric transducer’s stimulating sites on its hearing compensation performance. It demonstrates that the piezoelectric transducer can produce high ESPL at high frequency no matter which sites is stimulated. Stimulating the RW membrane as well as stimulating the stapes can produce a more equivalent sound pressure level than stimulating the other sites, especially at a high frequency. Besides, the ESPL under the stimulation applied at the incus-long-process is superior to that generated by the umbo stimulation. The incus body is the worst stimulating site for the piezoelectric transducer.

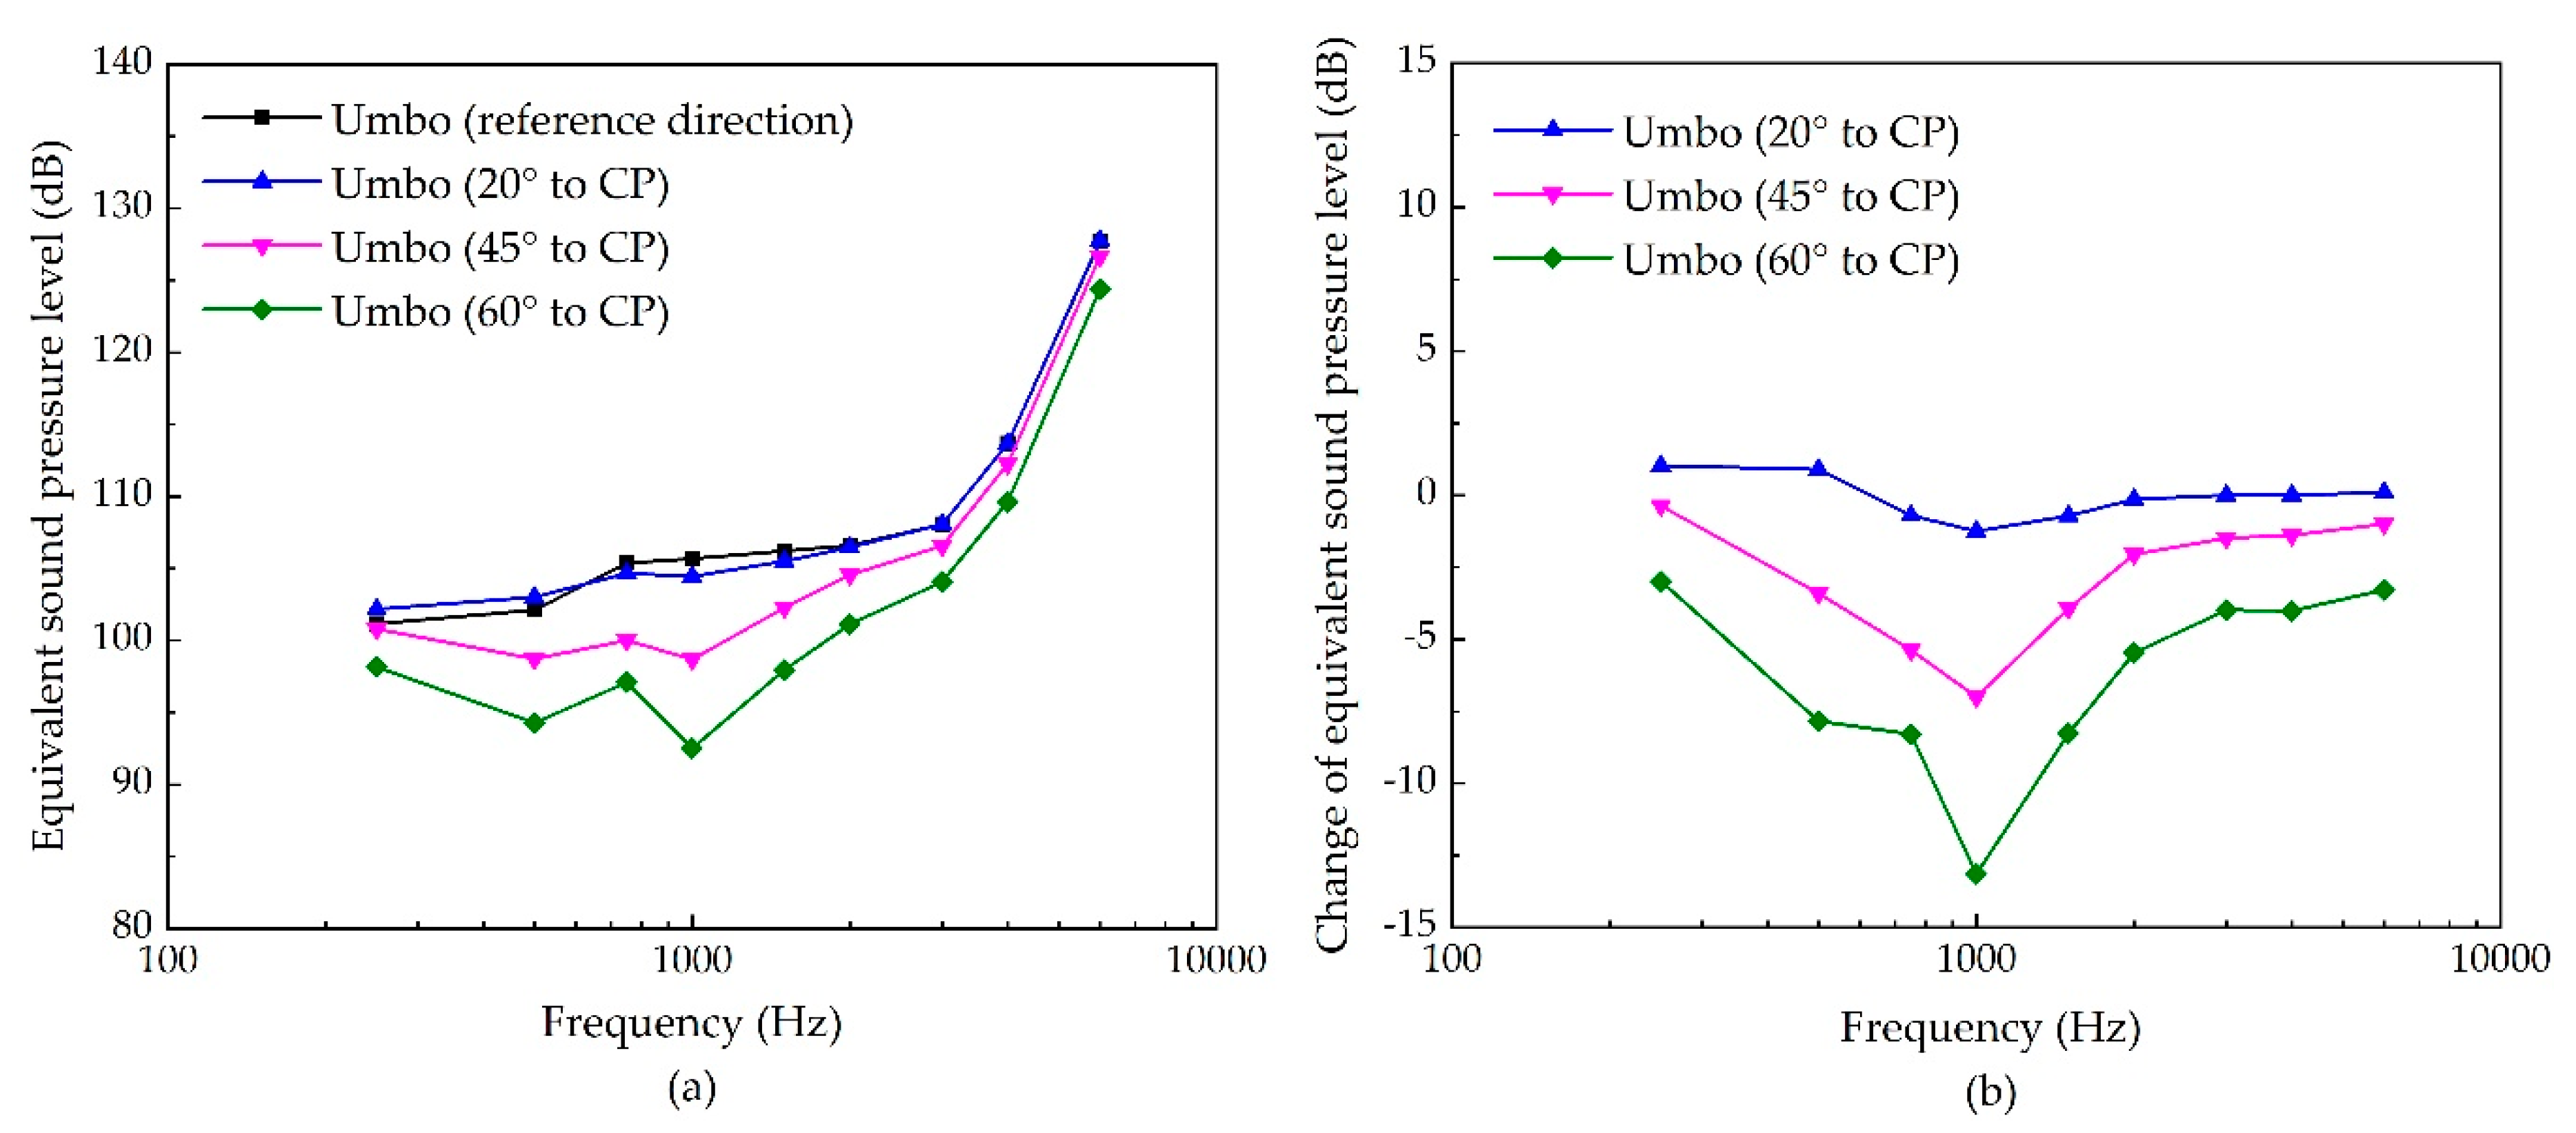
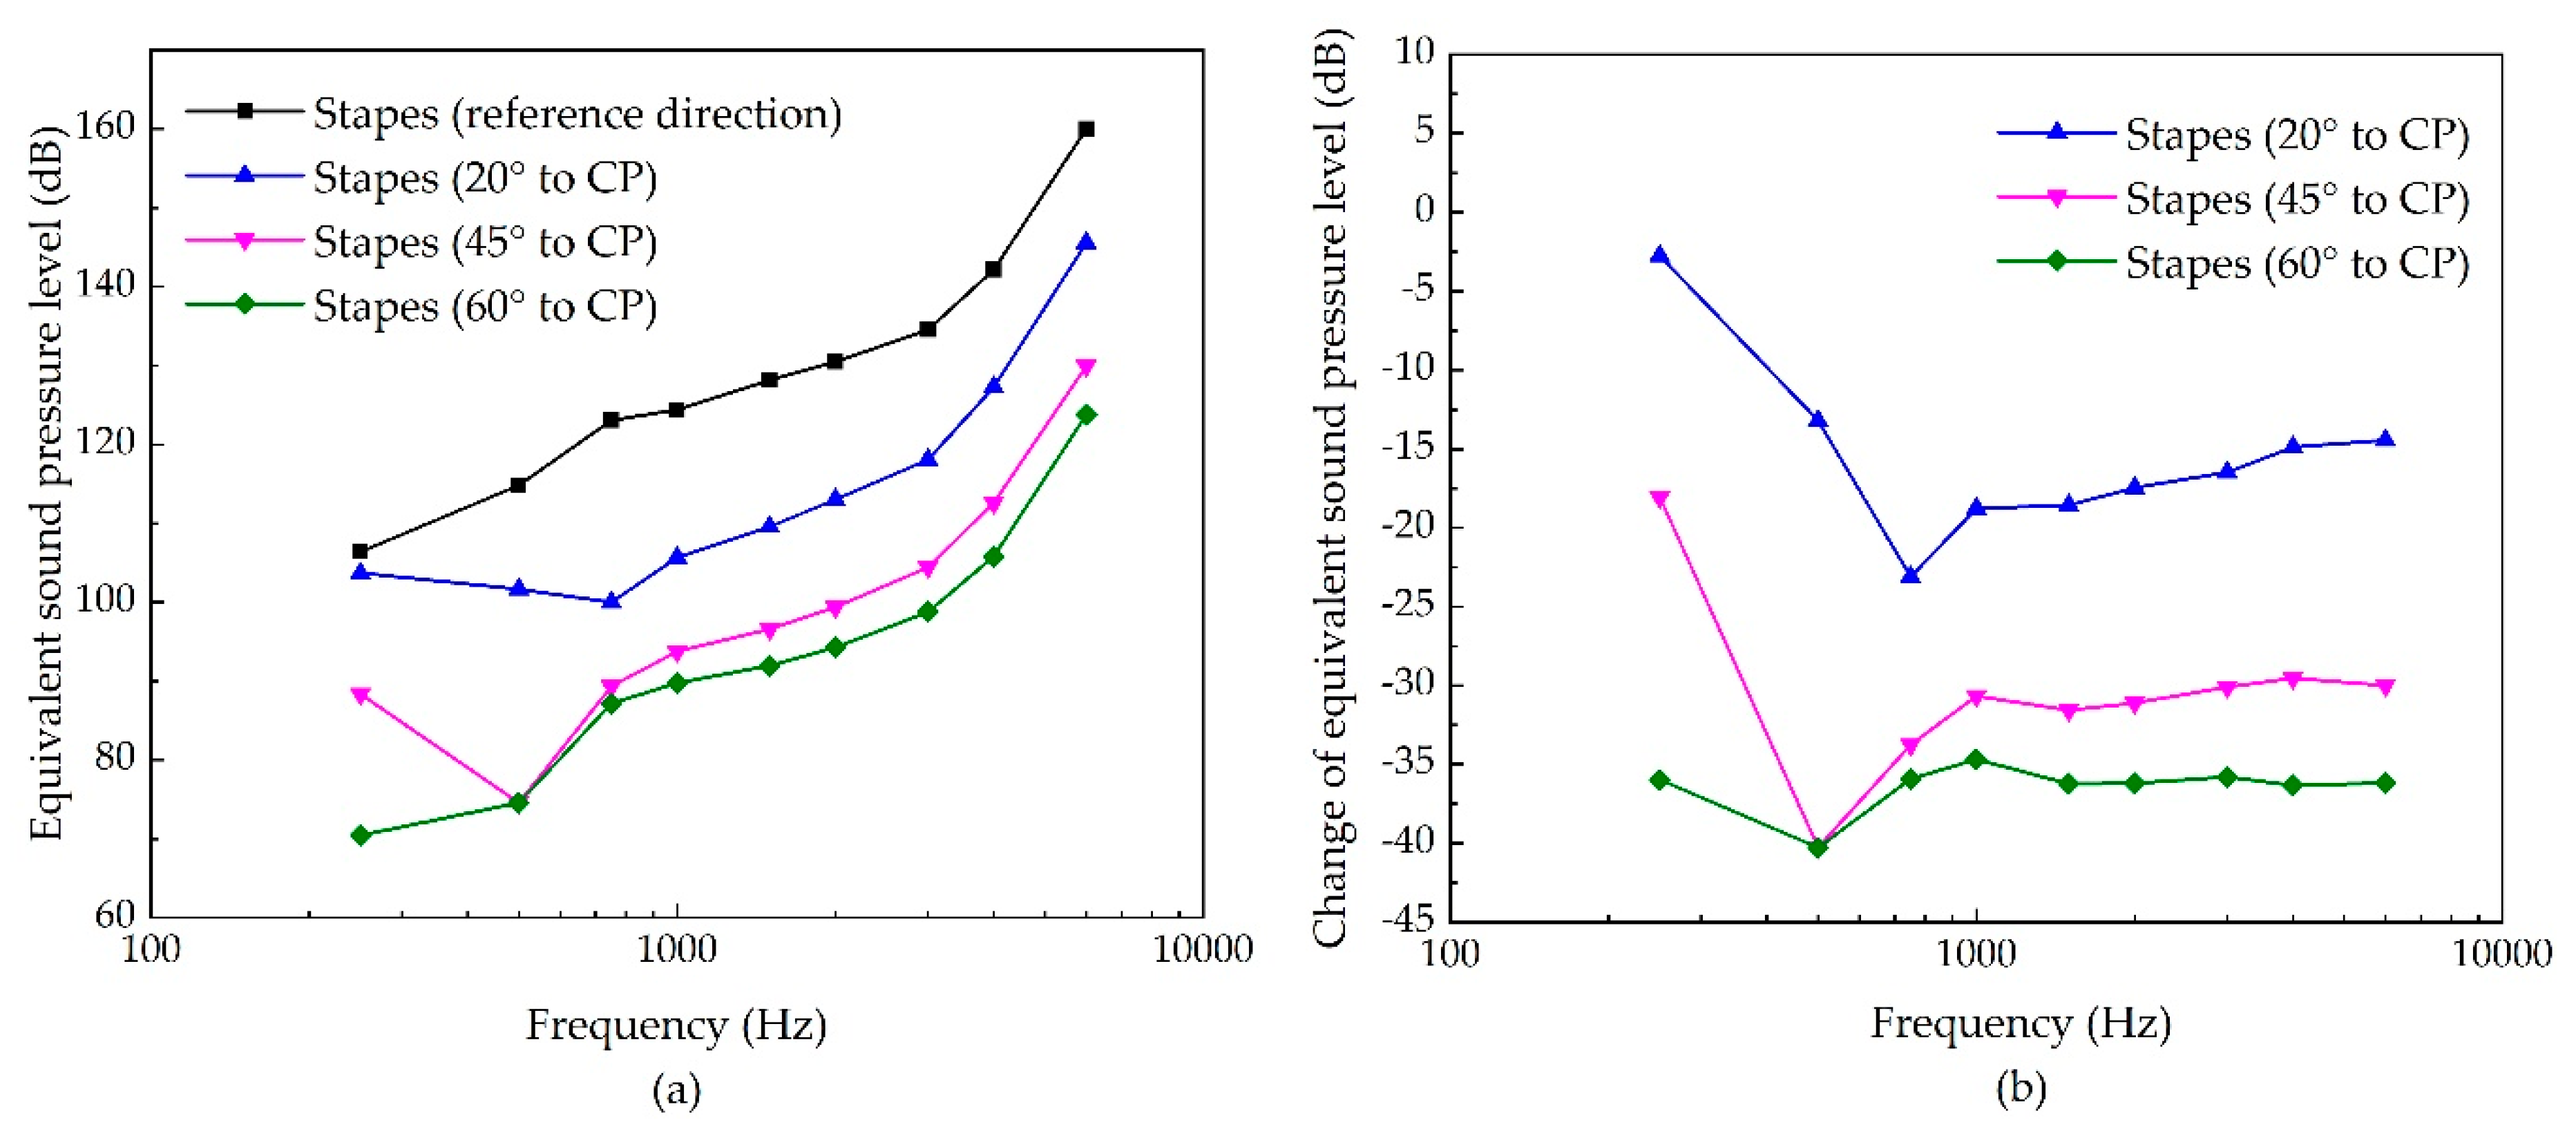
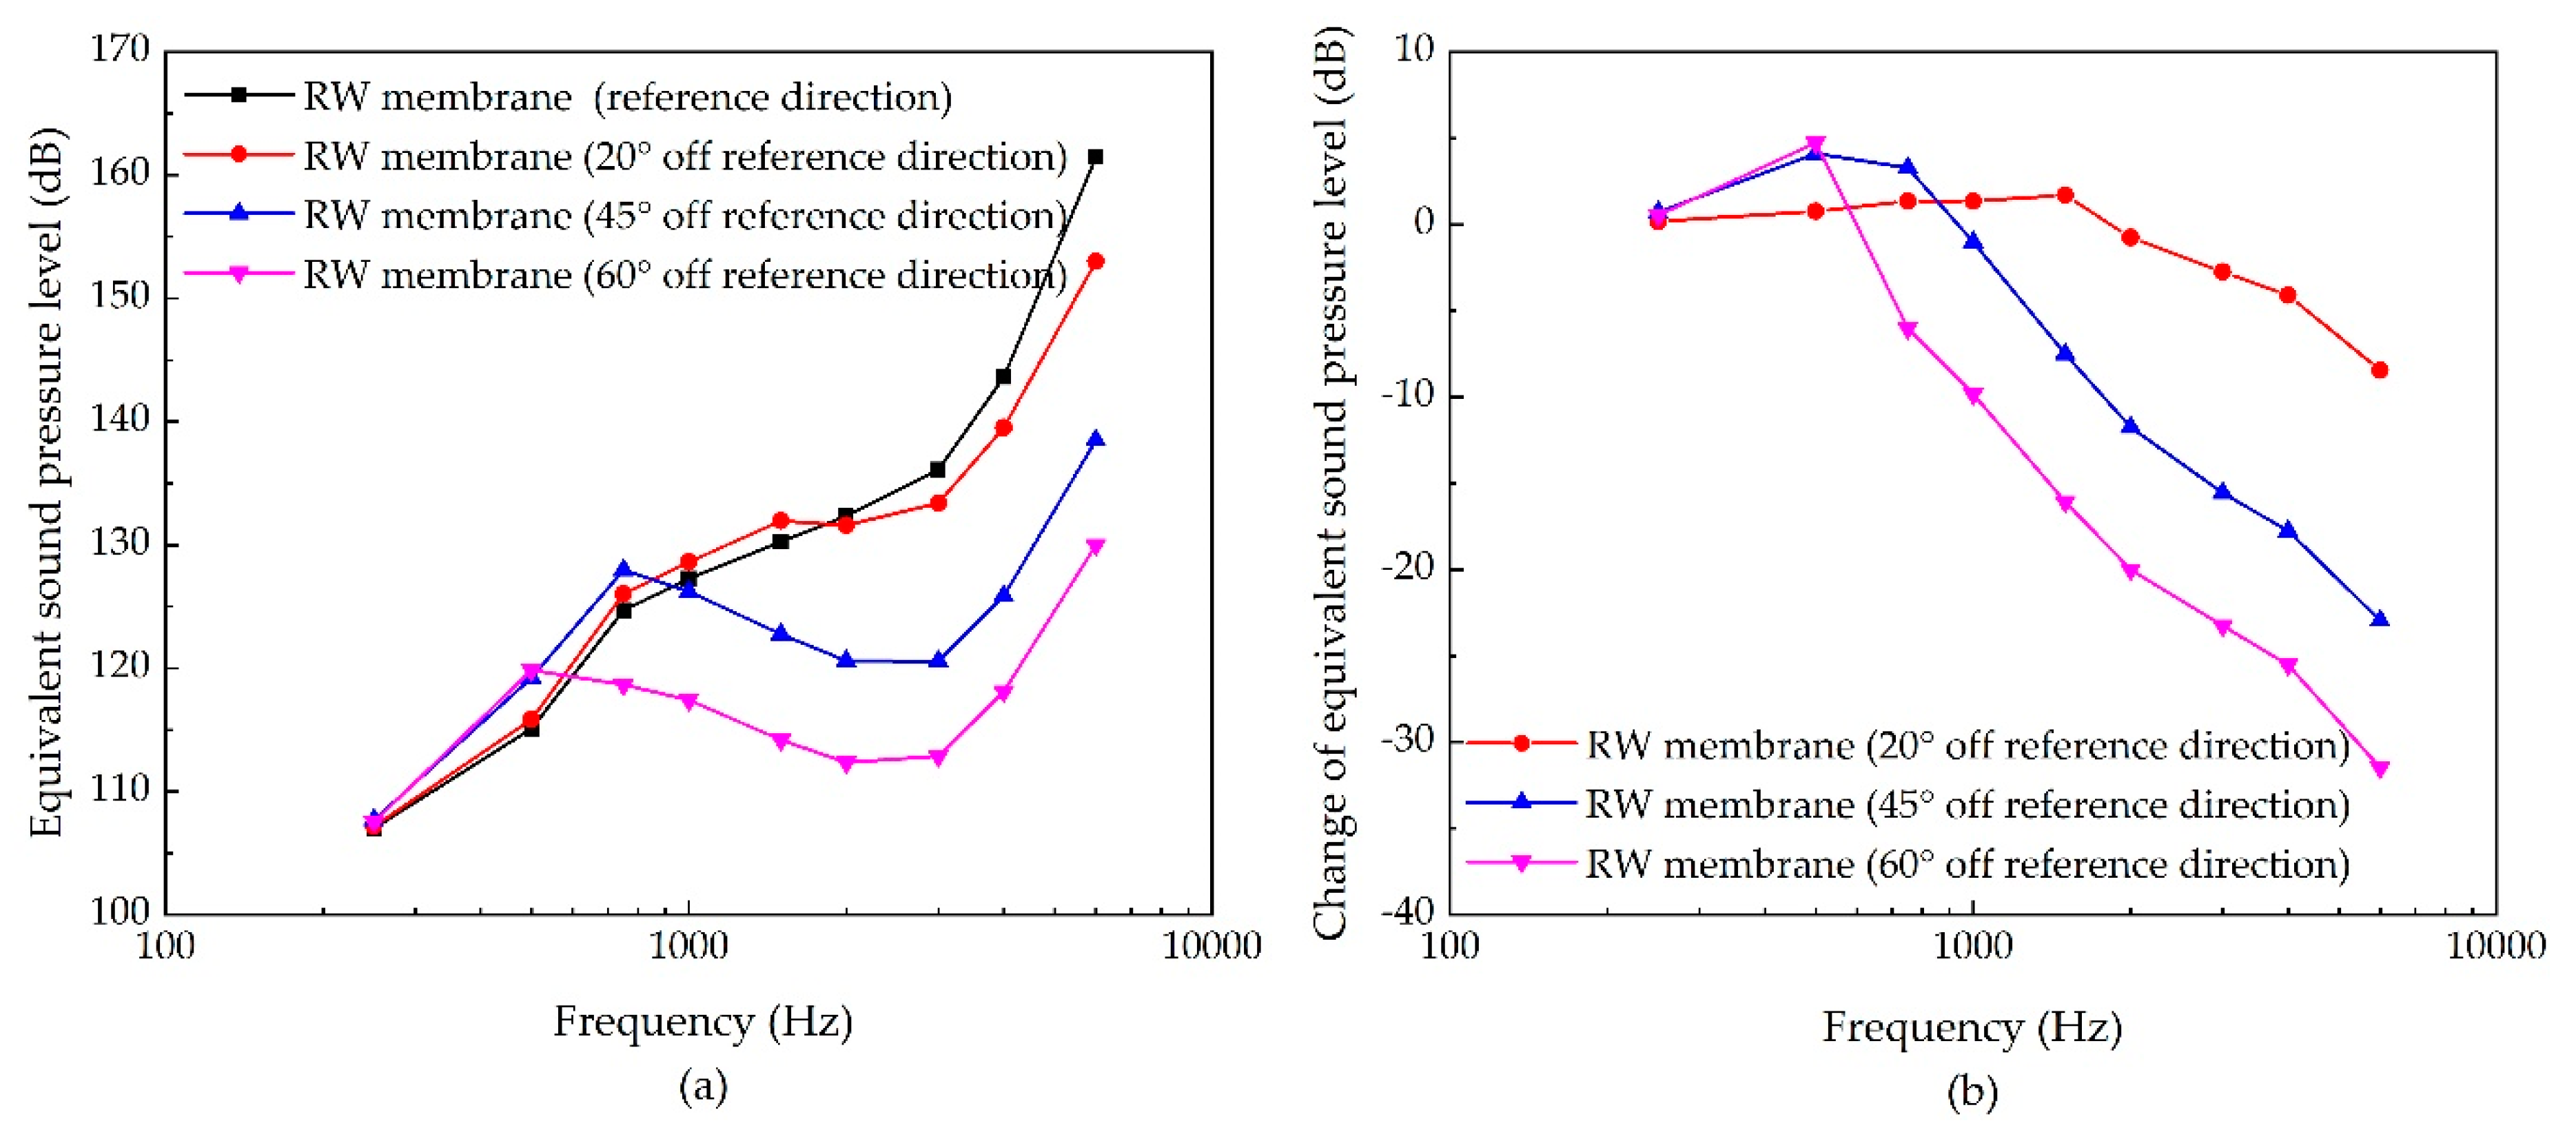
3.3. The Sensitivities of Each Stimulating Site to the Changes of Excitation’s Direction

For stimulating the eardrum’s umbo, the influence of a piezoelectric transducer’s excitation direction on its hearing compensation performance is shown in Figure 8. It indicates that the transducer’s stimulated ESPL decreases with the increase of the angle of the excitation’s inclination, especially at the middle frequency. The maximum decrease is found at 1 kHz for 60° to CP, with a reduction of 13 dB.
While the stimulating site is the incus body, the stimulation direction’s influence is shown in Figure 9. It demonstrates that the change of the stimulation direction’s influence on the transducer’s stimulated ESPL is complex in this case. Increasing the angle of the stimulation’s inclination decreases the transducer-stimulated ESPL at a lower frequency, but increases the ESPL slightly at a higher frequency. The maximum decrease is at 250 Hz for 45° to CP, with a reduction of 17 dB.
As for stimulating the incus long process, the excitation direction’s influence is shown in Figure 10. Similar to the influence in stimulating the eardrum’s umbo, the boost of the angle of the excitation’s inclination reduces the transducer-stimulated ESPL, especially at the middle frequency. The maximum decrease is also at 1 kHz for 60° to CP, with a reduction of 16 dB.
In terms of stimulating the stapes, the effect of the transducer’s stimulation direction is shown in Figure 11. It indicates that the transducer-stimulated ESPL also decreases with the increase of inclination angle. Unlike previous stimulating sites, the ESPL at a high frequency decreases significantly in this case. The maximum decrease is at 400 Hz for 60° to CP, with a reduction of 40 dB. For a high frequency region, the maximum reduction is 36 dB at 4 kHz for 60° off the reference direction.
For stimulating the RW membrane, the influence of the transducer’s stimulation direction is shown in Figure 12. It demonstrates that the increase of the inclination angle mainly reduces the transducer’s high frequency ESPL. The maximum decrease is at 6 kHz for 60° off the reference direction, with a reduction of 31 dB.

4. Discussion

Since the human ear is a complicated biological system with tiny structures and complex geometry, systematic experimental investigation on it is tough to conduct. Considering the finite element method has the advantage of simulating this complicated biological system, many researchers built a human ear FE model, and used it to study the sound transmission properties of the ear [32,33,34,35] and facilitate the design of IMEHDs [14,36,37]. In our human ear FE model, the cochlea was constructed as two fluid-filled channels. This modelling method of the cochlea is widely used in the field of cochlear mechanics [16]. Different individual human ears have similar vibration properties, and to confirm our model’s validity, we compared our model-predicted results with the mean value of the experimental results, which were measured on many human ears, to prove that our model can predict the general response of the human ear. This kind of validation has been widely used by scholars in this fields [20,23].
According to the vibrational energy transmission pathway, the implantable middle ear hearing device can be classified as forward stimulation and reverse stimulation [38]. Stimulating the eardrum, the incus body, the incus long process, and the stapes belong to forward stimulation, since their vibration energy are transmitted to the cochlea through the cochlear oval window, which is the same as the normal hearing process. Whereas, stimulating the round window membrane is called reverse stimulation as its vibration energy is transmitted to the cochlea though the cochlear round window, the other opening window of the cochlea. For the forward driving, our results demonstrate that the piezoelectric transducer provides better performance when stimulating the stapes than stimulating the eardrum’s umbo or the incus long process. The performance of stimulating the incus long process is superior to that of stimulating the eardrum’s umbo. This result can be easily predicted for forward stimulation since the stapes is close to the cochlea and therefore more efficient to transmit vibrational energy into the cochlea. Besides, we found that the superiority of the stapes stimulation is significant at high frequencies. To further analyze this phenomenon, we plot the z direction’s (along the longitudinal axis of the stapes) displacement contour plot (Figure 13) of the ossicular chain since the stapes transmits its vibration mainly through its piston motion [39]. Figure 13 shows that the stapes can be efficiently stimulated at a low frequency for all these three stimulating sites, especially for stimulating the stapes and stimulating the incus long process. With an increase in the stimulation’s frequency, the vibration cannot be effectively transmitted to the stapes for stimulating the incus long process and the umbo, especially for stimulating the umbo. This may attribute to the incudomallear joint and the incudostapedial joint, whose viscous behavior become significant at a higher frequency and weaken the vibrational energy transmission from the stimulating point to the stapes.
For the forward stimulation, the incus body is the worst stimulating site for the transducer. This result is consistent with Bornitz et al.’s report [18] based on stapes displacement. This owing to the fact that the rotation nod of the ossicular chain is close to the incus body [40]; therefore, the incus body is the least efficient point for stimulating the ossicular chain. Figure 13 also shows that most of the stimulated response are restrained around the incus body; the vibration cannot be efficiently transmitted to the stapes footplate under the incus-body stimulation, especially at a high frequency. Thus, compared with other forward stimulation, the high-frequency output should be enhanced for the incus-body simulating-type piezoelectric transducer.
Compared with forward stimulation, it is difficult to estimate the performance of the round window’s stimulation, i.e., the reverse stimulation, since its vibration energy transmission pathway is different from that of forward driving. Although comparison of the forward stimulation with the round window’s stimulation were reported [16,22], these studies only focus on the electromagnetic transducer, which is a force-driven transducer. Bornitz et al.’s study [18] demonstrates that the stimulating site’s influence for the electromagnetic transducer is different from that for the piezoelectric transducer. For the piezoelectric transducer, our study finds that stimulating the round window membrane can produce a similar ESPL as when stimulating the stapes. Regardless of which site is stimulated, the piezoelectric transducer can generate high ESPL at a high frequency. Since most sensorineural hearing loss is severe at a high frequency [41], this characteristic is a crucial advantage for the piezoelectric transducer to compensate for the hearing loss. This better high-frequency performance of the piezoelectric transducer was reported in many experimental studies [6,10,42].
The performance of the RW membrane stimulation, as well as that of the stapes stimulation are susceptible to the change of the excitation’s direction. This result for the RW membrane stimulation conforms to Arnold et al.’s temporal bone’s study [43], which found that the transducer’s direction significantly affects the energy transferred to the cochlea of up to 35 dB. The clinical result also shows that the postoperative performance of the RW stimulation has a high variability [44], which may attribute to the change of the transducer’s direction. Meanwhile, this sensitivity for RW membrane stimulation and stapes stimulation to the excitation direction is prominent at a high frequency. Considering the main type of sensorineural hearing loss is the “high-frequency” hearing loss [41], the piezoelectric transducer’s orientation for RW stimulation or stapes stimulation should be guaranteed during the surgery. For the design of these two types of transducers, it is recommended to design a fixing part to ensure its orientation after implantation.
The main purpose of this paper is to investigate the stimulating site’s influence on the piezoelectric transducer. To facilitate this study, the real structure of the piezoelectric transducer was not considered in this paper; instead, we simplified it as an ideal displacement driven transducer, i.e., a transducer generates a certain displacement without limitations in force. Under this simplification, the retroaction of the human ear system onto the piezoelectric transducer was neglected. This simplification for the IMEHD’s piezoelectric transducer is based on the fact that the blocking force of the transducer is much larger than its working force. For instance, the piezoelectric transducer (Model PL-033, Physik Instrumente, Waldbronne, Germany) used in Wang et al.’s study [41] for IMEHD has a blocking force of 300 N, which is much larger than the force (89 µN [45]) required to drive the vibration of ossicles to the equivalent of 100 dB SPL. Thus, the resistant force of the human ear cannot change the piezoelectric displacement output significantly. Based on a coupled FE model of the middle ear and a piezoelectric transducer, which is a 20-layer stack of 3 mm diameter and 4 mm thickness made of PZN-4.5PT, Bornitz et al. [18] also found that there is no retroaction of the human ear onto the piezoelectric transducer. Thus, simplifying the piezoelectric transducer in IMEHD as a displacement-driven transducer is acceptable.
It should be noted that our FE model is constructed only based on one human ear specimen. Based on a numerical study, Daniel et al. [46] found that the human ear’s geometrical variation can lead to differences of 4 dB in the lower frequencies and up to 6 dB around 2 kHz, but similar shapes in the calculated response curves. Thus, the patients’ individual geometrical differences may alter our results quantitatively at lower frequencies and frequencies around 2 kHz. Nevertheless, the overall trend of our results still holds under different individual human ear geometries.

5. Conclusions

To study the influence of piezoelectric transducer’s stimulating sites on its hearing compensation performance, a human ear FE model, including the ear canal, the middle ear, and the cochlea, was constructed. The validity of this model was verified by three sets of comparisons. The results show the piezoelectric transducer provides better performance when simulating the stapes or RW membrane than stimulating other studied sites, especially at a high frequency. The incus body is the worst stimulating site for the piezoelectric transducer. Meanwhile, the performance of the RW membrane stimulation, as well as that of the stapes stimulation, are susceptible to the change of the excitation’s direction. Considering most sensorineural hearing loss is severe at high-frequency, the piezoelectric transducer’s orientation for RW stimulation or stapes stimulation should be guaranteed during the surgery.

Author Contributions

Conceptualization, H.L. and J.Y.; formal analysis, H.L.; funding acquisition, H.L.; methodology, H.L., Y.Z. and Z.R.; software, Y.Z.; writing—original draft, H.L. and J.Y.; writing—review and editing, Z.R.

Funding

This research was funded by National Natural Science Foundation of China, grant number 51775547, and Top-notch Academic Program Development of Jiangsu Higher Education Institutions, grant number PPZY2015B120.

Acknowledgments

We thank Xinsheng Huang and Lei Zhou for helping us prepare the CT images of the temporal bone.

Conflicts of Interest

The authors declare no conflict of interest.

References

  1. World Health Organization. Deafness and Hearing Loss. Key Facts. Available online: https://www.who.int/en/news-room/fact-sheets/detail/deafness-and-hearing-loss (accessed on 30 September 2019).
  2. Angeli, S.I.; Yan, D.; Telischi, F.; Balkany, T.J.; Ouyang, X.M.; Du, L.L.; Eshraghi, A.; Goodwin, L.; Liu, X.Z. Etiologic diagnosis of sensorineural hearing loss in adults. Otolaryngol. Head Neck Surg. 2005, 132, 890–895. [Google Scholar] [CrossRef] [PubMed]
  3. Moore, B.C.J. Cochlear Hearing Loss: Physiological, Psychological and Technical Issues, 2nd ed.; Wiley Chichester: John Wiley: Hoboken, NJ, USA, 2007. [Google Scholar]
  4. Hong, E.-P.; Kim, M.-K.; Park, I.-Y.; Lee, S.-H.; Roh, Y.; Cho, J.-H. Vibration Modeling and Design of Piezoelectric Floating Mass Transducer for Implantable Middle Ear Hearing Devices. IEICE Trans. Fundam. 2007, E90-A, 1620–1627. [Google Scholar] [CrossRef]
  5. Haynes, D.S.; Young, J.A.; Wanna, G.B.; Glasscock, M.E. Middle ear implantable hearing devices: An overview. Trends Amplif. 2009, 13, 206–214. [Google Scholar] [CrossRef] [PubMed]
  6. Liu, H.; Cheng, J.; Yang, J.; Rao, Z.; Cheng, G.; Yang, S.; Huang, X.; Wang, M. Concept and Evaluation of a New Piezoelectric Transducer for an Implantable Middle Ear Hearing Device. Sensors 2017, 17, 2515. [Google Scholar] [CrossRef]
  7. Maurer, J.; Savvas, E. The Esteem System: A totally implantable hearing device. Adv. Otorhinolaryngol. 2010, 69, 59–71. [Google Scholar] [CrossRef] [PubMed]
  8. Perkins, R.; Fay, J.P.; Rucker, P.; Rosen, M.; Olson, L.; Puria, S. The EarLens system: New sound transduction methods. Hear. Res. 2010, 263, 104–113. [Google Scholar] [CrossRef]
  9. Song, Y.-L.; Jian, J.-T.; Chen, W.-Z.; Shih, C.-H.; Chou, Y.-F.; Liu, T.-C.; Lee, C.-F. The development of a non-surgical direct drive hearing device with a wireless actuator coupled to the tympanic membrane. Appl. Acoust. 2013, 74, 1511–1518. [Google Scholar] [CrossRef]
  10. Hong, E.-P.; Park, I.-Y.; Seong, K.-W.; Cho, J.-H. Evaluation of an implantable piezoelectric floating mass transducer for sensorineural hearing loss. Mechatronics 2009, 19, 965–971. [Google Scholar] [CrossRef]
  11. Wang, Z.; Mills, R.; Luo, H.; Zheng, X.; Hou, W.; Wang, L.; Brown, S.I.; Cuschieri, A. A micropower miniature piezoelectric actuator for implantable middle ear hearing device. IEEE Trans. Biomed. Eng. 2011, 58, 452–458. [Google Scholar] [CrossRef]
  12. Komori, M.; Yanagihara, N.; Hinohira, Y.; Hato, N.; Gyo, K. Long-term results with the Rion E-type semi-implantable hearing aid. Otolaryngol. Head Neck Surg. 2010, 143, 422–428. [Google Scholar] [CrossRef]
  13. Shin, D.H.; Cho, J.H. Piezoelectric Actuator with Frequency Characteristics for a Middle-Ear Implant. Sensors 2018, 18, 1694. [Google Scholar] [CrossRef] [PubMed]
  14. Liu, H.; Wang, H.; Rao, Z.; Yang, J.; Yang, S. Numerical Study and Optimization of a Novel Piezoelectric Transducer for a Round-Window Stimulating Type Middle-Ear Implant. Micromachines 2019, 10, 40. [Google Scholar] [CrossRef] [PubMed]
  15. Brkic, F.F.; Riss, D.; Auinger, A.; Zoerner, B.; Arnoldner, C.; Baumgartner, W.D.; Gstoettner, W.; Vyskocil, E. Long-Term Outcome of Hearing Rehabilitation With An Active Middle Ear Implant. Laryngoscope 2019, 129, 477–481. [Google Scholar] [CrossRef] [PubMed]
  16. Zhang, X.; Gan, R.Z. A comprehensive model of human ear for analysis of implantable hearing devices. IEEE Trans. Biomed. Eng. 2011, 58, 3024–3027. [Google Scholar] [CrossRef] [PubMed]
  17. Deveze, A.; Koka, K.; Tringali, S.; Jenkins, H.A.; Tollin, D.J. Techniques to improve the efficiency of a middle ear implant: Effect of different methods of coupling to the ossicular chain. Otol. Neurotol. 2013, 34, 158–166. [Google Scholar] [CrossRef] [PubMed]
  18. Bornitz, M.; Hardtke, H.J.; Zahnert, T. Evaluation of implantable actuators by means of a middle ear simulation model. Hear. Res. 2010, 263, 145–151. [Google Scholar] [CrossRef]
  19. Lee, J.; Seong, K.; Lee, S.-H.; Lee, K.-Y.; Cho, J.-H. Comparison of auditory responses determined by acoustic stimulation and by mechanical round window stimulation at equivalent stapes velocities. Hear. Res. 2014, 314, 65–71. [Google Scholar] [CrossRef]
  20. Gentil, F.; Parente, M.; Martins, P.; Garbe, C.; Jorge, R.N.; Ferreira, A. The influence of the mechanical behaviour of the middle ear ligaments: A finite element analysis. Proc. Inst. Mech. Eng. Part H J. Eng. Med. 2011, 225, 68–76. [Google Scholar] [CrossRef]
  21. Francesca, A.; Maurizio, B.; Helge, R.A. Is the human round window really round? An anatomic study with surgical implications. Otol. Neurotol. 2014, 35, 1354–1360. [Google Scholar]
  22. Zhang, J.; Zou, D.; Tian, J.; Ta, N.; Rao, Z. A comparative finite-element analysis of acoustic transmission in human cochlea during forward and reverse stimulations. Appl. Acoust. 2019, 145, 278–289. [Google Scholar] [CrossRef]
  23. Sun, Q.; Gan, R.Z.; Chang, K.H.; Dormer, K.J. Computer-integrated finite element modeling of human middle ear. Biomech. Modeling Mechanobiol. 2002, 1, 109–122. [Google Scholar] [CrossRef] [PubMed]
  24. Zhang, X.; Gan, R.Z. Finite element modeling of energy absorbance in normal and disordered human ears. Hear. Res. 2013, 301, 146–155. [Google Scholar] [CrossRef] [PubMed]
  25. Zhou, K.; Liu, H.; Yang, J.; Zhao, Y.; Rao, Z.; Yang, S. Influence of middle ear disorder in round-window stimulation using a finite element human ear model. Acta Bioeng. Biomech. 2019, 21. [Google Scholar] [CrossRef]
  26. Gundersen, T.; Skarstein, O.; Sikkeland, T. A study of the vibration of the basilar membrane in human temporal bone preparations by the use of the Mossbauer effect. Acta Oto-Laryngologica 1978, 86, 225–232. [Google Scholar] [CrossRef]
  27. Gan, R.Z.; Cheng, T.; Dai, C.; Yang, F.; Wood, M.W. Finite element modeling of sound transmission with perforations of tympanic membrane. J. Acoust. Soc. Am. 2009, 126, 243–253. [Google Scholar]
  28. Stenfelt, S.; Puria, S.; Hato, N.; Goode, R.L. Basilar membrane and osseous spiral lamina motion in human cadavers with air and bone conduction stimuli. Hear. Res. 2003, 181, 131–143. [Google Scholar] [CrossRef]
  29. Aibara, R.; Welsh, J.T.; Puria, S.; Goode, R.L. Human middle-ear sound transfer function and cochlear input impedance. Hear. Res. 2001, 152, 100–109. [Google Scholar] [CrossRef]
  30. Puria, S.; Peake, W.T.; Rosowski, J.J. Sound-pressure measurements in the cochlear vestibule of human-cadaver ears. J. Acoust. Soc. Am. 1997, 101, 2754–2770. [Google Scholar] [CrossRef]
  31. Merchant, S.N.; Ravicz, M.E.; Rosowski, J.J. Acoustic input impedance of the stapes and cochlea in human temporal bones. Hear. Res. 1996, 97, 30–45. [Google Scholar] [CrossRef]
  32. Lee, C.F.; Chen, P.R.; Lee, W.J.; Chen, J.H.; Liu, T.C. Three-dimensional reconstruction and modeling of middle ear biomechanics by high-resolution computed tomography and finite element analysis. Laryngoscope 2006, 116, 711–716. [Google Scholar] [CrossRef]
  33. Liu, H.; Zhang, H.; Yang, J.; Huang, X.; Liu, W.; Xue, L. Influence of ossicular chain malformation on the performance of round-window stimulation: A finite element approach. Proc. Inst. Mech. Eng. H 2019, 233, 584–594. [Google Scholar] [CrossRef] [PubMed]
  34. Yao, W.; Tang, D.; Chen, Y.; Li, B. Study on vibration characteristics and transmission performance of round window membrane under inverse excitation. J. Mech. Med. Biol. 2018, 18, 1850033. [Google Scholar] [CrossRef]
  35. Liu, H.; Xu, D.; Yang, J.; Yang, S.; Cheng, G.; Huang, X. Analysis of the influence of the transducer and its coupling layer on round window stimulation. Acta Bioeng. Biomech. 2017, 19, 103–111. [Google Scholar] [PubMed]
  36. Koch, M.; Essinger, T.M.; Bornitz, M.; Zahnert, T. Examination of a mechanical amplifier in the incudostapedial joint gap: FEM simulation and physical model. Sensors 2014, 14, 14356–14374. [Google Scholar] [CrossRef] [PubMed] [Green Version]
  37. Wang, X.; Hu, Y.; Wang, Z.; Shi, H. Finite element analysis of the coupling between ossicular chain and mass loading for evaluation of implantable hearing device. Hear. Res. 2011, 280, 48–57. [Google Scholar] [CrossRef] [PubMed]
  38. Chen, Y.; Guan, X.; Zhang, T.; Gan, R.Z. Measurement of basilar membrane motion during round window stimulation in guinea pigs. J. Assoc. Res. Otolaryngol. 2014, 15, 933–943. [Google Scholar] [CrossRef] [Green Version]
  39. Edom, E.; Obrist, D.; Henniger, R.; Kleiser, L.; Sim, J.H.; Huber, A.M. The effect of rocking stapes motions on the cochlear fluid flow and on the basilar membrane motion. J. Acoust. Soc. Am. 2013, 134, 3749–3758. [Google Scholar] [CrossRef] [Green Version]
  40. Koike, T.; Wada, H.; Kobayashi, T. Modeling of the human middle ear using the finite-element method. J. Acoust. Soc. Am. 2002, 111, 1306–1317. [Google Scholar] [CrossRef]
  41. Wang, Z.G.; Abel, E.W.; Mills, R.P.; Liu, Y. Assessment of multi-layer piezoelectric actuator technology for middle-ear implants. Mechatronics 2002, 12, 3–17. [Google Scholar] [CrossRef]
  42. Park, I.Y.; Shimizu, Y.; O’Connor, K.N.; Puria, S.; Cho, J.H. Comparisons of electromagnetic and piezoelectric floating-mass transducers in human cadaveric temporal bones. Hear. Res. 2011, 272, 187–192. [Google Scholar] [CrossRef] [Green Version]
  43. Arnold, A.; Kompis, M.; Candreia, C.; Pfiffner, F.; Häusler, R.; Stieger, C. The floating mass transducer at the round window: Direct transmission or bone conduction? Hear. Res. 2010, 263, 120–127. [Google Scholar] [CrossRef] [PubMed]
  44. Sprinzl, G.M.; Wolf-Magele, A.; Schnabl, J.; Koci, V. The active middle ear implant for the rehabilitation of sensorineural, mixed and conductive hearing losses. Laryngorhinootologie 2011, 90, 560–572. [Google Scholar] [CrossRef] [PubMed]
  45. Ko, W.H.; Zhu, W.L.; Kane, M.; Maniglia, A.J. Engineering principles applied to implantable otologic devices. Otolaryngol. Clin. N. Am. 2001, 34, 299–314. [Google Scholar] [CrossRef]
  46. De Greef, D.; Pires, F.; Dirckx, J.J. Effects of model definitions and parameter values in finite element modeling of human middle ear mechanics. Hear. Res. 2017, 344, 195–206. [Google Scholar] [CrossRef] [PubMed]
Figure 1. Schematic view of an implantable middle ear hearing device with a piezoelectric transducer attached on the incus body.
Micromachines 10 00782 g001
Figure 2. The constructed human ear finite element model.
Micromachines 10 00782 g002
Figure 3. The simulation of the piezoelectric transducer’s simulation. (a) Stimulating sites on the finite element model; (b) the anatomy of the three ossicles (malleus, incus, and stapes).
Micromachines 10 00782 g003
Figure 4. Comparison of the stapes’ footplate displacement under 90 dB SPL sound pressure applied at the eardrum.
Micromachines 10 00782 g004
Figure 5. Comparison of the ratio of the basilar membrane’s (BM) velocity at 12 mm from the stapes to the stapes’ velocity.
Micromachines 10 00782 g005
Figure 6. Comparison of the cochlear input impedance.
Micromachines 10 00782 g006
Figure 7. The influence of a piezoelectric transducer’s stimulating sites on its hearing compensation performance. (a) Equivalent sound pressure level of the piezoelectric transducers stimulating at different sites; (b) ratio of equivalent sound pressure of the piezoelectric transducer stimulating at different sites (the reference is the stimulation applied at the stapes along the stapes longitudinal axis).
Micromachines 10 00782 g007
Figure 8. The sensitivity of umbo stimulation due to the change of its excitation’s direction. (a) Equivalent sound pressure level of the piezoelectric transducer’s stimulation; (b) change of equivalent sound pressure level.
Micromachines 10 00782 g008
Figure 9. The sensitivity of incus-body stimulation due to the change of its excitation’s direction. (a) Equivalent sound pressure level of the piezoelectric transducer’s stimulation; (b) change of equivalent sound pressure level.
Micromachines 10 00782 g009
Figure 10. The sensitivity of incus-long-process stimulation due to the change of its excitation’s direction. (a) Equivalent sound pressure level of the piezoelectric transducer’s stimulation; (b) change of equivalent sound pressure level.
Micromachines 10 00782 g010
Figure 11. The sensitivity of stapes stimulation due to the change of its excitation’s direction. (a) Equivalent sound pressure level of the piezoelectric transducer’s stimulation; (b) change of equivalent sound pressure level.
Micromachines 10 00782 g011
Figure 12. The sensitivity of RW membrane stimulation due to the change of its excitation’s direction. (a) Equivalent sound pressure level of the piezoelectric transducer’s stimulation; (b) change of equivalent sound pressure level.
Micromachines 10 00782 g012
Figure 13. The z-direction (along the longitudinal axis of the stapes) displacement contour plot of the ossicular chain.
Micromachines 10 00782 g013
Table 1. Material properties of the middle ear components.
ComponentsLayerYoung’s Modulus (N/m2)Density (kg/m3)
Eardrum annulus ligament 2.00 × 1051.20 × 103
Eardrum pars tensaOuter layer1.00 × 1071.20 × 103
Middle layerEθ = 2.00 × 10⁷, Er = 3.20 × 10⁷
Inner layer1.00 × 107
Eardrum pars flaccida 1.00 × 1071.20 × 103
Malleus handle 1.41 × 10103.70 × 103
Malleus neck 1.41 × 10104.53 × 103
Malleus head 1.41 × 10102.55 × 103
Incus body 1.41 × 10102.36 × 103
Incus short process 1.41 × 10102.26 × 103
Incus long process 1.41 × 10105.08 × 103
Stapes 1.41 × 10102.20 × 103
Incudomallear joint 6.00 × 1073.20 × 103
Incudostapedial joint 2.00 × 1061.20 × 103
Lateral malleolar ligament 6.70 × 1062.50 × 103
Superior malleolar ligament 4.90 × 1062.50 × 103
Anterior malleolar ligament 8.00 × 1062.50 × 103
Posterior incudal ligament 6.50 × 1062.50 × 103
Superior incudal ligament 4.90 × 1061.00 × 103
Tensor tympani tendon 8.00 × 1062.50 × 103
Stapedial tendon 5.20 × 1071.00 × 103
Stapedial annulus ligament 1.00 × 1041.20 × 103
Table 2. Parameters of linear viscoelastic materials.
Componentse1τ1 (μs)
Eardrum annulus ligament3.228
Eardrum pars flaccida2.2925
Eardrum pars tensa2.825
Incudomallear joint3.020
Incudostapedial joint5020
Stapedial annulus ligament2.425
RW membrane3.030

