In-Situ Measurements in Microscale Gas Flows—Conventional Sensors or Something Else?


Staff Position Microstructures and Process Sensors (MPS), Institute of Microstructure Technology (IMT), Karlsruhe Institute of Technology (KIT), Hermann-von-Helmholtz-Platz 1, 76344 Eggenstein-Leopoldshafen, Germany
Micromachines 2019, 10(5), 292; https://doi.org/10.3390/mi10050292
Submission received: 11 February 2019
/
Revised: 24 April 2019
/
Accepted: 26 April 2019
/
Published: 29 April 2019
(This article belongs to the Special Issue Gas Flows in Microsystems)
Abstract
:Within the last few decades miniaturization has a driving force in almost all areas of technology, leading to a tremendous intensification of systems and processes. Information technology provides now data density several orders of magnitude higher than a few years ago, and the smartphone technology includes, as well the simple ability to communicate with others, features like internet, video and music streaming, but also implementation of the global positioning system, environment sensors or measurement systems for individual health. So-called wearables are everywhere, from the physio-parameter sensing wrist smart watch up to the measurement of heart rates by underwear. This trend holds also for gas flow applications, where complex flow arrangements and measurement systems formerly designed for a macro scale have been transferred into miniaturized versions. Thus, those systems took advantage of the increased surface to volume ratio as well as of the improved heat and mass transfer behavior of miniaturized equipment. In accordance, disadvantages like gas flow mal-distribution on parallelized mini- or micro tubes or channels as well as increased pressure losses due to the minimized hydraulic diameters and an increased roughness-to-dimension ratio have to be taken into account. Furthermore, major problems are arising for measurement and control to be implemented for in-situ and/or in-operando measurements. Currently, correlated measurements are widely discussed to obtain a more comprehensive view to a process by using a broad variety of measurement techniques complementing each other. Techniques for correlated measurements may include commonly used techniques like thermocouples or pressure sensors as well as more complex systems like gas chromatography, mass spectrometry, infrared or ultraviolet spectroscopy and many others. Some of these techniques can be miniaturized, some of them cannot yet. Those should, nevertheless, be able to conduct measurements at the same location and the same time, preferably in-situ and in-operando. Therefore, combinations of measurement instruments might be necessary, which will provide complementary techniques for accessing local process information. A recently more intensively discussed additional possibility is the application of nuclear magnetic resonance (NMR) systems, which might be useful in combination with other, more conventional measurement techniques. NMR is currently undergoing a tremendous change from large-scale to benchtop measurement systems, and it will most likely be further miniaturized. NMR allows a multitude of different measurements, which are normally covered by several instruments. Additionally, NMR can be combined very well with other measurement equipment to perform correlative in-situ and in-operando measurements. Such combinations of several instruments would allow us to retrieve an “information cloud” of a process. This paper will present a view of some common measurement techniques and the difficulties of applying them on one hand in a miniaturized scale, and on the other hand in a correlative mode. Basic suggestions to achieve the above-mentioned objective by a combination of different methods including NMR will be given.
1. Introduction
The interest to gas flows in miniaturized systems has grown tremendously in the last couple of years. Driven by areas such as the automotive industry, semiconductors, the chemical and pharmaceutical industry, modeling, precise measurement and control of the flow of gaseous compounds, mixtures and reactive systems through mini- and micro-structured devices gained importance for various applications like heat transfer [1,2,3,4,5,6,7,8,9,10,11,12,13,14,15,16], gas-liquid or gas-solid contacting [17,18,19,20,21,22,23,24] and chemical reactions [25,26,27,28,29,30]. Amongst the correct design and manufacturing of the miniaturized devices, all the named topics need precise measurement and control of the processes taking place inside microstructures. The final objective of these efforts is to provide an almost comprehensive description of the process to be able to model and simulate as well as to predict by software. The following description will focus on measurement and close out control, to make the process is not too exhaustive.
While measurement of gaseous flows in macroscale is not trivial but manageable, it turns out to be much more problematic in the micro scale. There are several reasons for this. The fact that gas is a compressible medium per se makes it more difficult to measure certain behavior and parameters of a flow inside confined or miniaturized systems [31,32,33,34,35]. Additionally, the scale down of conventionally-sized macro scale tubes or channels into the micro scale makes it more complex to measure. This is, on one hand, due to sensors which are simply too large to be inserted into the micro devices. Figure 1a,b show examples for this. For temperature measurement in macro-scale tubes, a thermocouple is simply located into the flow, measuring the gas flow temperature. This is changed by scaling down the tube diameter. While Figure 1a shows a mini heat pipe cut open, Figure 1b provides a view to a so-called “micro-thermocouple”. It is quite obvious that the thermocouple will block the inner diameter to a major extent and, therefore, completely change the fluidic behavior. Thus, no precise measurement would be possible. More problems occur due to the low density of gases, the change in viscosity, the small specific heat capacity and the need for increased leak-tightness of microstructures while handling gases (and here, depending to the gas, the acceptable leak rate QL can vary in orders of magnitude!). However, in many cases Micro Electromechanical Systems (MEMS) have been applied as measurement tools to be implemented into microstructure devices [33]. While this is often a practical solution, in other cases it is not, as will be shown in the later discussion.
Nevertheless, from 1964 until today, roughly about 45,000 papers have been published on miniaturized gas sensors and sensor systems [36]. A large variety of relevant technologies is available which will not be described in this paper in detail, more can be found in comprehensive textbooks or in reference [37].
The following will present an overview on parameters of gas flows in microstructures to be measured as well as measurement methods for these. The presented overview is by no means complete. The envisaged field of measurement is very much in flux; thus, new technologies and improved methods are rapidly developing, especially by improving the sensitivity and selectivity of the measurements. One of these developments is the use of nanomaterials for sensing opportunities. Here, numerous different technologies based on nanostructured materials or nanostructures in specific materials have been described and are used now for sensing in gases. Examples are given in references [38,39,40,41,42,43,44,45,46,47]. The sensitivity and selectivity of nanostructure/nanomaterials sensors has improved significantly in the last few years [48,49,50].
Another trend is a combination of sensing elements in micro or nano scale for measurement of biological parameters or environment (biosensing, [51,52,53,54,55,56]). This field is relatively new, and lots of developments are to expect in the next future.
As mentioned before, an additional point is the correlation of a multitude of measurement methods to achieve a more dense “information cloud” and, therefore, reach a better understanding of the effects and behavior in gas flows. This leads to the necessity of in-situ and in-operando combination of several measurement methods with similar (ideally: identical) timely and spatial resolution. All measurements have to be taken simultaneously and at the same location to provide the highest possible information density of the process taking place at this point. As an example, for such a process a heterogeneously catalyzed gas phase reaction could be taken. Here, gas flow, gas composition, catalyst-gas-surface interaction, temperature, pressure and product concentration should be measured at the same time and the same location, to name just a few of the parameters of such a process.
The data obtained from each of such monitoring systems will then be correlated to those of all others, in time as well as in space, to get a description of an n-dimensional parameter space that is as comprehensive as possible. Within the overview presented here, several possible technologies to correlate measurements are very briefly and rudimentarily described. Possibilities, advantages and disadvantages of each method are presented, and a possible use in combination with other methods is evaluated. This overview is not intended to give a vast description of the measurement methods, their advantages and disadvantages, their working principles or underlying functionalities—this is left to much more specified papers or textbooks. This collection, without delving deeply into details of the methods themselves, should provide a quick overview for possible correlative measurement technologies only. For this objective, the following section deals with the parameters which most regularly are measured, as well as with some most common methods for those and with scaling, the problem of miniaturization itself [57,58,59].
2. Parameters, Measurement Methods and Scaling
Numerous parameters of gas flows in micro scale can be measured. However, many of them are only useful in specific applications. Amongst those are parameters like chemical reactivity, pH, solubility in liquids, speed of sound, etc. This publication will focus on more common parameters like temperature (or temperature difference), heat flux, pressure (or pressure difference), mass flow, flow velocity, mixture composition and concentration (concentration gradients, respectively) of species inside micro scale gas flows.
The measurement methods can in general be split in electrical measurements using conventional wire systems [60,61], electrical measurements using micro-electromechanical systems (MEMS) [62], spectroscopic measurements or optical measurement methods [63]. There are numerous papers on each of those different measurement methods, thus, it shall not be the objective of this publication to provide more detailed information on them.
Wire-system based methods use conventional sensors which are, in many cases, macroscopic. In general, these are thermocouples or thermistors (see below), pressure sensors, mass flow meters and similar, which are well known measurement devices in style as well as in behavior. These sensors are mounted on the process tubing, e.g., thermocouples before and after a possible reaction vessel as well as pressure sensors or mass flow meters. An in-situ or in-operando monitoring is hardly possible.
MEMS-based measurements show the possibility to be implemented for in-situ and in-operando measurements. Pressure sensors, temperature sensors, flow sensors and others more are available off the shelf. They are, in general, Si-based, small, provide a short response time, good reliability and long lifetime. Additionally, most of those systems are cheap to produce. However, they need to be coupled with a visualization module or a data logger to make the measurements available for the operator. This is regularly done by wiring. There are some cases of wireless MEMS sensors [64]. However, due to the continuous developments in semiconductor technology, wireless solutions are becoming more and more popular, and their use is greatly enhanced by, i.e., radio frequency identification (RFID) and near field communication (NFC) technology [65,66,67,68,69].
What was mentioned above for wire-based electrical sensor in principle holds also for optical sensors, where either an optical fiber is implemented into the measurement location, or an active optical component (light emitting diode LED, laser or other light source) is integrated there—in many cases an optical detector like a photo diode or similar could also be used. Examples are presented in references [70,71,72,73,74,75,76].
Most of the measurement methods of the sensors named above have been derived from macroscopic standards, adapted and improved for the mini scale and then applied and even further revised for the micro scale; and almost all of them (but the wireless MEMS devices) share the same problem of scaling. This holds for all type of sensors, whether electrical or optical.
Scaling a measurement method simply down from macro to micro scale will normally not generate the desired results. Either is the fluid influenced too strongly by the measurement method (as was shown in the example given in Figure 1), or the precision of measurement suffers from the miniaturization. It is, in many cases, not easy to decide where in the fluid flow to place the sensors to obtain correct measurements. A good example is the measurement of temperatures. If a MEMS-based measurement system is placed into the sidewall of a microfluidic system, the wall temperature is measured, or maybe the temperature of the gas flow near the wall. The same result will be obtained with an optical element placed inside the sidewall of a microfluidic system. The temperature in the core of the flow is not determined in any way. Moreover, the MEMS system may alter the wall-gas interaction (because the material might be different), and therefore not even provide a representative measurement signal for the sidewall temperature of the gas flow [77]. This might not be so much the case for the optical sensor. Figure 2 shows an example of a silicon MEMS sensor system used for temperature measurement inside a microchannel gas flow under ambient or slightly rarefied conditions [78].
If the process is well known, the core temperature of the flow might be calculated correctly. Not knowing the process precisely, it might be necessary to measure the core flow temperature—which is possible with a sensor implemented into the flow. Placing a very thin wired sensor or a thin optical fiber inside the flow core may lead to a more precise measurement of the temperature there, but also could lead to a deflection of the measurement sensor due to insufficient stiffness, or to generate local turbulences and eddies and, therefore, disturb the flow. The same holds for a wireless sensor, which has to be mounted and fixed somehow in the flow. In any case, scaling down fluidic systems for gas flows into the micro scale needs a very careful consideration of the location and the precision of the sensors applied. This holds for all parameters to be measured.
2.1. Temperature Measurement
One of the most common tasks in gas flows is the measurement of temperatures, as mentioned above. At the same time, it is a relatively complex measurement, which is, in many cases, underestimated [60,79,80,81,82,83,84]. In the following, some possible methods will be described and evaluated as a general example for other parameters to be measured at a micro scale.
2.1.1. Measurements Using Conventional Intrusive Sensors
Conventional sensors in this case means either thermistors or thermocouples. Optical sensors shall not be considered here, because they are more delicate to handle in this case and are generally more expensive [85,86,87]. Both thermocouples and thermistors are commercially available in various shapes, sizes and forms, which makes them flexible and handy tools. Moreover, efforts to obtain some results are limited. In both cases, wired standard solutions as well as wired MEMS are available.
Thermistors are temperature-dependent electrical resistors. They can be separated in devices with a positive temperature coefficient retrieving a higher resistance with increasing temperature, or a with negative temperature coefficient, which lowers the resistance by increasing temperature. In any case, the dependency between the change of resistance and the temperature is very linear (or can be linearized in an easy way) [88]. The most common example is the PT100, a platinum resistor with a nominal value of 100 Ω at standard conditions (variations with 10 Ω or 1000 Ω are also common). The PT-sensor is used as part of a Wheatstone bridge circuit, which makes a very precise measurement possible [89].
Temperature sensors based on the resistor principle are wide-spread in any application, because they can be manufactured as discrete devices as well as integrated circuits in semiconductor technology. Thus, extremely small sensors can be generated using standard semiconductor manufacturing processes. This also holds, in some cases, for the second common temperature measurement principle, which is thermocouples.
A thermocouple is an electrical device consisting of two dissimilar electrical conductors forming electrical junctions at differing temperatures. A thermocouple produces a temperature-dependent voltage as a result of the thermoelectric effect, and this voltage can be interpreted to measure a temperature [78,90]. Some types of thermocouples can also be produced in a micro- or even nano scale by use of semiconductor technology, while others cannot [37]. However, the two main disadvantages of thermocouples are their limited signal strength and the need for a reference temperature. While the signal strength can be enhanced by creating thermopiles (numerous thermocouples circuited in a row, see Figure 2), the reference temperature need cannot be avoided. This fact makes it difficult to apply thermocouples in miniaturized equipment, which regularly shows a more or less isothermal behavior, short distances in the mm or µm range and very short temperature spreading times. Thus, the difference between reference temperature and measured temperature might be diminished rapidly.
Both measurement principles mentioned above are regularly carried out with wired sensors. Wireless temperature sensors, especially in micro scale, are not so widely common yet, but will be more common in the future [91,92,93]. However, all the sensors presented in this subsection need a wire connection to the outer environment, thus, sealings and interconnections are necessary. This might be, depending on the supervised process, a source of leakage and uncertainty. Therefore, wireless measurement would be a better option, as was mentioned before. Additionally, it was mentioned that introducing a sensor into the gas flow would disturb the flow mode or even change the process parameters significantly. Thus, non-intrusive methods have to be used.
2.1.2. Measurements Using Non-Intrusive Methods
As the example of the use of conventionally sized resistors or thermocouples (presented in Figure 1b) shows, this is, in many cases, not an option, mainly for size reasons as described before. Thus, it has to be asked which other techniques and methods could be used for such a simple measurement task such as retrieving the temperature?
One option is the use of non-intrusive optical systems (i.e., infrared (IR) radiation, ultra violet (UV) fluorescence, others) or ultrasound [94,95,96]. Here, surface temperatures are measured, providing a non-intrusive possibility to acquire data on the thermal state of a body. However, these methods have several disadvantages. They are not applicable for all cases, since certain materials are not transparent for IR radiation (i.e., common glasses, metals etc.) or reflect or damp-out ultrasound very strongly (i.e., dense liquids, metals etc.). In such cases, a wrong signal, a strongly reduced signal or no signal at all can be obtained, leading to a very low signal-to-noise ratio (SNR). When this occurs, a measurement might be useless. A further disadvantage is that the measured signal represents the surface temperature of a device obtained by conduction, convection or radiation from the inner side, but not the core temperature. This means the inner parts of a body could differ significantly in temperature from the outer surface. This outcome cannot be seen and measured by the chosen measurement technology. The same holds for other measurement technologies that use optical fluorescence to measure temperatures [97].
Another option is Raman spectrometry [98]. With this technique, temperature distributions inside of miniaturized structures are easy to measure if the surrounding area is transparent for the Raman light. All the limits named before for IR and ultrasound measurements hold here also, because this is still an optical method. Efforts are high, and the Raman systems are expensive and complex to handle. If all these drawbacks are given for measurement of an all-day parameter like temperature, does this also hold for other measurement needs like pressure, flow, density or more complex sets of parameters like local concentration? Furthrmore, what might be feasible in terms of in-situ, in-operando and correlated measurements?
2.2. Measurements of Other Parameters
As pointed out in the previous sections, measurements of several parameters lead to application of different techniques at a single process. The process pressure is measured with pressure transducers, in most cases located outside the process vessel. The process flow through tubes or vessels is obtained by anemometers or similar systems. Electrochemical sensors are used to measure pH or conductivity. Viscosity is obtained with a rheometer (in general, outside of the process run), and so on. Additional analytical methods like gas chromatography (GC) [99,100], infrared (IR) spectrometry [101], ultraviolet (UV) spectrometry [102], the above mentioned Raman spectrometry [103], mass spectrometry (MS) [104,105] or Nuclear Magnetic Resonance spectroscopy (NMR) [106,107,108,109,110] are used to determine the components of the mixture, depending on the applicability of the respective method to the gas. Visualization of flow processes can be obtained by, for example, high speed videography [111,112,113]. An example of a microstructure used for high speed videography is given in Figure 3.
All of these systems work, in most cases, independently, are time consuming and costly. In-situ measurements or in-operando measurements inside of micro scale systems are possible, but rarely done, in most cases the analysis is performed offline with a specific sample taken from the process flow. A correlation of results of these analytical methods is used to gain more complete process information, as was proposed in the introduction section, with measurement results of the process parameters obtained as described before being at least difficult [114,115,116], in many cases it is almost impossible.
Thus, it might be a good idea to have a combination of several complementary measurement and analytical systems which can provide all the information wanted within a single measurement campaign at once.
2.3. Combined and Correlated Measurement System
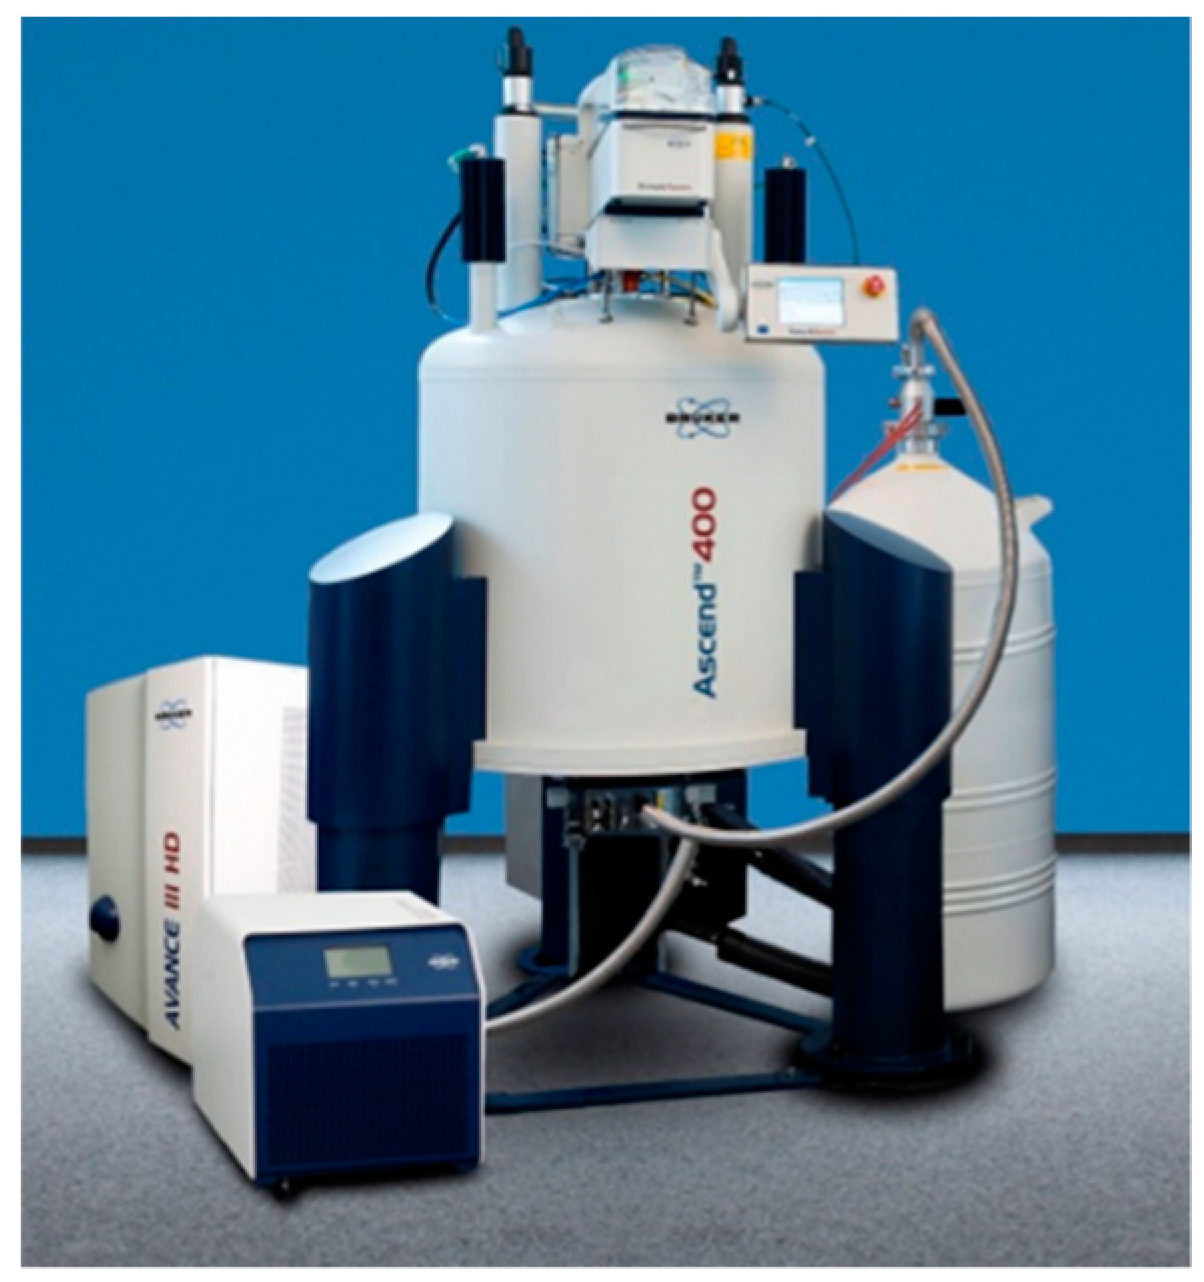
The objective mentioned above, namely to measure in-situ, in-operando, simultaneously at the same location, can be obtained by combining several measurement and analytical systems. However, aside of the tremendous efforts to be undertaken, this will result most likely in a spatial correlation only. Due to different measurement time constants of the different sensors and systems, a timely correlation is very unlikely to be obtained. All the methods named above show drawbacks for in-situ, in-operando, combined and correlated measurements. While Raman spectroscopy will need an optical access, IR spectroscopy as well as UV spectroscopy will need additionally specimen active in the named wavelength region. In-situ and in-operando GC or GC-MS is possible (see i.e., reference [117]), but in general is done in a macro scale. To scale those techniques down into micro scale might be feasible but is generally not available as an option yet. NMR measurement systems [110] are, in general, big machines with super-cooled magnets and a huge bunch of external equipment, which is one of the major drawbacks of this technology. Figure 4 shows an example of a 400 MHz (9.4 T) NMR device made by the Bruker company (Billerica, MA, USA).
However, with an NMR spectrometer like this, a sample can be characterized for various parameters in a single measurement campaign, correlating time and location with each of the separate measurements taken. The question arising now is whether such a system is able to characterize the desired parameters with a spatial and time resolution that is high enough to be useful in a micro scale.
For the spatial resolution, a value of about 10 µm is given in literature (see i.e., reference [118]). The time resolution is named to be around 20 ms (see i.e., reference [119]). This result is assumed to be valid for a multitude of measurement objectives performed by NMR, spatial as well as time resolution. The literature suggests that this result is in principle good enough for running NMR systems as well-chosen measurement and analytical tools for numerous applications, ranging from chemistry to materials research, pharmacy and food engineering to biomedical applications or physics. However, it has to be considered that many measurements will not be done after the 20 ms given above, but instead take much longer and average a multitude of single measurement shots.
Thus, beside the drawbacks of size, costs and running efforts for such a device in terms of liquid helium and nitrogen for cooling down the magnets etc., it is not clear yet whether all desired parameters can be measured in reasonable time, or if even all parameters important for a process to be characterized can be measured. Aside of this, not all materials can be used with NMR. The technology is very selective, but is limited to non-magnetic materials for devices. If process parameters can only be reached using a vessel made of magnetic material, then NMR measurement methods fail due to the magnetic properties of the device. Another drawback is that not all desired parameters can be measured directly, some can only be retrieved indirectly.
While the measurement of temperature with NMR is in some cases precise and simple [120], the process pressure can only be retrieved by pressure-sensitive materials [121]. Viscosity, density, mass flow and phase, phase changes or particle content can be measured directly (i.e., reference [122]), as well as the electrochemical potential of compounds (see reference [123]), concentrations of single mixture compounds [124] or the pH of a mixture.
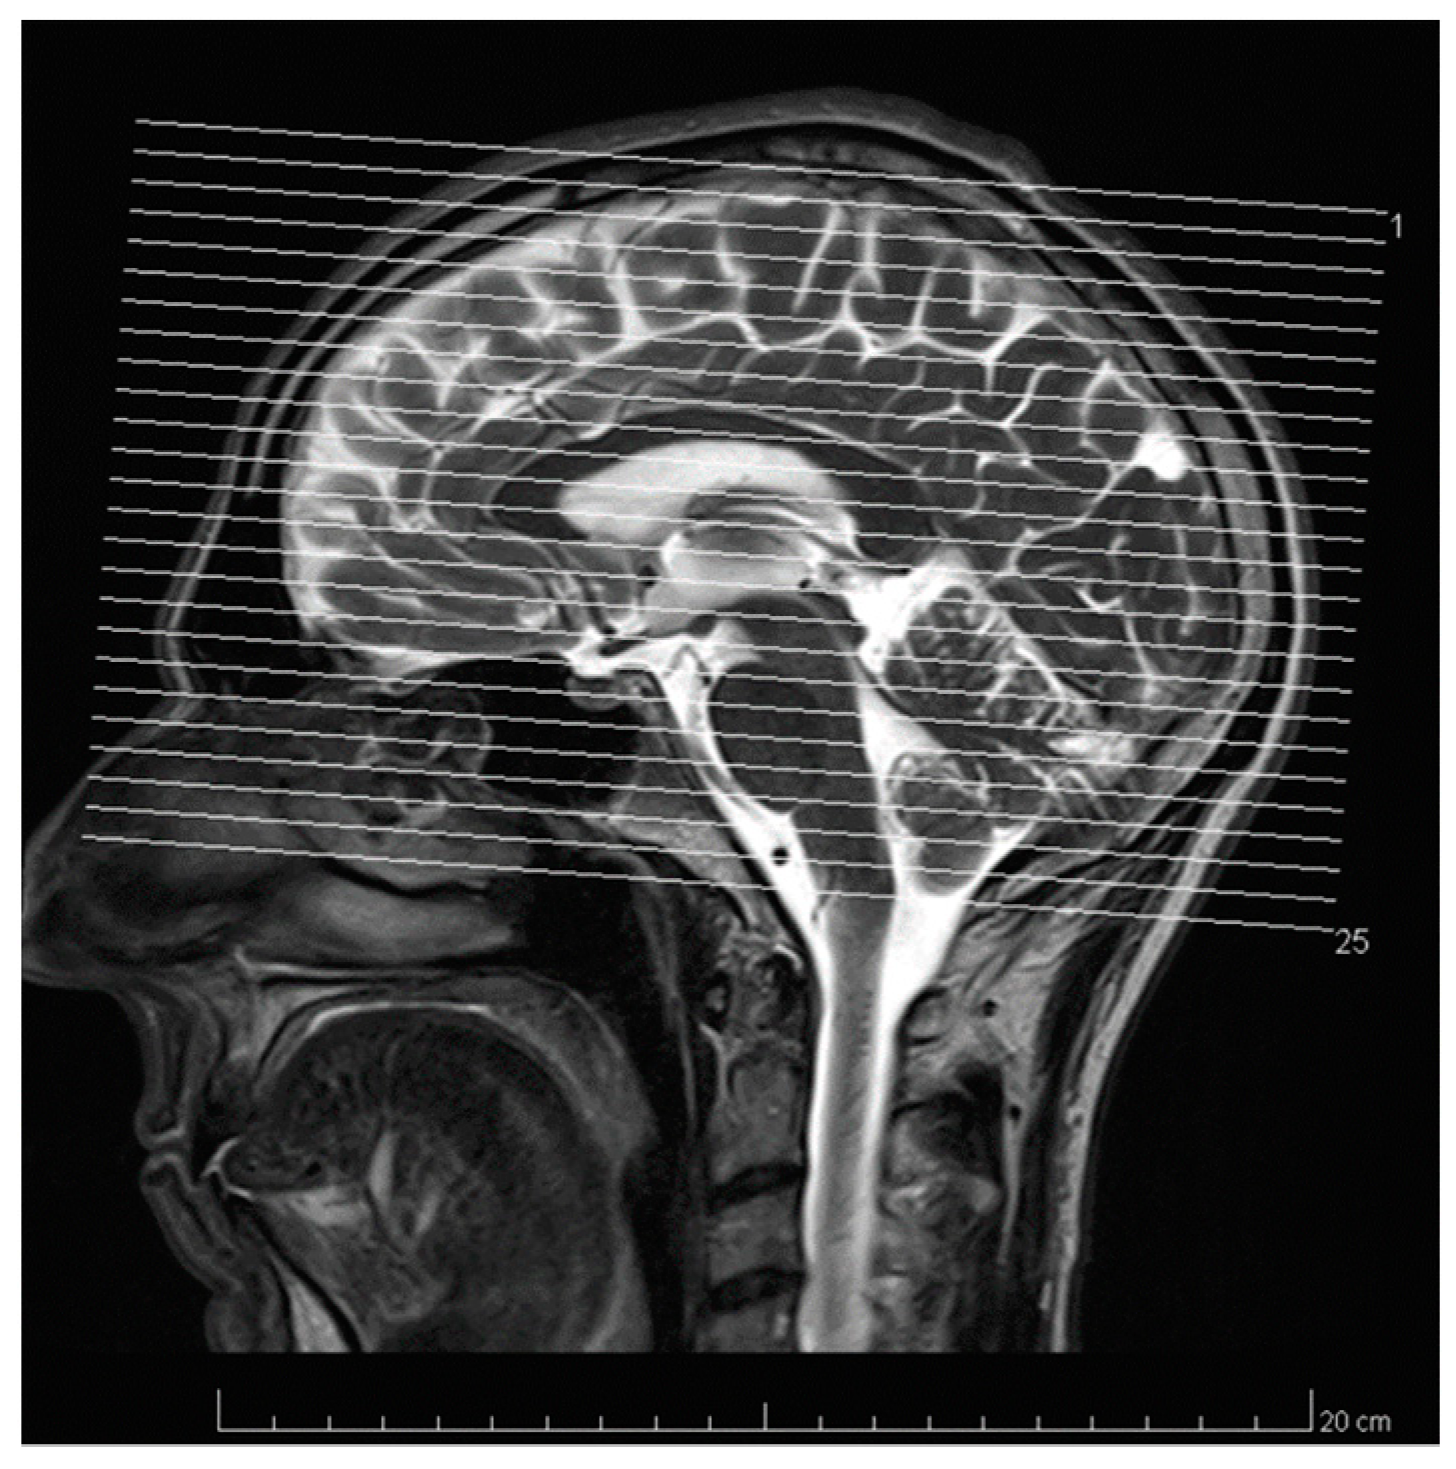
Additionally, this technology allows us not only to measure different parameters non-intrusively in very small confinements like micro channels, but also in living tissues [125,126]. This is an add-on not provided by a multitude of the other techniques presented before. Another add-on is the possibility to visualize processes by magnetic resonance imaging (MRI, see reference [127]). An example of this is presented in Figure 5, showing a cut through a human head and imaging the brain.
Thus, NMR seems to provide the possibility to cover lots of measurement tasks of other methods in a single machine, being non-invasive, non-intrusive and non-detrimental to the measured object. With all the possibilities provided here, a discussion is needed on at least two topics: is measurement with an NMR correlative? Moreover, is NMR measurement the best possible solution for every measurement task?
3. Discussion
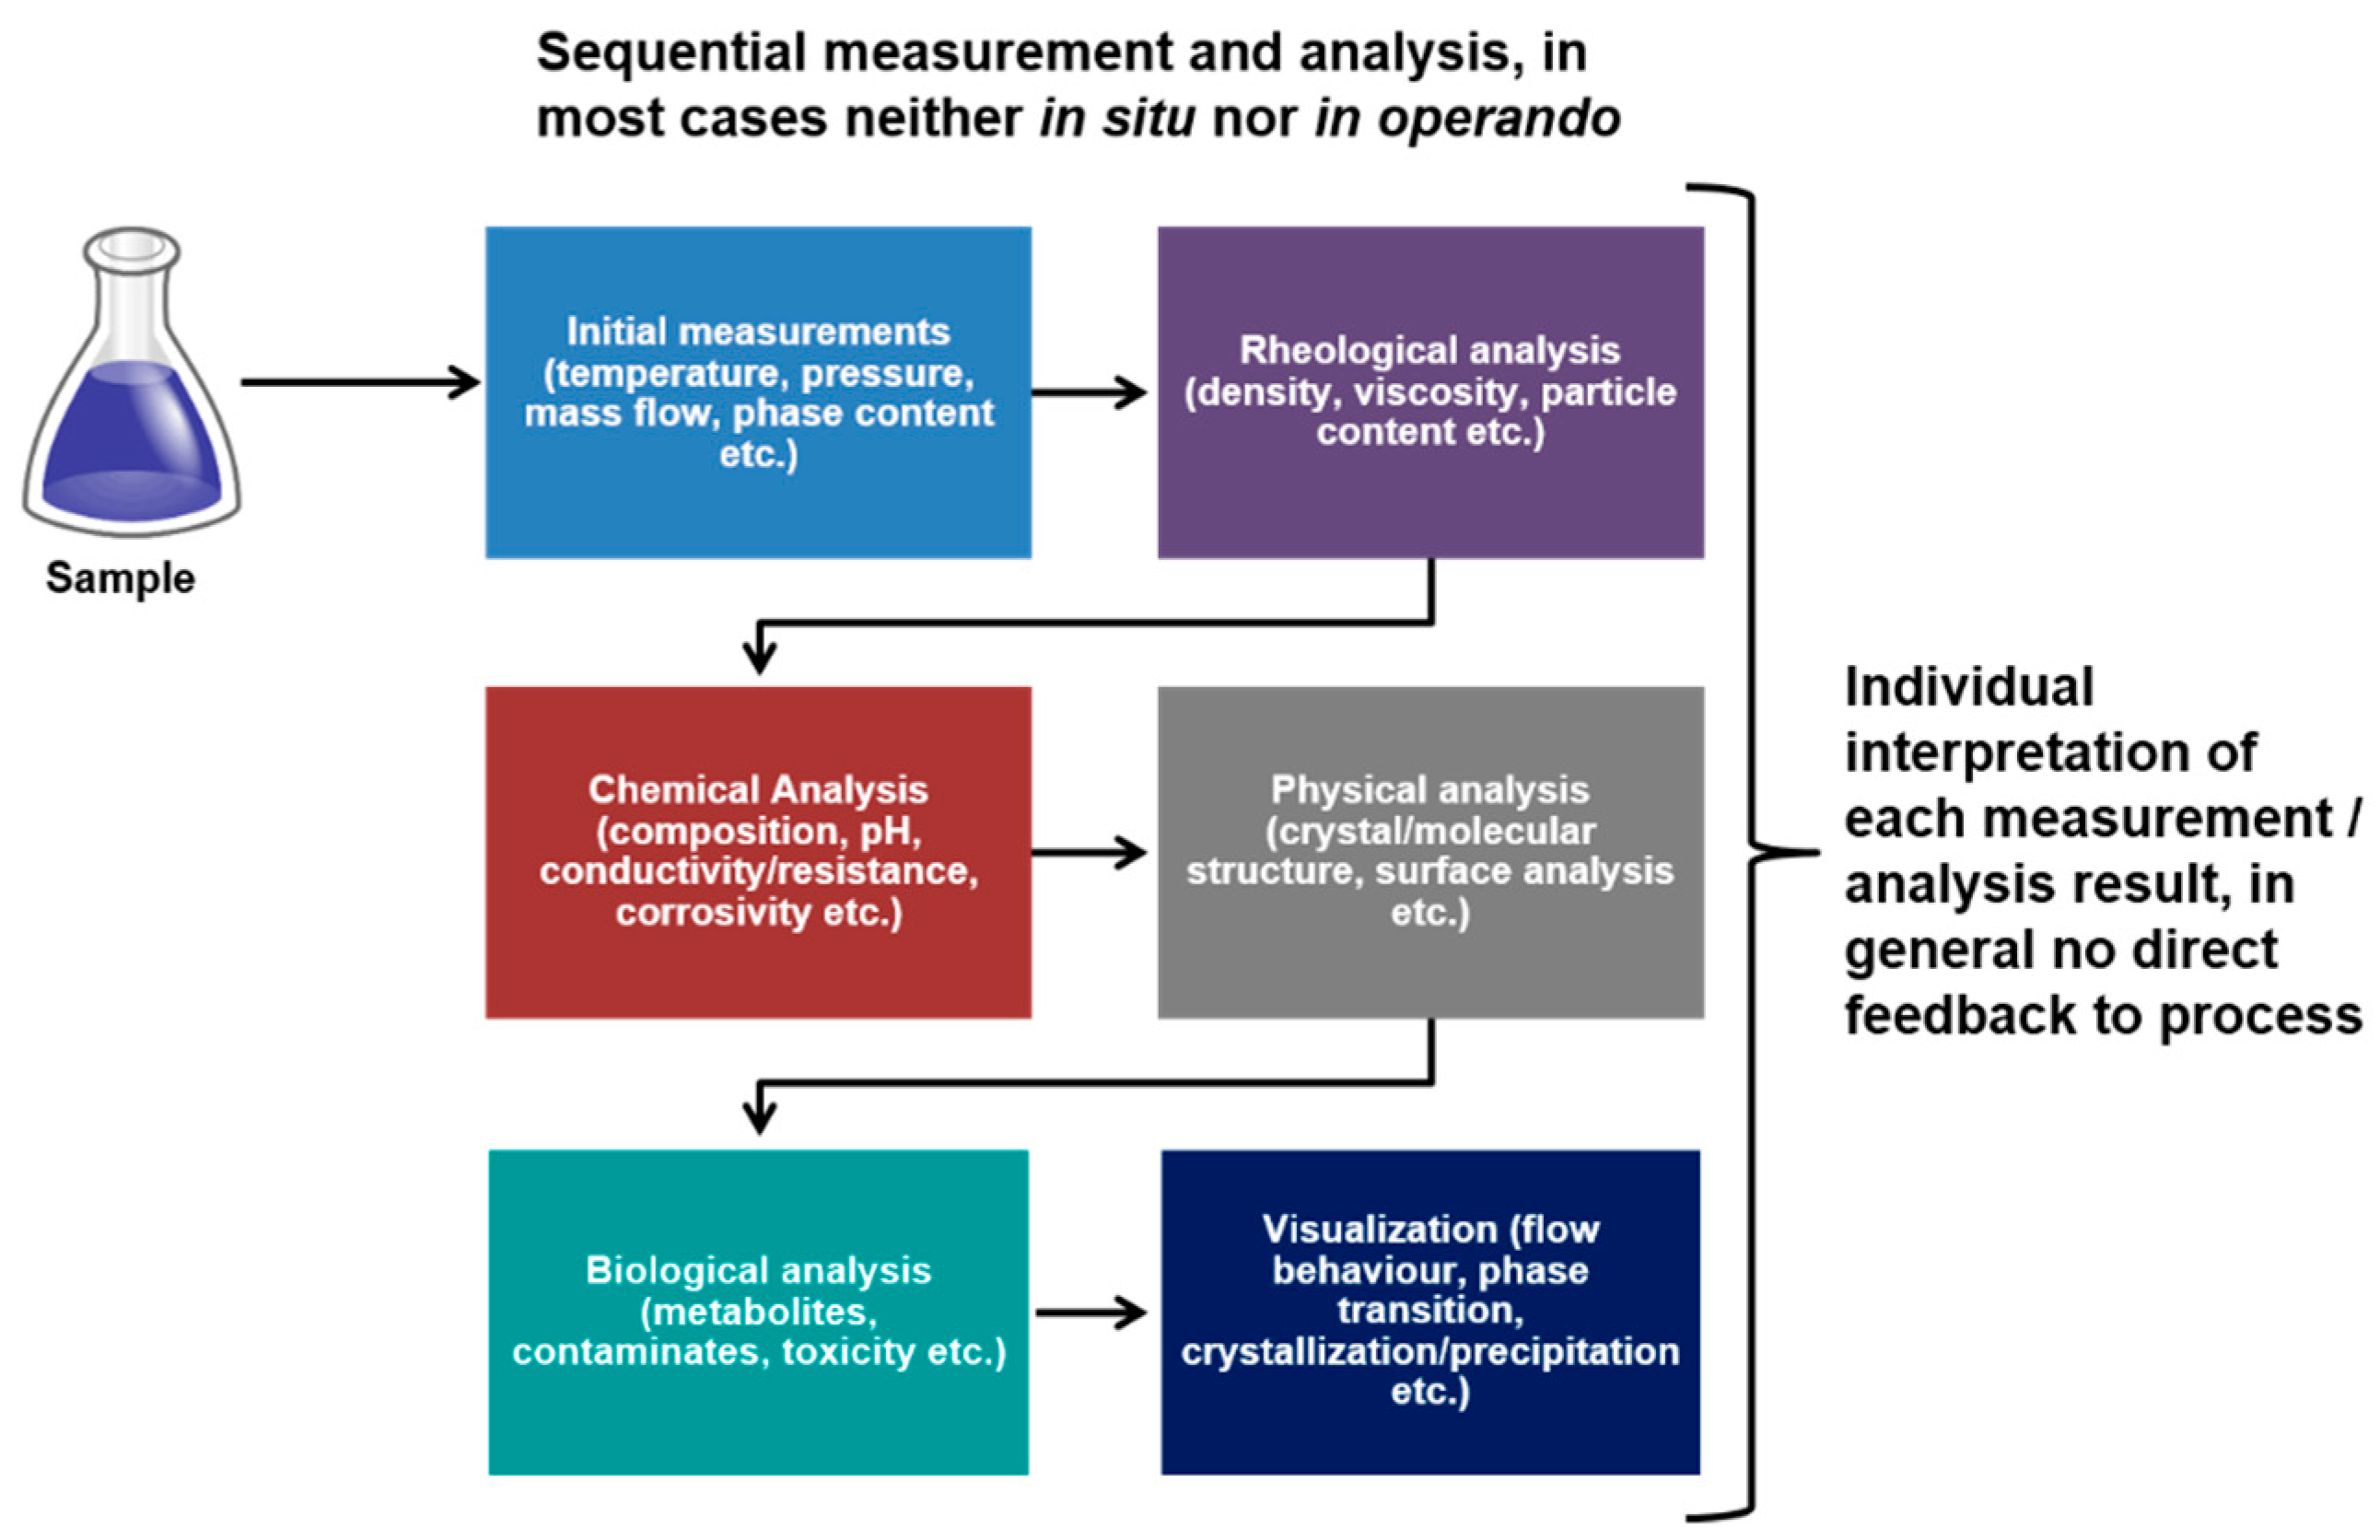
As was pointed out in Section 2, lots of different methods for measurement of process parameters are available and have been explored. Miniaturization of process systems results in major problems for scaling them down, as was mentioned and described before. However, with larger efforts, smart design and good planning of experiments, the scaling down of measurement systems and obtaining precise results of the process parameters is possible to a certain extent, using various methods for process parameter characterization. Thus, miniaturization and scaling is a problem for intrusive measurement methods, while precise measurement of the parameter distribution is a problem for non-intrusive methods. This has clearly been described in Section 2. In almost all cases, measurements are performed sequentially, having each of the measurement and analysis systems running after the one before. This type of performance, aside from the difficulties given by scaling, allows us to achieve good and reliable measurement results, but not to correlate them to each other and to obtain a more fundamental understanding of the interactions between process parameters and underlying principles. This is shown schematically in Figure 6, in which the current state-of-the-art measurement methodology is presented.
Thus, correlation of the measurement results is the major point to deal with. One of the future perspectives of measurement is to obtain correlated information in situ and in operando by as many different techniques as possible. Correlated measurement means timely and spatially, and with similar resolutions for all applied techniques. This is necessary to gain an exhaustive view of the examined process, to understand the underlying principles and actions, and therefore to make them accessible for modeling and simulation as well as in silico prediction and optimization. The latter will lead to major reductions in resource consumption. Figure 7 shows a scheme of a possible future measurement environment, in which a multitude of instruments are involved in parallel, obtaining means at the same time and location, measuring in situ and in operando and, therefore, delivering results which can directly be correlated. With this method, a much deeper understanding of links between actions and effects can be achieved in a more appropriate way. Thus, correlative measurement, generation of linked information and interpretation, management and feedback of connected data will be one of the main tasks in the future. The measurement structure schematically shown in Figure 7 can support this task.
Some of the measurement methods presented above are useful for stand-alone measurements only, while some can be performed simultaneously. However, the methods and techniques described in Section 2.1 and Section 2.2 can hardly be done in a correlated way. It is possible to measure temperature, pressure and chemical composition of a flow at the same position using, i.e., thermocouples, pressure sensors and Raman spectrometry. To obtain a precise time correlation by using a trigger is difficult, mainly due to different time constants of the measurement methods. Additional visualization of the process adds some more problems, because for high speed videography as described in Section 2, very high light intensities are necessary, which might cope with other optical measurement methods; therefore, a combined high speed videography—Raman measurement is not an option.
All this holds for all of the conventional methods described above. Without precise triggering, correlative measurement is most likely impossible; and even with a time trigger, the location of measurement as well as the spatial resolution most likely differs largely.
NMR makes it partly easier in this particular point. As described before, in principle a multitude of parameters can be retrieved with NMR, all of them at the same location. Thus, spatial resolution is consistent. However, it is doubtful that a timely consistence can be reached because some measurements simply take much longer than others, as pointed out before. Thus, truly correlative measurements in terms of time and space cannot be generated for the most cases, meaning this problem remains. However, the data measured by NMR are to a certain extent per se correlated, because several parameters are measured with the same method and then averaged on a time period, which is a huge advantage compared to conventional measurement equipment. Process pressure has to be measured via pressure-sensitive materials (see description above and reference [121]), which makes this a special case to be dealt with. Additionally, with MRI a handy visualization tool is available, which provides an even more in-sight view to processes and flows. Thus, many of the problems attached to conventional measurement systems apply less for NMR. However, the time correlation problem is kept, and due to the limitation of applicability to non-magnetic device materials, NMR is not a panacea. It is a good toolbox for lots of possible measurement solutions correlating the obtained data directly internally. A future vision would be to retrieve all process parameters at the same time, with the same precision, the same spatial and time resolution, in-situ and in-operando, as was requested. Thus, NMR might be a nice additional tool for certain measurement applications, but it cannot be considered to be a stand-alone tool for generation of correlated data on processes yet. There’s a need for combinations of methods, to obtain the desired “information cloud”. Only with this, a reasonable combination of different measurement and analytical tools, might a more comprehensive descriptions of processes be feasible.
Recently ideas for further correlated measurements have emerged, like MR-optical combinations, or the integration of atomic force microscopy (AFM) and NMR into a single device. Moreover, proposals on combining NMR technology with additive manufacturing, i.e., 3D printing methods, came up. Here, the characterization as well as the measurement would be integrated in a single process, allowing us to generate miniaturized systems in a way that was not even considered ten years ago.
4. Conclusions
Macroscale measurement of gas flow parameters with conventional technology like thermistors, pressure sensors etc. is no longer a problem, but scaling those systems down into the mini or micro scale remains a challenge. Due to either insufficient size of classical sensors or insufficient possibilities to position micro sensors in the gas flow, the measurement largely influences the process itself. Non-intrusive methods are possible, but show other limitations, like optical accessibility, the need for high power light exposure or non-magnetic equipment materials.
One of the most interesting measurement problems is to achieve timely and spatially correlated results. By using conventional methods involving thermistors, GC, MS, Raman, IR or UV spectroscopy, pressure transducers etc., this is almost impossible. Either the measurement location largely differs, or the time resolution is simply not suitable. In addition, the combination of data from different measurement sources is not trivial. The use of nuclear magnetic resonance systems (NMR), which in principle allow measurement of a multitude of parameters at least at the same location, and in most cases with the same spatial resolution, eases this problem slightly. Here, results can be obtained from the same measurement location, show a consistent data format, and can therefore be easily correlated. Even visualization is relatively easily achieved by combining regular NMR with magnetic resonance imaging MRI, which adds some more valuable data to the parameter cloud obtained by the measurement. The scale range for NMR / MRI systems reaches from the macro to the nano scale. Spatial and time resolution do not depend on the scale but rather on the magnetic system, which is also an advantage compared to other measurement methods.
Recently, NMR and MRI systems themselves have been targets of miniaturization. Meanwhile, benchtop low field NMR systems up to 80MHz resonance frequency (about 1.88T) are available which can easily run in a conventional lab environment, used for stationary or flow-through data achievements. These systems are easy to handle and deliver a bunch of analytical possibilities. Nevertheless, miniaturization went on, and meanwhile developments are reaching into the direction of mini or micro NMR systems [125,127,128,129]. Even wireless systems are now being researched; thus, it can be expected that application of miniaturized and integrated NMR in correlative measurements will be greatly enhanced in the future.
A vision remains of having measurements of different parameters by NMR with the same time resolution, as well as the possibility of measuring all the desired parameters of a process. Thus, combinations of a multitude of analysis instruments will be necessary, ideally within a single system, controlled by a combined measurement electronic system, which internally triggers all methods.
Funding
This research received funding by the European Commission H2020 Marie Skłodowska-Curie Actions under the Grant Agreement (grant number 643095 “MIGRATE”).
Acknowledgments
The author wish to acknowledge Jan Korvink and Neil MacKinnon of KIT-IMT for lots of fruitful discussions, which led to some of the thoughts briefly described in this paper.
Conflicts of Interest
The author declares no conflict of interest.
References
- Kandlikar, S.G.; Colin, S.; Peles, Y.; Garimella, S.; Pease, R.F.; Brandner, J.J.; Tuckerman, D.B. Heat Transfer in Microchannels—2012 Status and Research Needs. J. Heat Transf. 2013, 135, 091001. [Google Scholar] [CrossRef]
- Morini, G.L. Single-phase convective heat transfer in microchannels: A review of experimental results. Int. J. Therm. Sci. 2004, 43, 631–651. [Google Scholar] [CrossRef]
- Mohammed, H.A.; Bhaskaran, G.; Shuaib, N.H.; Saidur, R. Heat transfer and fluid flow characteristics in microchannels heat exchanger using nanofluids: A review. Renew. Sustain. Energy Rev. 2011, 15, 1502–1512. [Google Scholar] [CrossRef]
- Han, Y.; Liu, Y.; Li, M.; Huang, J. A review of development of micro-channel heat exchanger applied in air-conditioning system. Energy Procedia 2012, 14, 148–153. [Google Scholar] [CrossRef] [Green Version]
- Dixit, T.; Ghosh, I. Review of micro- and mini-channel heat sinks and heat exchangers for single phase fluids. Renew. Sustain. Energy Rev. 2015, 41, 1298–1311. [Google Scholar] [CrossRef]
- Rosa, P.; Karayiannis, T.G.; Collins, M.W. Single-phase heat transfer in microchannels: The importance of scaling effects. Appl. Therm. Eng. 2009, 29, 3447–3468. [Google Scholar] [CrossRef] [Green Version]
- Mohammed Adham, A.; Mohd-Ghazali, N.; Ahmad, R. Thermal and hydrodynamic analysis of microchannel heat sinks: A review. Renew. Sustain. Energy Rev. 2013, 21, 614–622. [Google Scholar] [CrossRef]
- Colin, S. Gas Microflows in the Slip Flow Regime: A Critical Review on Convective Heat Transfer. J. Heat Transf. 2011, 134, 020908. [Google Scholar] [CrossRef]
- Yin, S.; Meyer, M.; Li, W.; Liao, H.; Lupoi, R. Gas Flow, Particle Acceleration, and Heat Transfer in Cold Spray: A review. J. Therm. Spray Technol. 2016, 25, 874–896. [Google Scholar] [CrossRef]
- Asadi, M.; Xie, G.; Sunden, B. A review of heat transfer and pressure drop characteristics of single and two-phase microchannels. Int. J. Heat Mass Transf. 2014, 79, 34–53. [Google Scholar] [CrossRef]
- Salman, B.H.; Mohammed, H.A.; Munisamy, K.M.; Kherbeet, A.S. Characteristics of heat transfer and fluid flow in microtube and microchannel using conventional fluids and nanofluids: A review. Renew. Sustain. Energy Rev. 2013, 28, 848–880. [Google Scholar] [CrossRef]
- Zhai, Y.; Xia, G.; Li, Z.; Wang, H. Experimental investigation and empirical correlations of single and laminar convective heat transfer in microchannel heat sinks. Exp. Therm. Fluid Sci. 2017, 83, 207–214. [Google Scholar] [CrossRef]
- Sahar, A.M.; Özdemir, M.R.; Fayyadh, E.M.; Wissink, J.; Mahmoud, M.M.; Karayiannis, T.G. Single phase flow pressure drop and heat transfer in rectangular metallic microchannels. Appl. Therm. Eng. 2016, 93, 1324–1336. [Google Scholar] [CrossRef]
- Kim, B. An experimental study on fully developed laminar flow and heat transfer in rectangular microchannels. Int. J. Heat Fluid Flow 2016, 62, 224–232. [Google Scholar] [CrossRef]
- Mokrani, O.; Bourouga, B.; Castelain, C.; Peerhossaini, H. Fluid flow and convective heat transfer in flat microchannels. Int. J. Heat Mass Transf. 2009, 52, 1337–1352. [Google Scholar] [CrossRef]
- Sahar, A.M.; Wissink, J.; Mahmoud, M.M.; Karayiannis, T.G.; Ashrul Ishak, M.S. Effect of hydraulic diameter and aspect ratio on single phase flow and heat transfer in a rectangular microchannel. Appl. Therm. Eng. 2017, 115, 793–814. [Google Scholar] [CrossRef]
- Hessel, V.; Angeli, P.; Gavriilidis, A.; Löwe, H. Gas−Liquid and Gas−Liquid−Solid Microstructured Reactors: Contacting Principles and Applications. Ind. Eng. Chem. Res. 2005, 44, 9750–9769. [Google Scholar] [CrossRef]
- Doku, G.N.; Verboom, W.; Reinhoudt, D.N.; van den Berg, A. On-microchip multiphase chemistry—A review of microreactor design principles and reagent contacting modes. Tetrahedron 2005, 61, 2733–2742. [Google Scholar] [CrossRef]
- Su, Y.; Zhao, Y.; Chen, G.; Yuan, Q. Liquid–liquid two-phase flow and mass transfer characteristics in packed microchannels. Chem. Eng. Sci. 2010, 65, 3947–3956. [Google Scholar] [CrossRef]
- Woitalka, A.; Kuhn, S.; Jensen, K.F. Scalability of mass transfer in liquid–liquid flow. Chem. Eng. Sci. 2014, 116, 1–8. [Google Scholar] [CrossRef] [Green Version]
- Kashid, M.N.; Renken, A.; Kiwi-Minsker, L. Gas–liquid and liquid–liquid mass transfer in microstructured reactors. Chem. Eng. Sci. 2011, 66, 3876–3897. [Google Scholar] [CrossRef]
- Reichmann, F.; Tollkötter, A.; Körner, S.; Kockmann, N. Gas-liquid dispersion in micronozzles and microreactor design for high interfacial area. Chem. Eng. Sci. 2017, 169, 151–163. [Google Scholar] [CrossRef]
- Yao, C.; Dong, Z.; Zhao, Y.; Chen, G. Gas-liquid flow and mass transfer in a microchannel under elevated pressures. Chem. Eng. Sci. 2015, 123, 137–145. [Google Scholar] [CrossRef]
- Haase, S.; Murzin, D.Y.; Salmi, T. Review on hydrodynamics and mass transfer in minichannel wall reactors with gas–liquid Taylor flow. Chem. Eng. Res. Des. 2016, 113, 304–329. [Google Scholar] [CrossRef]
- Yue, J. Multiphase flow processing in microreactors combined with heterogeneous catalysis for efficient and sustainable chemical synthesis. Catal. Today 2018, 308, 3–19. [Google Scholar] [CrossRef]
- Tanimu, A.; Jaenicke, S.; Alhooshani, K. Heterogeneous catalysis in continuous flow microreactors: A review of methods and applications. Chem. Eng. J. 2017, 327, 792–821. [Google Scholar] [CrossRef]
- Yao, X.; Zhang, Y.; Du, L.; Liu, J.; Yao, J. Review of the applications of microreactors. Renew. Sustain. Energy Rev. 2015, 47, 519–539. [Google Scholar] [CrossRef]
- Kolb, G. Review: Microstructured reactors for distributed and renewable production of fuels and electrical energy. Chem. Eng. Process. Process Intensif. 2013, 65, 1–44. [Google Scholar] [CrossRef]
- Pennemann, H.; Kolb, G. Review: Microstructured reactors as efficient tool for the operation of selective oxidation reactions. Catal. Today 2016, 278, 3–21. [Google Scholar] [CrossRef]
- Rossetti, I.; Compagnoni, M. Chemical reaction engineering, process design and scale-up issues at the frontier of synthesis: Flow chemistry. Chem. Eng. J. 2016, 296, 56–70. [Google Scholar] [CrossRef] [Green Version]
- Zhao, J.; Yao, J.; Zhang, M.; Zhang, L.; Yang, Y.; Sun, H.; An, S.; Li, A. Study of Gas Flow Characteristics in Tight Porous Media with a Microscale Lattice Boltzmann Model. Sci. Rep. 2016, 6, 32393. [Google Scholar] [CrossRef] [PubMed] [Green Version]
- Harley, J.C.; Huang, Y.; Bau, H.H.; Zemel, J.N. Gas flow in micro-channels. J. Fluid Mech. 2006, 284, 257–274. [Google Scholar] [CrossRef]
- Ho, C.-M.; Tai, Y.-C. Micro-electro-mechanical-systems (MEMS) and fluid flows. Annu. Rev. Fluid Mech. 1998, 30, 579–612. [Google Scholar] [CrossRef]
- Hetsroni, G.; Mosyak, A.; Pogrebnyak, E.; Yarin, L.P. Fluid flow in micro-channels. Int. J. Heat Mass Transf. 2005, 48, 1982–1998. [Google Scholar] [CrossRef]
- Goldstein, R. Fluid Mechanics Measurements, 2nd ed.; Taylor & Francis: Abingdon, UK, 2017. [Google Scholar]
- Web of Science. Gas Sensors; Clarivate Analytics: Philadelphia, PA, USA, 2019. [Google Scholar]
- Yunusa, Z.; Hamidon, M.N.; Kaiser, A.; Awang, Z. Gas Sensors: A Review. Sens. Transducers 2014, 168, 61–75. [Google Scholar]
- Llobet, E. Gas sensors using carbon nanomaterials: A review. Sens. Actuators B Chem. 2013, 179, 32–45. [Google Scholar] [CrossRef]
- Varghese, S.S.; Lonkar, S.; Singh, K.K.; Swaminathan, S.; Abdala, A. Recent advances in graphene based gas sensors. Sens. Actuators B Chem. 2015, 218, 160–183. [Google Scholar] [CrossRef]
- Meng, F.-L.; Guo, Z.; Huang, X.-J. Graphene-based hybrids for chemiresistive gas sensors. TRAC Trends Anal. Chem. 2015, 68, 37–47. [Google Scholar] [CrossRef]
- Pandey, S. Highly sensitive and selective chemiresistor gas/vapor sensors based on polyaniline nanocomposite: A comprehensive review. J. Sci. Adv. Mater. Devices 2016, 1, 431–453. [Google Scholar] [CrossRef] [Green Version]
- Kuberský, P.; Syrový, T.; Hamáček, A.; Nešpůrek, S.; Stejskal, J. Printed Flexible Gas Sensors based on Organic Materials. Procedia Eng. 2015, 120, 614–617. [Google Scholar] [CrossRef] [Green Version]
- Elhaes, H.; Fakhry, A.; Ibrahim, M. Carbon nano materials as gas sensors. Mater. Today Proc. 2016, 3, 2483–2492. [Google Scholar] [CrossRef]
- Basu, S.; Bhattacharyya, P. Recent developments on graphene and graphene oxide based solid state gas sensors. Sens. Actuators B Chem. 2012, 173, 1–21. [Google Scholar] [CrossRef]
- Toda, K.; Furue, R.; Hayami, S. Recent progress in applications of graphene oxide for gas sensing: A review. Anal. Chim. Acta 2015, 878, 43–53. [Google Scholar] [CrossRef] [PubMed]
- Xu, K.; Fu, C.; Gao, Z.; Wei, F.; Ying, Y.; Xu, C.; Fu, G. Nanomaterial-based gas sensors: A review. Instrum. Sci. Technol. 2018, 46, 115–145. [Google Scholar] [CrossRef]
- Bogue, R. Nanomaterials for gas sensing: A review of recent research. Sens. Rev. 2014, 34, 1–8. [Google Scholar] [CrossRef]
- Zhang, J.; Liu, X.; Neri, G.; Pinna, N. Nanostructured Materials for Room-Temperature Gas Sensors. Adv. Mater. 2016, 28, 795–831. [Google Scholar] [CrossRef] [PubMed]
- Joshi, N.; Hayasaka, T.; Liu, Y.; Liu, H.; Oliveira, O.; Lin, L. A review on chemiresistive room temperature gas sensors based on metal oxide nanostructures, graphene and 2D transition metal dichalcogenides. Microchim. Acta 2018, 185, 213. [Google Scholar] [CrossRef]
- Liu, X.; Ma, T.; Pinna, N.; Zhang, J. Two-Dimensional Nanostructured Materials for Gas Sensing. Adv. Funct. Mater. 2017, 27, 1702168. [Google Scholar] [CrossRef]
- Mabeck, J.T.; Malliaras, G.G. Chemical and biological sensors based on organic thin-film transistors. Anal. Bioanal. Chem. 2006, 384, 343–353. [Google Scholar] [CrossRef] [PubMed]
- Liedberg, B.; Nylander, C.; Lunström, I. Surface plasmon resonance for gas detection and biosensing. Sens. Actuators 1983, 4, 299–304. [Google Scholar] [CrossRef]
- Diamond, D.; Coyle, S.; Scarmagnani, S.; Hayes, J. Wireless Sensor Networks and Chemo-/Biosensing. Chem. Rev. 2008, 108, 652–679. [Google Scholar] [CrossRef]
- Han, Z.J.; Mehdipour, H.; Li, X.; Shen, J.; Randeniya, L.; Yang, H.Y.; Ostrikov, K. SWCNT Networks on Nanoporous Silica Catalyst Support: Morphological and Connectivity Control for Nanoelectronic, Gas-Sensing, and Biosensing Devices. ACS Nano 2012, 6, 5809–5819. [Google Scholar] [CrossRef]
- Emiliyanov, G.; Høiby, P.E.; Pedersen, L.H.; Bang, O. Selective Serial Multi-Antibody Biosensing with TOPAS Microstructured Polymer Optical Fibers. Sensors 2013, 13, 3242. [Google Scholar] [CrossRef] [PubMed]
- Papkovsky, D.B. New oxygen sensors and their application to biosensing. Sens. Actuators B Chem. 1995, 29, 213–218. [Google Scholar] [CrossRef]
- Temiz, Y.; Lovchik, R.D.; Kaigala, G.V.; Delamarche, E. Lab-on-a-chip devices: How to close and plug the lab? Microelectron. Eng. 2015, 132, 156–175. [Google Scholar] [CrossRef]
- Walsh, D.I.; Kong, D.S.; Murthy, S.K.; Carr, P.A. Enabling Microfluidics: From Clean Rooms to Makerspaces. Trends Biotechnol. 2017, 35, 383–392. [Google Scholar] [CrossRef]
- Chiu, D.T.; deMello, A.J.; Di Carlo, D.; Doyle, P.S.; Hansen, C.; Maceiczyk, R.M.; Wootton, R.C.R. Small but Perfectly Formed? Successes, Challenges, and Opportunities for Microfluidics in the Chemical and Biological Sciences. Chem 2017, 2, 201–223. [Google Scholar] [CrossRef]
- Childs, P.R.N.; Greenwood, J.R.; Long, C.A. Review of temperature measurement. Rev. Sci. Instrum. 2000, 71, 2959–2978. [Google Scholar] [CrossRef] [Green Version]
- Bacci da Silva, M.; Wallbank, J. Cutting temperature: Prediction and measurement methods—A review. J. Mater. Process. Technol. 1999, 88, 195–202. [Google Scholar] [CrossRef]
- Azad, A.M.; Akbar, S.A.; Mhaisalkar, S.G.; Birkefeld, L.D.; Goto, K.S. Solid-State Gas Sensors: A Review. J. Electrochem. Soc. 1992, 139, 3690–3704. [Google Scholar] [CrossRef]
- Hodgkinson, J.; Tatam, R.P. Optical gas sensing: A review. Meas. Sci. Technol. 2012, 24, 012004. [Google Scholar] [CrossRef]
- Warneke, B.A.; Pister, K.S.J. MEMS for distributed wireless sensor networks. In Proceedings of the 9th International Conference on Electronics, Circuits and Systems, Dubrovnik, Croatia, 15–18 September 2002; Volume 291, pp. 291–294. [Google Scholar]
- Lakafosis, V.; Rida, A.; Vyas, R.; Yang, L.; Nikolaou, S.; Tentzeris, M.M. Progress Towards the First Wireless Sensor Networks Consisting of Inkjet-Printed, Paper-Based RFID-Enabled Sensor Tags. Proc. IEEE 2010, 98, 1601–1609. [Google Scholar] [CrossRef] [Green Version]
- Yao, W.; Chu, C.-H.; Li, Z. The Adoption and Implementation of RFID Technologies in Healthcare: A Literature Review. J. Med Syst. 2012, 36, 3507–3525. [Google Scholar] [CrossRef] [PubMed]
- Abad, E.; Zampolli, S.; Marco, S.; Scorzoni, A.; Mazzolai, B.; Juarros, A.; Gómez, D.; Elmi, I.; Cardinali, G.C.; Gómez, J.M.; et al. Flexible tag microlab development: Gas sensors integration in RFID flexible tags for food logistic. Sens. Actuators B Chem. 2007, 127, 2–7. [Google Scholar] [CrossRef] [Green Version]
- Kassal, P.; Steinberg, M.D.; Steinberg, I.M. Wireless chemical sensors and biosensors: A review. Sens. Actuators B Chem. 2018, 266, 228–245. [Google Scholar] [CrossRef]
- Strömmer, E.; Hillukkala, M.; Ylisaukko-oja, A. Ultra-low Power Sensors with Near Field Communication for Mobile Applications. In Proceedings of the WSAN 2007: Wireless Sensor and Actor Networks, Albacete, Spain, 24–26 September 2007. [Google Scholar]
- Kuswandi, B.; Nuriman; Huskens, J.; Verboom, W. Optical sensing systems for microfluidic devices: A review. Anal. Chim. Acta 2007, 601, 141–155. [Google Scholar] [CrossRef]
- Choi, J.-R.; Song, H.; Sung, J.H.; Kim, D.; Kim, K. Microfluidic assay-based optical measurement techniques for cell analysis: A review of recent progress. Biosens. Bioelectron. 2016, 77, 227–236. [Google Scholar] [CrossRef]
- Lin, S.-W.; Chang, C.-H.; Lin, C.-H. High-throughput Fluorescence Detections in Microfluidic Systems. Genom. Med. Biomark. Health Sci. 2011, 3, 27–38. [Google Scholar] [CrossRef] [Green Version]
- Yang, F.; Li, X.-C.; Zhang, W.; Pan, J.-B.; Chen, Z.-G. A facile light-emitting-diode induced fluorescence detector coupled to an integrated microfluidic device for microchip electrophoresis. Talanta 2011, 84, 1099–1106. [Google Scholar] [CrossRef] [PubMed]
- Geng, X.; Wu, D.; Wu, Q.; Guan, Y. Signal-to-noise ratio enhancement of the compact light-emitting diode-induced fluorescence detector. Talanta 2012, 100, 27–31. [Google Scholar] [CrossRef] [Green Version]
- Xu, B.; Yang, M.; Wang, H.; Zhang, H.; Jin, Q.; Zhao, J.; Wang, H. Line laser beam based laser-induced fluorescence detection system for microfluidic chip electrophoresis analysis. Sens. Actuators A Phys. 2009, 152, 168–175. [Google Scholar] [CrossRef]
- Wolfbeis, O.S. Fiber-Optic Chemical Sensors and Biosensors. Anal. Chem. 2008, 80, 4269–4283. [Google Scholar] [CrossRef]
- Vittoriosi, A.; Brandner, J.J.; Dittmeyer, R. Integrated temperature microsensors for the characterization of gas heat transfer. J. Phys. Conf. Ser. 2012, 362, 012021. [Google Scholar] [CrossRef] [Green Version]
- Vittoriosi, A.; Brandner, J.J.; Dittmeyer, R. A sensor-equipped microchannel system for the thermal characterization of rarefied gas flows. Exp. Therm. Fluid Sci. 2012, 41, 112–120. [Google Scholar] [CrossRef]
- Kim, M.M.; Giry, A.; Mastiani, M.; Rodrigues, G.O.; Reis, A.; Mandin, P. Microscale thermometry: A review. Microelectron. Eng. 2015, 148, 129–142. [Google Scholar] [CrossRef]
- Yang, Y.; Morini, G.L.; Brandner, J.J. Experimental analysis of the influence of wall axial conduction on gas-to-gas micro heat exchanger effectiveness. Int. J. Heat Mass Transf. 2014, 69, 17–25. [Google Scholar] [CrossRef]
- Genix, M.; Vairac, P.; Cretin, B. Local temperature surface measurement with intrinsic thermocouple. Int. J. Therm. Sci. 2009, 48, 1679–1682. [Google Scholar] [CrossRef]
- Makinwa, K.A.A. Smart temperature sensors in standard CMOS. Procedia Eng. 2010, 5, 930–939. [Google Scholar] [CrossRef] [Green Version]
- Abram, C.; Fond, B.; Beyrau, F. Temperature measurement techniques for gas and liquid flows using thermographic phosphor tracer particles. Prog. Energy Combust. Sci. 2018, 64, 93–156. [Google Scholar] [CrossRef]
- Haslam, R.T.; Chappell, E.L. The Measurement of the Temperature of a Flowing Gas. Ind. Eng. Chem. 1925, 17, 402–408. [Google Scholar] [CrossRef]
- Hocker, G.B. Fiber-optic sensing of pressure and temperature. Appl. Opt. 1979, 18, 1445–1448. [Google Scholar] [CrossRef] [PubMed]
- Bhatia, V.; Vengsarkar, A.M. Optical fiber long-period grating sensors. Opt. Lett. 1996, 21, 692–694. [Google Scholar] [CrossRef] [PubMed]
- Morey, W.W.; Meltz, G.; Glenn, W.H. Fiber Optic Bragg Grating Sensors. In Proceedings of the Fiber Optic and Laser Sensors VII, Boston, MA, USA, 5–7 September 1989; Voume 1169. [Google Scholar]
- Hayes, A. Available online: https://www.flowcontrolnetwork.com/rtds-vs-thermocouples/ (accessed on 1 April 2019).
- Kibble, B.P. Wheatstone Bridge; McGraw-Hill Education: New York, NY, USA, 2014. [Google Scholar] [CrossRef]
- Park, R.; Caroll, R.; Burns, G.B.; Desmaris, R.; Hall, F.; Herzkovitz, M.; MacKenzie, D.; McGuire, E.; Reed, R.; Sparks, L.; et al. Manual on the Use of Thermocouples in Temperature Measurement, 4th ed.; ASTM International: West Conshohocken, PA, USA, 1993. [Google Scholar] [CrossRef]
- Carullo, A.; Corbellini, S.; Parvis, M.; Vallan, A. A Wireless Sensor Network for Cold-Chain Monitoring. IEEE Trans. Instrum. Meas. 2009, 58, 1405–1411. [Google Scholar] [CrossRef] [Green Version]
- Yang, J. A Silicon Carbide Wireless Temperature Sensing System for High Temperature Applications. Sensors 2013, 13, 1884. [Google Scholar] [CrossRef] [PubMed]
- Popovic, Z.; Momenroodaki, P.; Scheeler, R. Toward wearable wireless thermometers for internal body temperature measurements. IEEE Commun. Mag. 2014, 52, 118–125. [Google Scholar] [CrossRef]
- Bagavathiappan, S.; Lahiri, B.B.; Saravanan, T.; Philip, J.; Jayakumar, T. Infrared thermography for condition monitoring—A review. Infrared Phys. Technol. 2013, 60, 35–55. [Google Scholar] [CrossRef]
- Heyes, A.L.; Seefeldt, S.; Feist, J.P. Two-colour phosphor thermometry for surface temperature measurement. Opt. Laser Technol. 2006, 38, 257–265. [Google Scholar] [CrossRef]
- Chen, T.-F.; Nguyen, K.T.; Wen, S.-S.L.; Jen, C.-K. Temperature measurement of polymer extrusion by ultrasonic techniques. Meas. Sci. Technol. 1999, 10, 139–145. [Google Scholar] [CrossRef]
- Goss, L.P.; Smith, A.A.; Post, M.E. Surface Thermometry by Laser-Induced Fluorescence. Rev. Sci. Instrum. 1989, 60, 3702. [Google Scholar] [CrossRef]
- Moya, F.; Druet, S.A.J.; Taran, J.P.E. Gas spectroscopy and temperature measurement by coherent Raman anti-stokes scattering. Opt. Commun. 1975, 13, 169–174. [Google Scholar] [CrossRef]
- Bertsch, W. Two-Dimensional Gas Chromatography. Concepts, Instrumentation, and Applications—Part 1: Fundamentals, Conventional Two-Dimensional Gas Chromatography, Selected Applications. J. High Resolut. Chromatogr. 1999, 22, 647–665. [Google Scholar] [CrossRef]
- Bertsch, W. Two-Dimensional Gas Chromatography. Concepts, Instrumentation, and Applications—Part 2: Comprehensive Two-Dimensional Gas Chromatography. J. High Resolut. Chromatogr. 2000, 23, 167–181. [Google Scholar] [CrossRef]
- Suslick, K.S. Kirk-Othmer Encyclopedia of Chemical Technology; J. Wiley & Sons: New York, NY, USA. [CrossRef]
- Hirt, R.C.; Vandenbelt, J.M. Ultraviolet Spectrometry. Anal. Chem. 1964, 36, 308–312. [Google Scholar] [CrossRef]
- Schrötter, H.W. Update of reviews on Raman spectra of gases I. Linear Raman spectroscopy. J. Mol. Struct. 2003, 661–662, 465–468. [Google Scholar]
- Armentrout, P.B. Mass Spectrometric Methods for the Determination of Thermodynamic Data. In The Encyclopedia of Mass Spectrometry; Gross, M.L., Caprioli, R.M., Eds.; Elsevier: Boston, MD, USA, 2016; pp. 231–239. [Google Scholar] [CrossRef]
- Grayson, M.A. A History of Gas Chromatography Mass Spectrometry (GC/MS). In The Encyclopedia of Mass Spectrometry; Gross, M.L., Caprioli, R.M., Eds.; Elsevier: Boston, MD, USA, 2016; pp. 152–158. [Google Scholar] [CrossRef]
- Danieli, E.; Perlo, J.; Duchateau, A.L.L.; Verzijl, G.K.M.; Litvinov, V.M.; Blümich, B.; Casanova, F. On-Line Monitoring of Chemical Reactions by using Bench-Top Nuclear Magnetic Resonance Spectroscopy. ChemPhysChem 2014, 15, 3060–3066. [Google Scholar] [CrossRef]
- Guhl, S. Available online: https://opus4.kobv.de/opus4-bam/frontdoor/index/index/docId/39424 (accessed on 1 April 2019).
- Killner, M.H.M.; Garro Linck, Y.; Danieli, E.; Rohwedder, J.J.R.; Blümich, B. Compact NMR spectroscopy for real-time monitoring of a biodiesel production. Fuel 2015, 139, 240–247. [Google Scholar] [CrossRef] [Green Version]
- Kreyenschulte, D.; Paciok, E.; Regestein, L.; Blümich, B.; Büchs, J. Online monitoring of fermentation processes via non-invasive low-field NMR. Biotechnol. Bioeng. 2015, 112, 1810–1821. [Google Scholar] [CrossRef] [PubMed]
- Sanders, J.K.M.; Hunter, B.K. Modern NMR Spectroscopy: A Guide for Chemists; Oxford University Press: Oxford, UK, 1988. [Google Scholar]
- Brandner, J.J.; Maikowske, S.; Vittoriosi, A. A New Microstructure Device for Efficient Evaporation of Liquids. J. Therm. Sci. Technol. 2012, 7, 414–424. [Google Scholar] [CrossRef] [Green Version]
- Henning, T.; Brandner, J.J.; Schubert, K. High-speed imaging of flow in microchannel array water evaporators. Microfluid. Nanofluidics 2005, 1, 128–136. [Google Scholar] [CrossRef]
- Henning, T.; Brandner, J.J.; Schubert, K.; Lorenzini, M.; Morini, G.L. Low-Frequency Instabilities in the Operation of Metallic Multi-Microchannel Evaporators. Heat Transf. Eng. 2007, 28, 834–841. [Google Scholar] [CrossRef]
- Brandner, J.J.; Emig, G.; Liauw, M.A.; Schubert, K. Fast temperature cycling in microstructure devices. Chem. Eng. J. 2004, 101, 217–224. [Google Scholar] [CrossRef]
- Luther, M.; Brandner, J.J.; Kiwi-Minsker, L.; Renken, A.; Schubert, K. Forced periodic temperature cycling of chemical reactions in microstructure devices. Chem. Eng. Sci. 2008, 63, 4955–4961. [Google Scholar] [CrossRef] [Green Version]
- Luther, M.; Brandner, J.J.; Schubert, K.; Renken, A.; Kiwi-Minsker, L. Novel design of a microstructured reactor allowing fast temperature oscillations. Chem. Eng. J. 2007, 135, S254–S258. [Google Scholar] [CrossRef]
- Hellén, H.; Schallhart, S.; Praplan, A.P.; Petäjä, T.; Hakola, H. Using in situ GC-MS for analysis of C2–C7 volatile organic acids in ambient air of a boreal forest site. Atmos. Meas. Tech. 2017, 10, 281–289. [Google Scholar] [CrossRef]
- Köckenberger, W.; Panfilis, C.D.; Santoro, D.; Dahiya, P.; Rawsthorne, S. High resolution NMR microscopy of plants and fungi. J. Microsc. 2004, 214, 182–189. [Google Scholar] [CrossRef] [PubMed] [Green Version]
- Uecker, M.; Zhang, S.; Voit, D.; Karaus, A.; Merboldt, K.D.; Frahm, J. Real-time MRI at a resolution of 20 ms. NMR Biomed. 2010, 23, 986–994. [Google Scholar] [CrossRef] [PubMed]
- Parker, D.L.; Smith, V.; Sheldon, P.; Crooks, L.E.; Fussell, L. Temperature distribution measurements in two-dimensional NMR imaging. Med. Phys. 1983, 10, 321–325. [Google Scholar] [CrossRef]
- Kleinberg, R.L. Utility of NMR T2 distributions, connection with capillary pressure, clay effect, and determination of the surface relaxivity parameter ρ2. Magn. Reson. Imaging 1996, 14, 761–767. [Google Scholar] [CrossRef]
- Thorn, R.; Johansen, G.A.; Hammer, E.A. Recent developments in three-phase flow measurement. Meas. Sci. Technol. 1997, 8, 691–701. [Google Scholar] [CrossRef]
- Weber, H.W.; Kimmich, R. Anomalous segment diffusion in polymers and NMR relaxation spectroscopy. Macromolecules 1993, 26, 2597–2606. [Google Scholar] [CrossRef]
- Akoka, S.; Barantin, L.; Trierweiler, M. Concentration Measurement by Proton NMR Using the ERETIC Method. Anal. Chem. 1999, 71, 2554–2557. [Google Scholar] [CrossRef]
- Korvink, J.G.; Badilita, V.; Bordonali, L.; Jouda, M.; Mager, D.; MacKinnon, N. Nuclear magnetic resonance microscopy for in vivo metabolomics, digitally twinned by computational systems biology, needs a sensitivity boost. Sens. Mater. 2018, 30, 157–166. [Google Scholar] [CrossRef]
- MacKinnon, N.; While, P.T.; Korvink, J.G. Novel selective TOCSY method enables NMR spectral elucidation of metabolomic mixtures. J. Magn. Reson. 2016, 272, 147–157. [Google Scholar] [CrossRef] [PubMed]
- Badilita, V.; Kratt, K.; Baxan, N.; Anders, J.; Elverfeldt, D.; Boero, G.; Hennig, J.; Korvink, J.G.; Wallrabe, U. 3D solenoidal microcoil arrays with CMOS integrated amplifiers for parallel MR imaging and spectroscopy. In Proceedings of the 2011 IEEE 24th International Conference on Micro Electro Mechanical Systems, Cancun, Mexico, 23–27 January 2011; pp. 809–812. [Google Scholar]
- Badilita, V.; Fassbender, B.; Kratt, K.; Wong, A.; Bonhomme, C.; Sakellariou, D.; Korvink, J.G.; Wallrabe, U. Microfabricated Inserts for Magic Angle Coil Spinning (MACS) Wireless NMR Spectroscopy. PLoS ONE 2012, 7, e42848. [Google Scholar] [CrossRef] [PubMed]
- Spengler, N.; Höfflin, J.; Moazenzadeh, A.; Mager, D.; MacKinnon, N.; Badilita, V.; Wallrabe, U.; Korvink, J.G. Heteronuclear Micro-Helmholtz Coil Facilitates µm-Range Spatial and Sub-Hz Spectral Resolution NMR of nL-Volume Samples on Customisable Microfluidic Chips. PLoS ONE 2016, 11, e0146384. [Google Scholar] [CrossRef] [PubMed]
Figure 1.
Microstructure fluidic device. (a) Micro heat pipe, opened to see the inside structure. Inner diameter is 0.8 mm. From: KIT-IMVT; (b) Miniaturized Type K thermocouple. Although this sensor has an outer diameter of 0.4 mm only, a major part of the structure in (a) would have been blocked. Picture from: www.ninomiya-ew.co.jp.

Figure 2.
Silicon microstructure chip for temperature measurement in a gas flow. The chip is inserted into a sealed housing and forms the fourth side of a rectangular microchannel. Numerous thermopiles have been implemented into the chip, to measure the temperature of a gas flow in combination with precision resistors [78]. www.gasmems.eu.

Figure 3.
Bifurcative microchannel distribution system for liquids and gases. (a) Overview to a major part of the system; (b) Magnification of one of the splits from (a). A step between the single incoming channel and the two outgoing channels is clearly visible, which is due to manufacturing. Reproduced with permission from [111], published by J-STAGE, 2012.

Figure 4.
400 MHz (9.4 T) NMR system of the Bruker company.

Figure 5.
Magnetic resonance tomography (MRT) cut picture of a human head as an example for the MRI possibilities. From: Private.
Figure 5.
Magnetic resonance tomography (MRT) cut picture of a human head as an example for the MRI possibilities. From: Private.

Figure 6.
Current state-of-the-art sequential measurement and analysis method. The timely and locally separated measurement makes it difficult or even impossible to correlate measurement results to each other and retrieve by this deeper insight into the underlying mechanisms.
Figure 6.
Current state-of-the-art sequential measurement and analysis method. The timely and locally separated measurement makes it difficult or even impossible to correlate measurement results to each other and retrieve by this deeper insight into the underlying mechanisms.

Figure 7.
Future improved parallel measurement and analysis method. The detectors are triggered automatically in a way that they all measure at the same location, and deliver the measured data with the same spatial and time resolution. Data are then transferred to an analysis level, where they are correlated.

© 2019 by the author. Licensee MDPI, Basel, Switzerland. This article is an open access article distributed under the terms and conditions of the Creative Commons Attribution (CC BY) license (http://creativecommons.org/licenses/by/4.0/).
Share and Cite
MDPI and ACS Style
Brandner, J.J. In-Situ Measurements in Microscale Gas Flows—Conventional Sensors or Something Else? Micromachines 2019, 10, 292. https://doi.org/10.3390/mi10050292
AMA Style
Brandner JJ. In-Situ Measurements in Microscale Gas Flows—Conventional Sensors or Something Else? Micromachines. 2019; 10(5):292. https://doi.org/10.3390/mi10050292
Chicago/Turabian StyleBrandner, Juergen J. 2019. "In-Situ Measurements in Microscale Gas Flows—Conventional Sensors or Something Else?" Micromachines 10, no. 5: 292. https://doi.org/10.3390/mi10050292
Note that from the first issue of 2016, this journal uses article numbers instead of page numbers. See further details here.