μ-Coriolis Mass Flow Sensor with Resistive Readout


1
MESA+ Institute for Nanotechnology, University of Twente, P.O. Box 217, 7500 AE Enschede, The Netherlands
2
Bronkhorst High-Tech BV, Nijverheidsstraat 1A, 7261 AK Ruurlo, The Netherlands
*
Author to whom correspondence should be addressed.
Micromachines 2020, 11(2), 184; https://doi.org/10.3390/mi11020184
Submission received: 28 January 2020
/
Revised: 7 February 2020
/
Accepted: 8 February 2020
/
Published: 11 February 2020
(This article belongs to the Special Issue MFHS 2019)
Abstract
:This paper presents a -Coriolis mass flow sensor with resistive readout. Instead of measuring a net displacement such as in a capacitive readout, a resistive readout detects the deformation of the suspended micro-fluidic channel. It allows for actuation at much higher amplitudes than for a capacitive readout, resulting in correspondingly larger Coriolis forces in response to fluid flow. A resistive readout can be operated in two actuation vibrational modes. A capacitive readout can only be operated in one of these two modes, which is more sensitive to external disturbances. Three types of devices have been realized. We present measurement results for all three devices. One device clearly outperforms the other two, with a flow sensitivity of 2.22 °/(g·h−1) and a zero-flow stability of 0.02 g·h−1 over 30 min. Optimization of the metal strain gauges and/or implementation of poly-Silicon strain gauges could further improve performance.
1. Introduction
A -Coriolis mass flow sensor measures true mass flow, independent of fluid properties. A free-hanging micro-channel is brought into resonance in a certain vibrational mode. A flow through the channel causes Coriolis forces, inducing a second mode of vibration. The ratio of the magnitudes of the two modes is a measure for the flow. These vibrations can be measured in multiple ways, e.g., optical, capacitive or resistive (strain gauges). An optical detection method requires either an external light source [1] or on-chip waveguide structures [2,3] usually used for in-plane vibrating devices and complicated to integrate into the fabrication process of a -Coriolis mass flow sensor. A capacitive readout has been shown to be a good method by Haneveld et al. [4], Sparks et al. [5], and by Groenesteijn et al. [6] with the most sensitive -Coriolis flow sensor to date. However, a capacitive readout has its limitations, such as limited actuation amplitude, pressure dependency, and influence of relative permittivity of the fluid. These limitations are explained in more detail in Section 2.2. A resistive readout based on strain gauges on the micro-channel does not suffer from the aforementioned limitations. This paper focuses on the implementation of strain gauges with a -Coriolis flow sensor as an alternative to a capacitive readout.
2. Materials and Methods
2.1. Operating Principle
Figure 1 shows the operation principle of a -Coriolis mass flow sensor. The sensor consists of a rectangular channel loop. The channel is fixed at the in-/outlet channel sections, as depicted in the figure. The channel loop is brought into resonance by Lorentz forces. These Lorentz forces are generated by a magnetic field and an alternating current i flowing through a metal track on top of the micro-channel. This actuates the sensor in the Twist/actuation mode with actuation angle . When a fluid flows through the micro-channel with a mass flow rate , Coriolis forces are induced in the channel section as indicated in Figure 1. This causes additional vibration in the Swing/detection mode with an angle and displacement . The ratio is a measure for the flow.
2.2. Capacitive Readout
-Coriolis mass flow sensors utilizing surface channels [7] with capacitive readout have been presented previously [4,6]. Figure 2 shows an SEM image of such a -Coriolis mass flow sensor, indicating the capacitive readout structures. They are centered around the rotational axis of the vibrational mode. Figure 3 shows the operation principle of the capacitive readout. For the capacitive readout, the sensor is typically actuated in the mode. When actuated, the capacitance signals over time are 180 out of phase. When a fluid flows through the channel, mode vibrations are induced causing common mode capacitance signals. During operation with flow, the sensor is actuated and a mass flow flows through the channel. This gives a combination of and mode vibrations. The capacitance signals will have a phase difference dependent on the mass flow rate .
As aforementioned, a capacitive readout has certain limitations. For one, the actuation amplitude is limited by inherent nonlinearity [8]. This limits the signal-to-noise ratio of the device. When stationary, the channel section to which the capacitor combs are attached floats slightly above the combs fixed to the substrate. This is due to residual stress in the silicon nitride channel developed during fabrication. The distance is in the order of a few . This means that when the actuation amplitude is high enough that the channel moves more than this distance, the capacitor combs will pass through each other. Figure 4 shows how this causes nonlinearity in capacitance.
An additional effect of nonlinearity of the capacitive readout is that mode actuation is not feasible. For mode actuation, the capacitive readout structures are put as close to the mode rotational axis as possible to maximize sensitivity to mode Coriolis vibrations. Thus, for mode actuation, one would like to maximize sensitivity for mode Coriolis vibrations. However, the largest displacements in both modes occur in the top corners of the channel loop (see Figure 3). Putting the readout structures here would limit the actuation amplitude even more, since relatively large displacements due to actuation occur here. Therefore, mode actuation is typically used for these devices. However, external vibrations can more easily induce vibrations in the mode. When the mode is used as Coriolis mode, small disturbances can have a significant effect on the output signal, since Coriolis displacements are relatively small (in the order of 10–100 nm). Because of this fact, it would be preferable to actuate the sensor in the and detect mode Coriolis forces.
Another effect is that pressure inside the channel causes the channel to bend upwards, due to its non-circular cross-section. This results in a change in distance between the capacitor combs, which shifts the point of nonlinearity (see Figure 4). This phenomenon is explained by Alveringh et al. [8]. Furthermore, relative permittivity of the fluid flowing through the channel influences the measured capacitance.
2.3. Resistive Readout
The resistance of a material is defined as:
where is the material’s resistivity, l is the length of the material, and A is its cross-sectional area. For a metal strain gauge, remains constant with deformation. The change in the ratio solely determines the change in resistance of the strain gauge, as opposed to piezo-resistive materials where changes with deformation of the material. The resistive readout presented in this paper is based on metal strain gauges, since their implementation requires no changes to the fabrication process of the -Coriolis mass flow sensor. After a first proof of principle, poly-silicon strain gauges could be used to significantly increase sensitivity to strain (explained in more detail in Section 4).
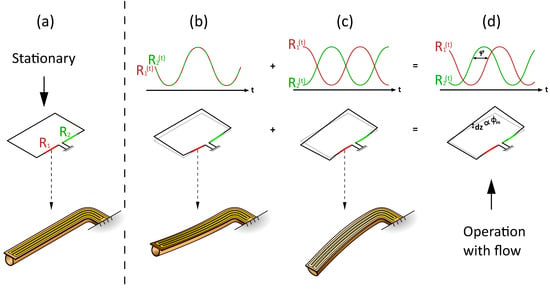
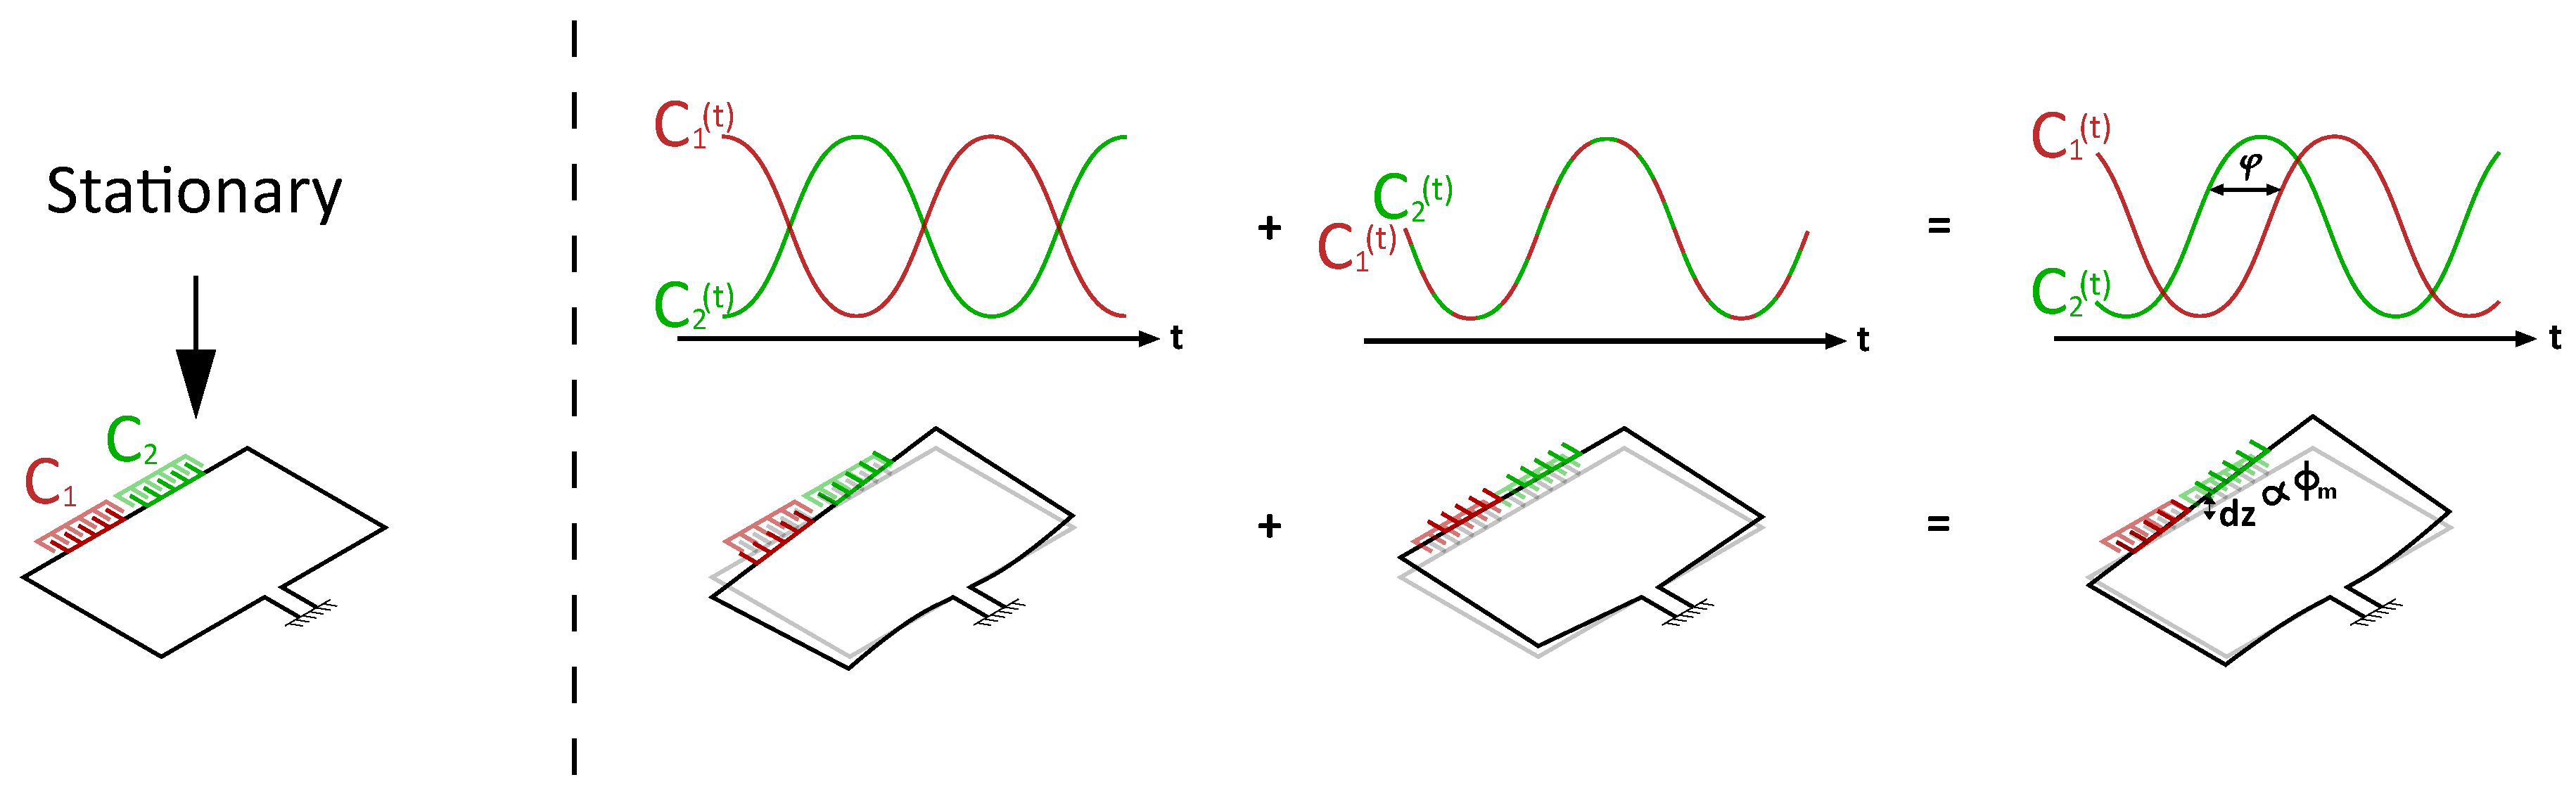
Figure 5 shows the operating principle of the resistive readout. In this example, the sensor is actuated in the Swing mode. Figure 5a shows the configuration of the strain gauges when the sensor is not being actuated. When the sensor is actuated (Figure 5b), both strain gauges are elongated at the same time and compressed at the same time. The resistances over time of the two strain gauges are thus in phase for the two strain gauges. When there is a flow through the channel, Coriolis forces induce vibration in the Twist mode; see Figure 5c. This vibration is 90 degrees out of phase relative to the actuation [4]. One strain gauge is elongated while the other is compressed. The resistances over time of the strain gauges are thus in opposite phase and ±90 degrees out of phase with the resistance change due to actuation. When combining actuation and Coriolis vibrations, the resistances of the strain gauges will have a phase difference which depends on the mass flow rate through the channel. This method of readout is advantageous, since it does not depend on the amplitudes of the resistive signals but only the phase. Temperature dependence in the amplitudes of the signal could be more significant for a capacitive readout. However, since the phase of the signals is measured, temperature dependence of the resistive readout should be comparable to that of a capacitive readout.
2.4. Design
Three designs of -Coriolis mass flow sensors with resistive readout were made, based on two channel loop structures. The sensors are designed to operate up to a mass flow rate corresponding to a pressure drop of 1 bar over the sensor for water flow. This is approximately 1.8 g·h−1. Figure 6 and Figure 7 show the two channel structures. Both designs are based on a channel loop of mm, which are typical dimensions of a -Coriolis mass flow sensor. Designs A and B share the same channel loop structure (Figure 6). The strain gauges in both designs reside on the channel sections with length . Additional membranes with length connect the channel loop to the substrate to allow for the actuation track. For design A, the strain gauges are patterned at a 45 angle to measure torsion of the channel section with length . This makes the design relatively more sensitive to mode vibrations. Thus, this design is designed for mode actuation ( mode Coriolis forces). For Design B, the strain gauges are patterned parallel to the channel section with length to measure bending along its axis. This makes the device relatively more sensitive to mode vibration. Thus, it is designed for mode actuation ( mode Coriolis forces). Microscopic photographs of the fabricated devices in Section 2.5 will show the difference between the two designs more clearly. Design C is based on a T-junction channel structure connected through two membranes to the main channel loop (Figure 7). This way, a location where stress is induced is created by design. Four strain gauges reside on the two membranes with length . Two of them will elongate, while the other two are compressed. This design can be used for both modes of actuation.
The vibrational modes for the different devices were simulated in COMSOL Multiphysics and are depicted in Figure 8. The / mode resonance frequencies are 2426/1312 respectively for device A&B. The stress is highest in the channel sections with length . Therefore, the two designs were made as aforementioned, optimized for / mode actuation respectively. For design C, the / mode resonance frequencies are 2519/1699 respectively (Figure 8c–d). The stress is highest where the two membranes with length are attached to the main channel loop and the T-junction channel structure. The sensitivity to either mode of actuation could be tuned by increasing/decreasing the distance between the two membranes, increasing/decreasing the sensitivity to mode vibration.
2.5. Fabrication
Integration of resistive strain gauges on top of the sensor tube is rather straightforward. The fabrication process of the sensor is based on the Surface Channel Technology (SCT) proposed in [7]. This is the same technology as used for -Coriolis mass flow sensors with capacitive readout [4,6]. A simplified schematic representation of the fabrication process is displayed in Figure 9. First, a layer of low stress silicon-rich silicon nitride (SiRN) (Thickness: 500 nm) is deposited on a Silicon wafer by LPCVD, see Figure 9a. On top of this, a layer of silicon di-oxide (SiO2) is deposited (Thickness: 500 nm), serving as a hard mask. Slits of 5 × 2 are etched through both layers by plasma etching, see Figure 9b. Then, the layer of SiO2 is removed and a channel is formed by semi-isotropically etching silicon through the slits, see Figure 9c. This is done by plasma etching as well. The channel is closed by conformally depositing another layer of low stress SiRN, see Figure 9d. Metal strain gauges are patterned on top of the channel (Figure 9e). Following this, openings are etched through the nitride and finally the channel is released by isotropic etching of silicon by an SF6 plasma.
Figure 10 shows microscope images of three sensor types that were designed and fabricated. The position of the strain gauges and reference resistors are indicated in the figure. The resistance value ratios between the devices are 1:0.73:0.37 (A:B:C) based on designed geometry. For all three devices, the sensor can in principle be actuated in either the or mode. However, sensitivity to flow differs throughout the devices and between actuation modes. As previously mentioned device A (Figure 10a,b) is designed for mode actuation. Coriolis vibrations in the mode are expected to induce torsion of the channel sections with length , see Figure 8a,b. The strain gauges are patterned at a 45 angle with respect to the channel, in order to measure this torsion. Device B (Figure 10c,d) is designed for mode actuation. Coriolis vibrations in the mode will cause bending of the channel sections as depicted in Figure 5 and Figure 8a,b. Finally, device C (Figure 10e,f) is designed to be used in either mode of actuation. Both and mode vibrations will cause elongation/compression of the strain gauges in a similar way, see Figure 8c,d. Therefore, the flow sensitivity of the device is expected to be similar for both modes of actuation. The sensitivity can be tuned by changing the distance between the two membranes on which the strain gauges reside. The larger this distance, the larger the sensitivity to mode vibrations and thus relatively lower sensitivity to mode vibrations.
2.6. Readout Electronics
The resistance of the strain gauges is read out using a circuit as depicted in Figure 11. represents either the left or the right strain gauge on the sensor. The resistance of one strain gauge is converted to a voltage via a high frequency () carrier signal and an on-chip reference resistor . In the case of device C, is another strain gauge with its resistance changing in the opposite direction with respect to . The carrier signal is mixed out after which an SR860 lock-in amplifier determines the magnitude and phase of the signal. This is done by first amplifying the signal. Then, the signal is multiplied by the actuation voltage and finally a low-pass filter filters out higher harmonics. Each strain gauge is read out with a circuit such as depicted in Figure 11. The phase difference between the two resulting signals is a measure for the mass flow rate.
2.7. Measurement Setup
Figure 12 shows the fluidic measurement setup. Nitrogen gas is fed through the sensor chip at an input pressure of 5 bar (gauge pressure). The mass flow rate is controlled between 0–0.6 g·h−1 by a mass flow controller at the outlet of the sensor chip.
3. Results
The resistances of the strain gauges were measured and are ∼1100/800/460 for design A/B/C, respectively. With ratios between the resistances of 1:0.73:0.42 (A:B:C), this corresponds to the theoretical resistance ratios presented in Section 2.5.
As previously mentioned, device A was designed for mode actuation. However, measurements showed that the device was not sensitive to mode Coriolis vibrations. The expectation was that mode vibrations would cause significant torsion of the channel sections on which the strain gauges reside as depicted in Figure 8b. However, Laser Doppler Vibrometer measurements showed that the upwards motion of the channel in the mode is mostly facilitated by bending of the channel section with length along its axis as opposed to torsion. This caused the strain gauges of device A to be sensitive to flow only when actuated in the mode. For device B, the sensor was only sensitive to flow when actuated in the mode, as expected. Device C was actuated in both modes and showed sensitivity to flow for both the and mode.
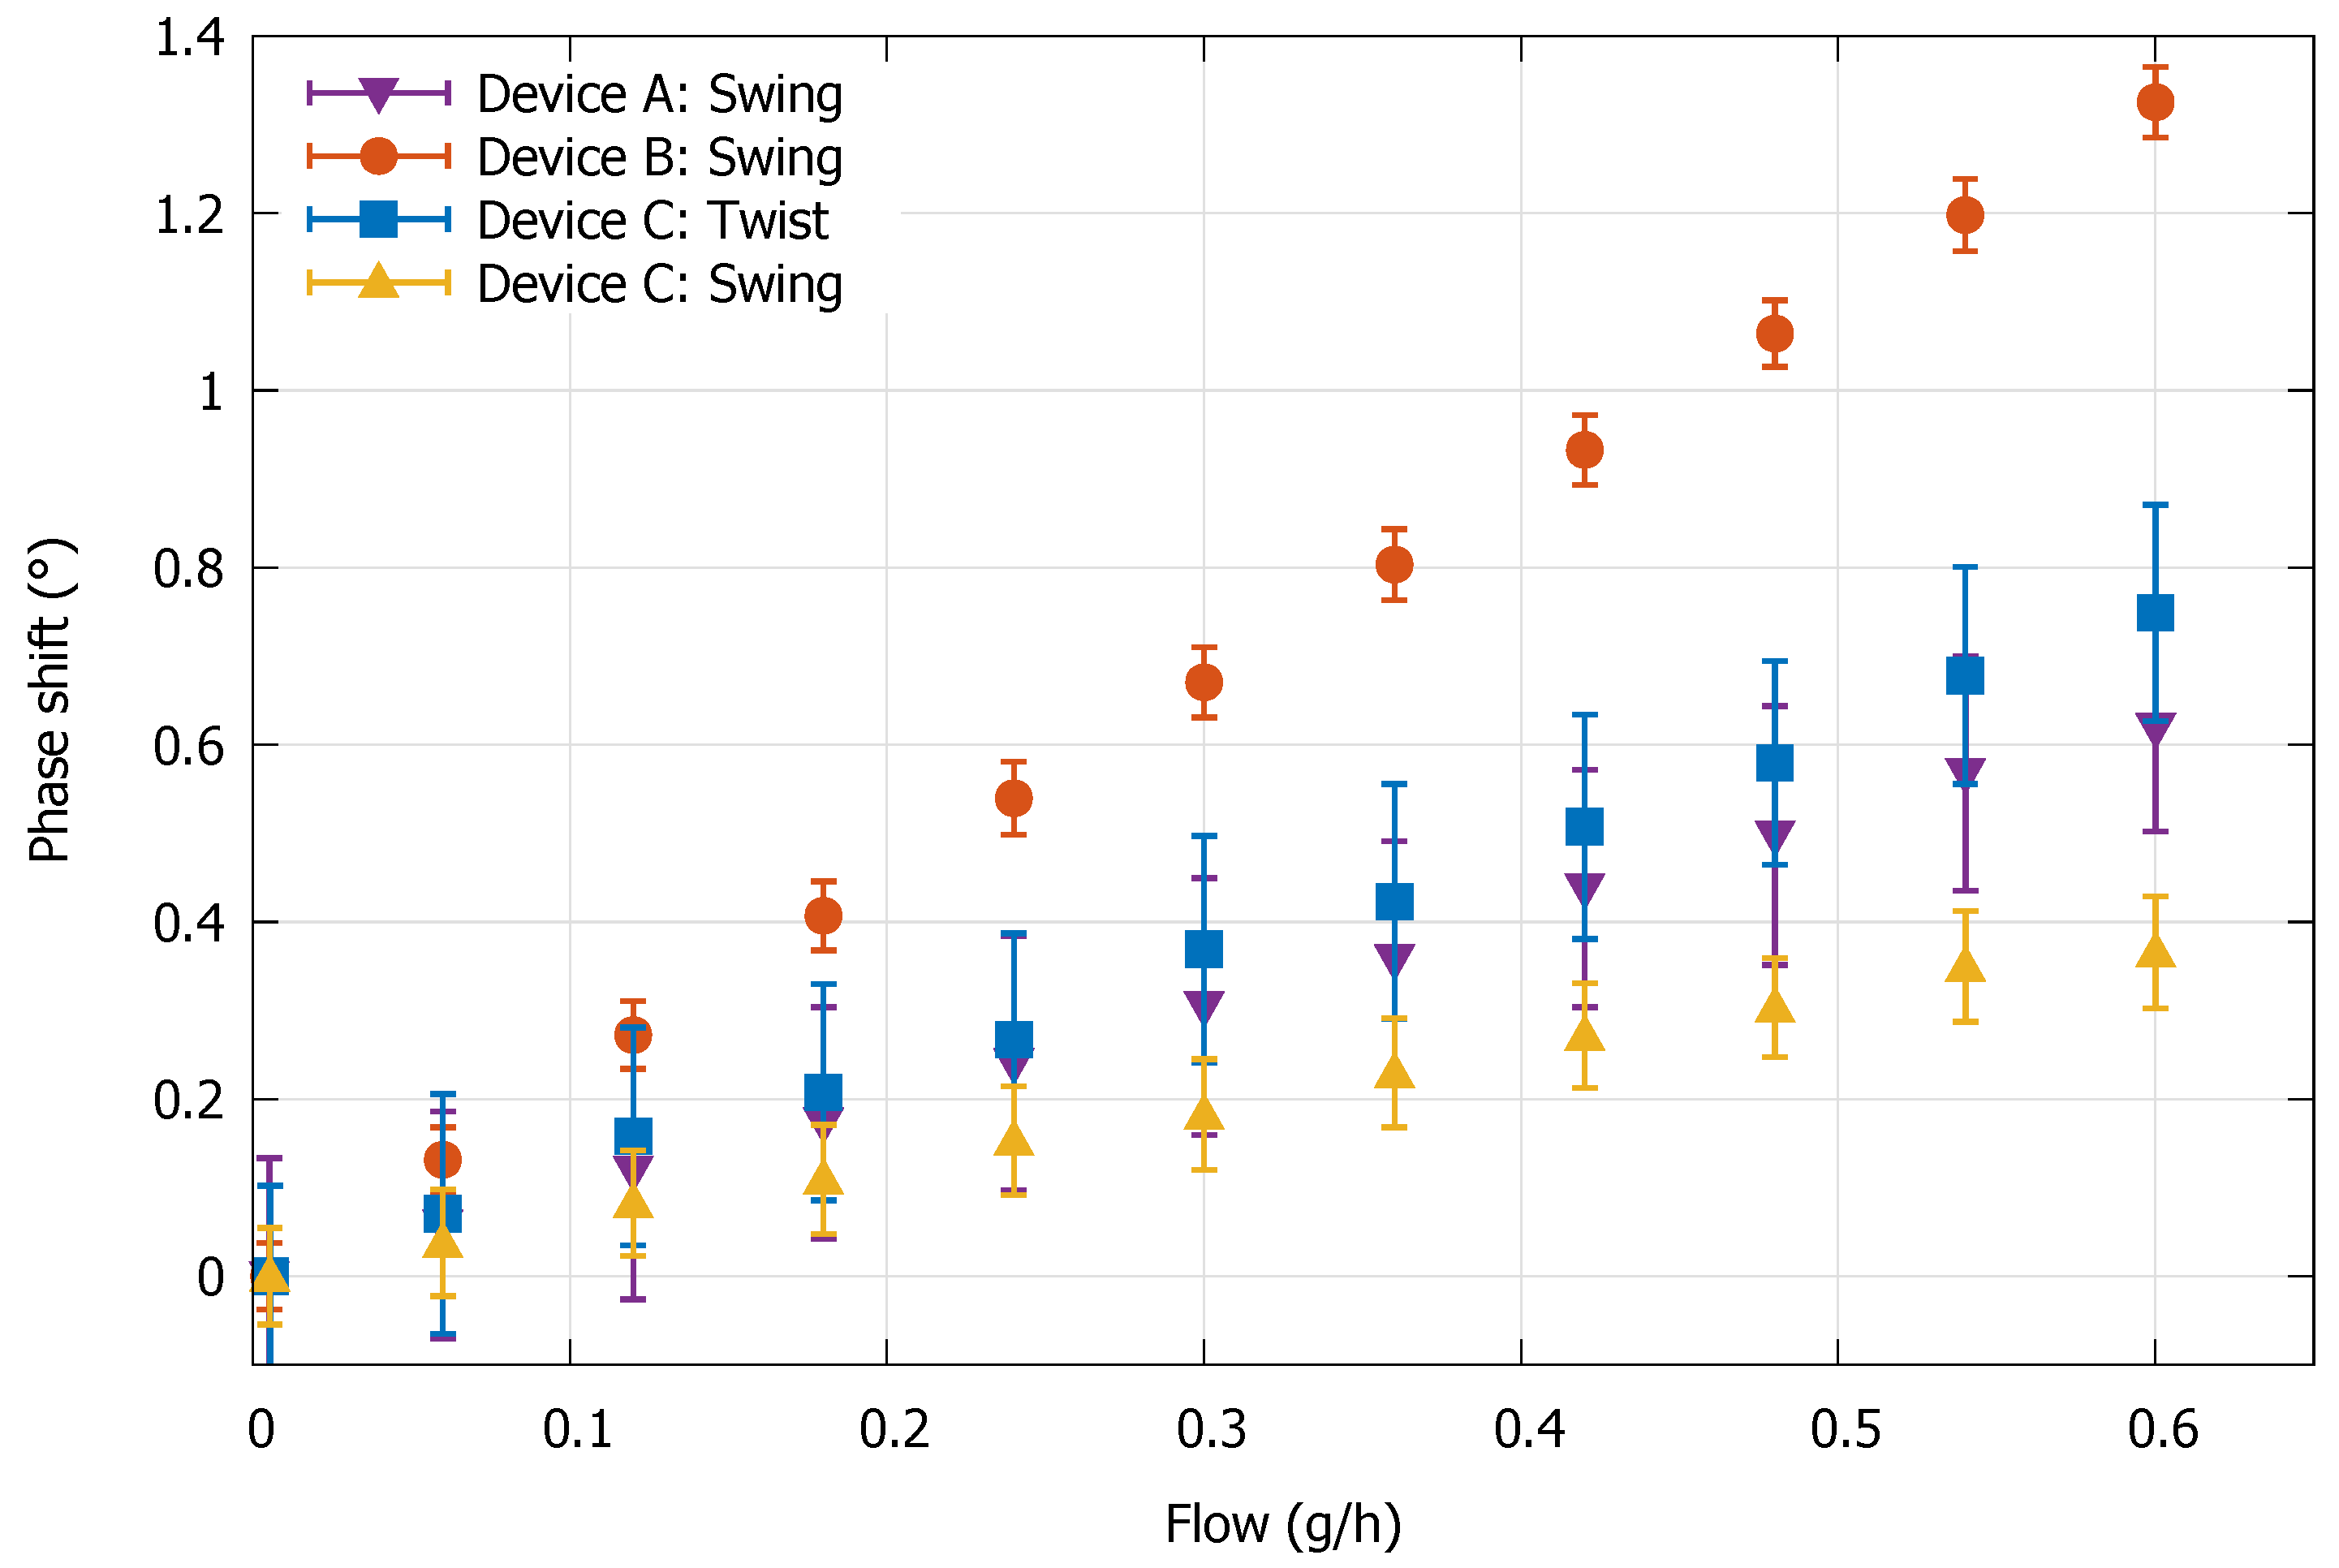
Flow measurements are executed with all three device types. The integration constant of the low-pass filter on the SR860 (Section 2.6) was set to 100 ms and its slope was set to 24 dB/decade. After sampling, the data it is averaged with a walking average over a time interval of 1 s. Figure 13 shows the resulting phase difference output of the resistive readout for the three device types.
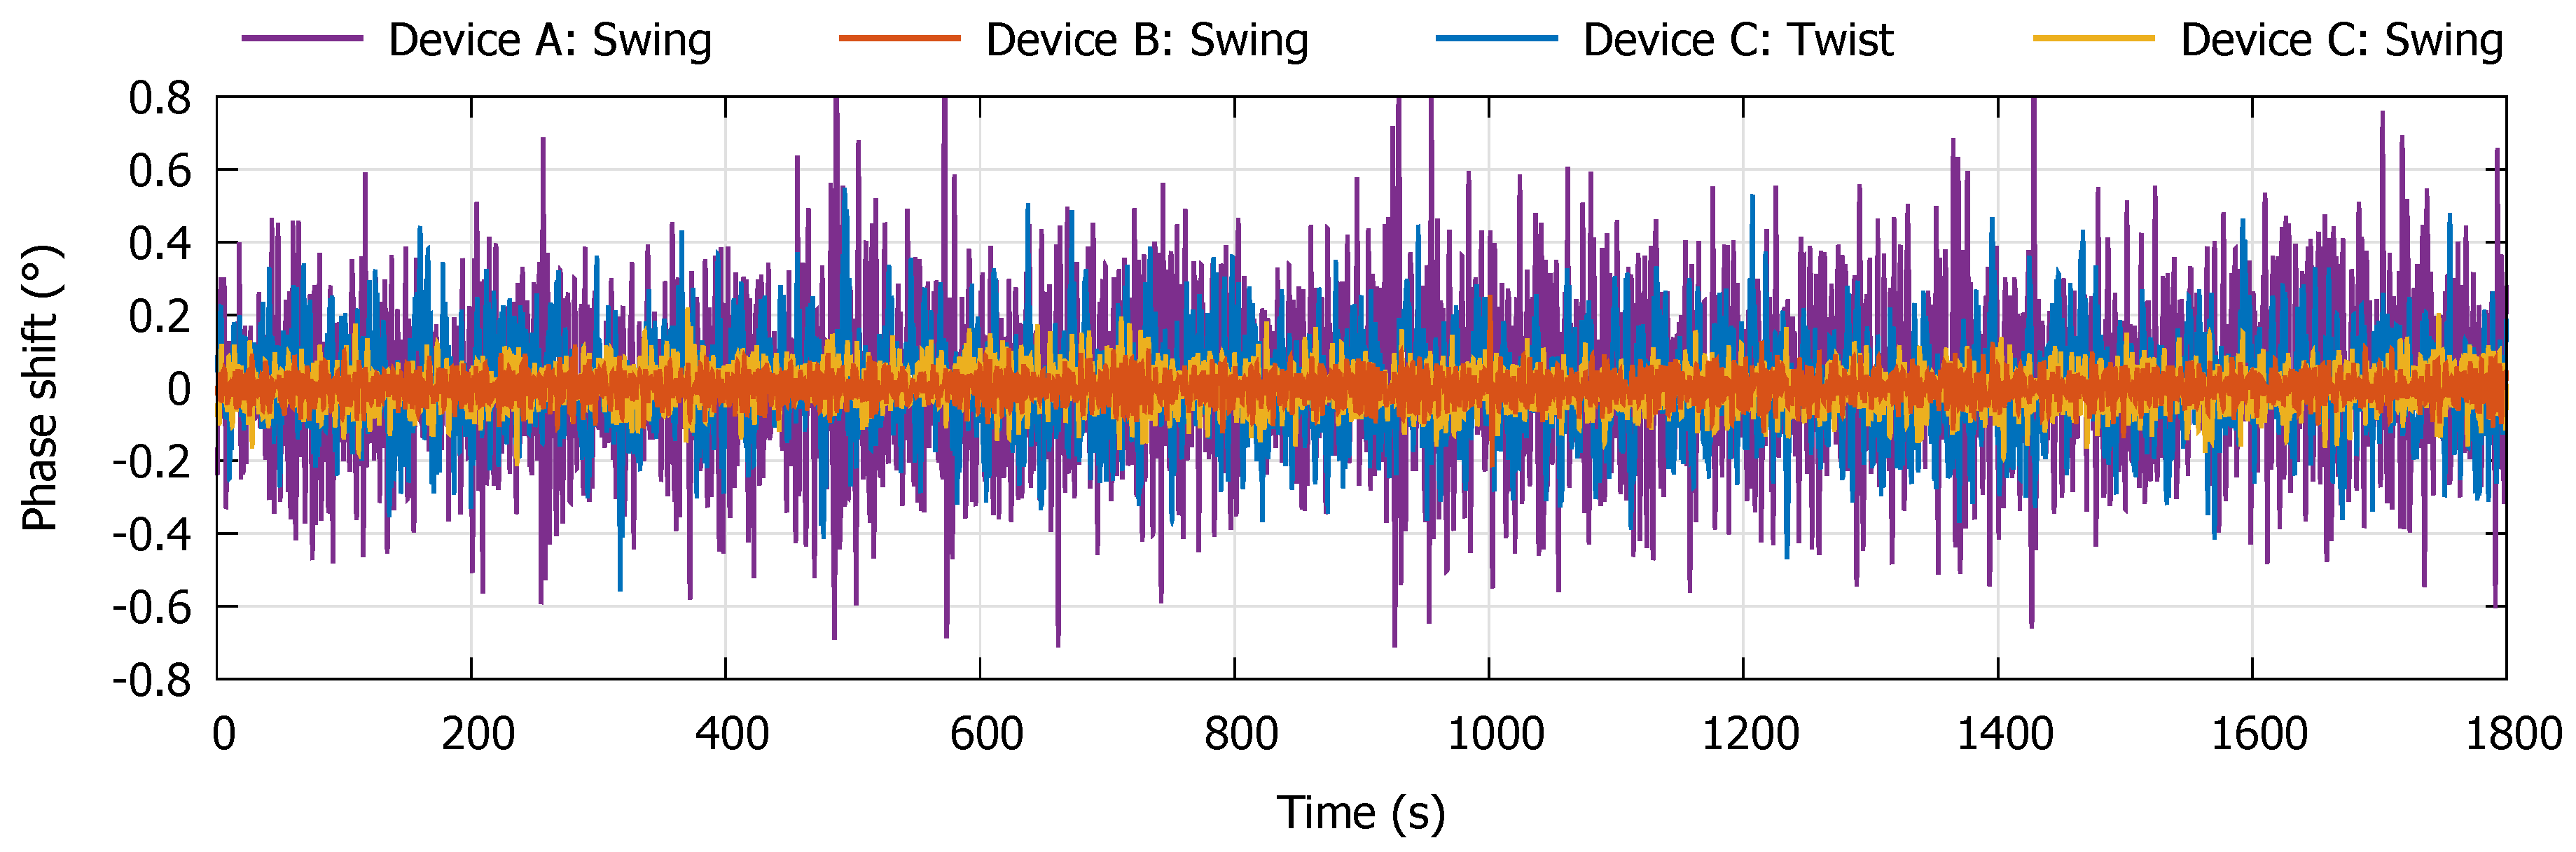
There is a linear relation between the output and mass flow rate for each device. Linearity for larger flows has not been investigated, as accuracy at small flows is of most interest. As can be seen from Figure 13, device type B shows the most stable output signal and also shows the highest sensitivity to flow. For each device, a zero-flow measurement has been executed to determine the devices’ zero stability over time. The outlet of the flow sensor was closed off and the channel of the sensor was kept at a constant pressure of 5 bar (gauge pressure). The results are displayed in Figure 14.
Device B shows the highest stability whereas the stability of device A is an order of magnitude lower. The latter was to be expected since device A was in principle designed to be actuated in the mode and is thus not optimized for mode actuation.
4. Discussion and Conclusions
All experimental parameters of the devices are displayed in Table 1. When comparing all devices, it is directly clear that device B shows the best overall performance. Its zero-flow stability is a factor 5 better than for device C, indicating stress during operation is much higher in the channel sections with length than the membranes with . For device C, flow sensitivity for mode actuation is approximately a factor 2 higher than for mode actuation. However, the standard deviation and zero-flow stability of the phase output signal is around two times higher as well, compensating for the larger flow sensitivity (see Figure 14). This results in nearly equal standard deviation and zero-flow stability of the flow signal (in g·h−1). Since the zero-flow stability and standard deviation of the phase output signal is lower for mode actuation, one could try to improve the sensitivity to mode Coriolis forces to improve the performance of the device. This can be done by increasing the distance between the membranes on which the strain gauges reside, as previously mentioned.
The resistive readout shows great promise for improving the resolution and accuracy of the -Coriolis mass flow sensor. Sparreboom et al. [10] presented a -Coriolis based on a capacitive readout with a zero-flow stability of 2 mg·h−1. However, it is not clearly stated what sampling time is used. Since averaging the data can lead to lower standard deviation, the sampling time is important when comparing stability results. Since this is typically not stated, taking 2 mg·h−1 as a reference, the zero-flow stability of the resistive readout is a factor 10 lower. Optimization of the device can lead it to outperform the capacitive readout in the future. This can be done by optimizing the design of the sensor and the strain gauges. Another option is to use a piezo-resistive material to increase the sensitivity to strain significantly, e.g., doped mono-crystalline Silicon as proposed in [11]. Doped poly-silicon strain gauges on top of the channel of the sensor are also an option. The gauge factor of p-doped mono crystalline silicon ranges from −75 to +150 [12], whereas, for doped poly-silicon, the gauge factor ranges from −10 to +30 [12,13] depending on the doping concentrations. Although poly-silicon has a lower gauge factor than mono-crystalline silicon, it is more simple to implement and fabricate into a desired pattern on top of the microfluidic channel. Both options will be investigated for future designs as well as optimization of the current metal film strain gauges.
Author Contributions
Conceptualization, T.S. and R.W.; Formal analysis, T.S.; Investigation, T.S.; Methodology, T.S.; Project administration, T.S., R.W., and J.L.; Software, T.S. and R.W.; Validation, T.S.; Visualization and writing: T.S.; Funding acquisition, R.W. and J.L.; Supervision and writing (review and editing), R.W. and J.L. All authors have read and agreed to the published version of the manuscript.
Funding
This work is part of the research program FLOW+ under project number 15019, which is co-funded by the Netherlands Organization for Scientific Research (NWO), Bronkhorst High-Tech and Krohne.
Conflicts of Interest
Joost Lötters is employed by Bronkhorst High-Tech, one of the funders of this project. He has been involved in the research as stated in the section “Author Contributions”. The other authors declare no conflict of interest.
Abbreviations
The following abbreviations are used in this manuscript:
| SEM | Scanning Electron Microscope |
| SCT | Surface Channel Technology |
| SiRN | Silicon-rich Silicon Nitride |
| LPCVD | Low-Pressure Chemical Vapor Deposition |
References
- Enoksson, P.; Stemme, G.; Stemme, E. A silicon resonant sensor structure for Coriolis mass-flow measurements. J. Microelectromech. Syst. 1997, 6, 119–125. [Google Scholar] [CrossRef]
- Wu, Y.; Zeng, X.; Rao, Y.-J.; Gong, Y.; Hou, C.-L.; Yang, G.-G. MOEMS Accelerometer Based on Microfiber Knot Resonator. IEEE Photonic Technol. Lett. 2009, 21, 1547–1549. [Google Scholar] [CrossRef]
- Zandi, K.; Bélanger, J.A.; Peter, Y.-A. Design and Demonstration of an In-Plane Silicon-on-Insulator Optical MEMS Fabry–Pérot-Based Accelerometer Integrated with Channel Waveguides. J. Microelectromech. Syst. 2012, 21, 1464–1470. [Google Scholar] [CrossRef]
- Haneveld, J.; Lammerink, T.S.J.; de Boer, M.J.; Sanders, R.J.P.; Mehendale, A.; Lötters, J.C.; Dijkstra, M.; Wiegerink, R.J. Modeling, design, fabrication and characterization of a micro Coriolis mass flow sensor. J. Micromech. Microeng. 2010, 20, 125001. [Google Scholar] [CrossRef]
- Sparks, D.; Smith, R.; Cripe, J.; Schneider, R.; Najafi, N. A portable MEMS Coriolis mass flow sensor. In Proceedings of the 2003 IEEE SENSORS, Toronto, ON, Canada, 22–24 October 2003. [Google Scholar]
- Groenesteijn, J.; Sanders, R.G.P.; Wiegerink, R.J.; Lötters, J.C. Towards Nanogram per Second Coriolis Mass Flow Sensing. In Proceedings of the 2016 IEEE 29th International Conference on Micro Electro Mechanical Systems (MEMS), Shanghai, China, 24–28 January 2016. [Google Scholar]
- Groenesteijn, J.; de Boer, M.J.; Lötters, J.C.; Wiegerink, R.J. A versatile technology platform for microfluidic handling systems, part I: Fabrication and functionalization. Microfluid. Nanofluid. 2017, 21. [Google Scholar] [CrossRef] [Green Version]
- Alveringh, D.; Wiegerink, R.J.; Lötters, J.C. Integrated pressure sensing using capacitive Coriolis mass flow sensors. J. Microelectromech. Syst. 2017, 26, 653–661. [Google Scholar] [CrossRef] [Green Version]
- Alveringh, D.; Schut, T.V.P.; Wiegerink, R.J.; Sparreboom, W.; Lötters, J.C. Resistive pressure sensors integrated with a coriolis mass flow sensor. In Proceedings of the 2017 19th International Conference on Solid-State Sensors, Actuators and Microsystems (TRANSDUCERS), Kaohsiung, Taiwan, 18–22 June 2017. [Google Scholar]
- Sparreboom, W.; de Geest, J.V.; Katerberg, M.; Postma, F.; Haneveld, J.; Groenesteijn, J.; Lammerink, T.; Wiegerink, R.; Lötters, J. Compact mass flow meter based on a micro Coriolis flow sensor. Micromachines 2013, 4, 22–33. [Google Scholar] [CrossRef]
- Zhao, Y.; Veltkamp, H.-W.; Schut, T.V.P.; Groenesteijn, J.; de Boer, M.J.; Wiegerink, R.J.; Lötters, J.C. Highly-doped bulk silicon microheaters and electrodes embedded between free-hanging microfluidic channels by surface channel technology. In Proceedings of the 4th Conference on MicroFluidic Handling Systems (MFHS 2019), Enschede, The Netherlands, 2–4 October 2019. [Google Scholar]
- Kleimann, P.; Semmache, B.; Le Berre, M.; Barbier, D. Stress-dependent hole effective masses and piezoresistive properties of p-type monocrystalline and polycrystalline silicon. Phys. Rev. B 1998, 57, 8966. [Google Scholar] [CrossRef]
- French, P.J.; Evans, A.G.R. Piezoresistance in polysilicon. Electron. Lett. 1984, 20, 999. [Google Scholar] [CrossRef]
Figure 1.
Operation principle of a micro-Coriolis mass flow sensor. I: The channel loop is brought into resonance with actuation angle in (a), in (b) through Lorentz force , resulting from a magnetic field and an AC current i. II: A mass flow through the channel induces vibration in the detection mode through Coriolis force , resulting in a sensing angle in (a), in (b). The ratio between the two vibration mode amplitudes is a measure for the flow.
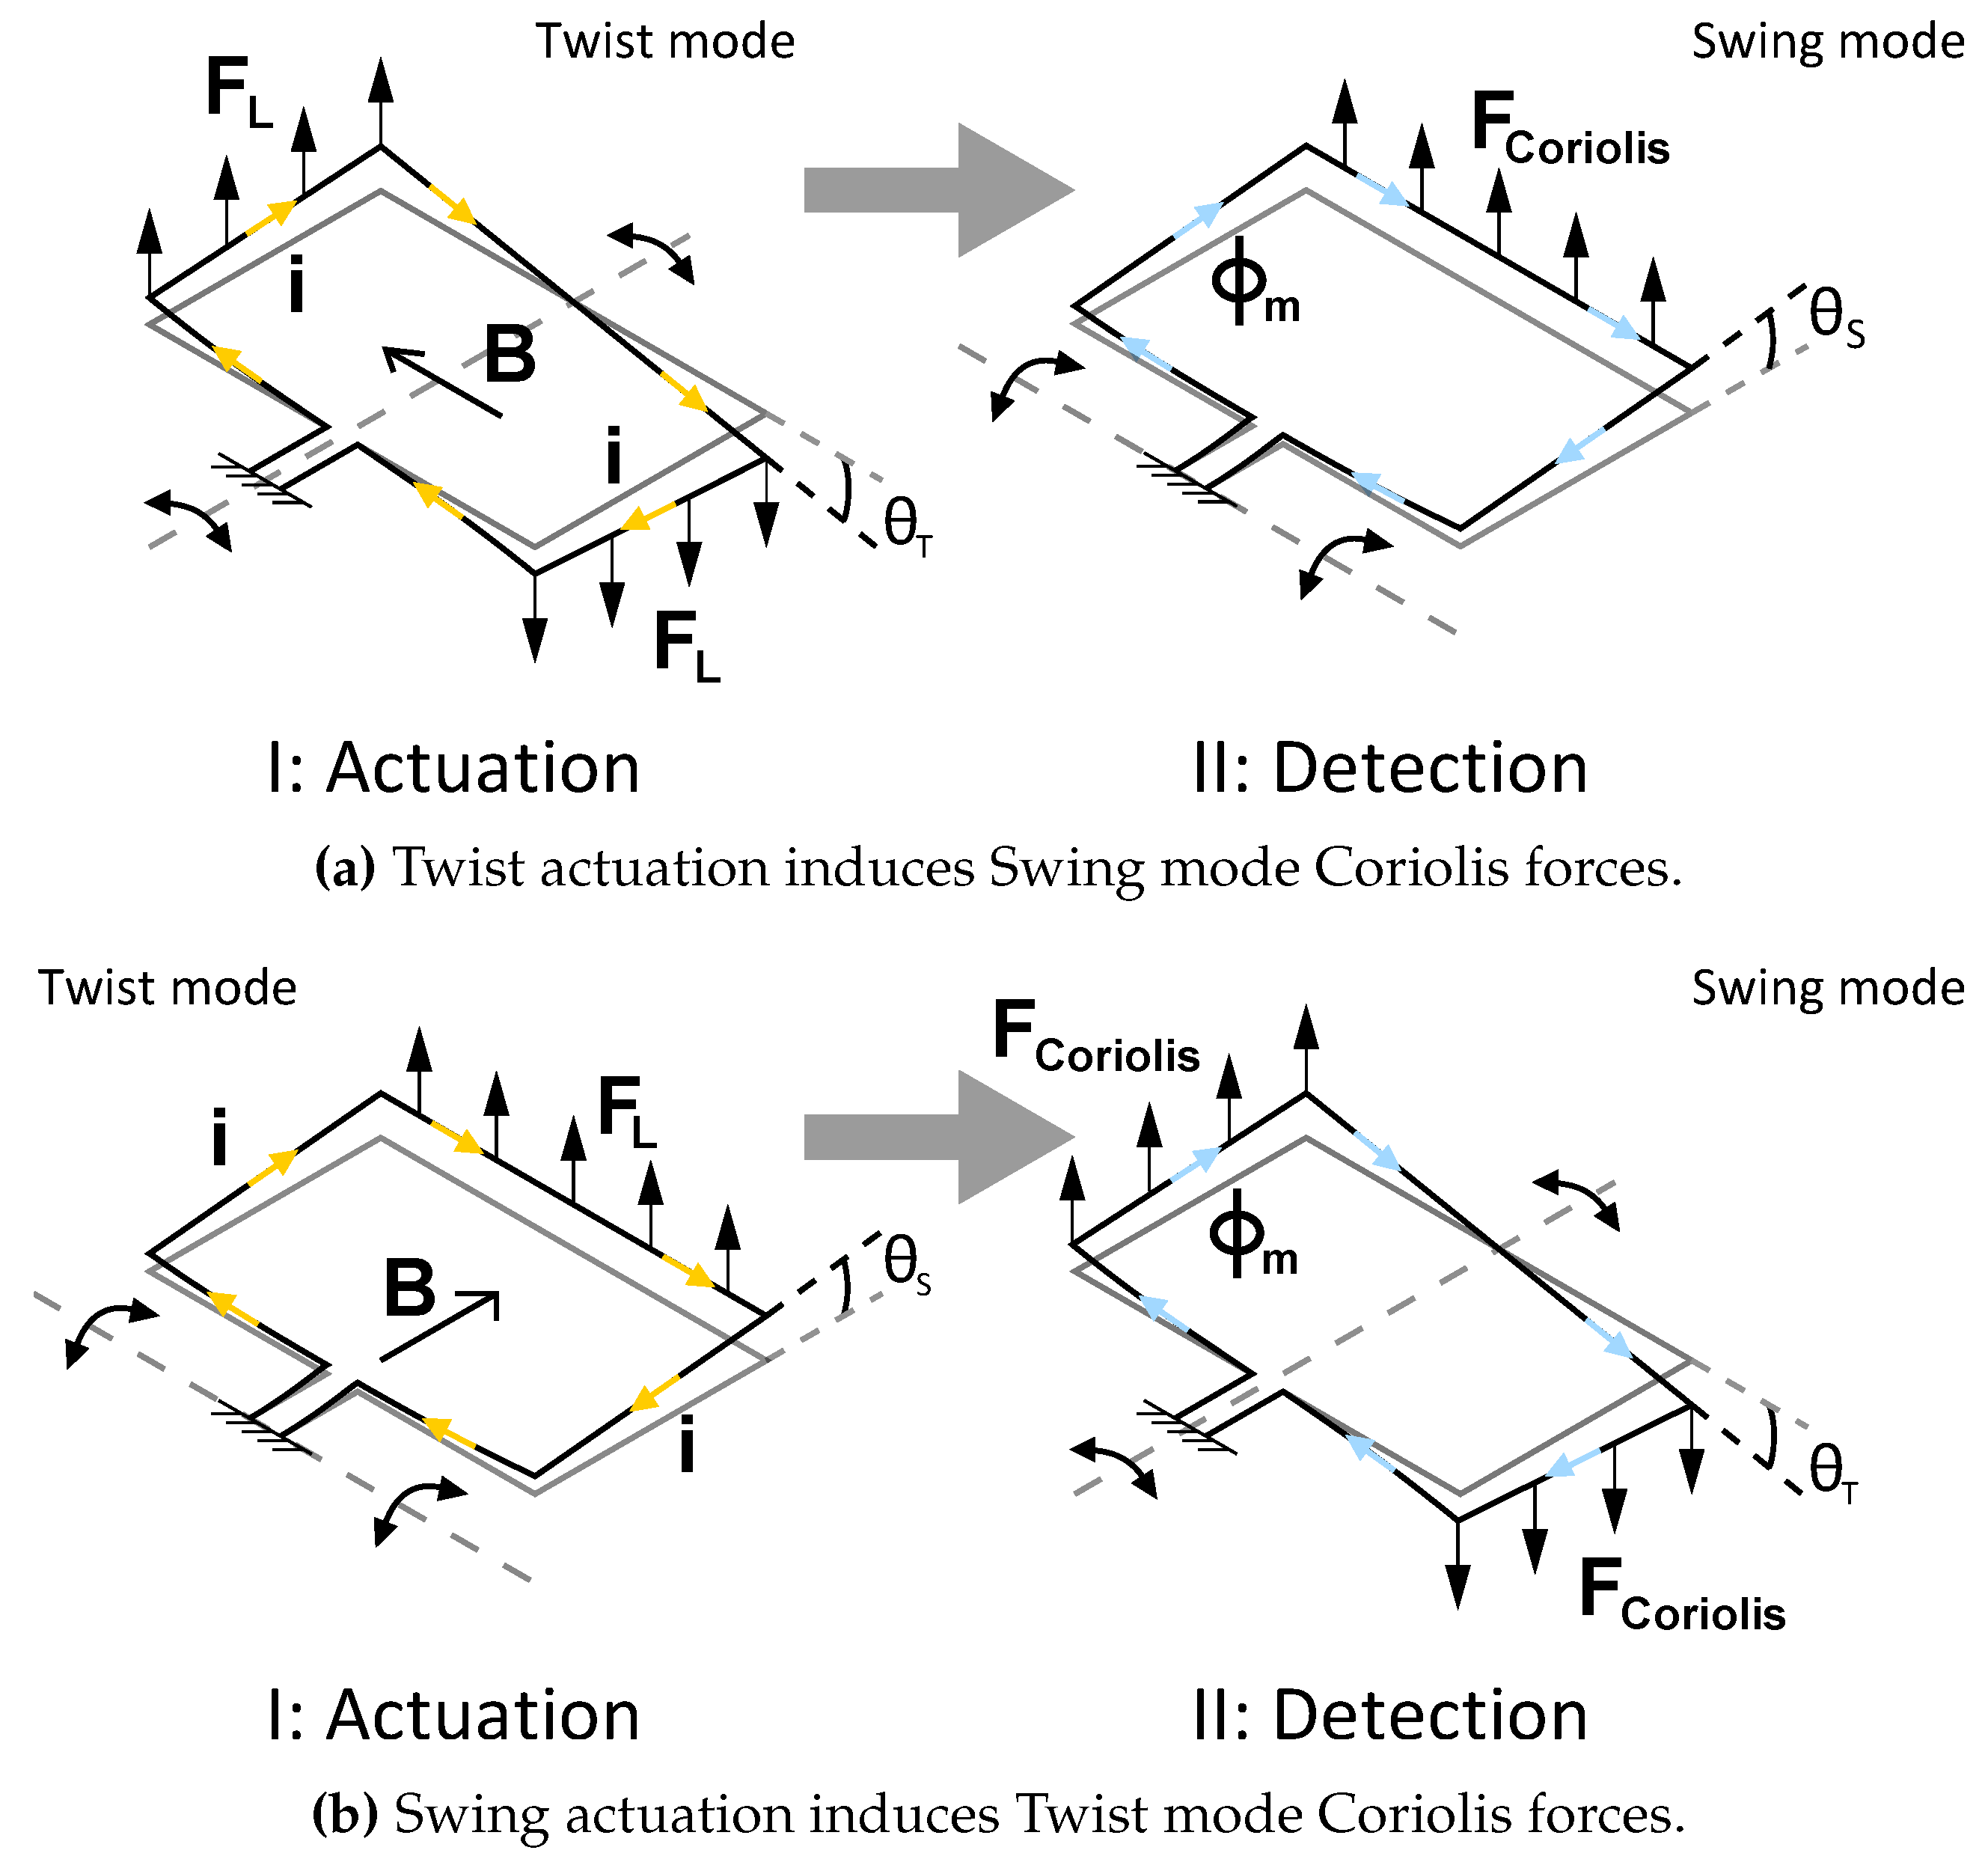
Figure 2.
SEM image of a -Coriolis mass flow sensor with capacitive readout. The capacitive readout consists of two comb capacitor structures used for measuring displacement of the micro-channel.
Figure 2.
SEM image of a -Coriolis mass flow sensor with capacitive readout. The capacitive readout consists of two comb capacitor structures used for measuring displacement of the micro-channel.
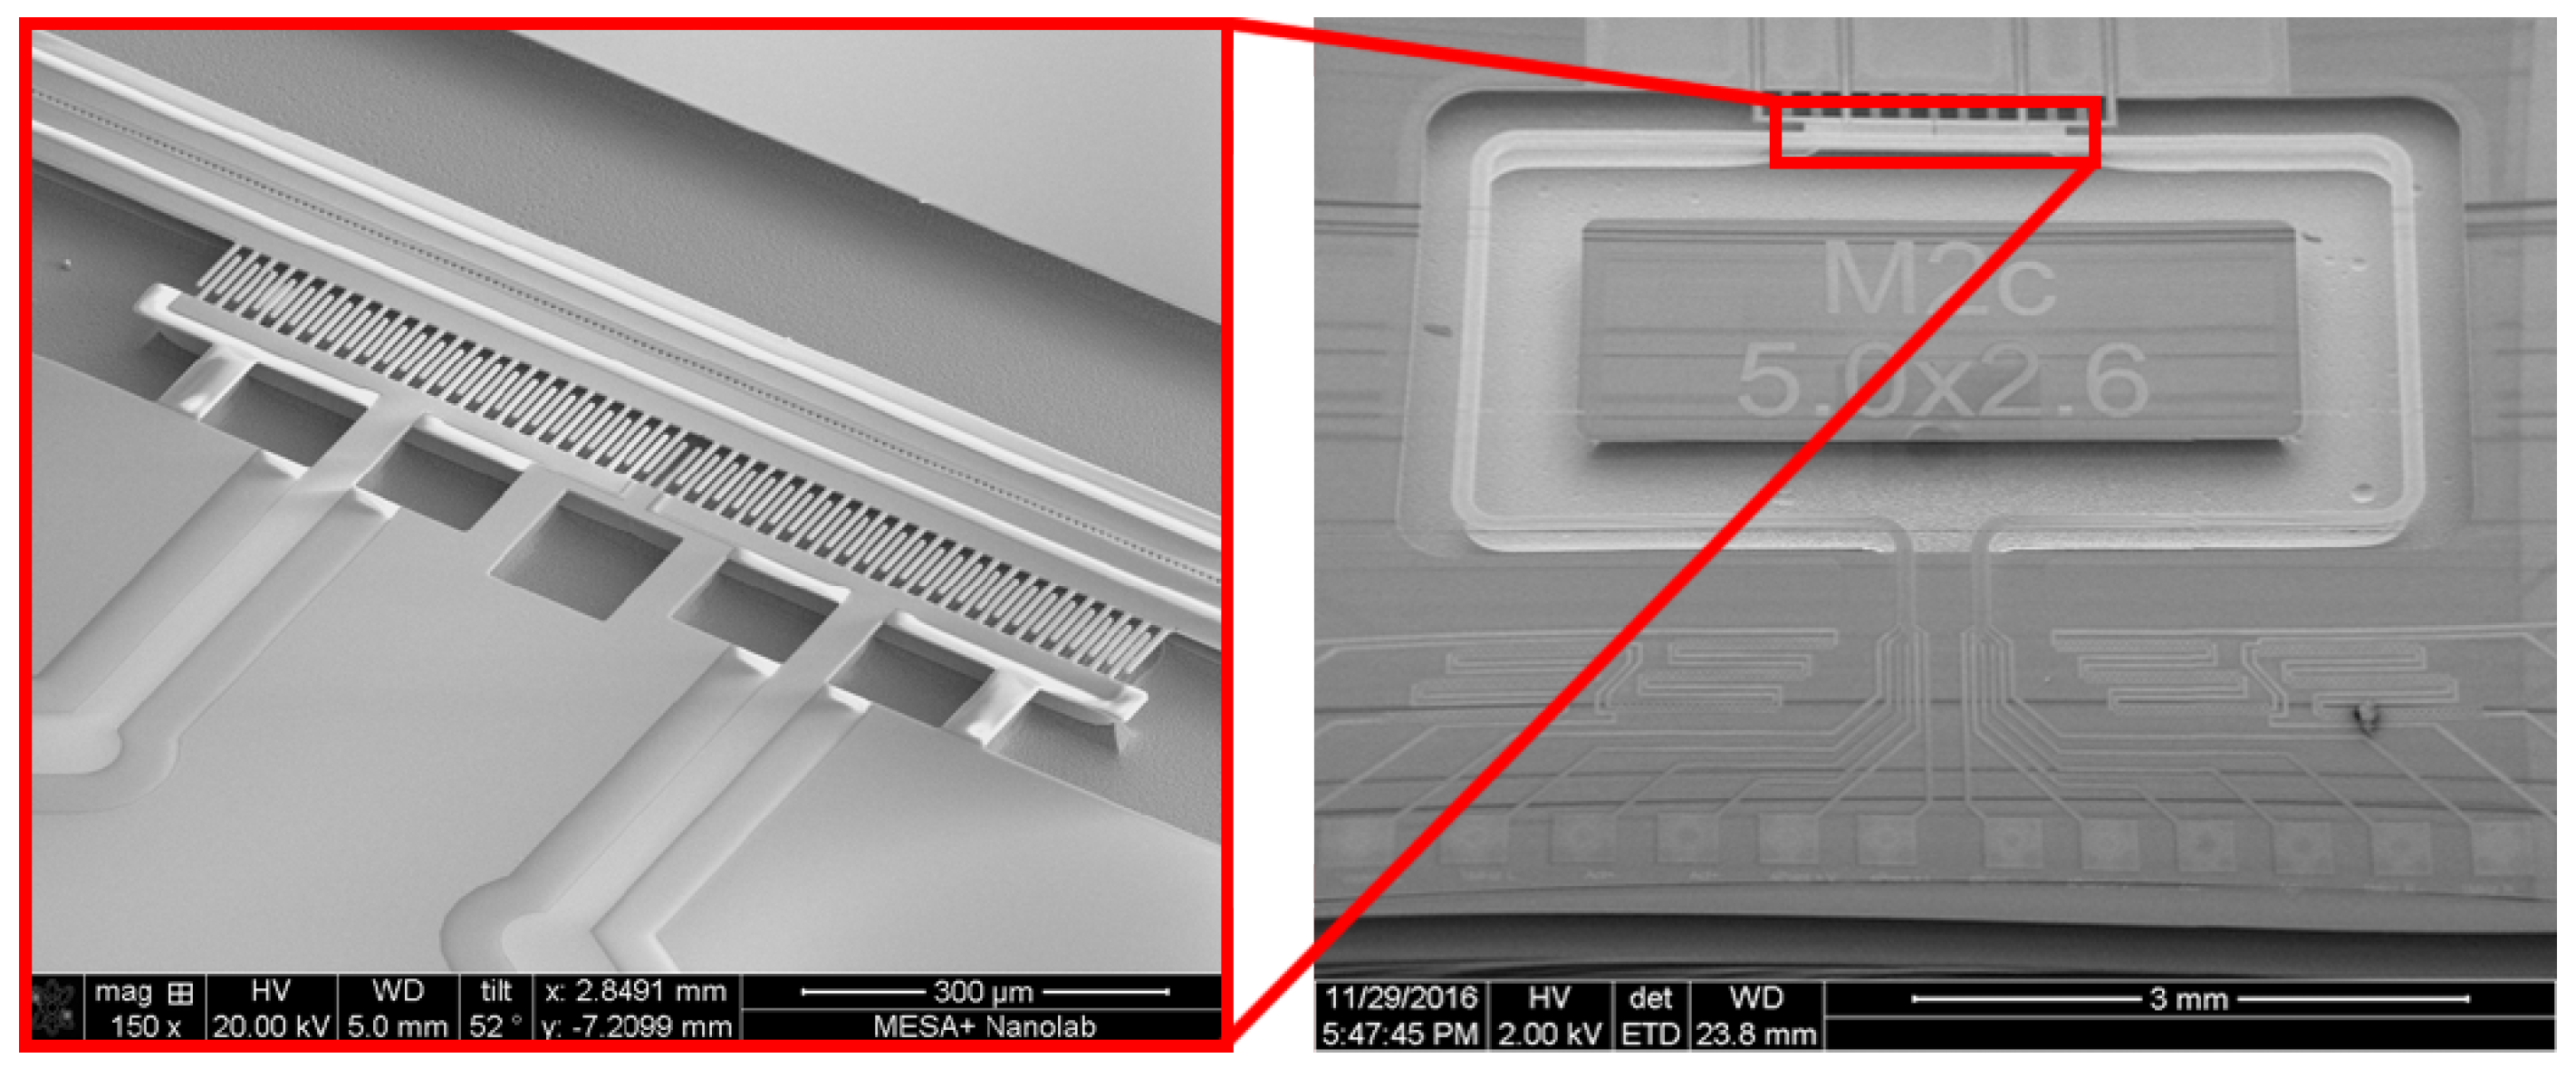
Figure 3.
Operation principle of the capacitive readout. When actuated in mode, the capacitance signals over time are 180 out of phase. mode vibration induced by a mass flow through the channel causes common mode signals. When actuating with flow, the capacitance signals will have a phase difference dependent on the mass flow rate .

Figure 4.
Schematic representation of the actuation limit for a capacitive readout. The channel section with comb structures floats slightly above the fixed comb structures when stationary due to residual stress in the channel. Large actuation amplitude (b) gives nonlinearity in the capacitance signals, limiting the signal-to-noise ratio.

Figure 5.
Principle of operation of the resistive readout. (a) configuration of the strain gauges in rest. (b) In the Swing mode, both strain gauges will be compressed. This results in equal resistance change. (c) In the Twist mode, one strain gauge is elongated, the other will be compressed. This results in opposite change in resistance. (d) Combination of the two modes gives two resistance signals with a phase shift dependent on the mass flow rate.

Figure 6.
Design A/B: Two strain gauges are positioned on the in-/outlet channel sections. For design A, the strain gauge is designed to measure torsion of the channel section with length around its axis. For design B, the strain gauge is designed to measure bending of the same channel section along its axis. Two membranes with length connect the channel loop to the substrate to allow for the metal actuation track.
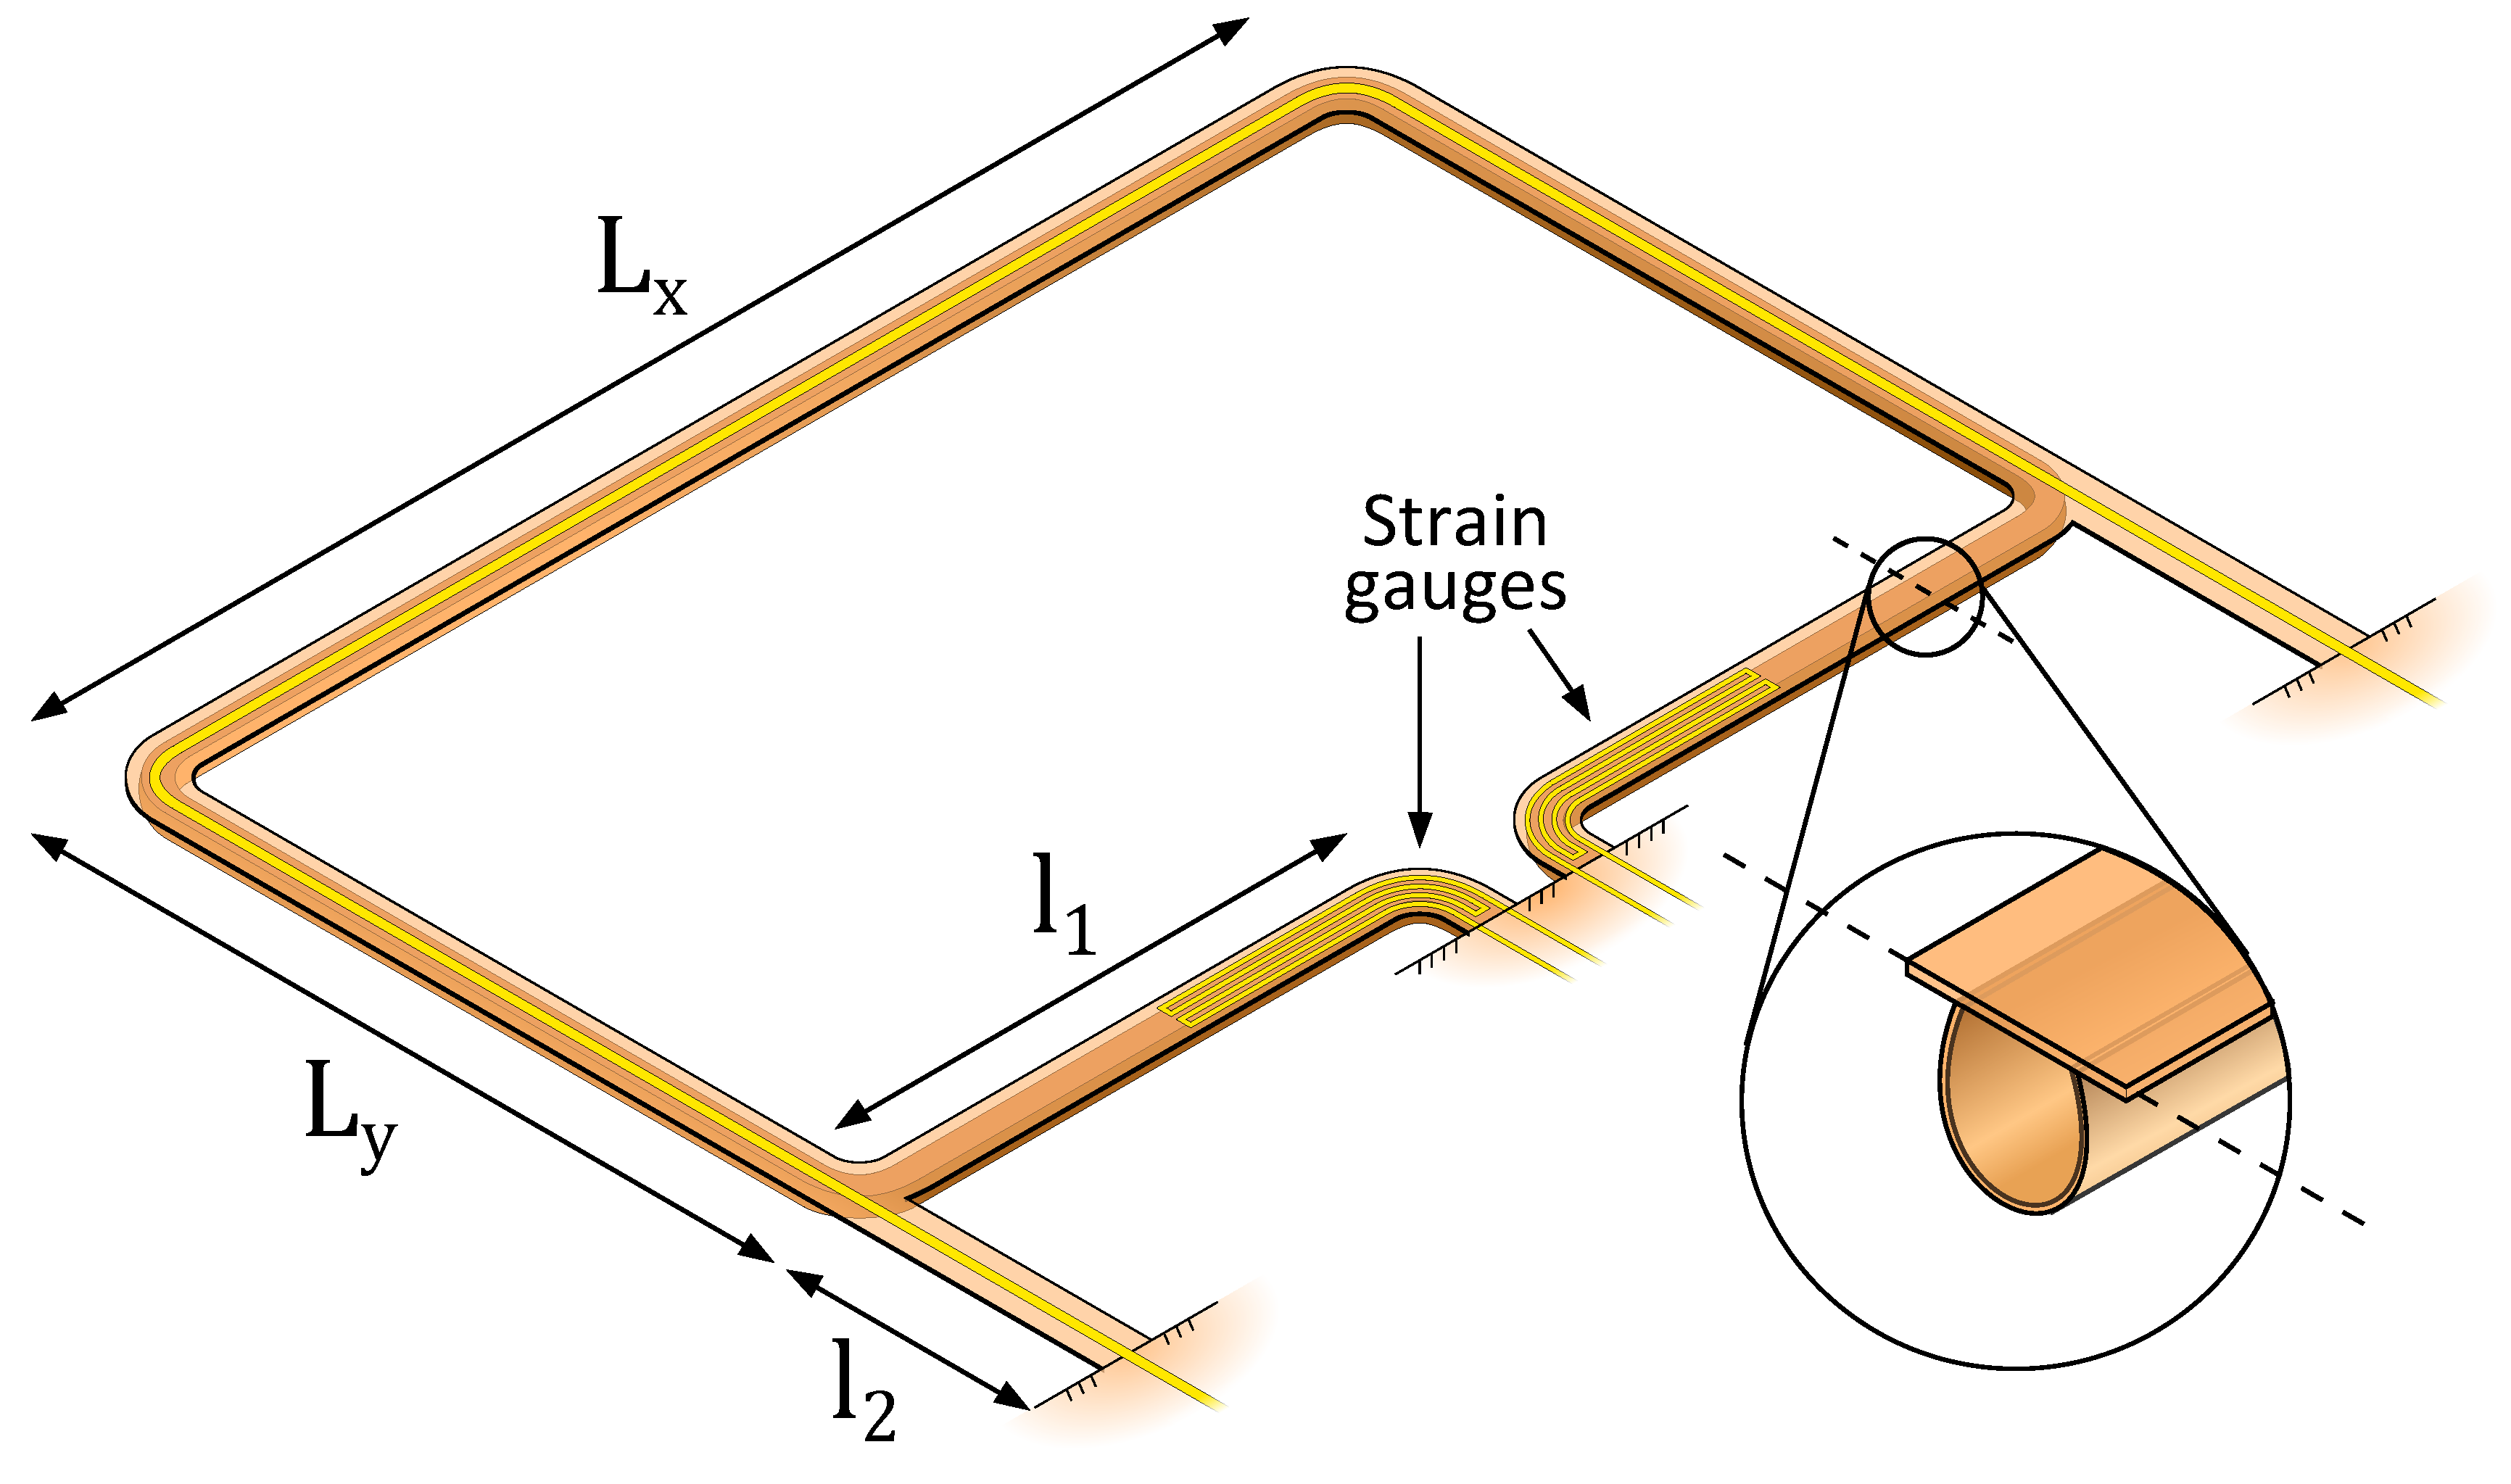
Figure 7.
Design C: A T-junction channel structure is connected through two membranes to the main channel loop. Four strain gauges reside on the membranes with length . Two experience elongate, while the other two experience compression.
Figure 7.
Design C: A T-junction channel structure is connected through two membranes to the main channel loop. Four strain gauges reside on the membranes with length . Two experience elongate, while the other two experience compression.

Figure 8.
Vibrational modes for the different device types, simulated in COMSOL Multiphysics. (a,b) Show that stress is the highest at the channel sections with length . This is why designs A and B have strain gauges in these sections, optimized for / mode actuation respectively; (c,d) show the stress in the connecting membranes. Based on these simulations, device C was designed with four strain gauges as shown in Figure 7.

Figure 9.
Fabrication process for Surface Channel Technology. (a) silicon wafer with 500 nm SiRN and 500 nm SiO2; (b) patterning of slit openings; (c) removal of SiO2 hard mask and forming of the surface channel; (d) closing of the channel; (e) patterning of metal and release of the channel.
Figure 9.
Fabrication process for Surface Channel Technology. (a) silicon wafer with 500 nm SiRN and 500 nm SiO2; (b) patterning of slit openings; (c) removal of SiO2 hard mask and forming of the surface channel; (d) closing of the channel; (e) patterning of metal and release of the channel.

Figure 10.
Microscope images of the three sensor types. Strain gauges and reference resistors are indicated in the subfigures. The metal tracks of the gauges are 4 wide. The mask design of the strain gauges and reference resistors are identical.
Figure 10.
Microscope images of the three sensor types. Strain gauges and reference resistors are indicated in the subfigures. The metal tracks of the gauges are 4 wide. The mask design of the strain gauges and reference resistors are identical.
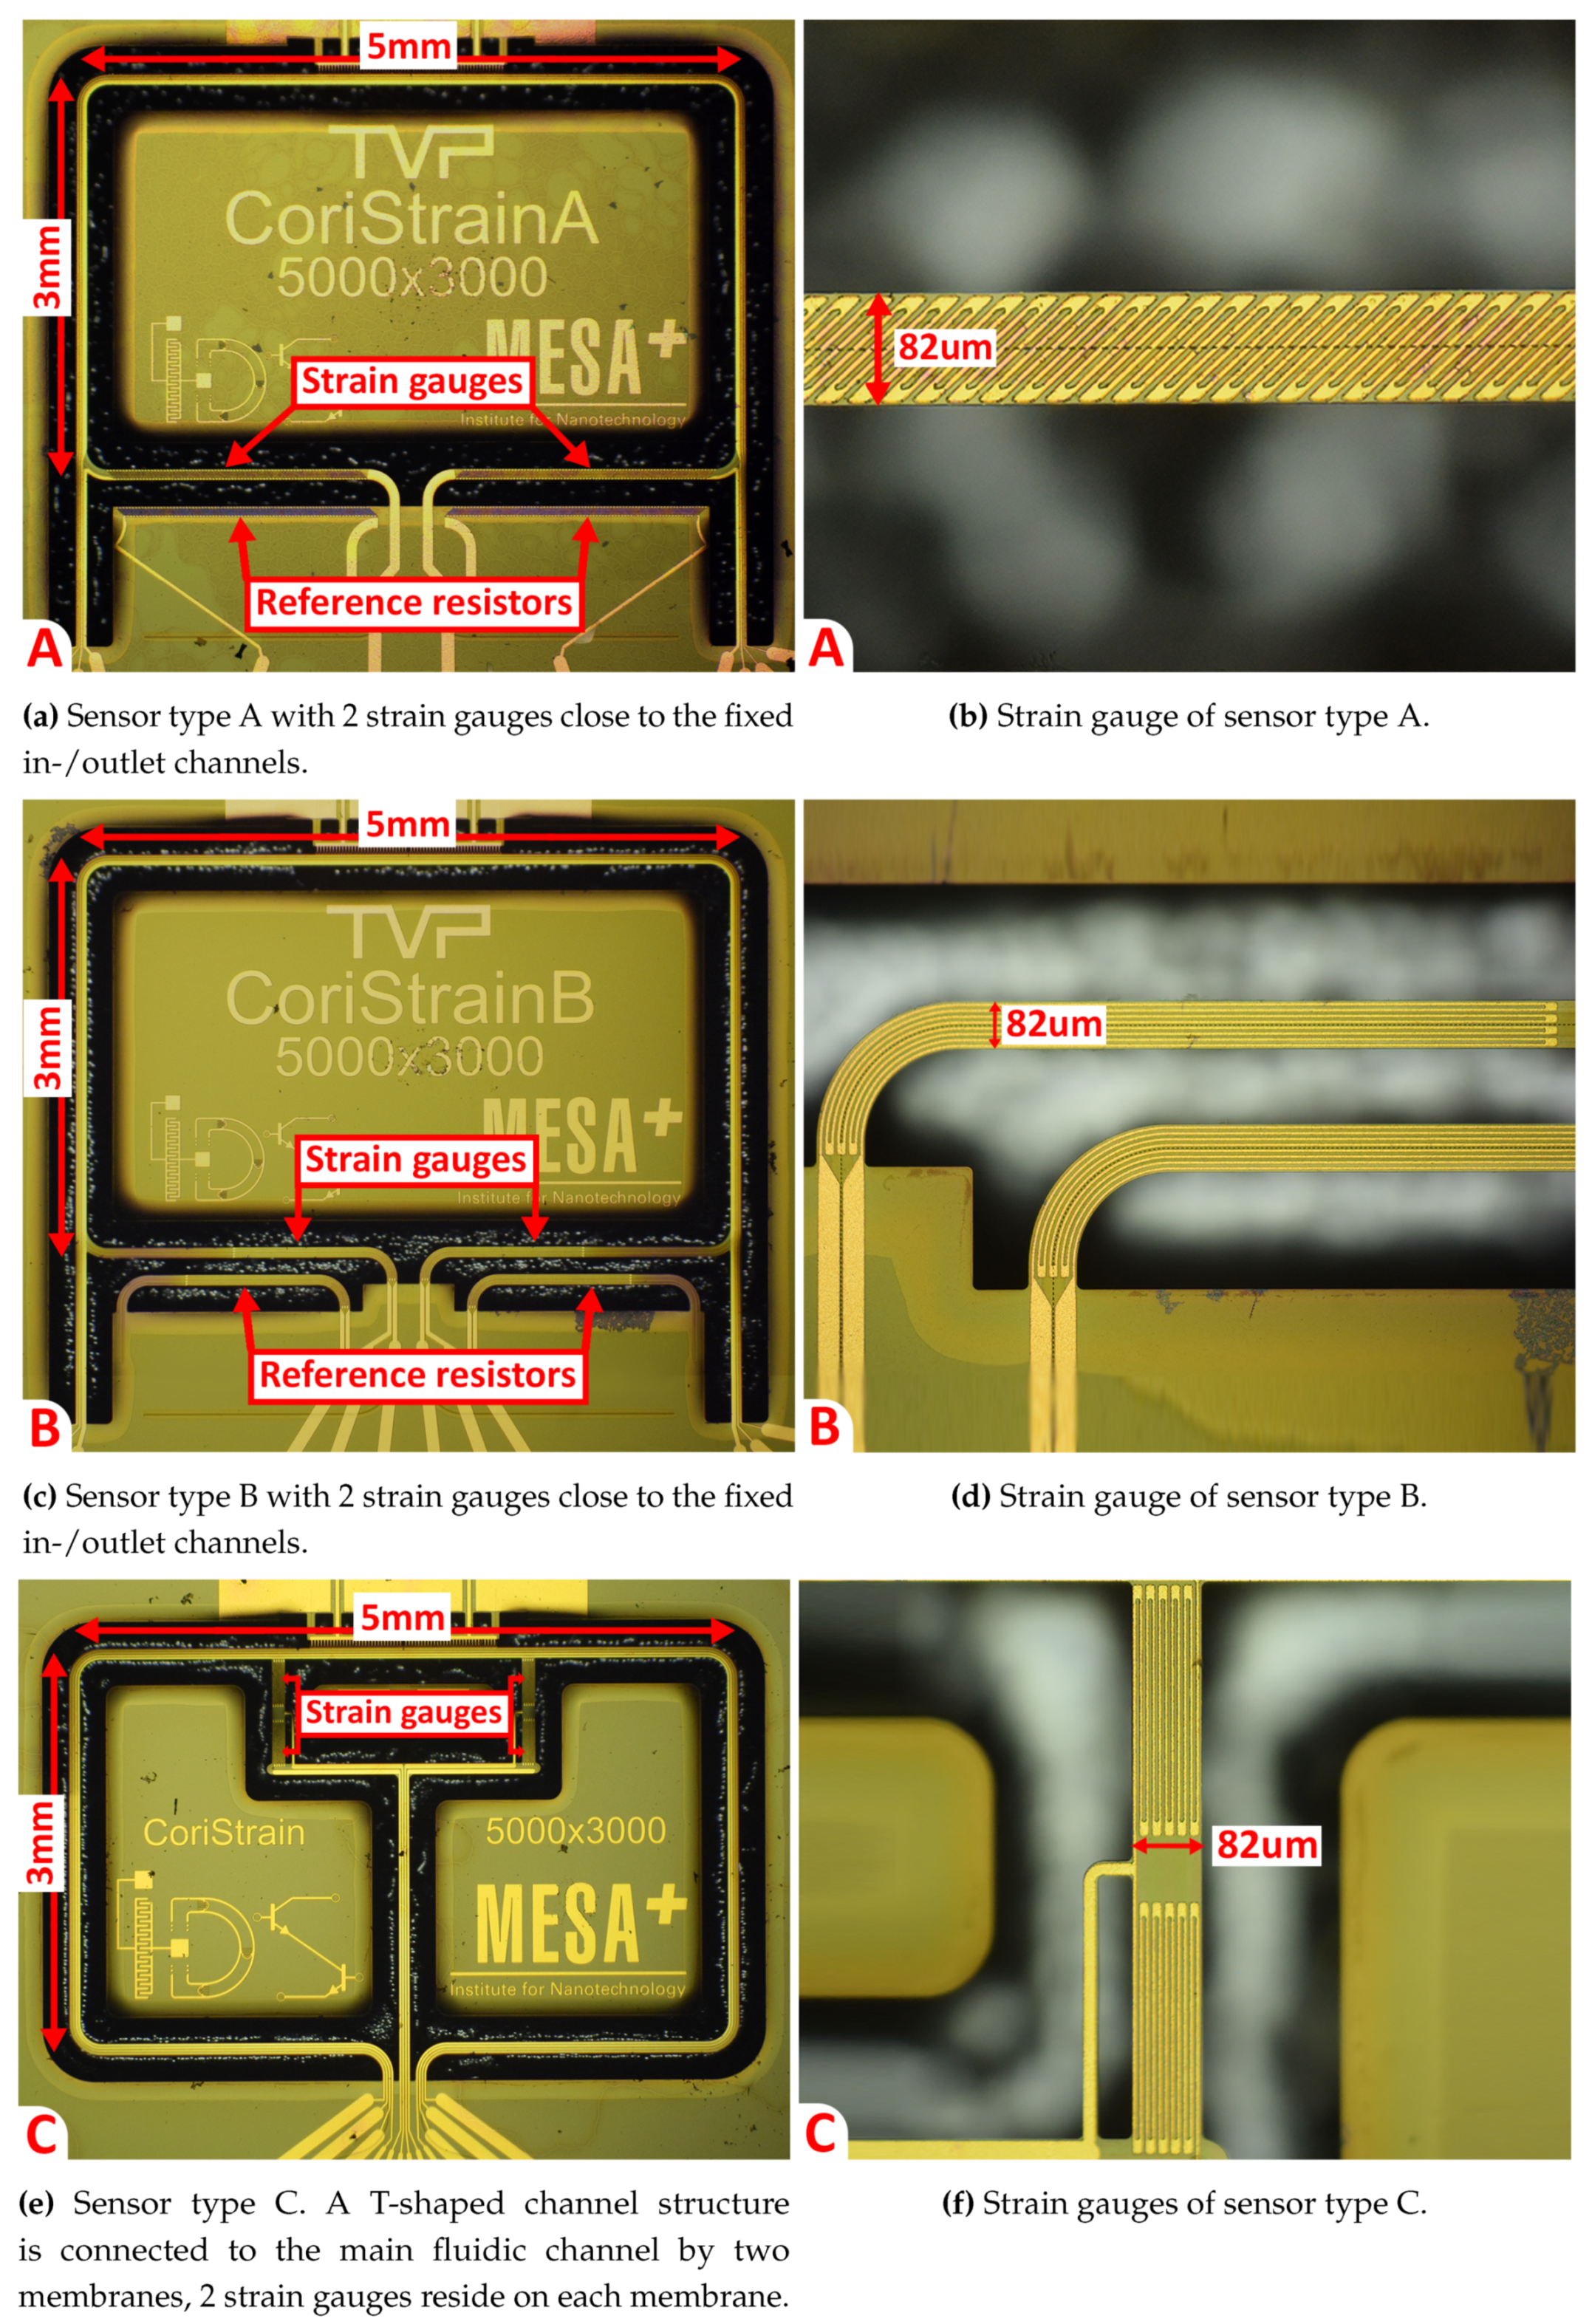
Figure 11.
Schematic representation of the electronic readout circuit. The resistance of one strain gauge is converted to a voltage via a 1 carrier signal and a reference resistor . In the case of device C (Figure 10e,f), is another strain gauge with its resistance changing in the opposite direction with respect to . The carrier signal is mixed out after which an SR860 lock-in amplifier determines the magnitude and phase of the signal (with actuation voltage as a frequency reference).

Figure 12.
Fluidic measurement setup. Nitrogen gas is fed through the sensor chip at an input pressure (gauge pressure), while the mass flow is regulated using an external mass flow controller at the outlet. Figure adapted from [9].
Figure 12.
Fluidic measurement setup. Nitrogen gas is fed through the sensor chip at an input pressure (gauge pressure), while the mass flow is regulated using an external mass flow controller at the outlet. Figure adapted from [9].
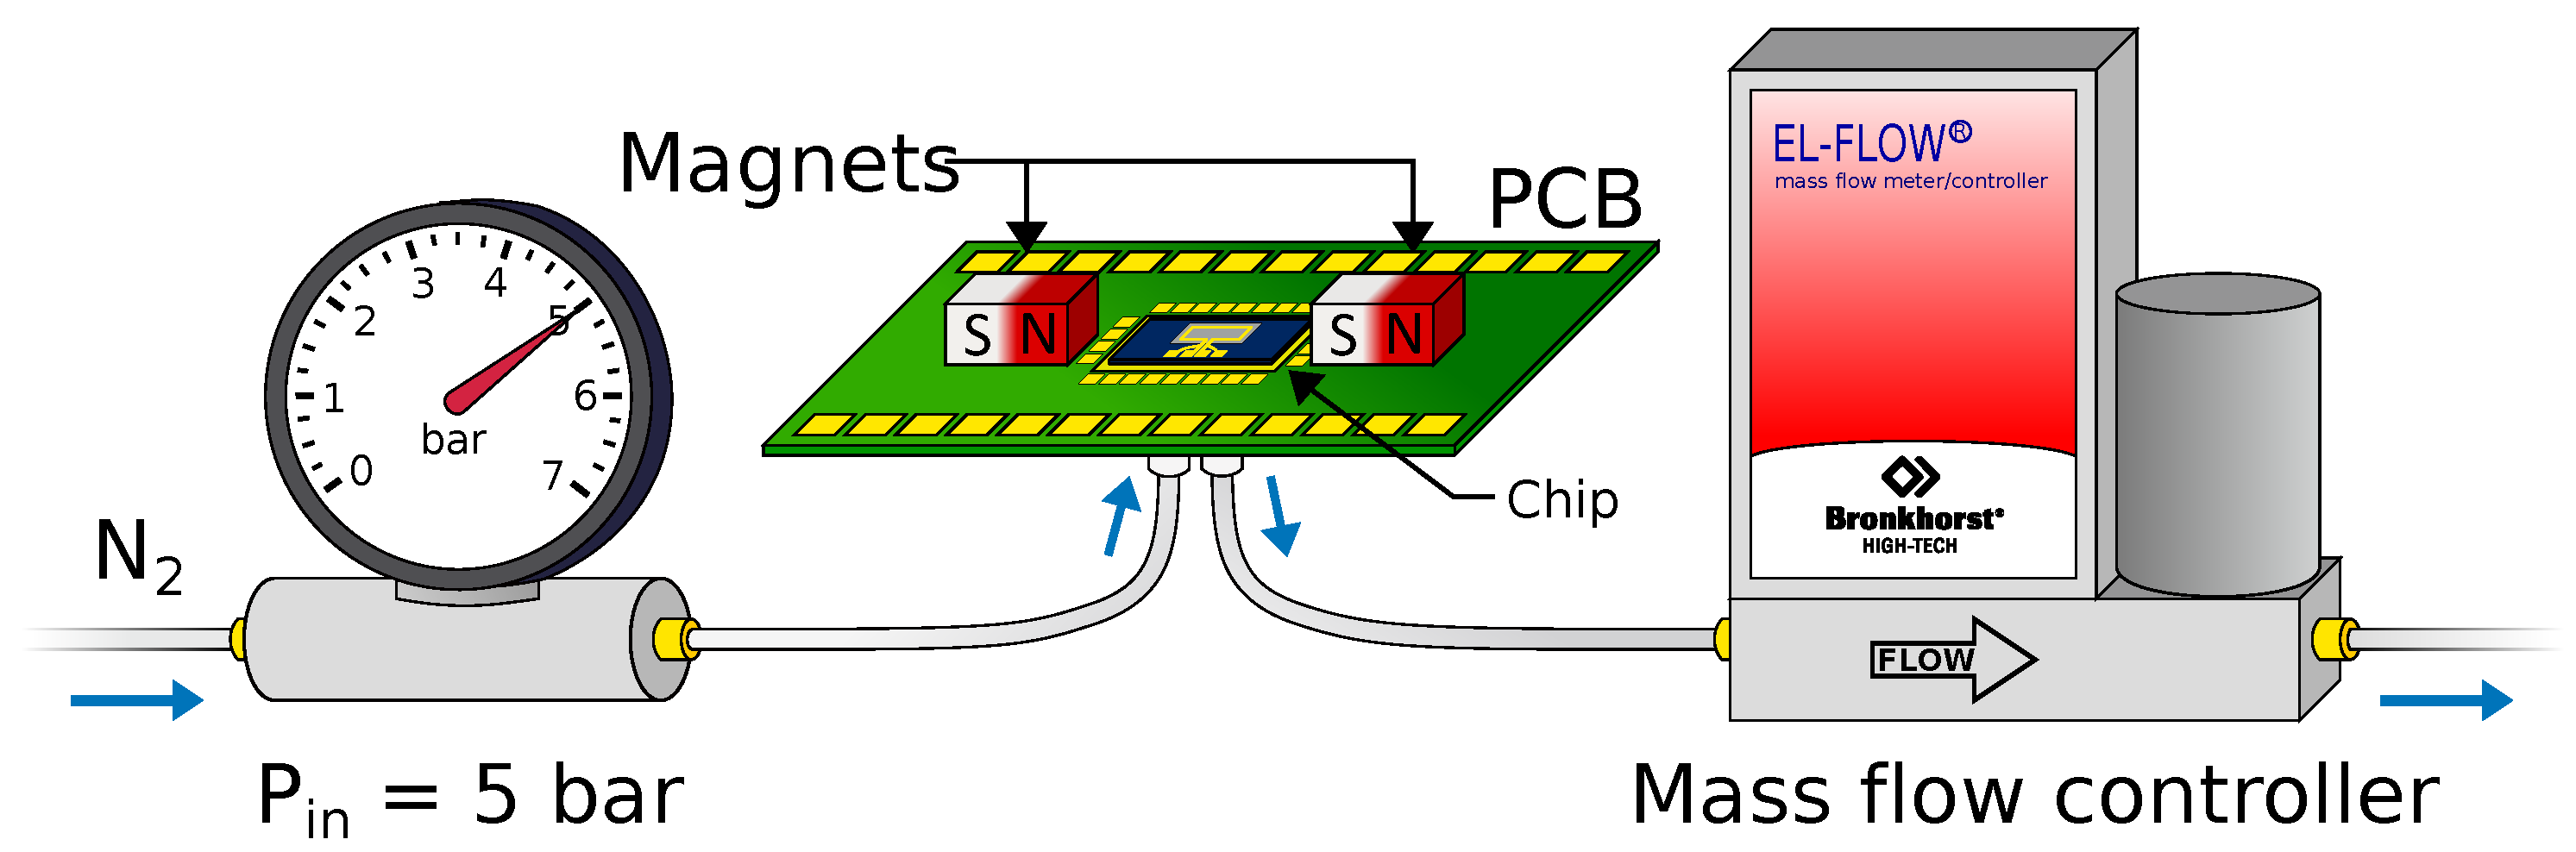
Figure 13.
Output of the resistive readout in relation to the applied flow. Each shown measurement point is an average of the output signal over a period of 200 s at a stable flow. The error bars represent the standard deviation, which is determined over the same time period.
Figure 13.
Output of the resistive readout in relation to the applied flow. Each shown measurement point is an average of the output signal over a period of 200 s at a stable flow. The error bars represent the standard deviation, which is determined over the same time period.

Figure 14.
Phase difference output of the resistive readout with no flow over a period of 1800 s. The sensor’s channel is kept at a constant pressure of 5 bar (gauge pressure) while its outlet is closed off.
Figure 14.
Phase difference output of the resistive readout with no flow over a period of 1800 s. The sensor’s channel is kept at a constant pressure of 5 bar (gauge pressure) while its outlet is closed off.


Table 1.
Experimental parameters of the three flow sensors determined from the (zero-)flow measurements. The zero-flow stability is defined as the standard deviation of the measured flow over a period of 1800 s (see Figure 14).
Table 1.
Experimental parameters of the three flow sensors determined from the (zero-)flow measurements. The zero-flow stability is defined as the standard deviation of the measured flow over a period of 1800 s (see Figure 14).
| Device | Actuation | Resonance Frequency (Model/Measured) [Hz] | Flow Sensitivity [°/g·h−1] | Standard Deviation [g·h−1] | Zero-Flow Stability [g·h−1] |
|---|---|---|---|---|---|
| A | Twist | 2426 /2113 | - | - | - |
| Swing | 1312 /1184 | 1.08 | 0.12 | 0.19 | |
| B | Twist | 2426 /2156 | - | - | - |
| Swing | 1312 /1203 | 2.22 | 0.02 | 0.02 | |
| C | Twist | 2519 /2254 | 1.23 | 0.10 | 0.11 |
| Swing | 1699 /1624 | 0.63 | 0.10 | 0.09 |
© 2020 by the authors. Licensee MDPI, Basel, Switzerland. This article is an open access article distributed under the terms and conditions of the Creative Commons Attribution (CC BY) license (http://creativecommons.org/licenses/by/4.0/).
Share and Cite
MDPI and ACS Style
Schut, T.; Wiegerink, R.; Lötters, J. μ-Coriolis Mass Flow Sensor with Resistive Readout. Micromachines 2020, 11, 184. https://doi.org/10.3390/mi11020184
AMA Style
Schut T, Wiegerink R, Lötters J. μ-Coriolis Mass Flow Sensor with Resistive Readout. Micromachines. 2020; 11(2):184. https://doi.org/10.3390/mi11020184
Chicago/Turabian StyleSchut, Thomas, Remco Wiegerink, and Joost Lötters. 2020. "μ-Coriolis Mass Flow Sensor with Resistive Readout" Micromachines 11, no. 2: 184. https://doi.org/10.3390/mi11020184
Note that from the first issue of 2016, this journal uses article numbers instead of page numbers. See further details here.