
Ultrafast Microfluidic PCR Thermocycler for Nucleic Acid Amplification
 ,
,
Abstract
:1. Introduction
2. Materials and Methods
2.1. Mechanical Structure of Thermocycler
2.1.1. Requirement Analysis and Design Scheme
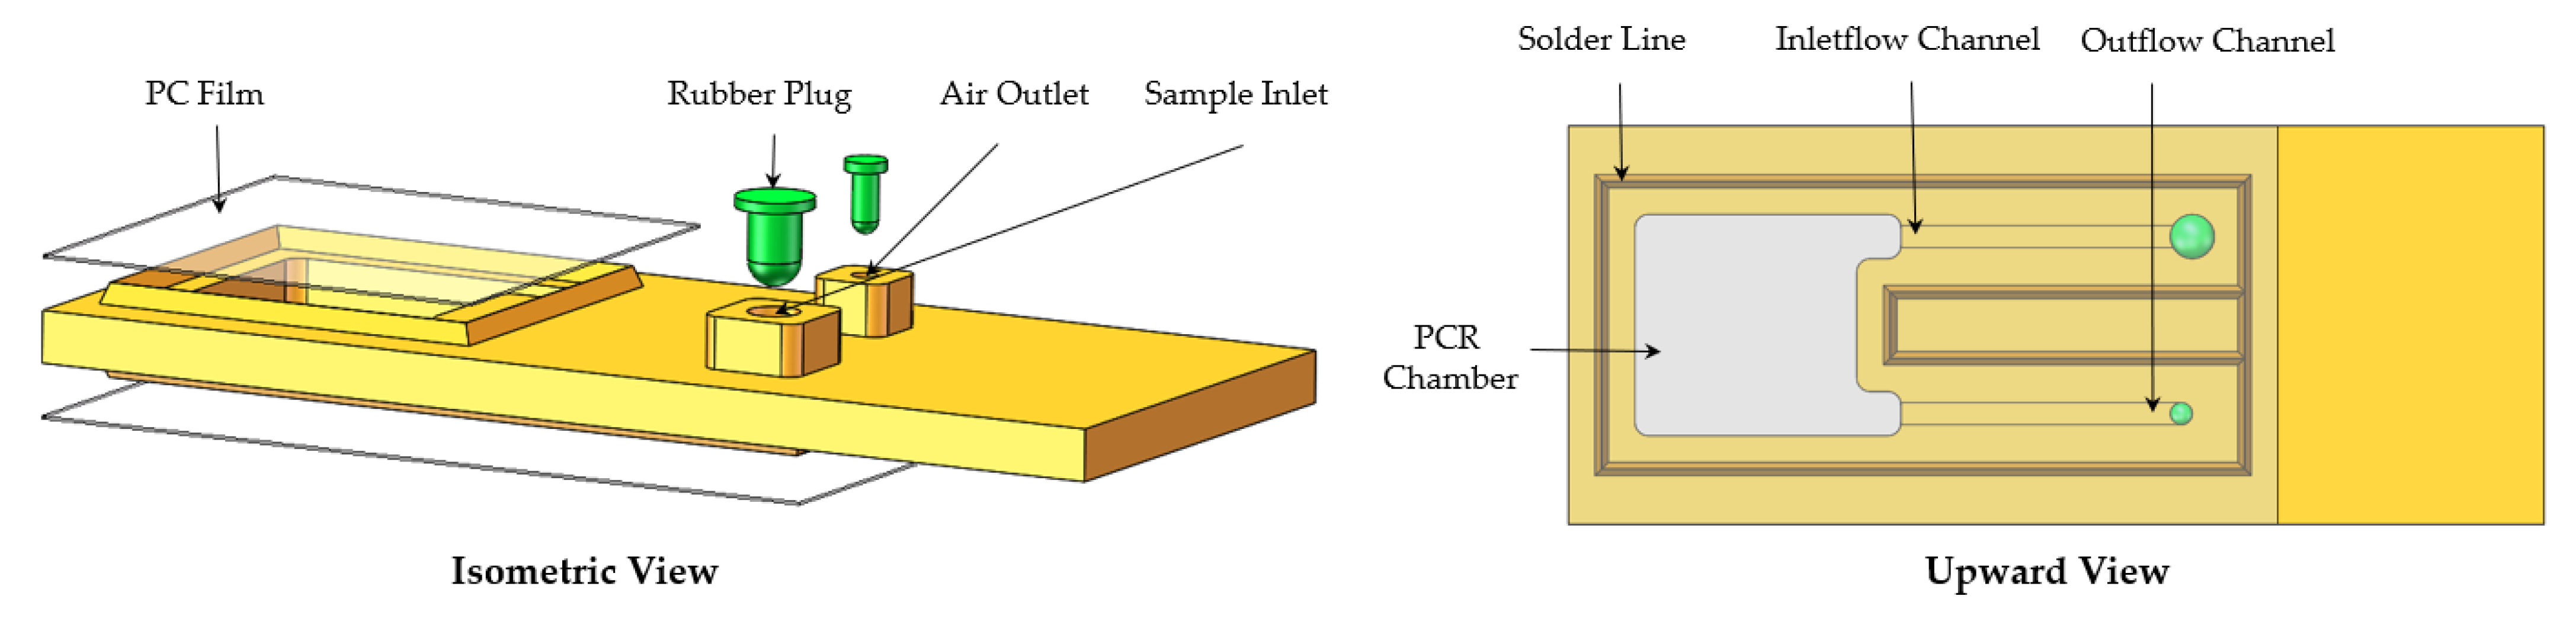
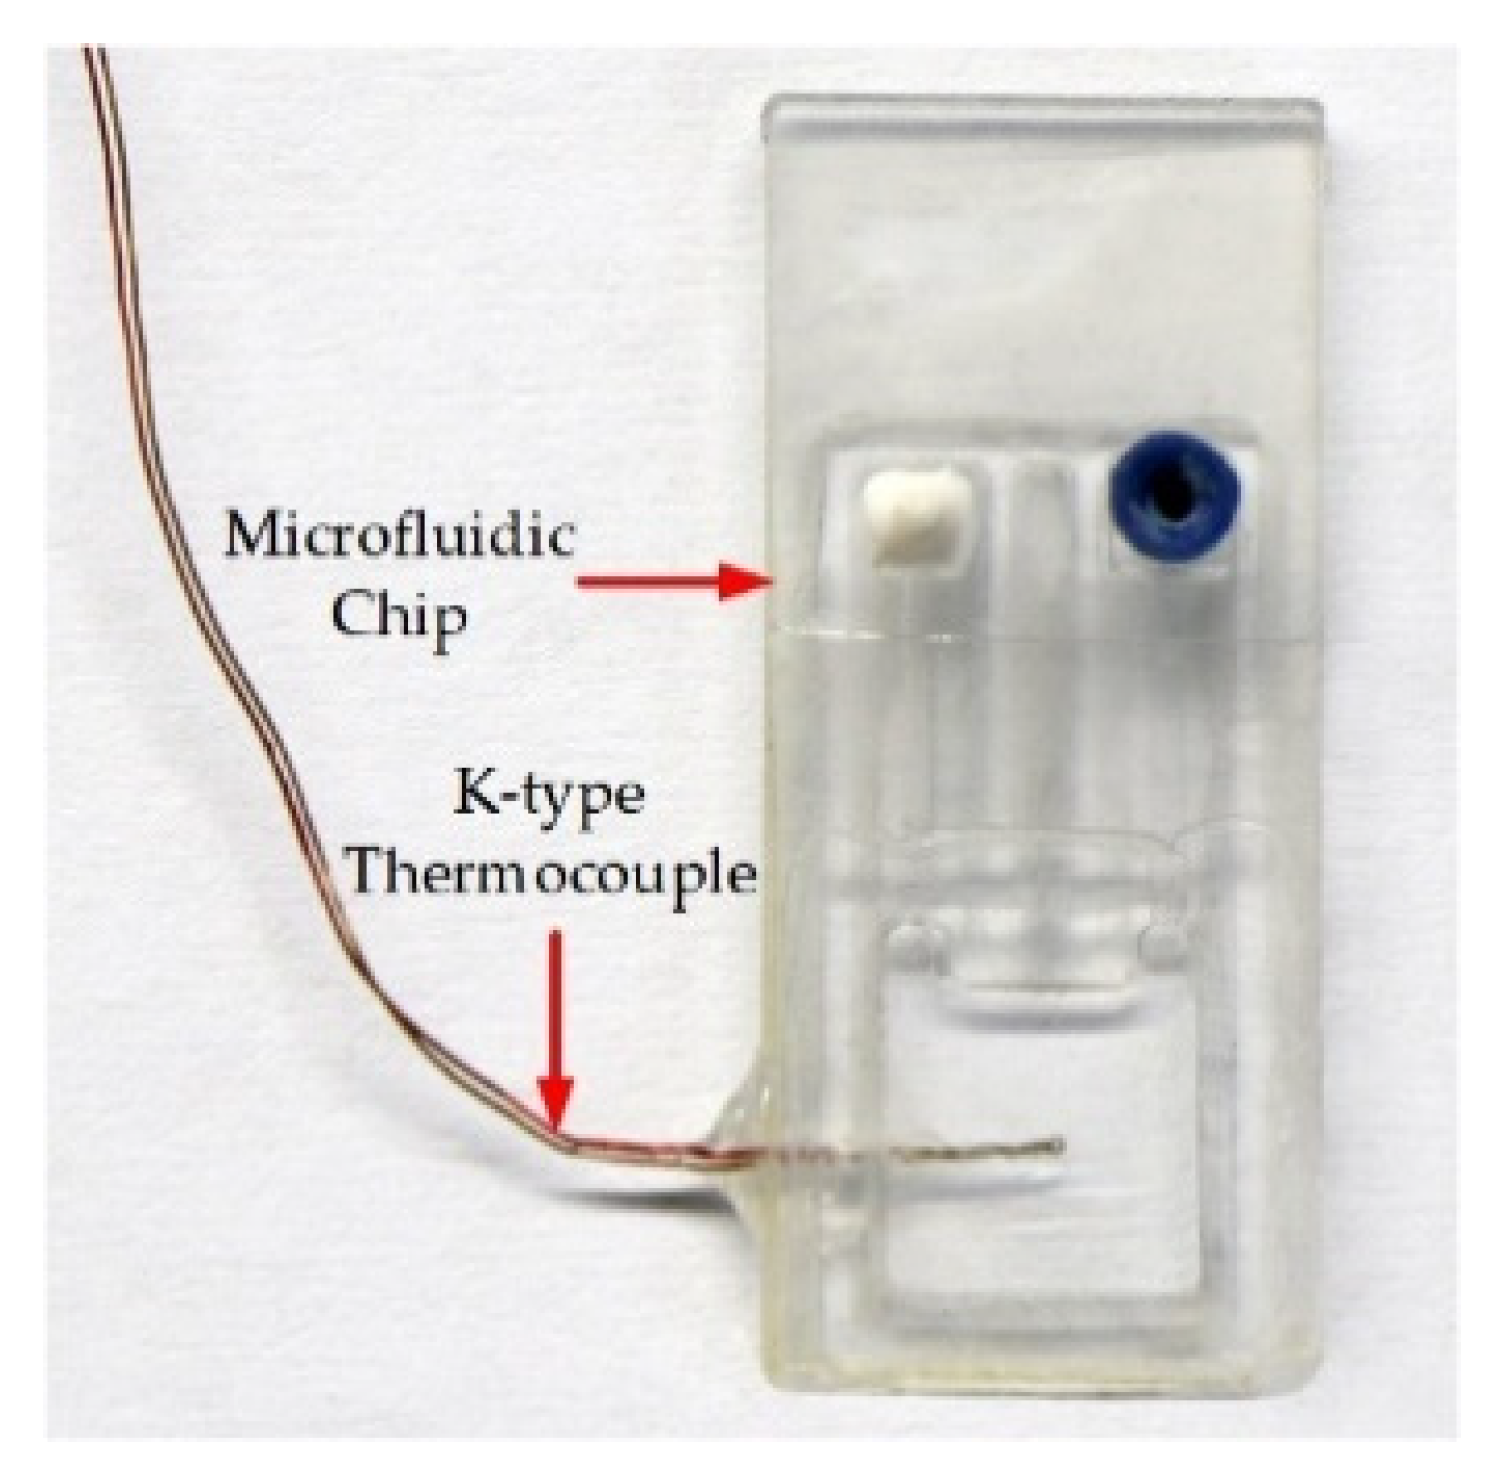
2.1.2. Microfluidic Chip Design and Fabrication
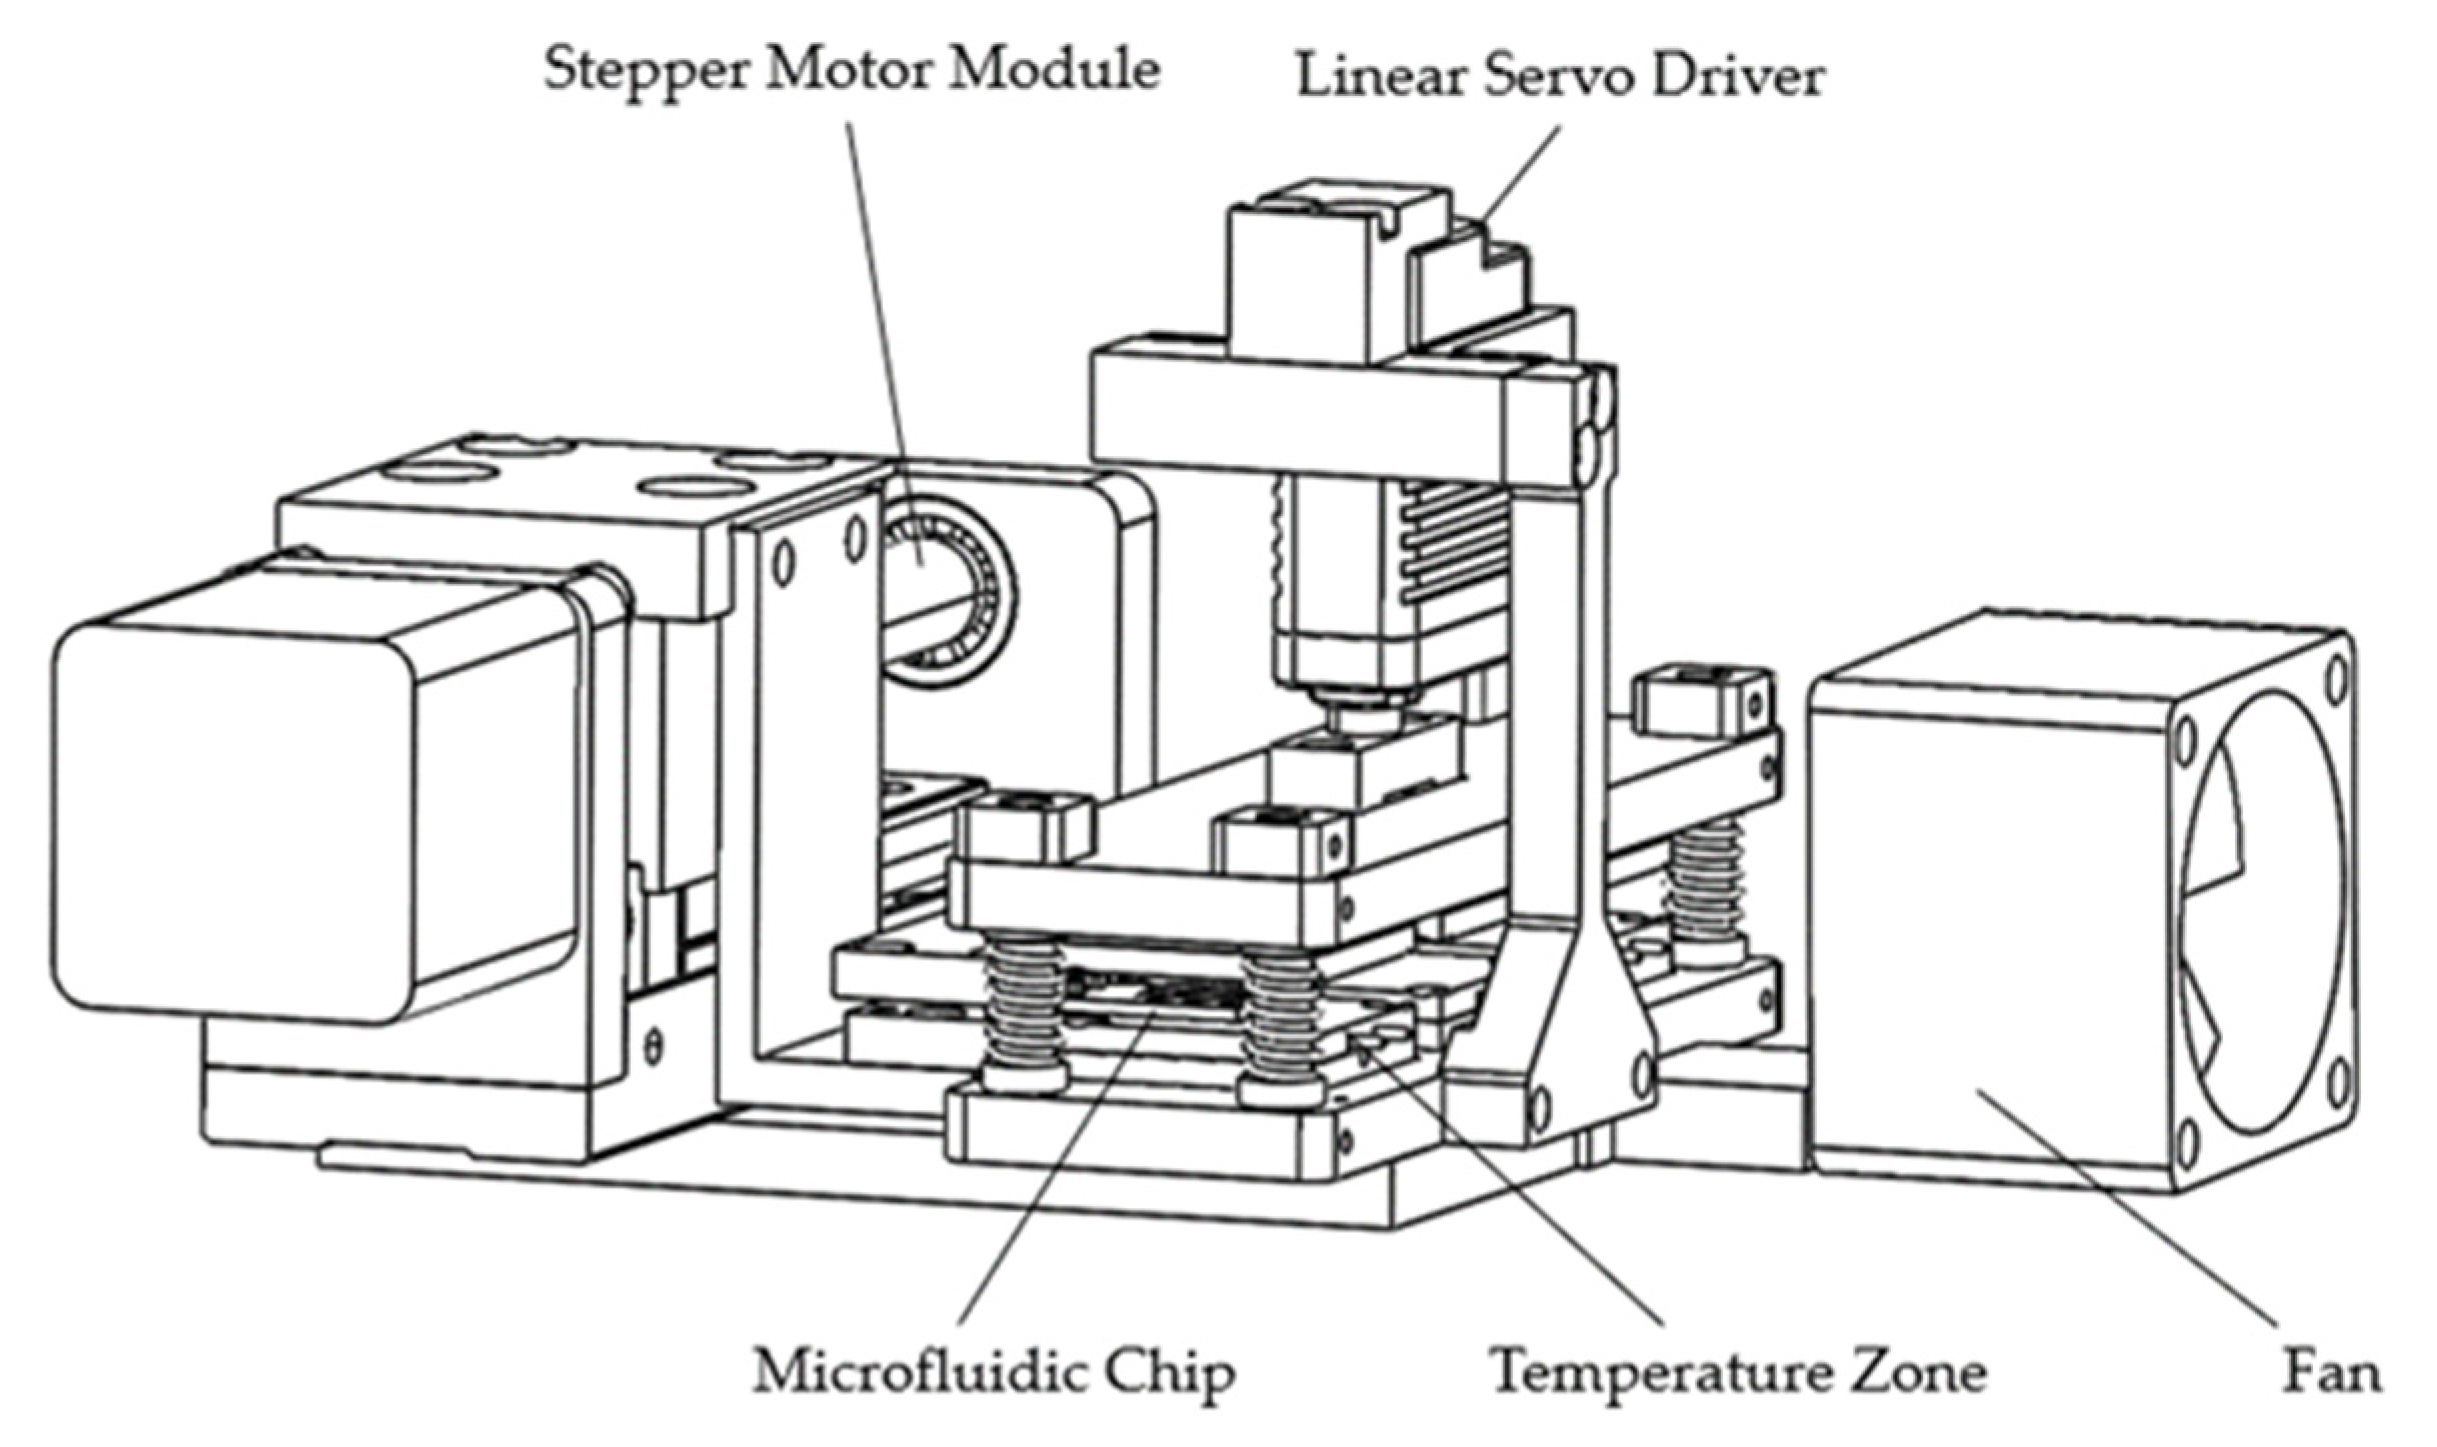
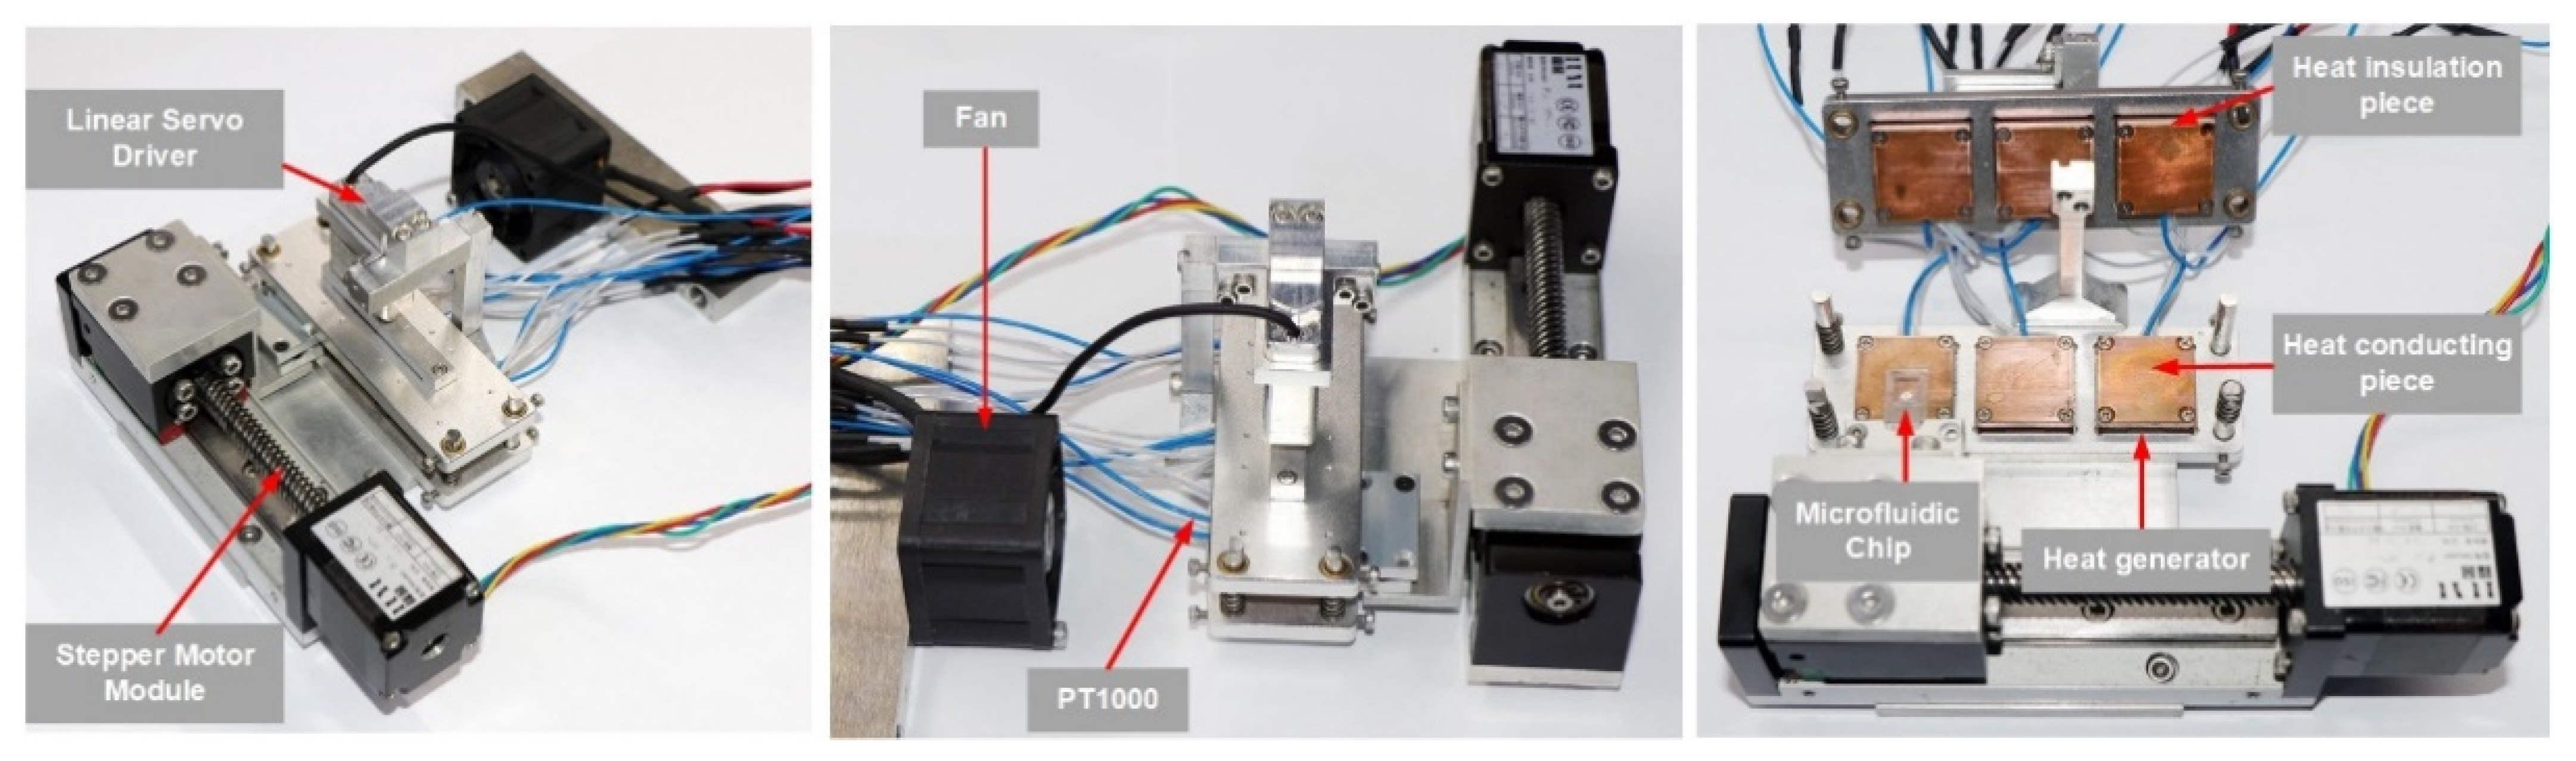
2.1.3. Structure Composition
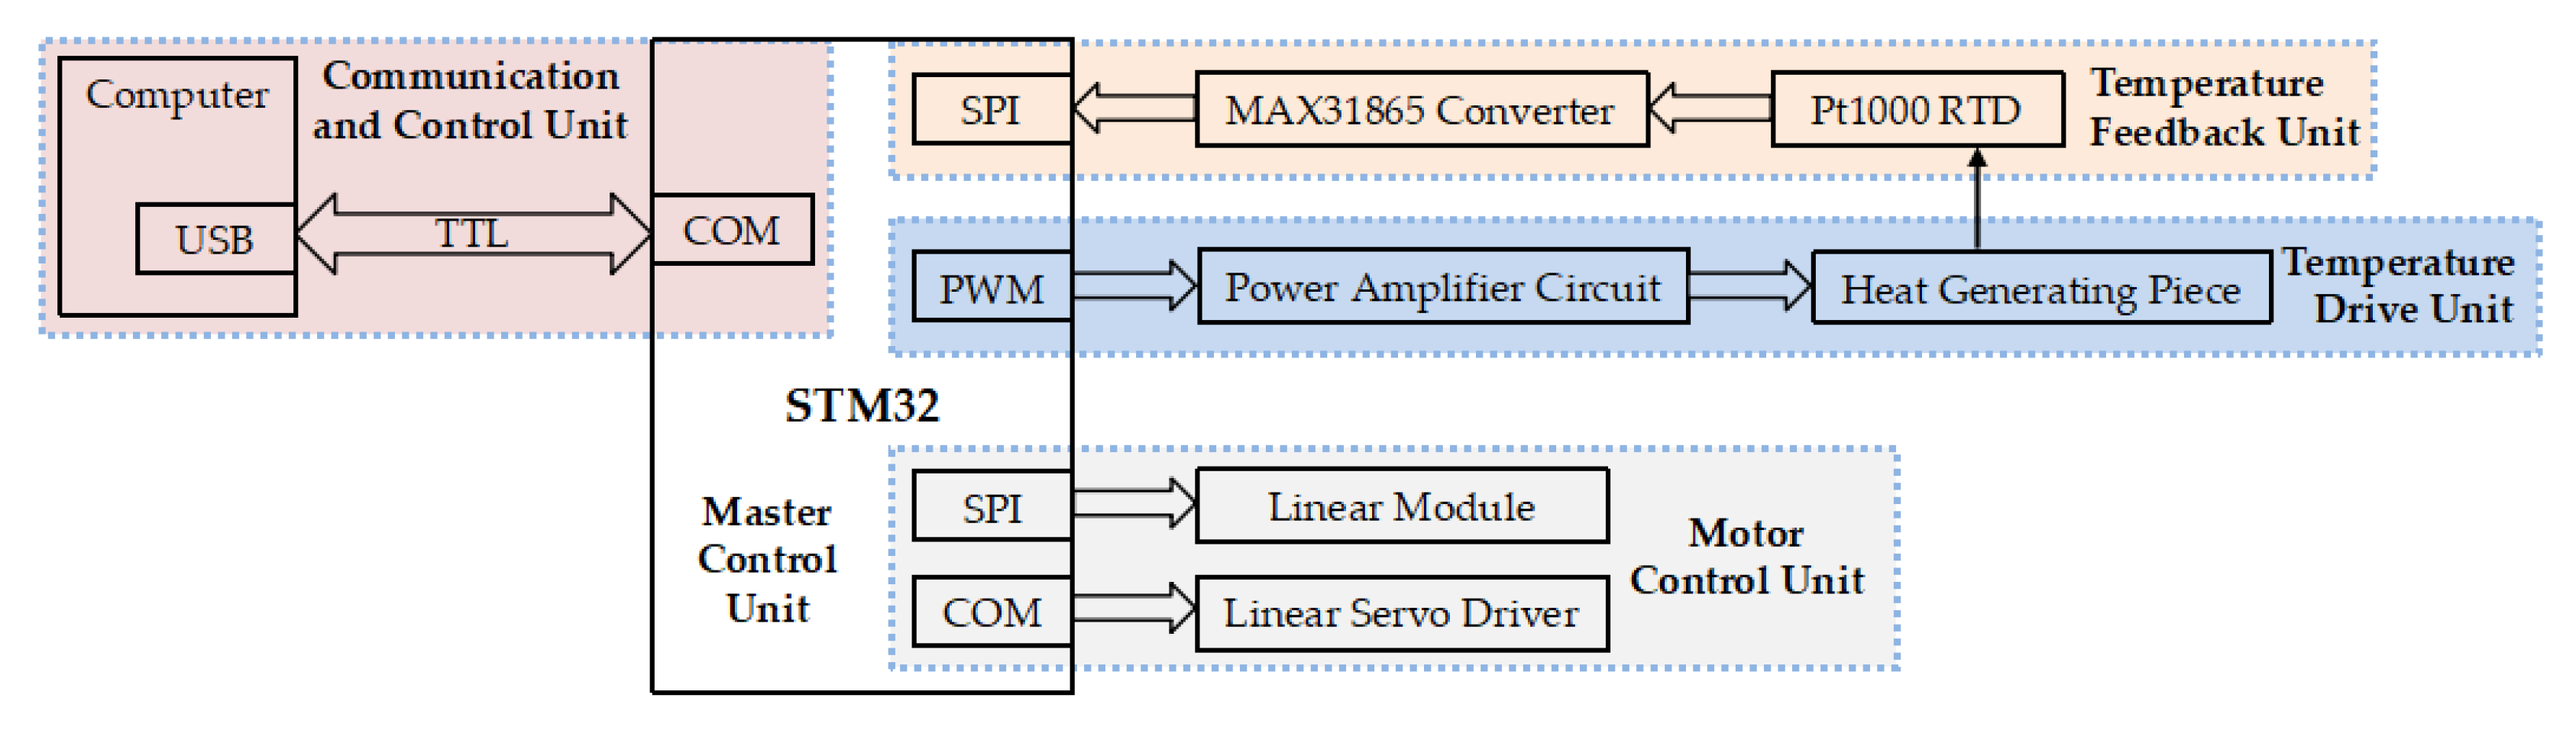
2.2. Electric Control System of Thermocycler
2.3. Modeling and Solving the Thermocycler’s Critical Parameters
2.3.1. Modeling of the Temperature in the Microfluidic Chip and Solution
2.3.2. Modeling of Temperature in the Heat-Conducting Pieces
2.3.3. Determination of Parameters for Heat Generators
- 1.
- The thermal load consisted of two main components:
- (1)
- The heat absorbed by the microfluidic chip and solution to rise from room temperature (25 °C) to 95 °C:
where , , and are the heat absorption of the thermal conductivity piece, microfluidic chip, and solution, respectively.- (2)
- Heat loss on the bottom and sides of the heat-conducting pieces:The temperature of the heat-conducting pieces was preset to 130 °C, so the thermal physical parameters of the air are shown in Table A2.
- 2.
- Determination of heat generator parameters:
2.4. Thermocycler Implementation and Performance Testing
2.5. Sample and PCR Protocol
3. Results and Discussion
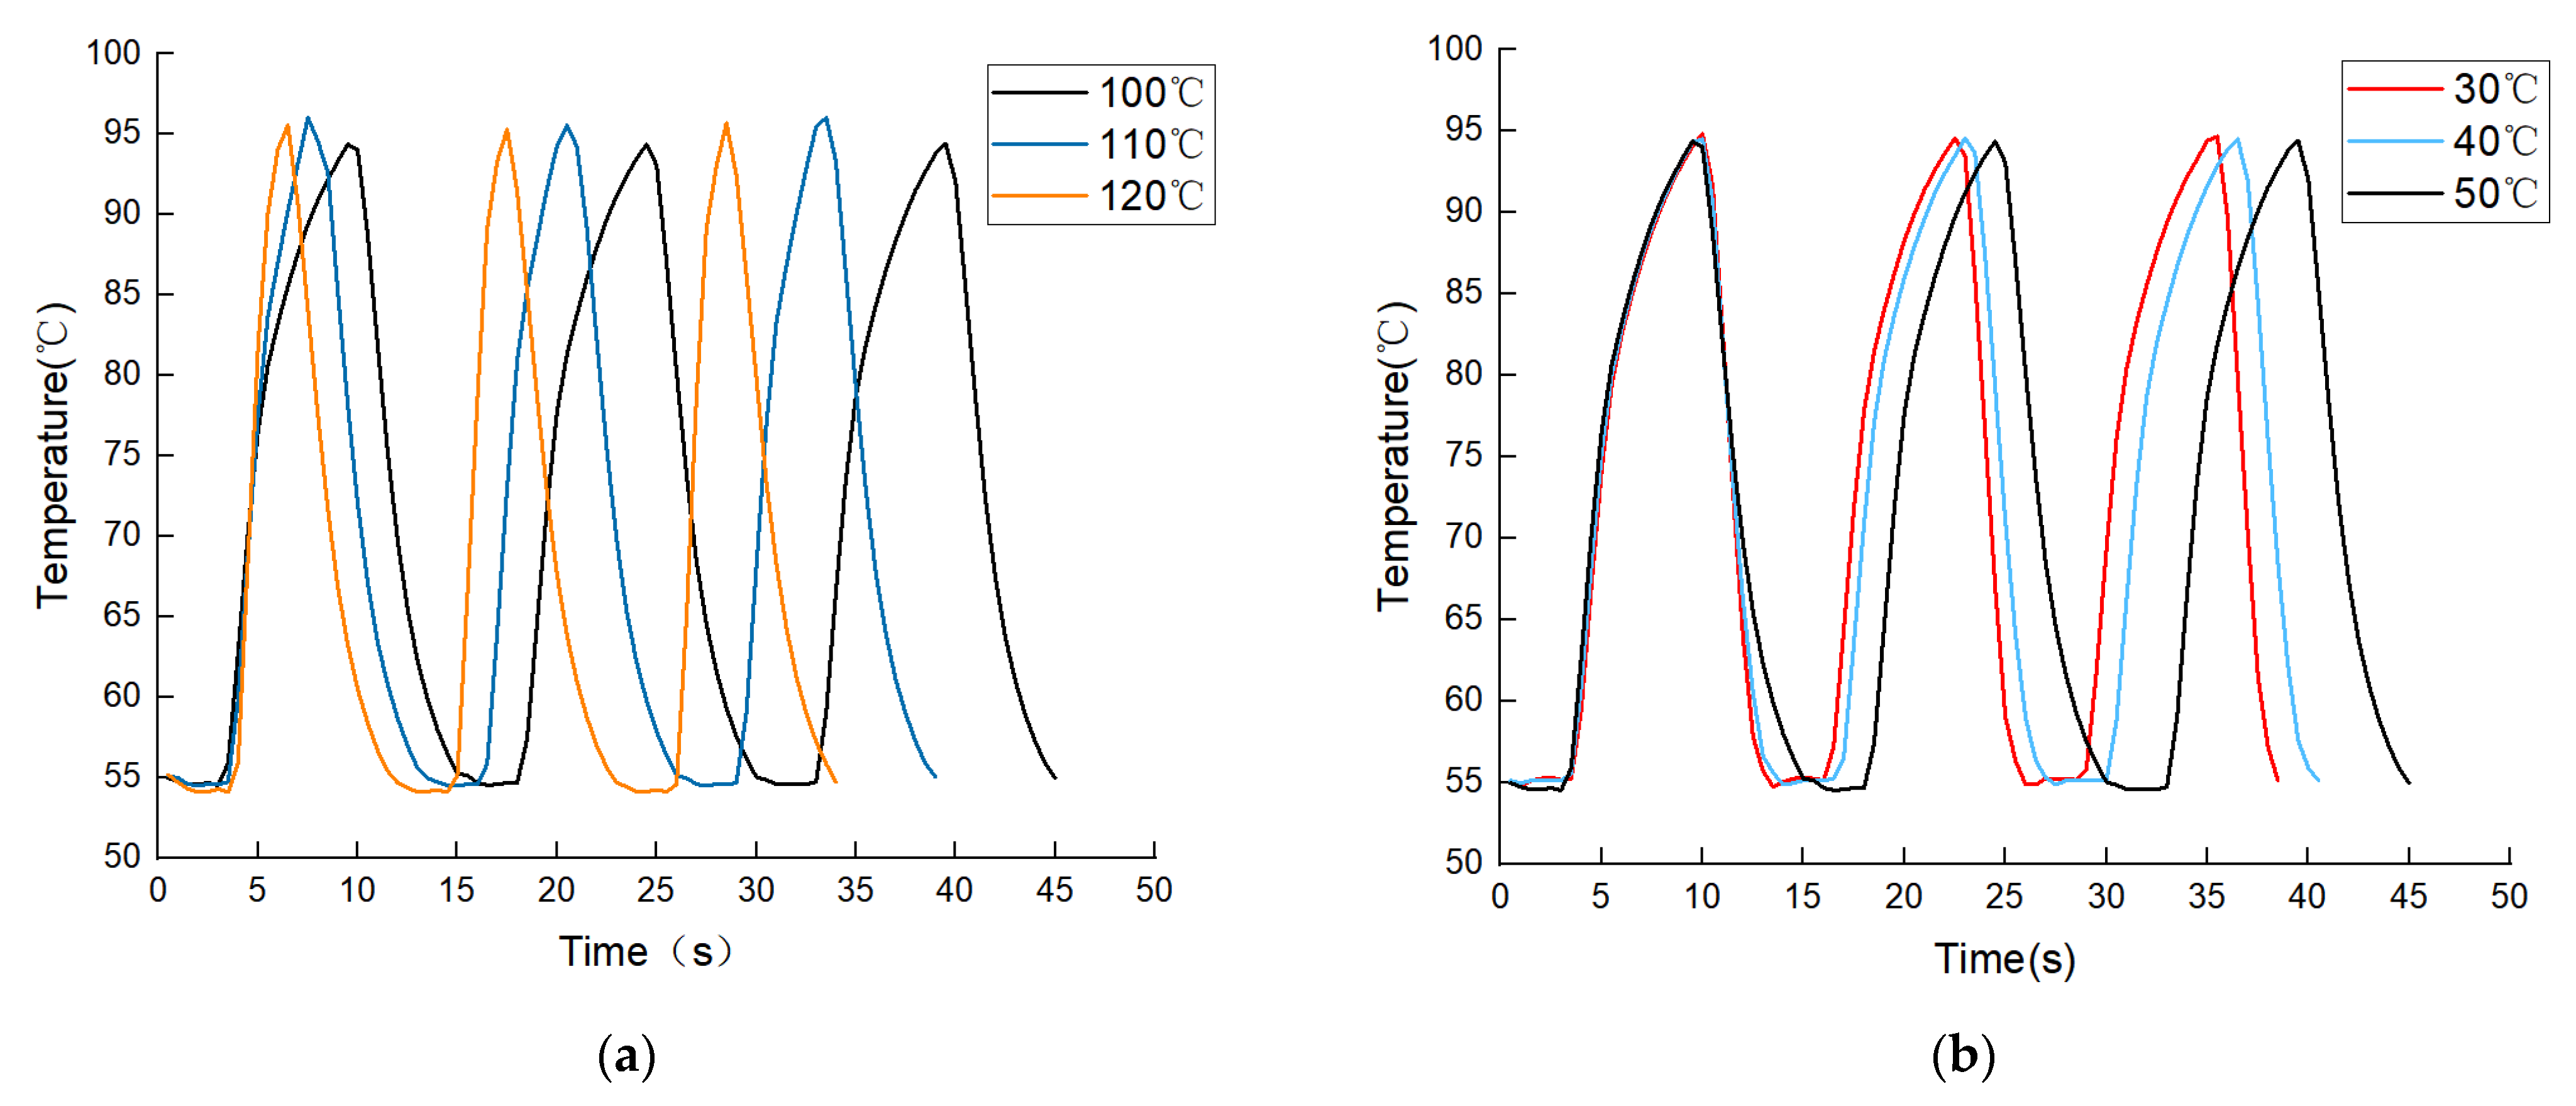
3.1. Fluid Temperature Changes Driven by Temperature Difference
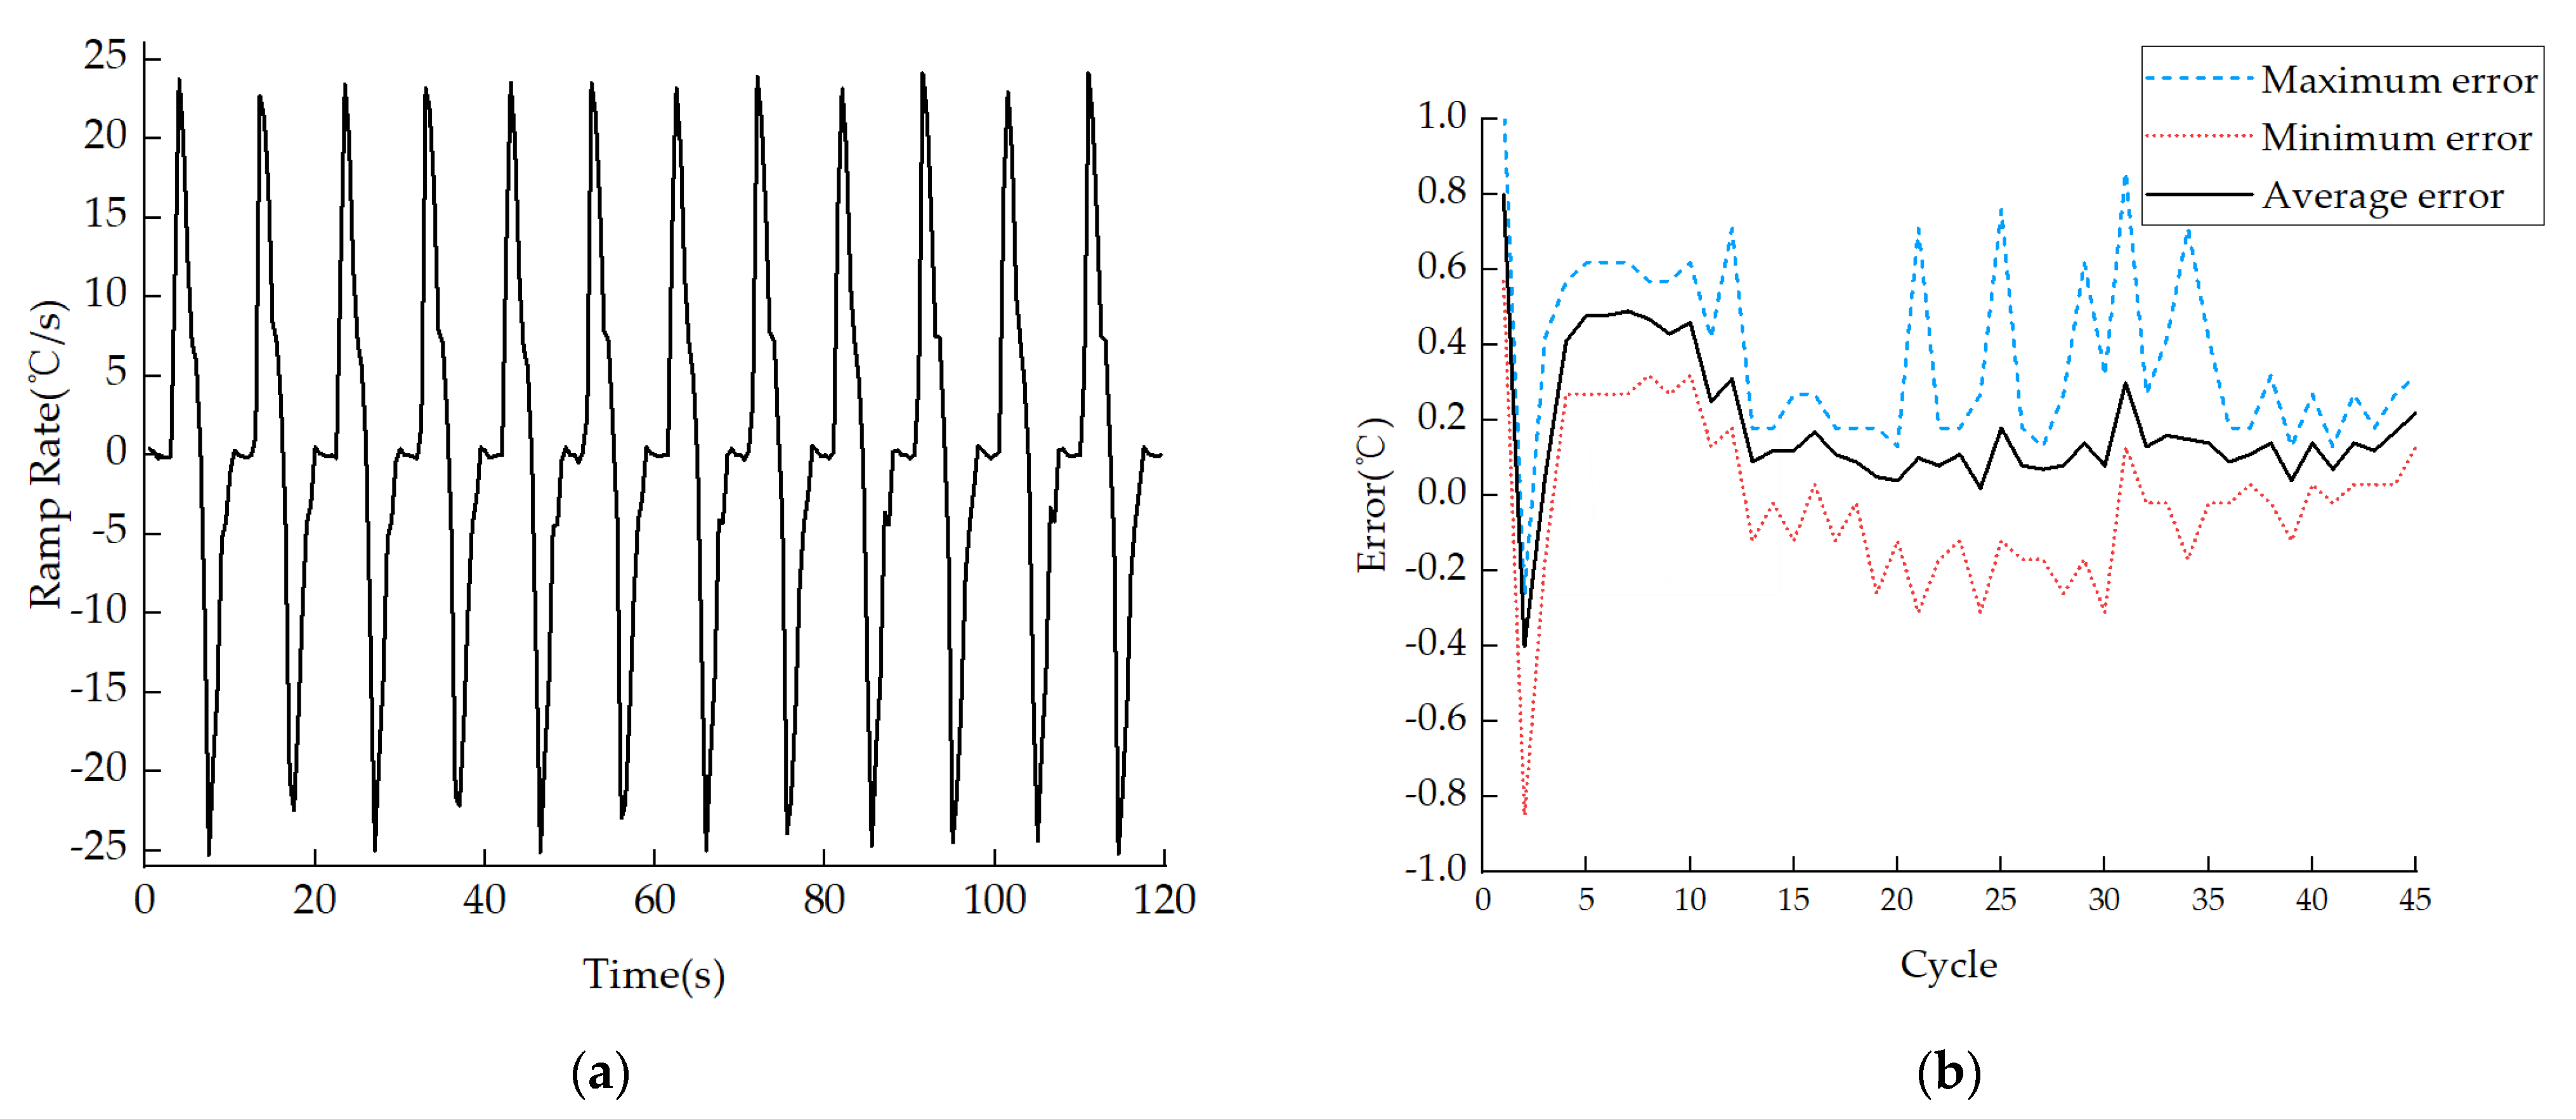
3.2. Thermal Performance of the PCR Process
3.3. Nucleic Acid Amplification Results
3.4. Discussion
4. Conclusions
Author Contributions
Funding
Data Availability Statement
Conflicts of Interest
Appendix A

| Materials | Specific Heat Capacity (J/kg∙K) | Density (kg/m3) | Size |
|---|---|---|---|
| Heat-conducting pieces (copper) | 394 | 8930 | 20 mm × 20 mm × 2 mm |
| Microfluidic Chip (PC) | 1170 | 1200 | 44 mm3 |
| Solution | 4200 | 1000 | 25 μL |
| Gravitational acceleration g | 9.8 m/s2 |
| Coefficient of volume expansion β | 2.5 × 10⁻³/K |
| Kinematic viscosity factor v | 2.64 × 10⁻⁵ m2/s |
| Thermal diffusion system α | 3.83 × 10⁻⁵ m2/s |
| Thermal conductivity λ | 3.38 × 10⁻⁴ W/(m∙K) |
| Prandtl number Pr | 0.69 |
| Components | Manufacturers and Models | Characteristics |
|---|---|---|
| Stepper Motor Module | FUYU: FSK30 | Screw rod parameters: Tr8 × 2 |
| Linear Servo Driver | INSPIRE-ROBOTS: LAS10-021D | Positioning accuracy: ±0.03 mm |
| Heaters | CHUANGTE | Static power: 20 W |
| RTD | SWT: Pt1000 | Temperature resolution: 0.01 °C |
| Thermocouple | KAIPUSEN: K-type | Temperature resolution: 0.01 °C |
| Fan | XINGHE: XH-X166 | Rotational speed 50: rpm/s |
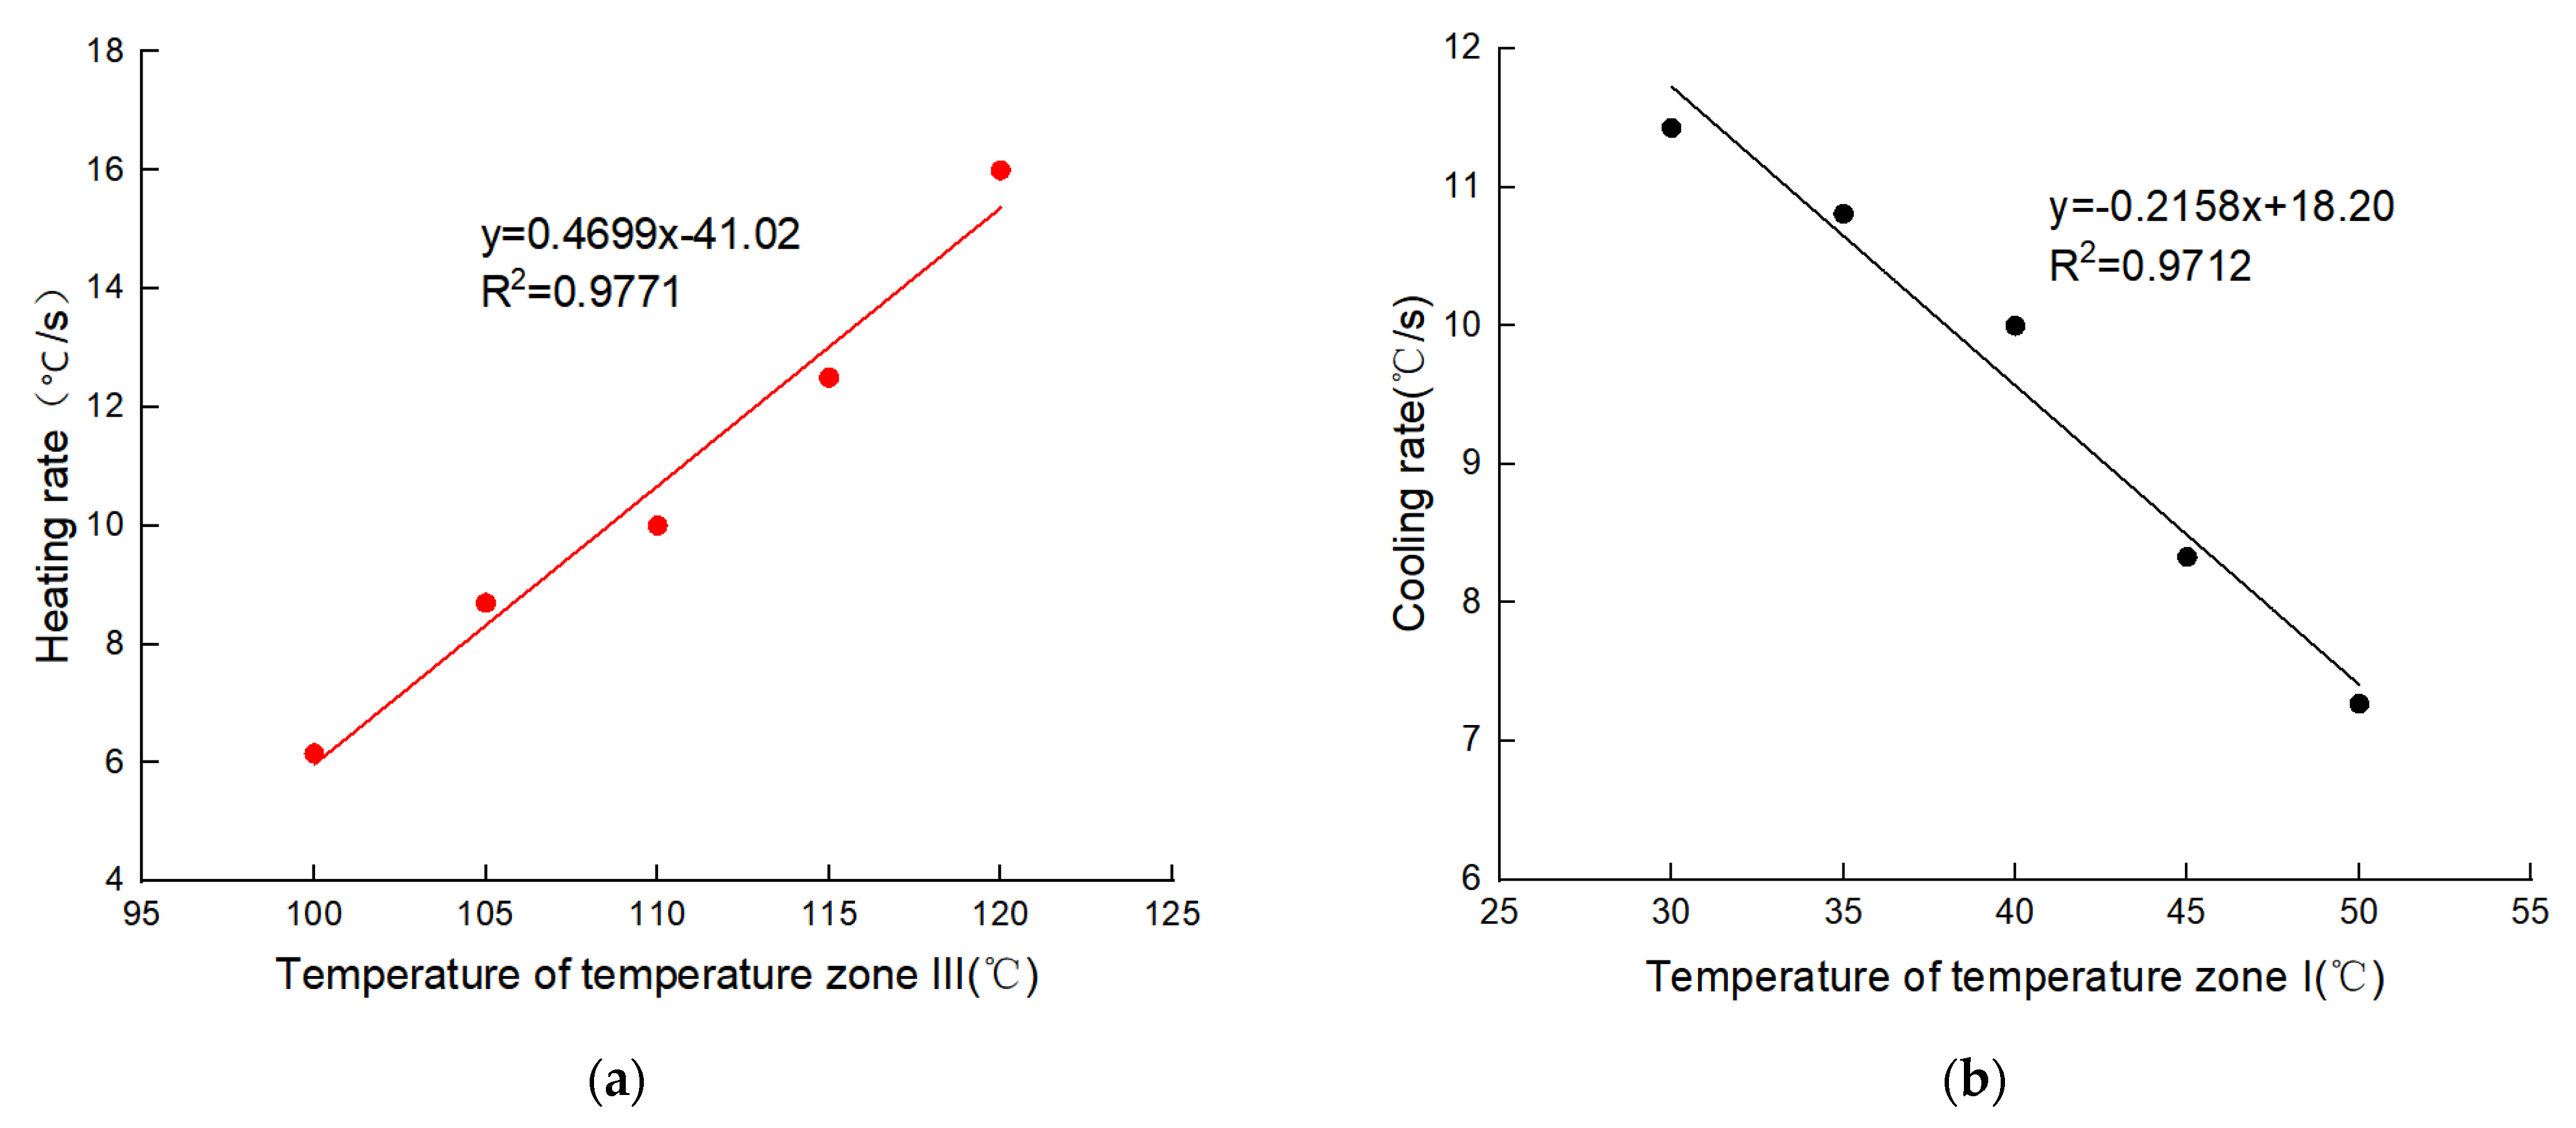
| TZ-III (°C) | Experimental Heating Rate (°C/s) | Predicted Cooling Rate (°C/s) | Prediction Error (°C/s) | Prediction Error Rate | Average Error Rate |
|---|---|---|---|---|---|
| 100 | 6.15 | 5.97 | −0.19 | 3.13% | 4.41% |
| 105 | 8.70 | 8.32 | −0.38 | 4.56% | |
| 110 | 10.00 | 10.67 | 0.67 | 6.24% | |
| 115 | 12.50 | 13.02 | 0.52 | 3.96% | |
| 120 | 16.00 | 15.37 | −0.64 | 4.13% | |
| TZ-I (°C) | Experimental Heating Rate (°C/s) | Predicted Cooling Rate (°C/s) | Prediction Error (°C/s) | Prediction Error Rate | Average Error Rate |
| 30 | 11.43 | 11.75 | 0.32 | 2.74% | 2.56% |
| 35 | 10.81 | 10.68 | −0.14 | 1.27% | |
| 40 | 10.00 | 9.60 | −0.40 | 4.17% | |
| 45 | 8.33 | 8.53 | 0.19 | 2.25% | |
| 50 | 7.27 | 7.45 | 0.18 | 2.38% |
| Cycles | Average Temperature Error (°C) | Maximum Temperature Error (°C) | Minimum Temperature Error (°C) |
|---|---|---|---|
| 1st–15th Cycles | 55.30/0.30 | 56.05/1.05 | 54.15/−0.85 |
| 16th–30th Cycles | 55.09/0.09 | 55.76/0.76 | 54.69/−0.31 |
| 31st–45th Cycles | 55.14/0.14 | 55.86/0.86 | 54.83/−0.17 |
References
- Shen, M.Z.; Zhou, Y.; Ye, J.W.; Al-Maskri, A.A.A.; Kang, Y.; Zeng, S.; Cai, S. Recent advances and perspectives of nucleic acid detection for coronavirus. J. Pharm. Anal. 2020, 10, 97–101. [Google Scholar] [CrossRef]
- Nappier, S.P.; Ichida, A.; Jaglo, K.; Haugland, R.; Jones, K.R. Advancements in mitigating interference in quantitative polymerase chain reaction (qPCR) for microbial water quality monitoring. Sci. Total Environ. 2019, 671, 732–740. [Google Scholar] [CrossRef]
- Mangal, M.; Bansal, S.; Sharma, S.K.; Gupta, R.K. Molecular Detection of Foodborne Pathogens: A Rapid and Accurate Answer to Food Safety. Crit. Rev. Food Sci. Nutr. 2016, 56, 1568–1584. [Google Scholar] [CrossRef]
- Zhu, H.; Zhang, H.; Xu, Y.; Lassakova, S.; Korabecna, M.; Neuzil, P. PCR past, present and future. Biotechniques 2020, 69, 317–325. [Google Scholar] [CrossRef]
- Carter, L.J.; Garner, L.V.; Smoot, J.W.; Li, Y.; Zhou, Q.; Saveson, C.J.; Sasso, J.M.; Gregg, A.C.; Soares, D.J.; Beskid, T.R.; et al. Assay Techniques and Test Development for COVID-19 Diagnosis. Acs Cent. Sci. 2020, 6, 591–605. [Google Scholar] [CrossRef]
- Maia, R.; Carvalho, V.; Faria, B.; Miranda, I.; Catarino, S.; Teixeira, S.; Lima, R.; Minas, G.; Ribeiro, J. Diagnosis Methods for COVID-19: A Systematic Review. Micromachines 2022, 13, 1349. [Google Scholar] [CrossRef]
- Lee, J.S.; Ahn, J.J.; Kim, S.J.; Yu, S.Y.; Koh, E.J.; Kim, S.H.; Sung, H.S.; Huh, J.W.; Hwang, S.Y. POCT Detection of 14 Respiratory Viruses Using Multiplex RT-PCR. Biochip J. 2021, 15, 371–380. [Google Scholar] [CrossRef] [PubMed]
- Xu, D.; Jiang, X.; Zou, T.; Miao, G.; Fu, Q.; Xiang, F.; Feng, L.; Ye, X.; Zhang, L.; Qiu, X. A microfluidic system for rapid nucleic acid analysis based on real-time convective PCR at point-of-care testing. Microfluid. Nanofluidics 2022, 26, 69. [Google Scholar] [CrossRef]
- Farrar, J.S.; Wittwer, C.T. Extreme PCR: Efficient and Specific DNA Amplification in 15–60 Seconds. Clin. Chem. 2015, 61, 145–153. [Google Scholar] [CrossRef] [PubMed] [Green Version]
- Neuzil, P.; Zhang, C.; Pipper, J.; Oh, S.; Zhuo, L. Ultra fast miniaturized real-time PCR: 40 cycles in less than six minutes. Nucleic Acids Res. 2006, 34, e77. [Google Scholar] [CrossRef]
- Cheong, J.; Yu, H.; Lee, C.Y.; Lee, J.-u.; Choi, H.-J.; Lee, J.-H.; Lee, H.; Cheon, J. Fast detection of SARS-CoV-2 RNA via the integration of plasmonic thermocycling and fluorescence detection in a portable device. Nat. Biomed. Eng. 2020, 4, 1159–1167. [Google Scholar] [CrossRef] [PubMed]
- Son, J.H.; Cho, B.; Hong, S.; Lee, S.H.; Hoxha, O.; Haack, A.J.; Lee, L.P. Ultrafast photonic PCR. Light Sci. Appl. 2015, 4, e280. [Google Scholar] [CrossRef] [Green Version]
- Huang, S.; Wu, J.; Dai, H.; Gao, R.; Lin, H.; Zhang, D.; Ge, S. Development of amplification system for point-of-care test of nucleic acid. Comput. Methods Biomech. Biomed. Eng. 2022, 25, 961–970. [Google Scholar] [CrossRef]
- Fuchiwaki, Y.; Nagai, H.; Saito, M.; Tamiya, E. Ultra-rapid flow-through polymerase chain reaction microfluidics using vapor pressure. Biosens. Bioelectron. 2011, 27, 88–94. [Google Scholar] [CrossRef]
- Hashimoto, M.; Chen, P.-C.; Mitchell, M.W.; Nikitopoulos, D.E.; Soper, S.A.; Murphy, M.C. Rapid PCR in a continuous flow device. Lab A Chip 2004, 4, 638–645. [Google Scholar] [CrossRef] [Green Version]
- Lin, Y.-H.; Liao, X.-J.; Chang, W.; Chiou, C.-C. Ultrafast DNA Amplification Using Microchannel Flow-Through PCR Device. Biosensors 2022, 12, 303. [Google Scholar] [CrossRef]
- Chen, J.-J.; Lin, Z.-H. Fabrication of an Oscillating Thermocycler to Analyze the Canine Distemper Virus by Utilizing Reverse Transcription Polymerase Chain Reaction. Micromachines 2022, 13, 600. [Google Scholar] [CrossRef] [PubMed]
- Priye, A.; Hassan, Y.A.; Ugaz, V.M. Education: DNA replication using microscale natural convection. Lab A Chip 2012, 12, 4946–4954. [Google Scholar] [CrossRef] [PubMed]
- Miao, G.; Guo, M.; Li, K.; Ye, X.; Mauk, M.G.; Ge, S.; Xia, N.; Yu, D.; Qiu, X. An Integrated, Real-Time Convective PCR System for Isolation, Amplification, and Detection of Nucleic Acids. Chemosensors 2022, 10, 271. [Google Scholar] [CrossRef]
- Qiu, X.; Zhang, S.; Xiang, F.; Wu, D.; Guo, M.; Ge, S.; Li, K.; Ye, X.; Xia, N.; Qian, S. Instrument-free point-of-care molecular diagnosis of H1N1 based on microfluidic convective PCR. Sens. Actuators B-Chem. 2017, 243, 738–744. [Google Scholar] [CrossRef]
- Liu, W.J.; Zhang, M.F.; Liu, X.Y.; Sharma, A.; Ding, X.T. A Point-of-Need infrared mediated PCR platform with compatible lateral flow strip for HPV detection. Biosens. Bioelectron. 2017, 96, 213–219. [Google Scholar] [CrossRef]
- Blumenfeld, N.R.; Bolene, M.A.E.; Jaspan, M.; Ayers, A.G.; Zarrandikoetxea, S.; Freudman, J.; Shah, N.; Tolwani, A.M.; Hu, Y.; Chern, T.L.; et al. Multiplexed reverse-transcriptase quantitative polymerase chain reaction using plasmonic nanoparticles for point-of-care COVID-19 diagnosis. Nat. Nanotechnol. 2022, 17, 984–992. [Google Scholar] [CrossRef] [PubMed]
- Kopp, M.U.; de Mello, A.J.; Manz, A. Chemical amplification: Continuous-flow PCR on a chip. Science 1998, 280, 1046–1048. [Google Scholar] [CrossRef] [PubMed] [Green Version]
- Fernandez-Carballo, B.L.; McBeth, C.; McGuiness, I.; Kalashnikov, M.; Baum, C.; Borros, S.; Sharon, A.; Sauer-Budge, A.F. Continuous-flow, microfluidic, qRT-PCR system for RNA virus detection. Anal. Bioanal. Chem. 2018, 410, 33–43. [Google Scholar] [CrossRef] [PubMed]
- Dong, X.; Liu, L.; Tu, Y.; Zhang, J.; Miao, G.; Zhang, L.; Ge, S.; Xia, N.; Yu, D.; Qiu, X. Rapid PCR powered by microfluidics: A quick review under the background of COVID-19 pandemic. TrAC Trends Anal. Chem. 2021, 143, 116377. [Google Scholar] [CrossRef]
- Kieu The Loan, T.; Lee, N.Y. A portable microreactor with minimal accessories for polymerase chain reaction: Application to the determination of foodborne pathogens. Microchim. Acta 2017, 184, 4225–4233. [Google Scholar] [CrossRef]
- Wittwer, C.T.; Herrmann, M.G.; Gundry, C.N.; Elenitoba-Johnson, K.S.J. Real-time multiplex PCR assays. Methods 2001, 25, 430–442. [Google Scholar] [CrossRef]
- Bustin, S.A. How to speed up the polymerase chain reaction. Biomol. Detect. Quantif. 2017, 12, 10–14. [Google Scholar] [CrossRef]
- Myrick, J.T.; Pryor, R.J.; Palais, R.A.; Ison, S.J.; Sanford, L.; Dwight, Z.L.; Huuskonen, J.J.; Sundberg, S.O.; Wittwer, C.T. Integrated Extreme Real-Time PCR and High-Speed Melting Analysis in 52 to 87 Seconds. Clin. Chem. 2019, 65, 263–271. [Google Scholar] [CrossRef] [Green Version]
- Millington, A.L.; Houskeeper, J.A.; Quackenbush, J.F.; Trauba, J.M.; Wittwer, C.T. The kinetic requirements of extreme qPCR. Biomol. Detect. Quantif. 2019, 17, 100081. [Google Scholar] [CrossRef]
- Liu, K.; Tong, H.; Li, T.; Wang, X.; Chen, Y. Research progress in molecular biology related quantitative methods of MicroRNA. Am. J. Transl. Res. 2020, 12, 3198. [Google Scholar]
- Chen, J.J.; Li, K.T.; Chen, W.H.; Yang, Y.T. Analysis of Thermal Performance in a Bidirectional Thermocycler by Including Thermal Contact Characteristics. Micromachines 2014, 5, 1445–1468. [Google Scholar] [CrossRef] [Green Version]
- Huang, J. Study on Quantitative Polymerase Chain Reaction Thermal Cycle System and Fluorescence Detection Technology. Ph.D. Thesis, Zhejiang University, Hangzhou, China, 2012. [Google Scholar]
- Venkanna, B.K. Fundamentals of Heat and Mass Transfer; PHI Learning Pvt. Ltd.: Delhi, India, 2010. [Google Scholar]
- Bartsch, M.S.; Edwards, H.S.; Lee, D.; Moseley, C.E.; Tew, K.E.; Renzi, R.F.; Van de Vreugde, J.L.; Kim, H.; Knight, D.L.; Sinha, A.; et al. The Rotary Zone Thermal Cycler: A Low-Power System Enabling Automated Rapid PCR. PLoS ONE 2015, 10, e0118182. [Google Scholar] [CrossRef] [PubMed]
- Liu, Y.; Pan, H.; Zhao, S.; Zhu, L.; Li, Z.; Zhang, L. Structural optimization design of TEC temperature control system for microfluidic PCR. Transducer Microsyst. Technol. 2013, 32, 85–88+92. [Google Scholar] [CrossRef]
- Shibamura, M.; Yamada, S.; Yoshikawa, T.; Inagaki, T.; Nguyen, P.H.A.; Fujii, H.; Harada, S.; Fukushi, S.; Oka, A.; Mizuguchi, M.; et al. Longitudinal Trends of Prevalence of Neutralizing Antibody against Human Cytomegalovirus over the Past 30 Years in Japanese Women. Jpn. J. Infect. Dis. 2022, 75, 496–503. [Google Scholar] [CrossRef] [PubMed]
- Nouwairi, R.L.; Cunha, L.L.; Turiello, R.; Scott, O.; Hickey, J.; Thomson, S.; Knowles, S.; Chapman, J.D.; Landers, J.P. Ultra-rapid real-time microfluidic RT-PCR instrument for nucleic acid analysis. Lab A Chip 2022, 22, 3424–3435. [Google Scholar] [CrossRef] [PubMed]


| Group | Sample Volume | Heating Rate | Cooling Rate | Heating/Cooling Methods | PCR Type | Reaction Monitoring |
|---|---|---|---|---|---|---|
| Qiu et al. [8] | 40 μL | Total time: 30 min (Fluorescence intensity saturation) | Resistive heater | Convection PCR | Fluorescence detection | |
| Farrar et al. [9] | 1–5 μL | 26–130 °C /s | Water bath heating/cooling | Static PCR | Gel electrophoresis | |
| Neuzil et al. [10] | 0.1 μL | 175 °C/s | 125 °C/s | Film heater/natural cooling | Fluorescence detection | |
| Cheong et al. [11] | 10 μL | 13.17 °C/s | 4.94 °C/s | Lasers and Au particles heating/natural cooling | Gel electrophoresis and fluorescence detection | |
| Son et al. [12] | 10 μL | 12.79 °C/s | 6.6 °C/s | Gel electrophoresis | ||
| Our previous work [13] | 80 μL | 4.5 °C/s | 5 °C/s | Peltier/fan | Fluorescence detection | |
| Several other researchers [14,15,16] | <10 μL | 3–6 s/cycle | Peltier, resistive heater, or film heater | Continuous flow PCR | Gel electrophoresis or fluorescence detection | |
| Voltage V | Power P | Dry Firing Surface Temperature |
|---|---|---|
| 24 V | 20 W | 300 °C |
| Heating Process | Temperature of TZ II | Temperature of TZ III | Heating Time | Average Heating Ramp Rate | Single PCR Cycle Time |
| 55 °C | 100 °C | 6.5 s | 6.15 °C/s | 15 s | |
| 110 °C | 4 s | 10 °C/s | 13 s | ||
| 120 °C | 2.5 s | 16 °C/s | 11 s | ||
| Cooling Process | Temperature of TZ III | Temperature of TZ I | Cooling Time | Average Cooling Ramp Rate | Single PCR Cycle Time |
| 100 °C | 50 °C | 5.5 s | 7.27 °C/s | 15 s | |
| 40 °C | 4 s | 10 °C/s | 13.5 s | ||
| 30 °C | 3.5 s | 11.43 °C/s | 12.5 s |
| Sample Label | Initial Fluorescence Value (RFU) | End Fluorescence Value (RFU) | Fluorescence Ratio | |
|---|---|---|---|---|
| Ultrafast Thermocycler | P1 | 3965 | 4708 | 1.19 |
| P2 | 3960 | 4433 | 1.12 | |
| P3 | 4032 | 5211 | 1.29 | |
| P4 | 3912 | 5125 | 1.31 | |
| P5 | 4160 | 5359 | 1.29 | |
| P6 | 3938 | 4713 | 1.20 | |
| N1 | 4322 | 3574 | 0.83 | |
| N2 | 4273 | 3443 | 0.81 | |
| Bio-Rad Instrument | P-1 | 4083 | 5530 | 1.35 |
| P-2 | 4080 | 5741 | 1.41 | |
| P-3 | 4164 | 6129 | 1.47 | |
| Tianlong Instrument | P#1 | 4106 | 5514 | 1.34 |
| P#2 | 4124 | 5289 | 1.28 | |
| P#3 | 4068 | 5297 | 1.30 |
Disclaimer/Publisher’s Note: The statements, opinions and data contained in all publications are solely those of the individual author(s) and contributor(s) and not of MDPI and/or the editor(s). MDPI and/or the editor(s) disclaim responsibility for any injury to people or property resulting from any ideas, methods, instructions or products referred to in the content. |
© 2023 by the authors. Licensee MDPI, Basel, Switzerland. This article is an open access article distributed under the terms and conditions of the Creative Commons Attribution (CC BY) license (https://creativecommons.org/licenses/by/4.0/).
Share and Cite
An, Y.-Q.; Huang, S.-L.; Xi, B.-C.; Gong, X.-L.; Ji, J.-H.; Hu, Y.; Ding, Y.-J.; Zhang, D.-X.; Ge, S.-X.; Zhang, J.; et al. Ultrafast Microfluidic PCR Thermocycler for Nucleic Acid Amplification. Micromachines 2023, 14, 658. https://doi.org/10.3390/mi14030658
An Y-Q, Huang S-L, Xi B-C, Gong X-L, Ji J-H, Hu Y, Ding Y-J, Zhang D-X, Ge S-X, Zhang J, et al. Ultrafast Microfluidic PCR Thermocycler for Nucleic Acid Amplification. Micromachines. 2023; 14(3):658. https://doi.org/10.3390/mi14030658
Chicago/Turabian StyleAn, Yi-Quan, Shao-Lei Huang, Bang-Chao Xi, Xiang-Lian Gong, Jun-Hao Ji, You Hu, Yi-Jie Ding, Dong-Xu Zhang, Sheng-Xiang Ge, Jun Zhang, and et al. 2023. "Ultrafast Microfluidic PCR Thermocycler for Nucleic Acid Amplification" Micromachines 14, no. 3: 658. https://doi.org/10.3390/mi14030658