
Energy Prediction Models and Distributed Analysis of the Grinding Process of Sustainable Manufacturing

1
School of Mechanical Engineering, Shandong University of Technology, Zibo 255049, China
2
Department of Planning and Finance, Shandong University of Technology, Zibo 255049, China
*
Author to whom correspondence should be addressed.
Micromachines 2023, 14(8), 1603; https://doi.org/10.3390/mi14081603
Submission received: 16 July 2023
/
Revised: 8 August 2023
/
Accepted: 11 August 2023
/
Published: 14 August 2023
(This article belongs to the Special Issue Intelligent Precision Machining)
Abstract
:Grinding is a critical surface-finishing process in the manufacturing industry. One of the challenging problems is that the specific grinding energy is greater than in ordinary procedures, while energy efficiency is lower. However, an integrated energy model and analysis of energy distribution during grinding is still lacking. To bridge this gap, the grinding time history is first built to describe the cyclic movement during air-cuttings, feedings, and cuttings. Steady and transient power features during high-speed rotations along the spindle and repeated intermittent feeding movements along the x-, y-, and z-axes are also analysed. Energy prediction models, which include specific movement stages such as cutting-in, stable cutting, and cutting-out along the spindle, as well as infeed and turning along the three infeed axes, are then established. To investigate model parameters, 10 experimental groups were analysed using the Gauss-Newton gradient method. Four testing trials demonstrate that the accuracy of the suggested model is acceptable, with errors of 5%. Energy efficiency and energy distributions for various components and motion stages are also analysed. Low-power chip design, lightweight worktable utilization, and minimal lubricant quantities are advised. Furthermore, it is an excellent choice for optimizing grinding parameters in current equipment.
1. Introduction
As the engine of economic growth, the manufacturing industry has greatly promoted economic development [1]. However, a series of worldwide environmental problems, e.g., energy shortage and carbon emissions, have resulted [1,2]. According to the International Energy Agency’s report, manufacturing activities account for 17% of global energy consumption and 37% of carbon emissions [3]. There is therefore widespread need to reduce energy and carbon emissions in manufacturing [4]. As the heart of the manufacturing industry, machine tools are the largest contributor to environmental pollution [5] and have great energy-saving potential [6]. Numerous studies have addressed energy characteristics and improvement strategies in various machining processes [7]. Lower energy efficiency—less than 30%—has been identified as the primary cause of the huge waste of energy during machining [8]. Therefore, energy efficiency improvement based on energy modelling and distributed analysis not only merits theoretical research but also has strong practical significance [9].
Liu et al. [10] used spindle speed and input power to measure real-time energy efficiency flow in the spindle system of machine tools without using force measurement equipment. Lv et al. [11] built the acceleration energy model using the principle of spindle mechanical transmission and motor control. Energy was evaluated on the key component level but not on the system level. Energy characteristics and their modelling become complicated with more motion stages and subsystems. Zhou et al. [6] divided the existing system-based energy models of machine tools into three categories: material removal rate, detailed parameter type, and machining process. Zhao et al. [12] proposed predictive energy methods of the process, machine, and system levels based on the power demand of sub-components in different machining states. Lv et al. [13] developed power models of four machining motions: basic, auxiliary, air-cutting, and material removal; however, their versatility is limited.
Shang et al. [14] proposed a generic power model for heavy-duty machine tools for system, framework, and detailed sub-components. Liu et al. [15] presented a generalized method for modelling the inherent energy performance. Power and energy models were built based on a steady process, although this process consumed a larger proportion of energy [16]. Avram et al. [17] developed an energy model to estimate the mechanical energy requirements of different parts of both stable and transient states. Liu et al. [18] proposed a dynamic energy model based on bond graph theory. However, these transient models are system-dependent. Duflou et al. [19] introduced energy-efficient decision-making technologies for energy saving from a unit process focus: multi-machine, factory, multi-facility, and supply chain levels. The energy evaluation results and saving strategies were process- and system-dependent. Similarly, Schudeleit et al. [20] tested the energy efficiency of machine tools using four common methods: reference sample method, reference process method, specific energy consumption method, and component reference method. However, it is difficult to design a set of recognized process standards for reference process methods because different processes may lead to completely different evaluation results. More specifically, energy models for certain machining technologies have been studied.
Commonly used machining methods involve turning, milling, drilling, grinding, and polishing [21,22,23]. Lv et al. [24] compared the prediction accuracy of three models of material removal power during turning, including the specific energy, cutting force, and exponential function method. Yip et al. [25] proposed a modified energy model for ultra-precision diamond cutting where the material recovery effect is considered. Shi et al. [26] introduced an improved cutting power and energy model for milling. Shin et al. [27] proposed a component-based energy modelling methodology for real-time control of milling progress. Four-step procedures were used: data extraction, data pre-processing, context synchronization, and regression modelling. Jia et al. [28] proposed a detailed energy model of the drilling process; power characteristics of all sub-components were considered. Xiao et al. [29] developed a multi-component energy model for dry gear.
Compared with turning, milling, and drilling processes, research on energy models and distribution analyses of grinding and polishing processes are still rare. Compared with grinding, polishing is generally employed after basic cutting processes. Although it is an energy-intensive machining process, surface integrity is the most important process goal. Moreover, many polishing methods are based on energy fields, e.g., submerged pulsating air jet polishing process [30] or long machining time-dependent process [31]. Therefore, energy studies of grinding are more practical [32]. However, the complex material removal mechanism and running process make energy assessment and analysis difficult [33,34]. Dogra et al. [35] comprehensively reviewed the energy-saving and environmental protection method of surface grinding. Wang et al. [36] established production costs, productivity, and CO2 emission models for grinding. The energy was considered when evaluating CO2 emissions. Deng et al. [37] built a model for energy and carbon efficiency of the wheel spindle using the genetic algorithm. The specific grinding energy and material removal energy of the spindle has been well-modelled [38,39]. In our previous studies, both total and active energies of the spindle were analysed and optimized using machine learning and genetic algorithms [40,41,42]. However, repeated and intermittent infeed movements and high-speed approaching stages consume a large portion of energy and their influence on grinding energy cannot be ignored. Additionally, power laws and time histories for x-, y-, and z-infeed are complex and different. Therefore, an integrated energy model for grinding was built, including all infeed motions and wheel rotation up, down, approaching, and material removal states. Distributed analysis and discussions of grinding energy characteristics were obtained to help managers formulate reasonable optimization schemes for energy-efficient manufacturing.
2. Integrated Energy Prediction Model
2.1. Energy Flow Analysis during Grinding
Material removal during grinding needs multi-joint motions, except electric controlling and cooling, e.g., wheel rotation along the spindle, and x-, y-, and z-infeed along the x-, y-, and z-axes, respectively. The structure and multi-joint motions of the grinder and energy flow are shown in Figure 1.
Electric controlling components, e.g., lights, chips, and fans start when the power comes on. The cooling system remains automatically open until machining starts. The energy for cooling is consumed by pumps, cooling motors, and air compressors. After standby, the cooling time history runs through the whole machining process. Meanwhile, the rotation and infeed movement start along the spindle and x-axis, respectively. The energy consumption mechanism of the wheel rotation is different in both idle (also called approaching and air cutting) and material removal periods. The x-infeed is driven to move in left and right reciprocating motions. Infeed movement along the z-axis occurs at the end of air cutting in the left and right directions. After a grinding run is complete, the y-infeed starts to drive the wheel to move down a depth of cut. The total energy model can be expressed using Equation (1).
where Ee, Ec, Es, Ex, Ey, and Ez represent the energy consumed on the electric controller, cooling system, wheel rotation, x-infeed, y-infeed, and z-infeed, respectively.
2.2. Energy Modelling of Wheel Air Cutting Rotation and Material Removal
The flow of power of the wheel over time is depicted in Figure 2. Power waves varied periodically. The wave shapes and sizes are determined by the relative locations between the wheel and the workpiece. Two parts are divided into idle motion (also called approaching and air cutting) power and material removal power. The former is associated with rolling friction loss and high-speed rotation of the grinding wheel. Approaching stages are combined in two locations: front and back in position 1 and left and right in position 2. A linear functional relationship with wheel speed is employed to model the approaching power:
where vs is wheel speed and Asa and Bsa are undetermined coefficients that are associated with wheel motor performance.
The front–back and left–right approaching times during the grinding stroke are computed using Equations (3) and (4), respectively.
where a and b are the front–back and left–right grinding gaps, respectively, L is workpiece length, w is grinding width, and vw is workpiece infeed speed.
Energy in two approaching stages is calculated using Equations (5) and (6).
where mz is infeed times along the z-axis during a grinding stroke and nz is the number of grinding strokes.
where d is the total material removal depth, ap is the depth of cut, and W is the workpiece width.
The material removal power is divided into three stages: cutting-in in position 3, stable cutting in position 4, and cutting-out in position 5. In position 3, the grinding wheel gradually cuts into the workpiece, which increases the material removal rate. The gradual cutting-in leads to a linear increase in spindle power, like the 3rd identifier in Figure 2a. A linear function with time in Equation (9) is employed to depict the cutting-in power.
Aci and Bci are the linear shape coefficient and slope and intercept, respectively.
tci is the time history in the cutting-in stage.
R is the radius of a grinding wheel.
The cutting-in energy is obtained using Equation (12).
The steady material removal power in position 4 is calculated using Equation (13). It is deduced using the empirical grinding force calculation
where λ, α, β, and χ are equation coefficients associated with grinding wheel conditions and workpiece properties.
Time history and energy during stable cutting are expressed using Equations (14) and (15), respectively.
The material removal rate gradually decreases in the cutting-out stage like position 6. In this stage, power is expressed by a linear function that also takes time into account.
Aco and Bco are the linear shape coefficient and slope and intercept, respectively.
tco is time history during the cutting-out stage.
The cutting-out energy is calculated using Equation (19).
The energy consumed during the material removal stage is the sum of cutting-in, cutting, and cutting-out energy. The energy model of the spindle is built as the sum of approaching and material removal energy.
2.3. Energy Modelling of x-Infeed
The power waves and relative positions along the x-axis are shown in Figure 3. The x-infeed motion is divided into three stages: acceleration like position 1, constant infeed like position 2, and deceleration like position 3. The maximum power during x-acceleration is associated with the starting characteristics of the x-motor. The cubic function model in Equation (22) is established with workpiece infeed speed as the independent variable.
where η, ξ, ψ, and ω are function coefficients.
The constant infeed power along the x-axis is a quadratic function of workpiece infeed speed, as shown in Equation (23).
where Ax, Bx, and Cx are coefficients determined by properties of motor drivers and workbench friction.
The duration of the constant infeed stage is obtained using Equation (24).
where tgx is the gravity acceleration and deceleration time.
The energy consumed by movement along the x-axis is calculated as follows:
2.4. Energy Modelling of y- and z-Infeed
The y-infeed motion is a kind of intermittent feed motion of the grinding wheel along the up and down directions. The y-infeed power, Py, is regarded as a constant for a certain grinder. The energy model of the y-infeed is expressed using Equation (26).
where Py is y-infeed power and ty is y-infeed time. mz is calculated using Equation (7).
Similarly, the energy model of the z-infeed is established using Equation (27).
where Pz and tz are z-infeed power and time, respectively. nz is calculated using Equation (8).
2.5. Energy Modelling of the Electric Controller and Cooling System
Electric controlling and cooling powers are modelled as constants in the grinding process; both extend along the whole machining process. The energy models of the electrical and coolant systems are described by Equations (28) and (30), respectively.
where Pe is electric controlling power and ttotal is the total time from start-up to shut down.
te is the waiting time for the electric control system.
Pc is the cooling power and tc is the cooling process time.
3. Parameters for Grinding Energy Models
3.1. Grinding Experiment Setup
Grinding experiments are performed on a three-axis precision grinder (SMART-B818III). The volume of the ceramic composite workpiece (SiO2f/SiO2) is 50 mm × 50 mm × 25 mm. A diamond grinding wheel with a radius of 100 mm and a width of 10 mm is employed. For the installed wheel, spindle rotating speeds were 10.46 m/s–73.26 m/s (spindle rotating speeds for the grinder were 1000 r/min–7000 r/min). The workpiece infeed speed is best kept within 25 m/min. A water-based hybrid liquid is used for cooling purposes. Grinding parameter settings for this kind of material and wheel, workpiece infeed speed, depth of cut, and wheel speed were investigated in our previous study [43]. The grinding parameters for the three-factor and four-level experimental design are set out in Table 1.
The power for each moving component is measured by the portable power monitoring system. It consists of a power meter (PPC-3), a data acquisition system (NI 9174 and NI 9203), and an analytical tool built in LabVIEW; the hardware structure is shown in Figure 4. PPC-3 has three voltage and current sensors that are connected to the three-phase outputs of the measured system. The response time for PPC-3 is 0.15 s. NI 9203 is used to transfer the analogue power to the digital current signal, which is reverted to the analytical tool.
3.2. Experimental Results
The PPC-3 is first connected to the three-phase outputs of the air circuit breaker of the grinder power supply. The stable power is measured after CNC controller start-up. The cooling system and the y- and z-infeed are then opened to record the cooling power, y-infeed power, and z-infeed power, respectively. These steps are repeated five times under different operating conditions. Average power is recorded as Pe, Pc, Py, and Pz, which are summarized in Table 2. The infeed time along the y-axis, ty, and the z-axis, tz, are 0.6 s and 0.3 s, respectively. The gravity acceleration and deceleration time along the x-axis, tgx, is 0.05 s.
Figure 5a–c shows power curves of wheel rotations corresponding to three stages: start-up, approaching, and material removal. Because the wheel starts once at the short beginning of continuous grinding, the power and energy consumed during the start-up stage are ignored. The variation in power is verified in the former analysis, which has been fully considered.
The power distribution curve of the x-infeed is depicted in Figure 5d–f. Infeed power is the same during the approaching and material removal stages because of the heavy worktable. Power variation in the x-infeed is considered in the modelling section. The energy model was proven to be credible. A total of 10 groups of grinding experiments are designed at 3 factors and 4 levels of vs, vw, and ap. Table 3 shows the grinding parameters and experimental values of wheel rotation power during approaching and material removal stages, as well as x-infeed and x-acceleration power along the x-axis.
3.3. Parameter Studies and Model Verification
Based on the energy models in Section 2, the approaching power of wheel rotation, Psa, is associated with the unique grinding parameter, vs. The experimental results in No.1–No.4 are used to obtain the model coefficients, Asa and Bsa. A Gauss-Newton gradient method is employed to calculate Asa and Bsa using the reverse gradient. A total of 200 iterations are set. Similarly, the x-infeed power and x-acceleration power are associated with workpiece infeed speed. vw. η, ξ, Ψ, ω in Equation (22) and Ax, Bx, Cx in Equation (23) are obtained from the fourth to the eighth experimental groups. All 10 experimental groups are required to solve four model parameters for the stable cutting power, Psm. The coefficients Psa, Psm, Pxm, and Px in power models are summarized in Table 4.
Another four testing sets are used to verify the accuracy of the energy models. Grinding parameters are stochastically selected for their design requirements. Measured and predicted results are compared in Table 5 and Figure 6. The total forecasting errors of the power models for wheel rotation and x-infeed are estimated within 5%; only one relative error, in the 13th group, reached 4.04%. Excellent prediction accuracy shows that the established grinding energy models are acceptable.
4. Energy Distribution Analysis and Discussion
4.1. Energy Distribution Analysis and Discussion of Different Components
Energy values of each component from the No.11 to the No.14 verification groups are summarized in Table 6. Energy distributions of the electric controlling system, cooling system, wheel rotation, x-infeed, y-infeed, and z-infeed are shown in Figure 7. The results show that the electrical controller consumes most of the energy during grinding—over 83%; the next consumer is the cooling process (about 11–12%). Moreover, they vary less with grinding parameters. Therefore, the next generation of grinding tool designs should focus on energy-saving chips and cooling pumps. An improved coolant technique, such as dry grinding or minimal quantities of lubricants, is a good choice. Grinding parameters have little influence on total energy distribution but they work on the energy distribution of the motion system, as shown in Figure 7b.
Figure 7b shows larger energy proportions along the spindle wheel and x-axis. Grinding parameters have larger effects on energy distribution; workpiece infeed speed was the most influential variable. A higher speed is desirable for both energy saving and process efficiency improvements. The y-infeed and z-infeed—and particularly the y-infeed—have low energy distributions, i.e., low energy (2.256 J, 0.003% of the total energy) is consumed.
4.2. Energy Distribution Analysis and Discussion of Wheel Spindle in Different Machining Stages
Figure 8 depicts the energy consumed by the spindle wheel at different machining stages. Detailed energy consumption along the spindle is summarized in Table 7. The energy and its ratios in front–back approaching, left–right approaching, cutting-in, cutting-out, and stable cutting are analysed.
Figure 8 shows that the stable cutting stage consumes the highest proportion of total energy; longer material removal time contributes to this. The last group of grinding parameters is suggested. The energy ratio in the idle 2 stages is relatively large compared with that in the idle 1 stage. The time in left–right approaching increases significantly due to repeated intermittent feeding. Smaller grinding gaps and bigger grinding widths help reduce energy in approaching stages.
4.3. Energy Efficiency Analysis and Improvement Strategies
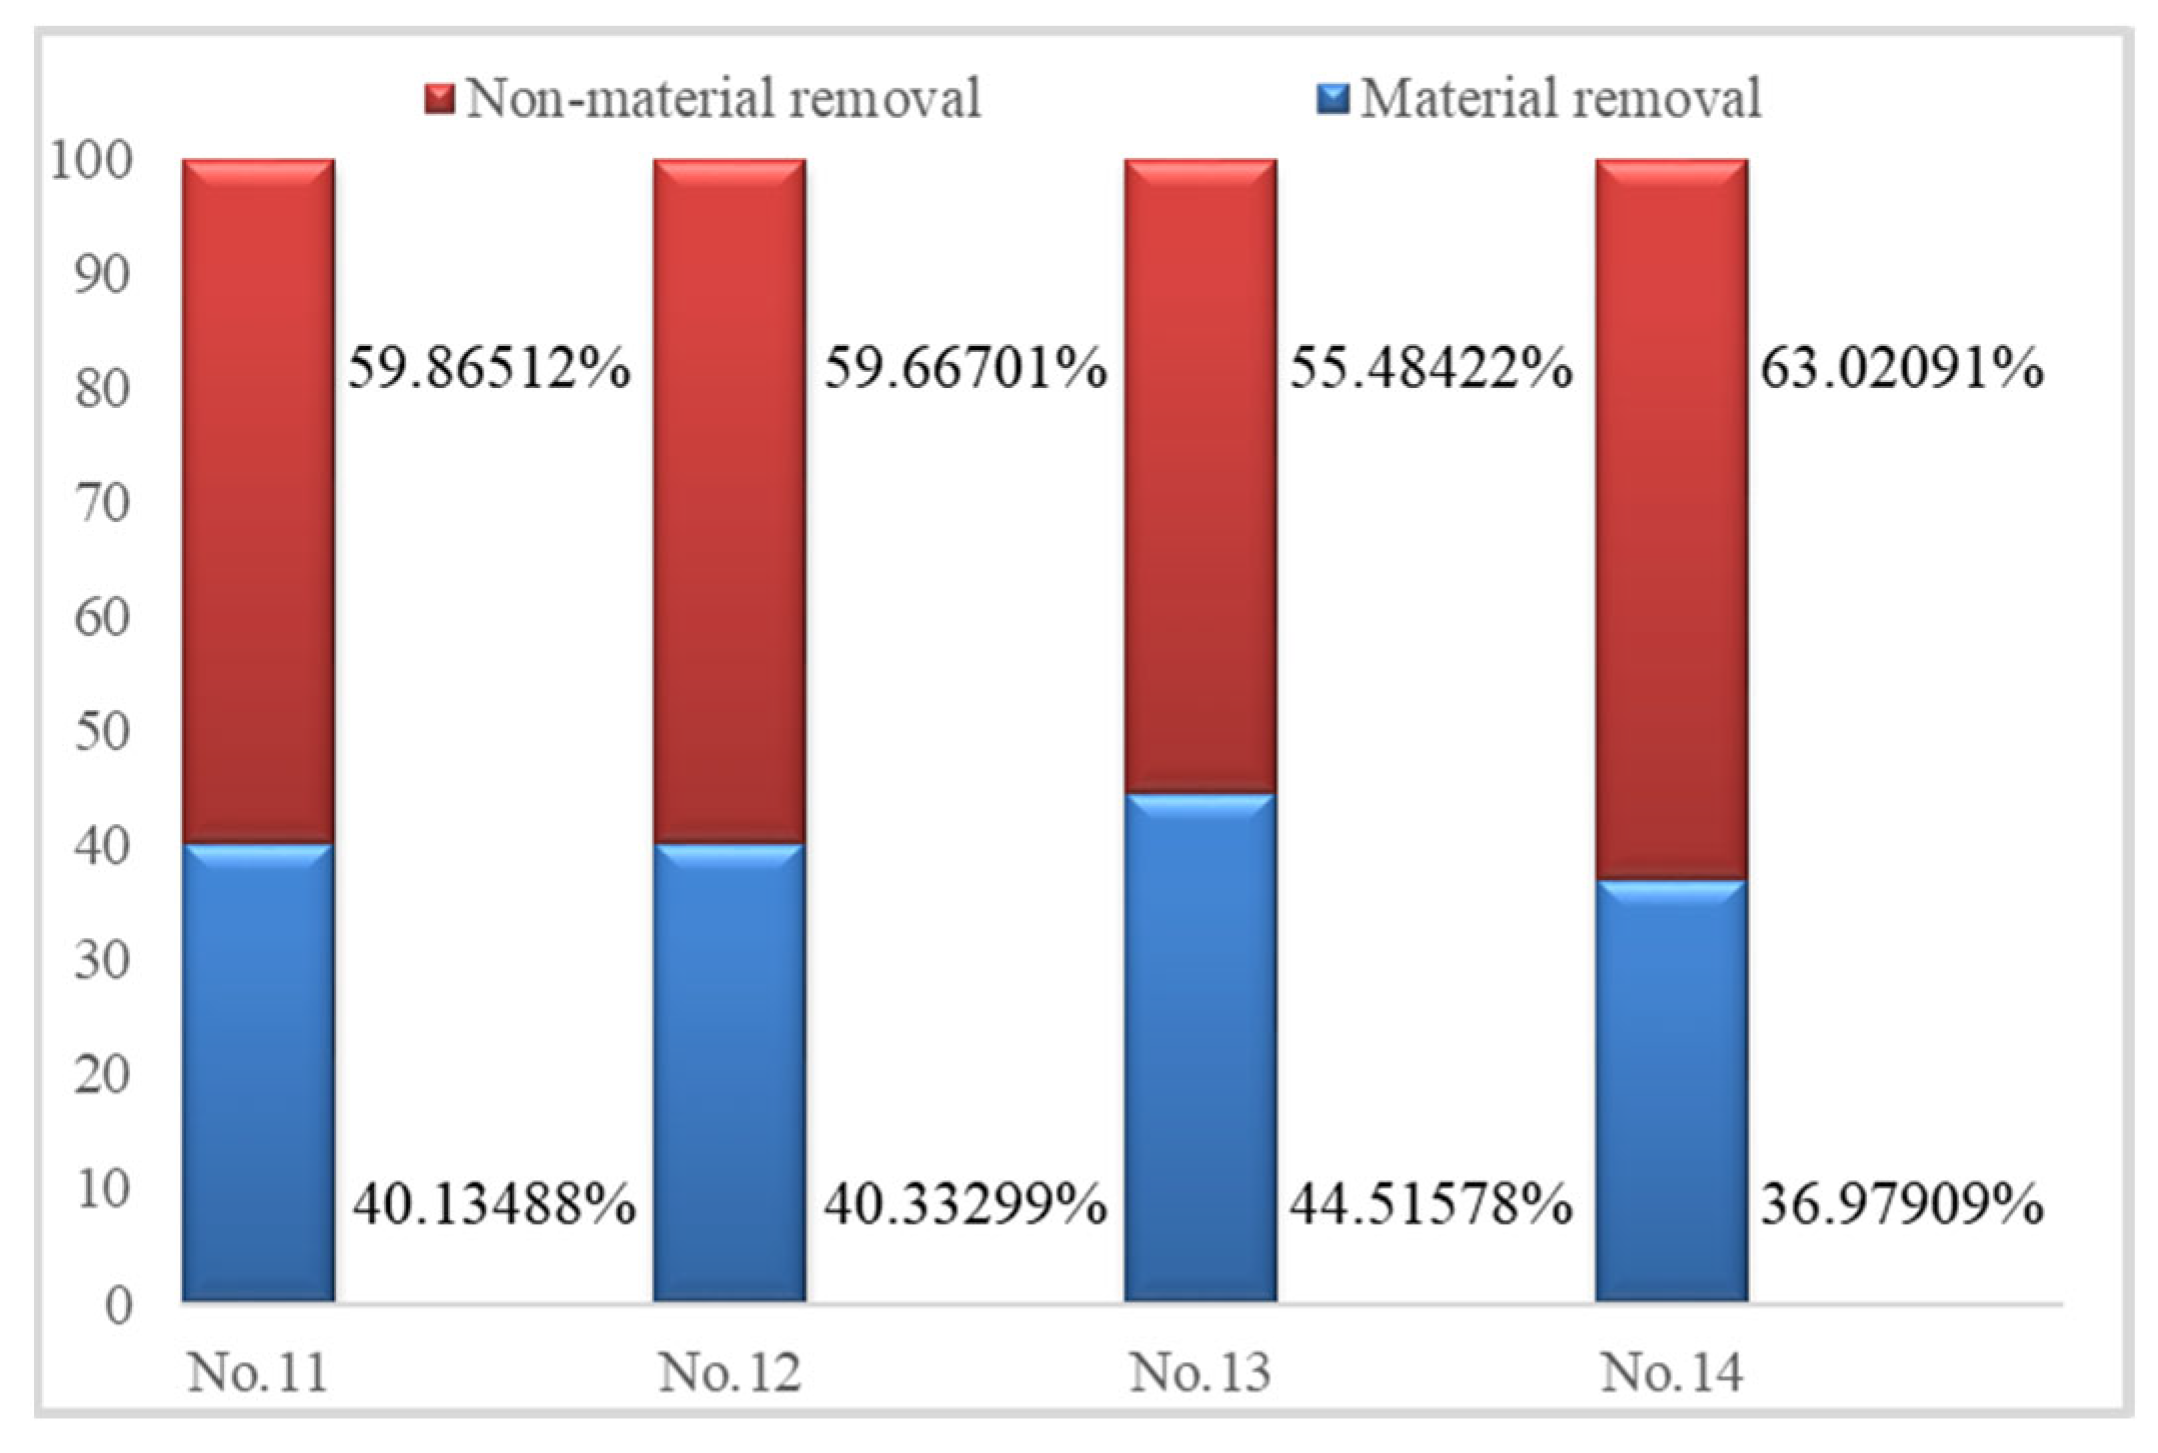
Energy efficiency is an important optimization objective for CNC machining tools. The proportion of material removal energy is defined as the energy efficiency of grinding problems. Energy prediction results for both stages are shown in Table 8 and the energy ratios are shown in Figure 9.
Figure 9 shows that energy efficiency reaches 36–45%, rising to the general level of mechanical processing (30%). Compared with the results of our previous analysis [40], energy efficiency is improved because the number of grinding strokes is four and not two. Additionally, grinding parameters, particularly for the workpiece infeed speed, have an obvious influence on energy efficiency. A detailed analysis of the optimization of grinding parameters to improve energy efficiency is required in future studies.
5. Conclusions
The energy flow process was analysed to distinguish complicated energy characteristics during grinding based on the infeed and material removal grinding paths. An integrated energy model for the whole grinding process, especially the spindle and x-axis systems, was established. Detailed approaching, cutting-in, stable, cutting-out, feeding, and turning stages were described. A total of 14 grinding experiments were designed to study model parameters and verify model accuracy. Energy distribution and efficiency analyses were then performed for new grinder designs and parameter settings. The conclusions are summarized as follows:
- (1)
- Predicted power and energy errors compared with measured values were kept within 5%. The integrated energy model is regarded as acceptable for further energy distribution and efficiency analysis.
- (2)
- More than 90% of electrical energy is wasted on two auxiliary systems: electrical controlling and cooling. Energy-saving chips, lightweight worktable utilization, and minimal lubricant quantity techniques are recommended in the next-generation design of grinders.
- (3)
- Grinding parameters have a larger effect on the energy distribution of both the spindle and the x-axis system. A larger workpiece infeed speed is desired to improve both energy-saving and process efficiency.
- (4)
- Energy efficiency reaches 36–45% (over a general level in machining) due to more grinding strokes; it may increase grinding time. A novel balance between energy efficiency, process time, and surface quality should be studied in depth.
There are three limitations to this study. First, the plane grinding process, for example, was thoroughly examined to analyse its energy flow and evaluate energy distribution. Second, stable power characteristics were well examined, while transient situations such as spindle motor start-up, cutting in up-grinding and down-grinding processes, and sparkless grinding were ignored. Despite the low energy efficiency, these transient energy components are valuable for integrated performance improvement of grinding tools. Third, only lower spindle speed was analysed in this study. The power curves of the spindle wheel may differ when idle power is set to medium or high speeds. Thus, it will be critical in the future to examine dynamic and detailed grinding energy flow during other grinding methods, particularly free-form surface grinding.
6. Patents
There is a patent resulting from the work reported in this manuscript: a method for evaluating energy efficiency of surface grinding (China, 2022102335044.7).
Author Contributions
Conceptualization, Y.T. and X.H.; Data curation, Y.T.; Formal analysis, Y.T. and X.H.; Funding acquisition, Y.T.; Investigation, J.W. (Jinling Wang) and X.H.; Methodology, Y.T.; Project administration, Y.T.; Resources, Y.T.; Software, J.W. (Jinling Wang) and X.H.; Supervision, Y.T.; Validation, Y.T., J.W. (Jinling Wang), X.H., J.H. and J.W. (Jinhui Wang); Visualization, X.S.; Writing—original draft, Y.T., J.W. (Jinling Wang) and X.H.; Writing—review and editing, Y.T., J.W. (Jinling Wang), X.S. and J.H. All authors have read and agreed to the published version of the manuscript.
Funding
This work was funded by the National Natural Science Foundation of China (No. 51875329), Taishan Scholar Special Foundation of Shandong Province (No. tsqn201812064), Scientific Innovation Project for Young Scientists in Shandong Provincial Universities (No. 2019KJB030), Natural Science Foundation of Shandong Province (ZR2023ME112), and Innovation Capacity Improvement Program for High-tech SMEs of Shandong Province (No. 2022TSGC1333 and 2022TSGC1261).
Data Availability Statement
Not applicable.
Conflicts of Interest
The authors declare no conflict of interest.
References
- Yang, M.; Wang, E.Z.; Hou, Y. The relationship between manufacturing growth and CO2 emissions: Does renewable energy consumption matter? Energy 2021, 232, 121032. [Google Scholar] [CrossRef]
- Cosgrove, J.; Duarte, M.-J.R.; Littlewood, J.; Wilgeroth, P. An energy mapping methodology to reduce energy consumption in manufacturing operations. Proc. Inst. Mech. Eng. Part B-J. Eng. Manuf. 2018, 232, 1731–1740. [Google Scholar] [CrossRef]
- Park, C.W.; Kwon, K.S.; Kim, W.B.; Min, B.-K.; Park, S.-J.; Sung, I.-H.; Yoon, Y.S.; Lee, K.-S.; Lee, O.-H.; Seok, J. Energy consumption reduction technology in manufacturing—A selective review of policies, standards, and research. Int. J. Precis. Eng. Manuf. 2009, 10, 151–173. [Google Scholar] [CrossRef]
- Moradnazhad, M.; Unver, H.O. Energy efficiency of machining operations: A review. Proc. Inst. Mech. Eng. Part B-J. Eng. Manuf. 2017, 231, 1871–1889. [Google Scholar] [CrossRef]
- Camposeco-Gegrete, C.; Calderon-Najera, J.D.D. Sustainable machining as a mean of reducing the environmental impacts related to the energy consumption of the machine tool: A case study of AISI 1045 steel machining. Int. J. Adv. Manuf. Technol. 2019, 102, 27–41. [Google Scholar] [CrossRef]
- Zhou, L.; Li, J.; Li, F.; Meng, Q.; Li, J.; Xu, X. Energy consumption model and energy efficiency of machine tools: A comprehensive literature review. J. Clean. Prod. 2016, 112, 3721–3734. [Google Scholar] [CrossRef]
- Babe, I.B.; Gupta, K.; Chaubey, S.K. Sustainable dry machining of stainless steel with microwave-treated tungsten carbide cutting tools. Micromachines 2023, 14, 1148. [Google Scholar] [CrossRef] [PubMed]
- Tuo, J.; Liu, F.; Liu, P.; Zhang, H.; Cai, W. Energy efficiency evaluation for machining systems through virtual part. Energy 2018, 159, 172–183. [Google Scholar] [CrossRef]
- Li, L.; Zhang, B.; Sun, Z. Research report on green and low-carbon development of superhard material industry. Diam. Abras. Eng. 2023, 43, 10–13. [Google Scholar]
- Liu, P.; Liu, F.; Qiu, H. A novel approach for acquiring the real-time energy efficiency of machine tools. Energy 2017, 121, 524–532. [Google Scholar] [CrossRef]
- Lv, J.; Tang, R.; Tang, W.; Liu, Y.; Zhang, Y.; Jia, S. An investigation into reducing the spindle acceleration energy consumption of machine tools. J. Clean. Prod. 2017, 143, 794–803. [Google Scholar] [CrossRef] [Green Version]
- Zhao, G.; Liu, Z.; He, Y.; Cao, H.; Guo, Y. Energy consumption in machining: Classification, prediction, and reduction strategy. Energy 2017, 133, 142–157. [Google Scholar] [CrossRef]
- Lv, J.; Tang, R.; Jia, S.; Liu, Y. Experimental study on energy consumption of computer numerical control machine tools. J. Clean. Prod. 2016, 112, 3864–3874. [Google Scholar] [CrossRef] [Green Version]
- Shang, Z.; Gao, D.; Jiang, Z.; Lu, Y. Towards less energy intensive heavy-duty machine tools: Power consumption characteristics and energy-saving strategies. Energy 2019, 178, 263–276. [Google Scholar] [CrossRef]
- Liu, P.; Zhang, Z.; Wang, X.; Li, X.; Wang, X.V.; Tuo, J. A generalized method for the inherent energy performance modeling of machine tools. J. Manuf. Syst. 2021, 61, 406–422. [Google Scholar] [CrossRef]
- Feng, C.; Huang, Y.; Wu, Y.; Zhang, J. Feature-based optimization method integrating sequencing and cutting parameters for minimizing energy consumption of CNC machine tools. Int. J. Adv. Manuf. Technol. 2022, 121, 503–515. [Google Scholar] [CrossRef]
- Avram, O.I.; Xirouchakis, P. Evaluating the use phase energy requirements of a machine tool system. J. Clean. Prod. 2011, 19, 699–711. [Google Scholar] [CrossRef]
- Liu, W.; Li, L.; Cai, W.; Li, C.; Li, L.; Chen, X.; Sutherland, J.W. Dynamic characteristics and energy consumption modelling of machine tools based on bond graph theory. Energy 2020, 212, 118767. [Google Scholar] [CrossRef]
- Duflou, J.R.; Sutherland, J.W.; Dornfeld, D.; Herrmann, C.; Jeswiet, J.; Kara, S.; Hauschild, M.Z.; Kellens, K. Towards energy and resource efficient manufacturing: A processes and systems approach. CIRP Ann.-Manuf. Technol. 2012, 61, 587–609. [Google Scholar] [CrossRef] [Green Version]
- Schudeleit, T.; Züst, S.; Wegener, K. Methods for evaluation of energy efficiency of machine tools. Energy 2015, 93, 196470. [Google Scholar] [CrossRef]
- Li, G.; Ding, S. Machining of medical device components. In Metallic Biomaterials Processing and Medical Device Manufacturing; Woodhead Publishing: Sawston, UK, 2020; pp. 137–157. [Google Scholar]
- Li, J.L.R.A. A review on machining and optimization of particle-reinforced metal matrix composites. Int. J. Adv. Manuf. Technol. 2019, 100, 2929–2943. [Google Scholar] [CrossRef]
- Jia, S.; Yuan, Q.; Cai, W.; Li, M.; Li, Z. Energy modeling method of machine-operator system for sustainable machining. Energy Convers. Manag. 2018, 172, 265–276. [Google Scholar] [CrossRef]
- Lv, J.; Tang, R.; Tang, W.; Jia, S.; Liu, Y.; Cao, Y. An investigation into methods for predicting material removal energy consumption in turning. J. Clean. Prod. 2018, 193, 128–139. [Google Scholar] [CrossRef] [Green Version]
- Yip, W.; To, S. Energy consumption modeling of ultra-precision machining and the experimental validation. Energy 2020, 196, 117018. [Google Scholar] [CrossRef]
- Shi, K.; Ren, J.; Wang, S.; Liu, N.; Liu, Z.; Zhang, D.; Lu, W. An improved cutting power-based model for evaluating total energy consumption in general end milling process. J. Clean. Prod. 2019, 231, 1330–1341. [Google Scholar] [CrossRef]
- Shin, S.; Woo, J.; Rachuri, S. Energy efficiency of milling machining: Component modeling and online optimization of cutting parameters. J. Clean. Prod. 2017, 161, 12–29. [Google Scholar] [CrossRef]
- Jia, S.; Cai, W.; Liu, C.; Zhang, Z.; Bai, S.; Wang, Q.; Li, S.; Hu, L. Energy modeling and visualization analysis method of drilling processes in the manufacturing industry. Energy 2021, 228, 120567. [Google Scholar] [CrossRef]
- Xiao, Q.; Li, C.; Tang, Y.; Pan, J.; Yu, J.; Chen, X. Multi-component energy modeling and optimization for sustainable dry gear hobbling. Energy 2019, 187, 115911. [Google Scholar] [CrossRef]
- Han, Y.; Liu, C.; Yu, M.; Jiang, L.; Zhu, W.; Qian, L.; Beaucamp, A. Material removal characteristics in submerged pulsating air jet polishing process. Int. J. Mech. Sci. 2023, 257, 108534. [Google Scholar] [CrossRef]
- Han, Y.; Zhu, W.L.; Zhang, L.; Beaucamp, A. Region adaptive scheduling for time-dependent processes with optimal use of machine dynamics. Int. J. Mach. Tools Manuf. 2020, 156, 103589. [Google Scholar] [CrossRef]
- Tian, Y.; Liu, F.; Wang, Y.; Wu, H. Development of portable power monitoring system and grinding analytical tool. J. Manuf. Process. 2017, 27, 188–197. [Google Scholar] [CrossRef]
- Wang, J.; Li, J.; Tian, Y.; Liu, Y.; Zhang, K. Methods of grinding power signal acquisition and dynamic power monitoring database establishment. Diam. Abras. Eng. 2022, 3, 356–363. [Google Scholar]
- Yoon, H.-S.; Kim, E.-S.; Kim, M.-S.; Lee, J.-Y.; Lee, G.-B.; Ahn, S.-H. Towards greener machine tools-A review on energy saving strategies and technologies. Renew. Sustain. Energy Rev. 2015, 48, 870–891. [Google Scholar] [CrossRef]
- Dogra, M.; Sharma, V.S.; Dureja, J.S.; Gill, S.S. Environment-friendly technological advancements to enhance the sustainability in surface grinding- A review. J. Clean. Prod. 2018, 197, 218–231. [Google Scholar] [CrossRef]
- Wang, Z.; Zhang, T.; Yu, T.; Zhao, J. Assessment and optimization of grinding process on AISI 1045 steel in terms of green manufacturing using orthogonal experimental design and grey relational analysis. J. Clean. Prod. 2020, 253, 119896. [Google Scholar] [CrossRef]
- Deng, Z.; Lv, L.; Li, S.; Wan, L.; Liu, W.; Yan, C.; Zhang, H. Study on the model of high efficiency and low carbon for grinding parameters optimization and its application. J. Clean. Prod. 2016, 137, 1672–1681. [Google Scholar] [CrossRef]
- Wu, W.; Li, C.; Yang, M.; Zhang, Y.; Jia, D.; Hou, Y.; Li, R.; Cao, H.; Han, Z. Specific energy and G ratio of grinding cemented carbide under different cooling and lubrication conditions. Int. J. Adv. Manuf. Technol. 2019, 105, 67–82. [Google Scholar] [CrossRef]
- Sinha, M.K.; Ghosh, S.; Paruchuri, V.R. Modelling of specific grinding energy for Inconel 718 superalloy. Proc. Inst. Mech. Eng. Part B-J. Eng. Manuf. 2017, 233, 443–460. [Google Scholar] [CrossRef]
- Wang, J.; Tian, Y.; Hu, X.; Li, Y.; Zhang, K.; Liu, Y. Predictive modelling and Pareto optimization for energy efficient grinding based on aANN-embedded NSGA II algorithm. J. Clean. Prod. 2021, 327, 129479. [Google Scholar] [CrossRef]
- Zhang, K.; Tian, Y.; Cong, J.; Liu, Y.; Yan, N.; Lu, T. Reduction grinding energy consumption by modified particle swarm optimization based on dynamic inertia weight. Diam. Abras. Eng. 2021, 41, 71–75. [Google Scholar]
- Wang, J.; Tian, Y.; Hu, X.; Han, J.; Liu, B. Integrated assessment and optimization of dual environmental and production objectives in grinding. Energy 2023, 272, 127046. [Google Scholar] [CrossRef]
- Zhang, K. Research on Intelligent Monitoring and Process Decision-Making Optimization of Grinding Power and Energy Consumption. Master’s Thesis, Shandong University of Technology, Zibo, China, 2021. [Google Scholar]
Figure 1.
Energy flow during grinding: (a) Structural composition of the grinder; (b) Energy flow across different machining stages and parts.
Figure 1.
Energy flow during grinding: (a) Structural composition of the grinder; (b) Energy flow across different machining stages and parts.
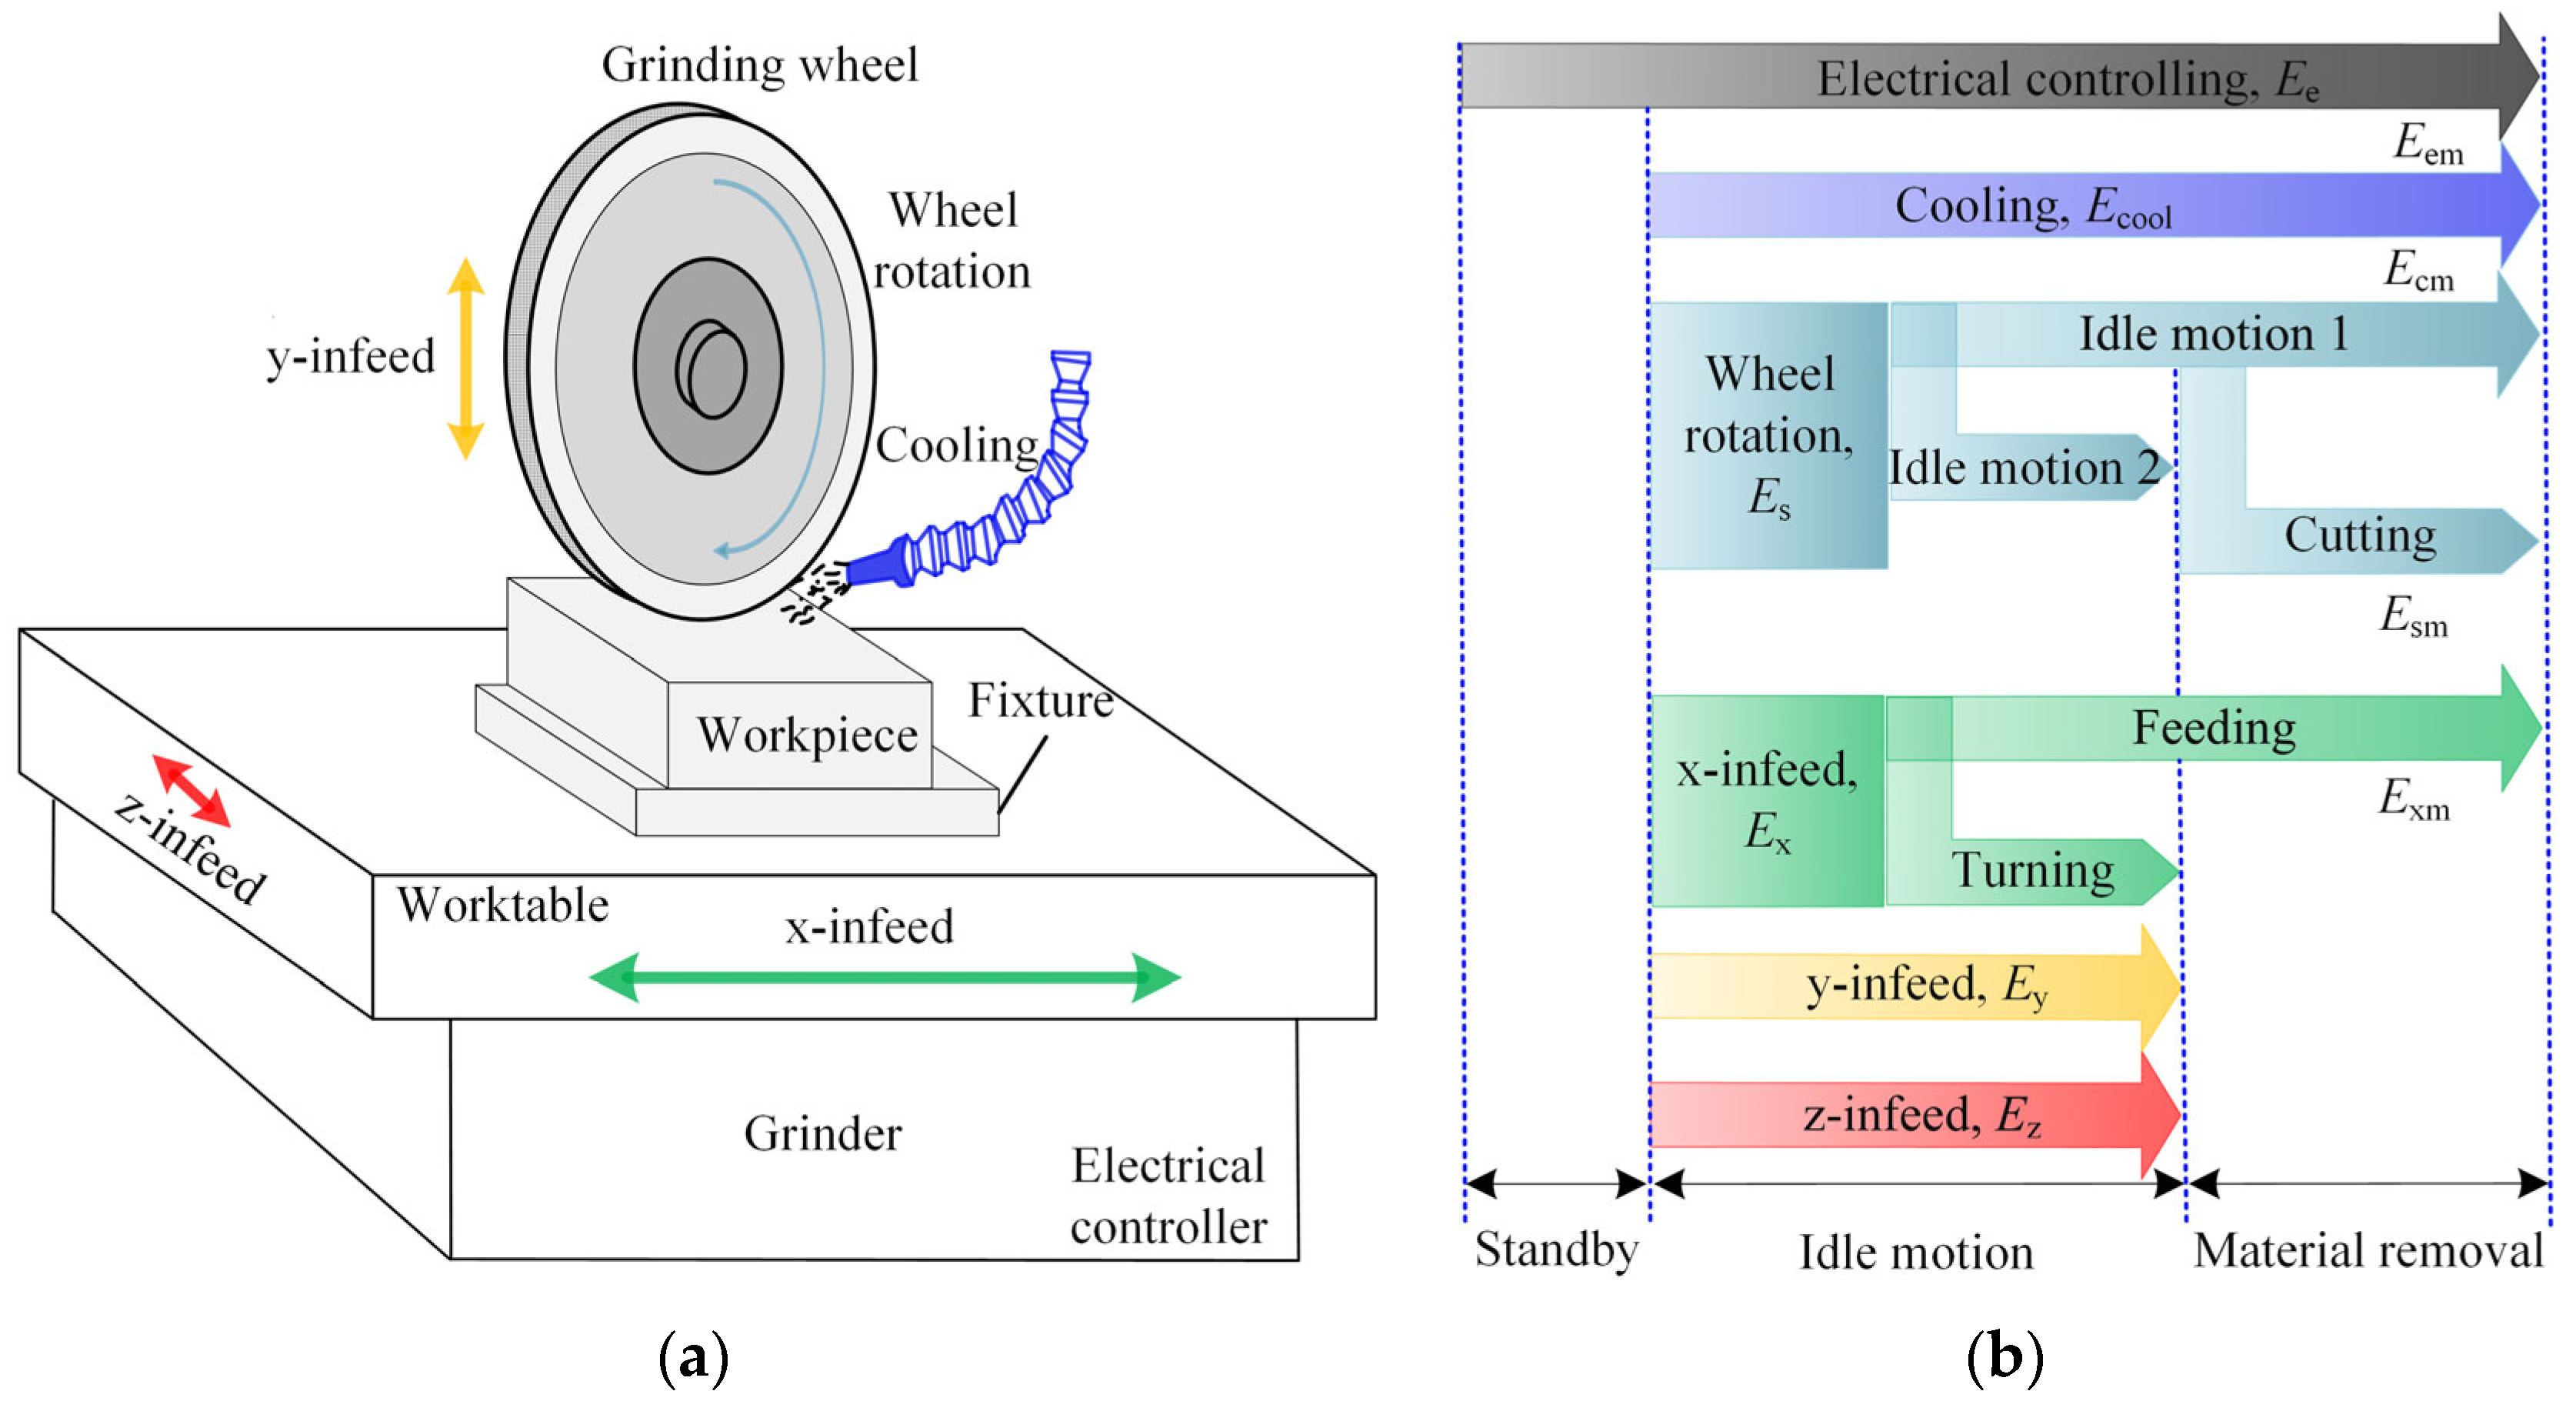
Figure 2.
Wheel rotation power during a grinding run: (a) Power variation over time; (b) Relative position between wheel and workpiece.
Figure 2.
Wheel rotation power during a grinding run: (a) Power variation over time; (b) Relative position between wheel and workpiece.
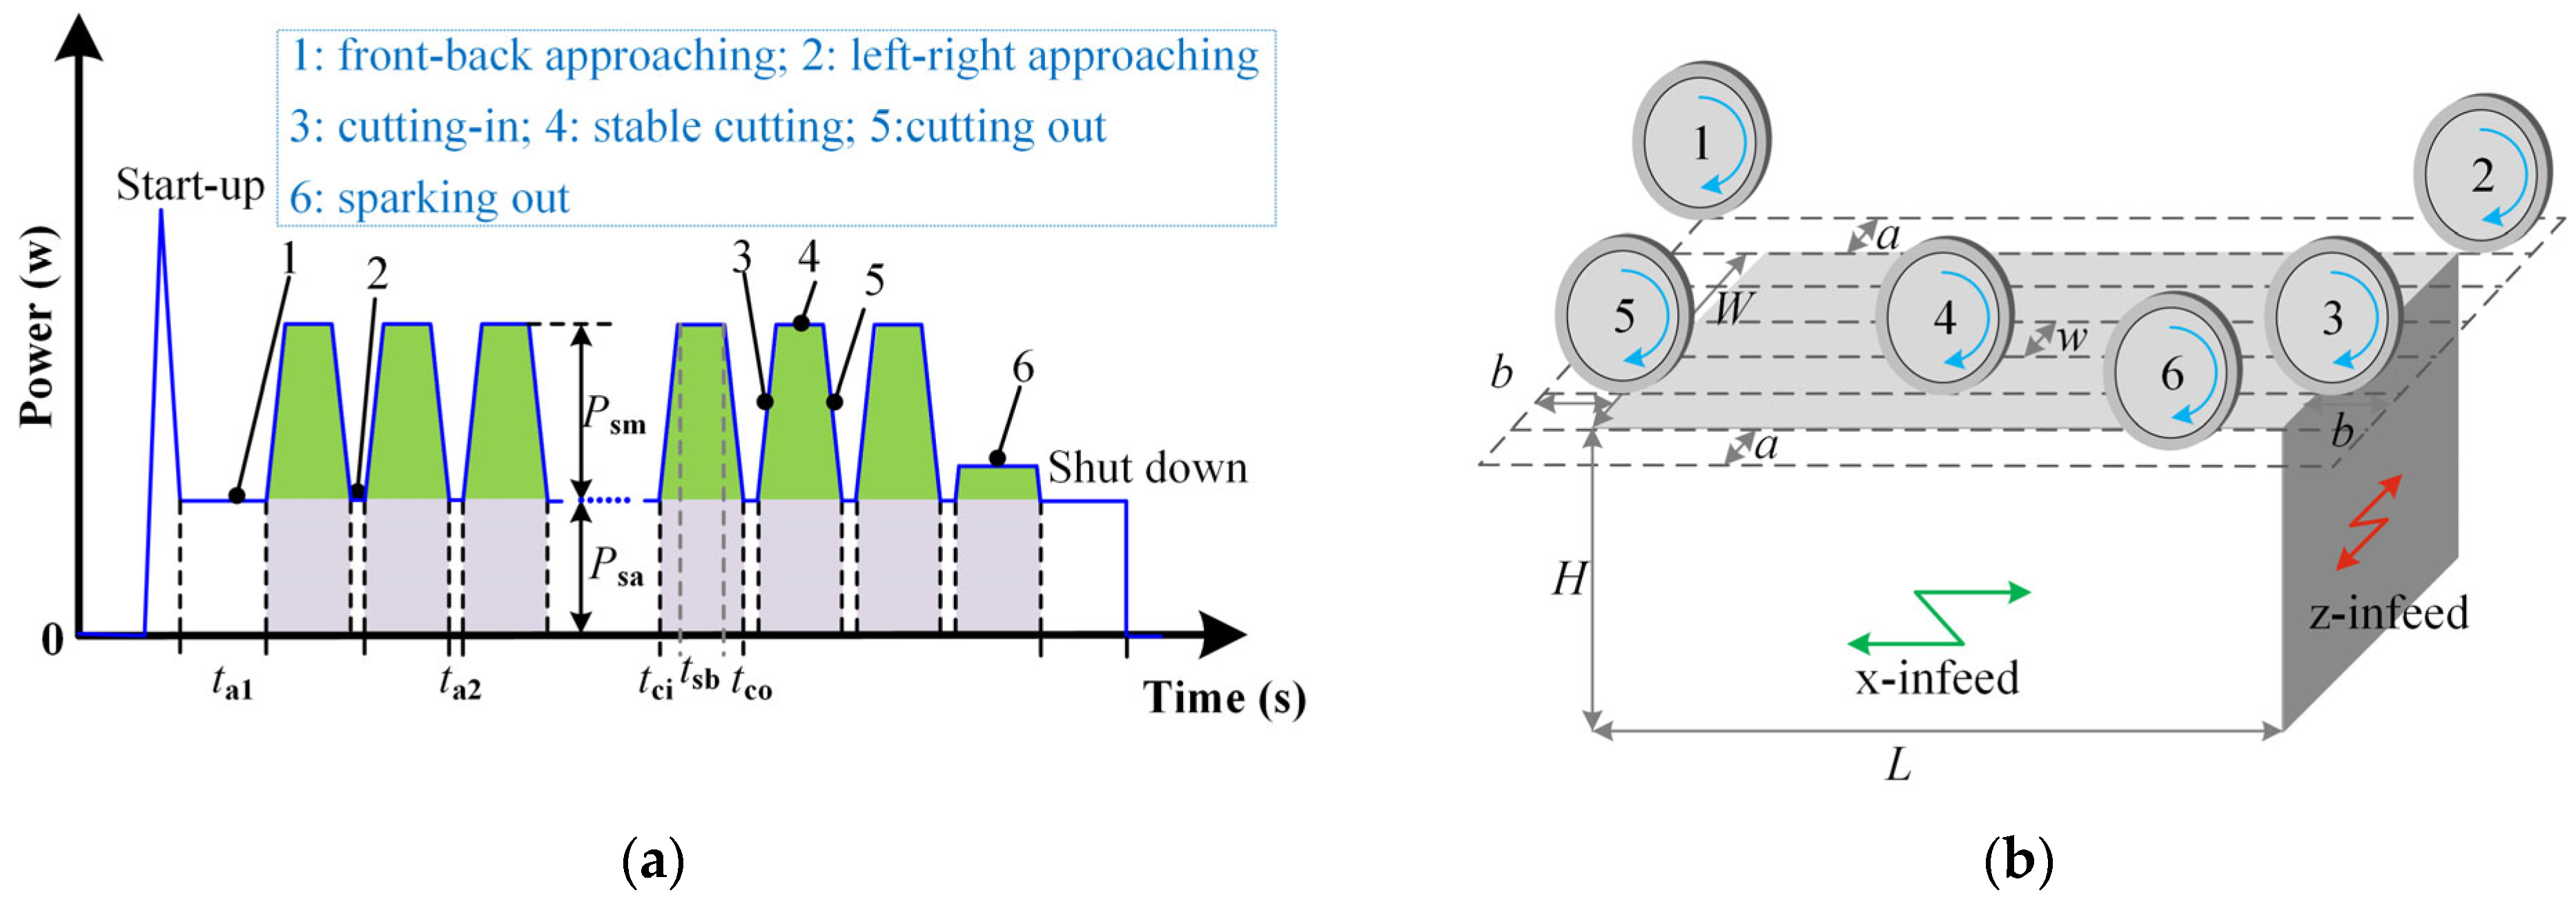
Figure 3.
x-infeed power during a grinding run: (a) Power variation over time; (b) Relative position of the wheel and workpiece.
Figure 3.
x-infeed power during a grinding run: (a) Power variation over time; (b) Relative position of the wheel and workpiece.

Figure 4.
Experimental setup of the grinding power monitoring system.
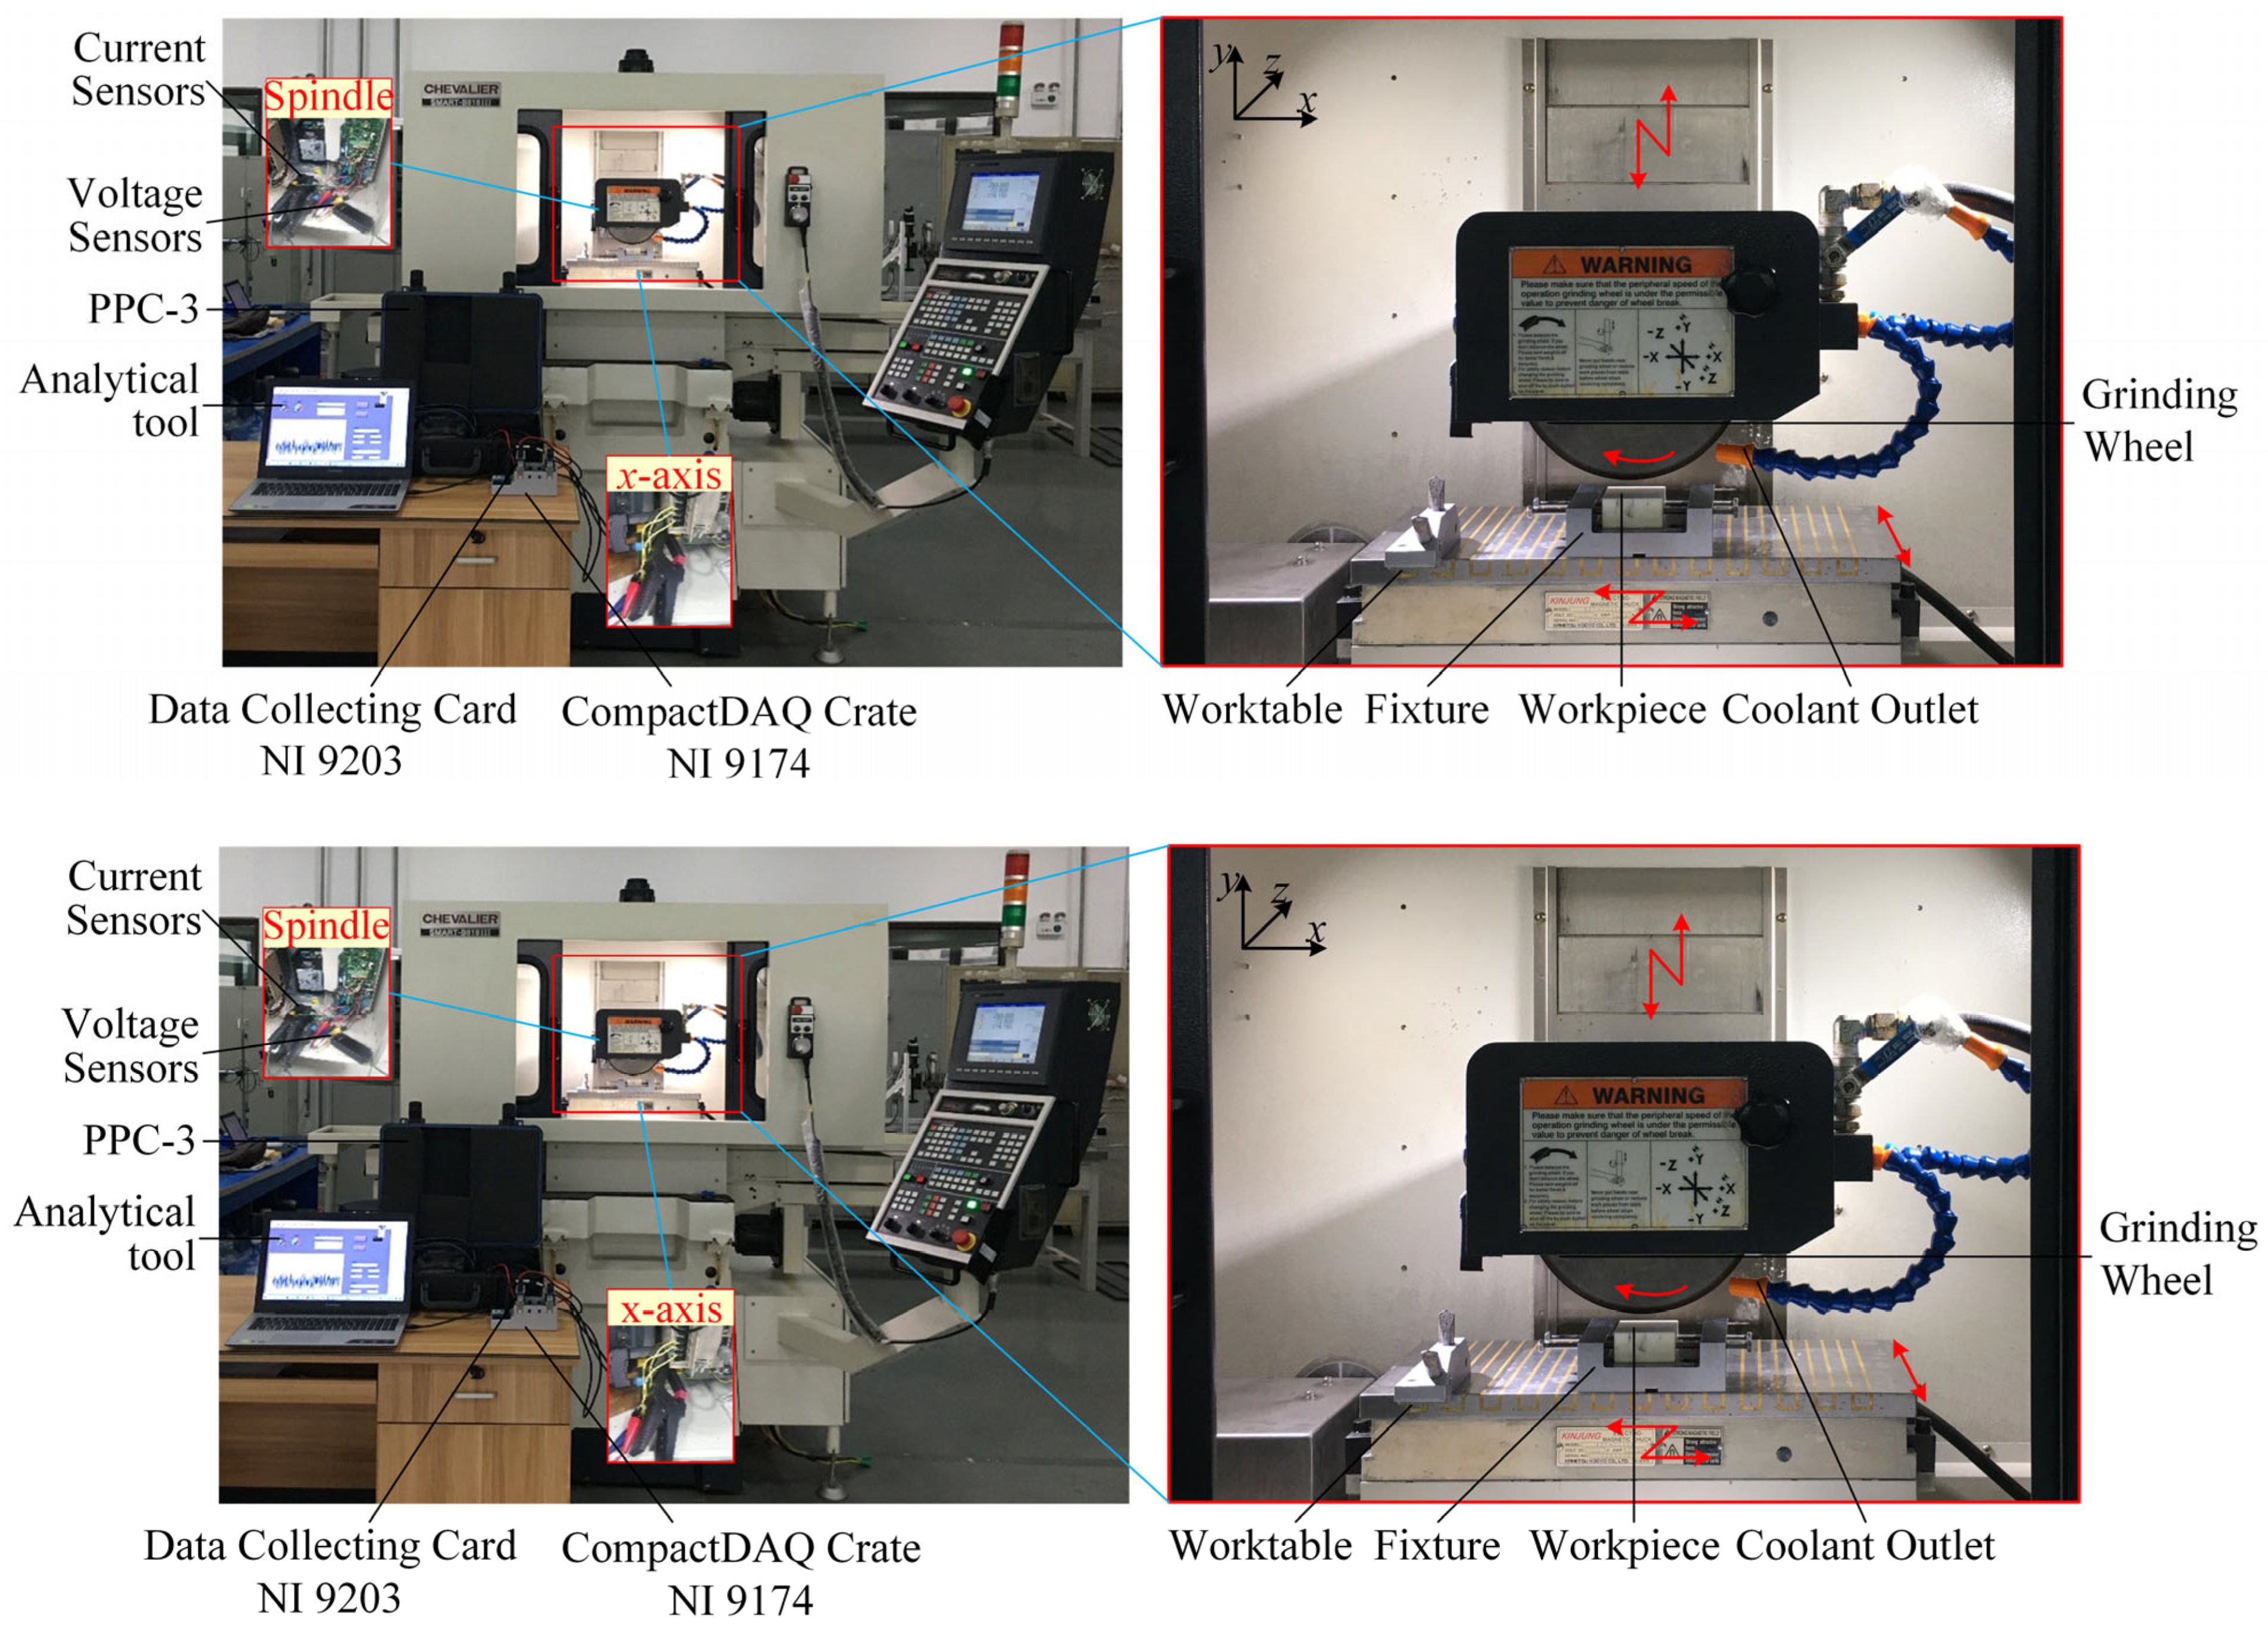
Figure 5.
Measured power variation along the spindle and x-axis: (a) Power waveform of wheel rotation; (b) Rotation power during material removal; (c) Rotation power during a grinding stroke; (d) Power waveform of x-infeed; (e) x-infeed power during material removal; (f) x-infeed power during a grinding stroke.

Figure 6.
Comparisons between measured and predicted power values of material removal and idle motion along the spindle, acceleration, and infeed along the x-axis.
Figure 6.
Comparisons between measured and predicted power values of material removal and idle motion along the spindle, acceleration, and infeed along the x-axis.
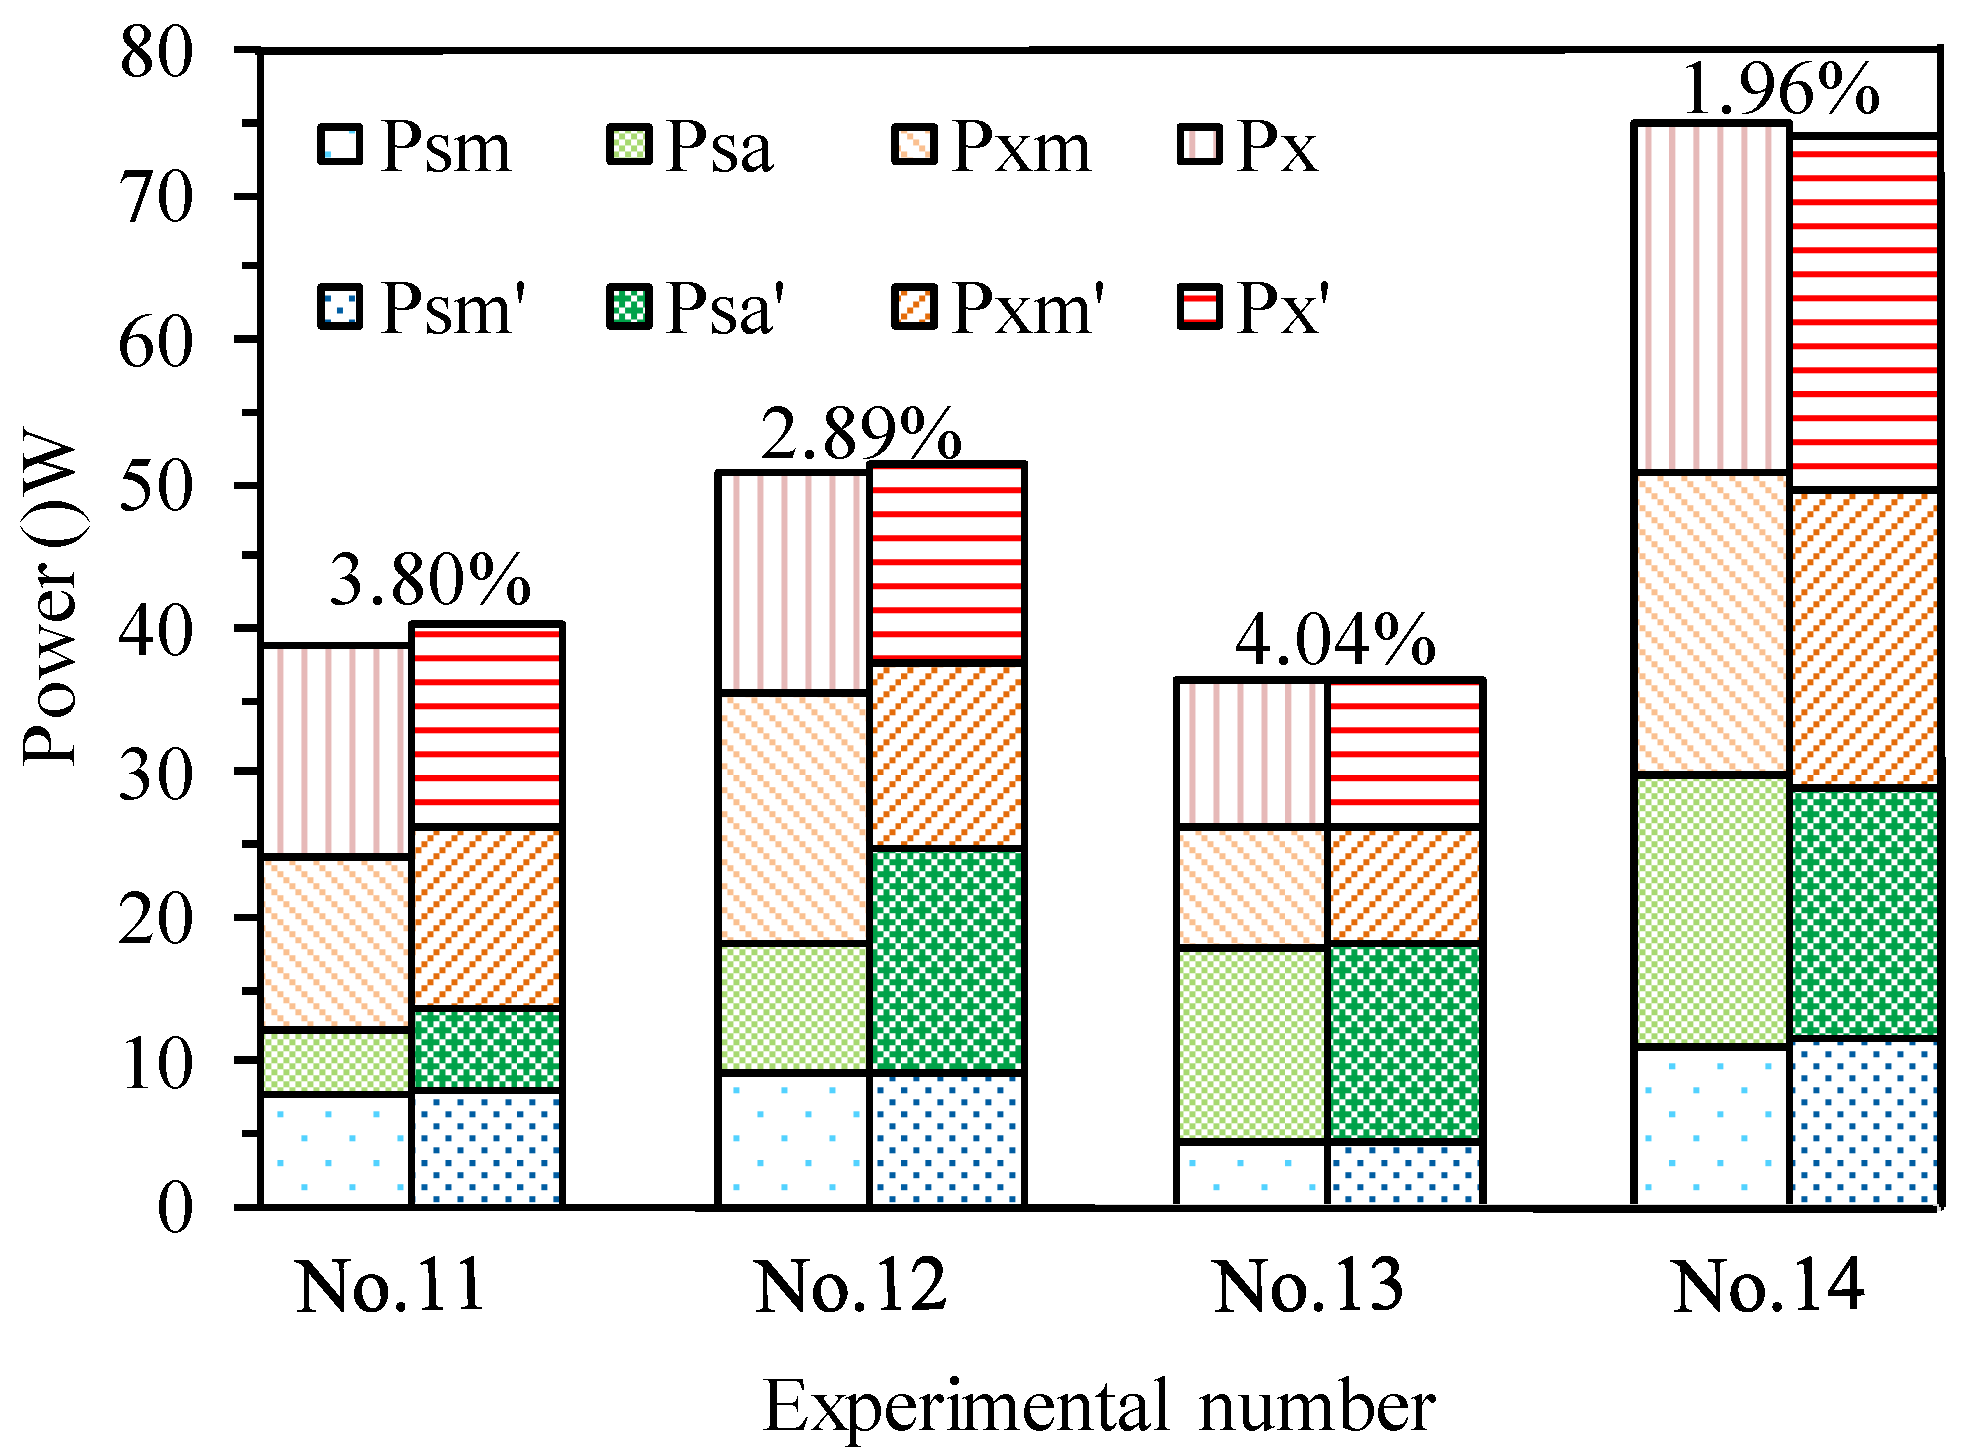
Figure 7.
Energy distribution comparisons for different components in four testing groups: (a) Energy distribution in the electrical controller, coolant, spindle rotation, x-infeed, y-infeed, and z-infeed parts; (b) Energy distribution in four motion parts: spindle rotation, x-infeed, y-infeed, and z-infeed.
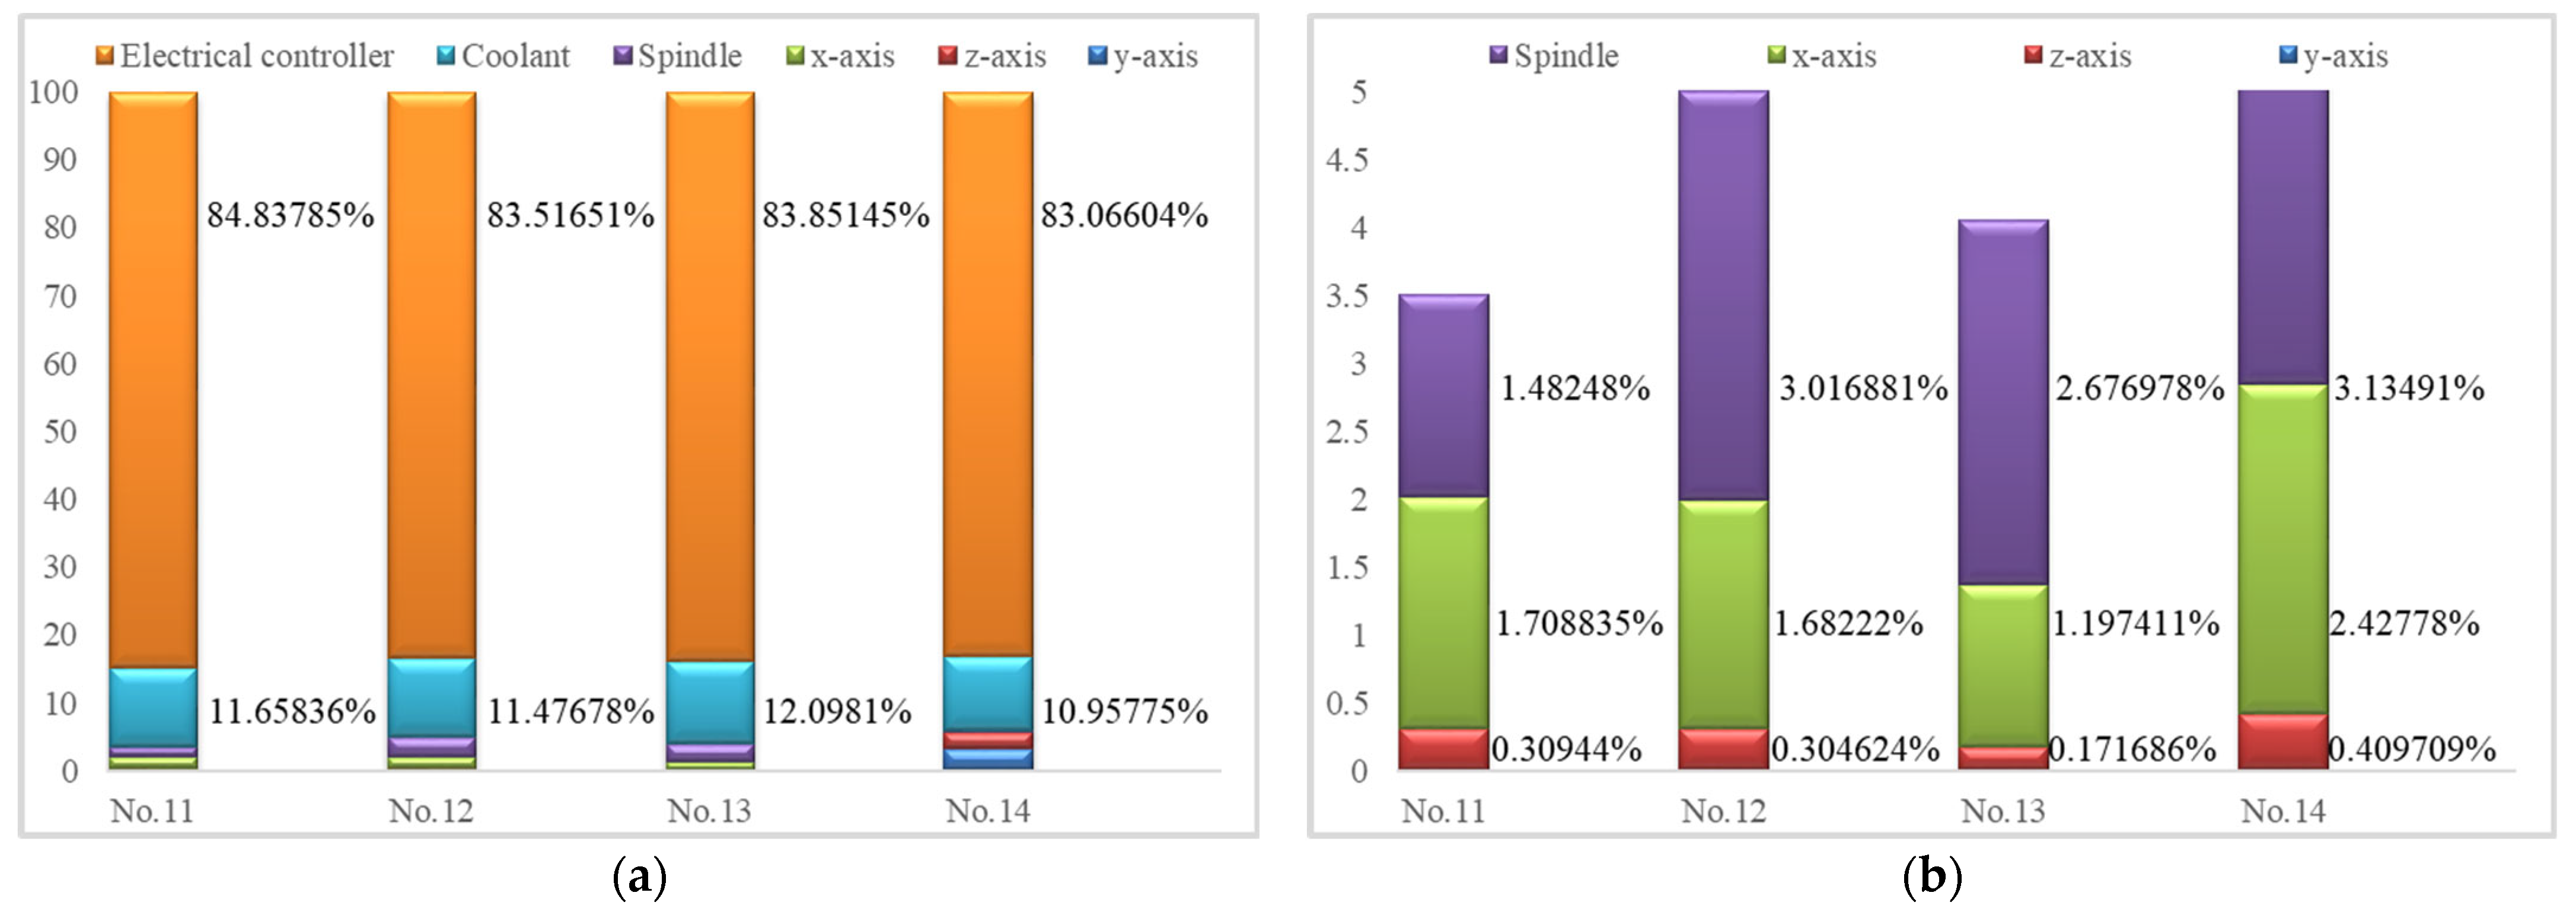
Figure 8.
Comparisons of energy distributions in wheel spindle in front–back approaching, left–right approaching, cutting-in, cutting-out, and stable cutting stages.
Figure 8.
Comparisons of energy distributions in wheel spindle in front–back approaching, left–right approaching, cutting-in, cutting-out, and stable cutting stages.

Figure 9.
Comparisons of the proportions of energy used in the material removal and non-material removal stages.
Figure 9.
Comparisons of the proportions of energy used in the material removal and non-material removal stages.

Table 1.
Grinding conditions.
| Factors | Parameters |
|---|---|
| Machining mode | Plane grinding |
| Workpiece material | SiO2f/SiO2 ceramics |
| Coolant | Water-based |
| Workpiece size (mm) | 50 (L) × 50 (W) × 25 (H) |
| Grinding wheel geometry (mm) | 100 (R) × 10 (Wd) |
| Grinding width, w (mm) | 5 |
| Material removal, d (μm) | 12, 24, 36, 48 |
| Distance, a (mm) | 5 |
| Distance, b (mm) | 10 |
| Workpiece infeed speed, vw (m/min) | 1, 2, 3, 4 |
| Depth of cut, ap (μm) | 3, 6, 9, 12 |
| Wheel speed, vs (m/s) | 15, 20, 25, 30 |
Table 2.
Power measurement results of electric controlling, cooling, and y- and z-infeed.
| No. | Pe (W) | Pc (W) | Py (W) | Pz (W) |
|---|---|---|---|---|
| 1 | 443.623 | 65.781 | 0.923 | 16.017 |
| 2 | 438.888 | 67.520 | 0.947 | 16.889 |
| 3 | 438.900 | 66.580 | 0.947 | 14.581 |
| 4 | 436.142 | 67.143 | 0.997 | 16.330 |
| 5 | 431.938 | 68.081 | 0.889 | 16.255 |
| Average | 437.898 | 67.021 | 0.941 | 16.014 |
Table 3.
Measured results of approaching and material removal power along the spindle and x-infeed and x-acceleration power along the x-axis in 10 experimental groups.
Table 3.
Measured results of approaching and material removal power along the spindle and x-infeed and x-acceleration power along the x-axis in 10 experimental groups.
| No. | vs (m/s) | vw (m/min) | ap (μm) | Psm (W) | Psa (W) | Pxm (W) | Px (W) |
|---|---|---|---|---|---|---|---|
| 1 | 30 | 4 | 12 | 19.77 | 21.61 | 31.92 | 38.63 |
| 2 | 25 | 4 | 12 | 15.58 | 16.17 | 31.63 | 38.28 |
| 3 | 20 | 4 | 12 | 14.97 | 7.73 | 31.63 | 38.53 |
| 4 | 15 | 4 | 12 | 10.65 | 4.77 | 31.58 | 38.52 |
| 5 | 30 | 1 | 12 | 10.16 | 21.96 | 8.32 | 10.27 |
| 6 | 30 | 2 | 12 | 10.70 | 24.41 | 11.90 | 13.81 |
| 7 | 30 | 3 | 12 | 15.09 | 22.91 | 21.51 | 24.43 |
| 8 | 30 | 4 | 9 | 17.90 | 21.30 | 31.33 | 39.86 |
| 9 | 30 | 4 | 6 | 12.60 | 22.81 | 31.82 | 38.30 |
| 10 | 30 | 4 | 3 | 7.72 | 22.34 | 31.75 | 38.94 |
Table 4.
Power model coefficients.
| Power | Coefficients | |||
|---|---|---|---|---|
| Psa | Asa | Bsa | ||
| −13.9620 | 1.1792 | |||
| Psm | λ | α | Β | χ |
| 0.1216 | −0.1986 | 0.6083 | 0.6014 | |
| Pxm | Ax | Bx | Cx | |
| 6.3500 | 0.1100 | 1.5500 | ||
| Px | η | ξ | Ψ | ω |
| 17.22 | −13.33 | 6.947 | −0.5679 | |
Table 5.
Comparisons between measured and predicted values of material removal and idle motion along the spindle, acceleration, and infeed along the x-axis.
Table 5.
Comparisons between measured and predicted values of material removal and idle motion along the spindle, acceleration, and infeed along the x-axis.
| No. | Grinding Parameters | Measured Values | Predicted Values | ||||||||
|---|---|---|---|---|---|---|---|---|---|---|---|
| vs (m/s) | vw (m/min) | ap (μm) | Psm (W) | Psa (W) | Pxm (W) | Px (W) | Psm′ (W) | Psa′ (W) | Pxm′ (W) | Px′ (W) | |
| 11 | 16.7 | 2 | 12 | 7.73 | 4.36 | 12.19 | 14.43 | 7.88 | 5.73 | 12.77 | 13.80 |
| 12 | 25 | 2 | 9 | 9.20 | 17.25 | 12.54 | 13.81 | 9.16 | 15.52 | 12.77 | 13.80 |
| 13 | 23.4 | 1 | 6 | 4.50 | 13.43 | 8.23 | 10.27 | 4.47 | 13.63 | 8.01 | 10.27 |
| 14 | 26.7 | 3 | 8 | 11.10 | 18.67 | 20.96 | 24.19 | 11.52 | 17.52 | 20.63 | 24.41 |
Table 6.
Individual and total energy prediction results for wheel rotation, x-infeed, y-infeed, z-infeed, electrical controller, and coolant.
Table 6.
Individual and total energy prediction results for wheel rotation, x-infeed, y-infeed, z-infeed, electrical controller, and coolant.
| No. | Es (J) | Ex (J) | Ey (J) | Ez (J) | Ee (J) | Ec (J) | Etotal (J) |
|---|---|---|---|---|---|---|---|
| 11 | 1104.487 | 1273.128 | 2.256 | 230.544 | 63,206.49 | 8685.792 | 74,502.69 |
| 12 | 2283.218 | 1273.128 | 2.256 | 230.544 | 63,206.49 | 8685.792 | 75,681.42 |
| 13 | 3594.717 | 1607.916 | 2.256 | 230.544 | 112,601.6 | 16,245.65 | 134,282.7 |
| 14 | 1764.019 | 1366.116 | 2.256 | 230.544 | 46,741.446 | 6165.84 | 56,270.221 |
Table 7.
Individual and total energy prediction results for the wheel spindle in front–back approaching, left–right approaching, cutting-in, cutting-out, stable cutting, and material removal stages.
Table 7.
Individual and total energy prediction results for the wheel spindle in front–back approaching, left–right approaching, cutting-in, cutting-out, stable cutting, and material removal stages.
| No. | Ea1 (J) | Ea2 (J) | Eci (J) | Eco (J) | Ecu (J) | Esm (J) | Es (J) |
|---|---|---|---|---|---|---|---|
| 11 | 137.52 | 165.024 | 17.9862 | 17.9862 | 765.9708 | 801.9432 | 1104.4872 |
| 12 | 372.48 | 446.976 | 37.386 | 37.386 | 1388.9904 | 1463.7624 | 2283.2184 |
| 13 | 654.24 | 785.088 | 58.95434 | 58.95434 | 2037.4808 | 2155.38948 | 3594.71748 |
| 14 | 280.32 | 336.384 | 28.8672 | 28.8672 | 1089.5808 | 1147.3152 | 1764.0192 |
Table 8.
Energy predictions for the material removal and non-material removal stages.
| No. | Emrr (J) | En-mrr (J) | Etotal (J) |
|---|---|---|---|
| 11 | 29,901.564 | 44,601.1292 | 74,502.6932 |
| 12 | 30,524.5836 | 45,156.8408 | 75,681.4244 |
| 13 | 59,776.98504 | 74,505.70244 | 134,282.6875 |
| 14 | 20,808.2168 | 35,462.0044 | 56,270.2212 |
Disclaimer/Publisher’s Note: The statements, opinions and data contained in all publications are solely those of the individual author(s) and contributor(s) and not of MDPI and/or the editor(s). MDPI and/or the editor(s) disclaim responsibility for any injury to people or property resulting from any ideas, methods, instructions or products referred to in the content. |
© 2023 by the authors. Licensee MDPI, Basel, Switzerland. This article is an open access article distributed under the terms and conditions of the Creative Commons Attribution (CC BY) license (https://creativecommons.org/licenses/by/4.0/).
Share and Cite
MDPI and ACS Style
Tian, Y.; Wang, J.; Hu, X.; Song, X.; Han, J.; Wang, J. Energy Prediction Models and Distributed Analysis of the Grinding Process of Sustainable Manufacturing. Micromachines 2023, 14, 1603. https://doi.org/10.3390/mi14081603
AMA Style
Tian Y, Wang J, Hu X, Song X, Han J, Wang J. Energy Prediction Models and Distributed Analysis of the Grinding Process of Sustainable Manufacturing. Micromachines. 2023; 14(8):1603. https://doi.org/10.3390/mi14081603
Chicago/Turabian StyleTian, Yebing, Jinling Wang, Xintao Hu, Xiaomei Song, Jinguo Han, and Jinhui Wang. 2023. "Energy Prediction Models and Distributed Analysis of the Grinding Process of Sustainable Manufacturing" Micromachines 14, no. 8: 1603. https://doi.org/10.3390/mi14081603
Note that from the first issue of 2016, this journal uses article numbers instead of page numbers. See further details here.