Mechanical Vibrations of Thermally Actuated Silicon Membranes

1
Electrical and Microelectronic Engineering Department, Rochester Institute of Technology, 82 Lomb Memorial Dr., Rochester, NY 14623, USA
2
Microsystems Engineering Department, Rochester Institute of Technology, 82 Lomb Memorial Dr., Rochester, NY 14623, USA
*
Author to whom correspondence should be addressed.
Micromachines 2012, 3(2), 255-269; https://doi.org/10.3390/mi3020255
Submission received: 14 February 2012
/
Revised: 14 March 2012
/
Accepted: 26 March 2012
/
Published: 28 March 2012
(This article belongs to the Special Issue Thermal Switches and Control of Heat Transfer in MEMS)
Abstract
:A thermally-actuated micro-electro-mechanical (MEMS) device based on a vibrating silicon membrane has been proposed as a viscosity sensor by the authors. In this paper we analyze the vibration mode of the sensor as it vibrates freely at its natural frequency. Analytical examination is compared to finite element analysis, electrical measurements and the results obtained through real-time dynamic optical surface profilometry. The vertical movement of the membrane due to the applied heat is characterized statically and dynamically. The natural vibration mode is determined to be the (1,1) mode and good correlation is found between the analytical predictions, the simulation analysis, the observed mechanical displacement and the electrical measurements.
1. Introduction
MEMS based vibrating structures have found many applications. Examples of these applications include high-frequency, high-Q electromagnetic resonators for timing and filtering purposes [1]; mass-sensitive piezoresistive resonant cantilever beams for biomedical applications [2]; and vibrating structures for rheology applications [3]. The vibration of these MEMS structures is usually observed with laser interferometers, which focus on just one point or a small area of the vibrating structure [4] or with electrical outputs based on capacitive [5], piezoelectric [6] or piezoresistive [7] sensors. Even though these outputs will provide information on the vibrating behavior of the structures, they do not provide information on the shape of the structure during this vibration. In some cases this is not important as the vibration behavior is still affected by what is being measured [8]. In other applications, such as in rheology, the vibrating shape is important to determine the effectiveness of the measurement technique.
A thermally actuated MEMS device has been proposed as a viscosity sensor by the authors in [9]. The proposed device is a silicon-based membrane which is actuated by the sudden application of heat that sets the silicon membrane to vibrate at its natural frequency. Theoretical and finite element analysis is performed to observe both the expected static and dynamic displacement. Experimentally, this vibration is measured electrically using piezoresistive elements placed on the edge of the membrane. In addition, we use a Veeco Wyko NT-1100TM real-time dynamic optical surface profiler tool to physically observe and characterize the vertical movement and shape of the membrane during vibration. First we measure the static displacement due to heat and then calibrate the center deflection to the electrical output. The electrical output obtained with the static calibration can be used to measure the center displacement of the membrane, but it provides no information about the shape of the membrane during the vibration. In order to determine the shape of the membrane during vibration, we utilize the Dynamic Measurement tool in the Veeco Wyko NT-1100TM to experimentally observe the shape of the surface of a resonant membrane. These measurements are obtained by actuating the membrane mechanically and with thermal-shock.
The results correlate between the theoretical predictions, the mechanical displacement and the electrical measurements. As such, they provide experimental confirmation of the theoretical analysis of a thin membrane vibrating in response to thermal-shock excitation with respect to the shape of the membrane, the frequency of vibration and the displacement amplitude.
2. Thermally Generated Mechanical Vibrations
The general equation that describes the thermal vibration of plates is based on the assumption that the slopes and deflections of the pate are small when compared to any of the geometrical lengths of the plate. This assumes that the plane cross-section, which is initially perpendicular to the axis of the plate, remains planar and perpendicular to the neutral axis during bending.
Our analysis focuses on the long-term oscillatory behavior, which results from sudden thermal excitation. We are interested on the shape of the membrane, the frequency of the vibration and the amplitude of the vibration once the membrane has been set into motion. We are not concerned with what happens in the immediate vicinity of the thermal excitation. As such, we will simplify the analysis by assuming the classical theory of thermal conduction and an immediate response of the structure to a temperature gradient [10]. We will not take into account the heat transfer phase lag that is due to a finite speed for heat transport and results in a hyperbolic heat transfer equation [11].
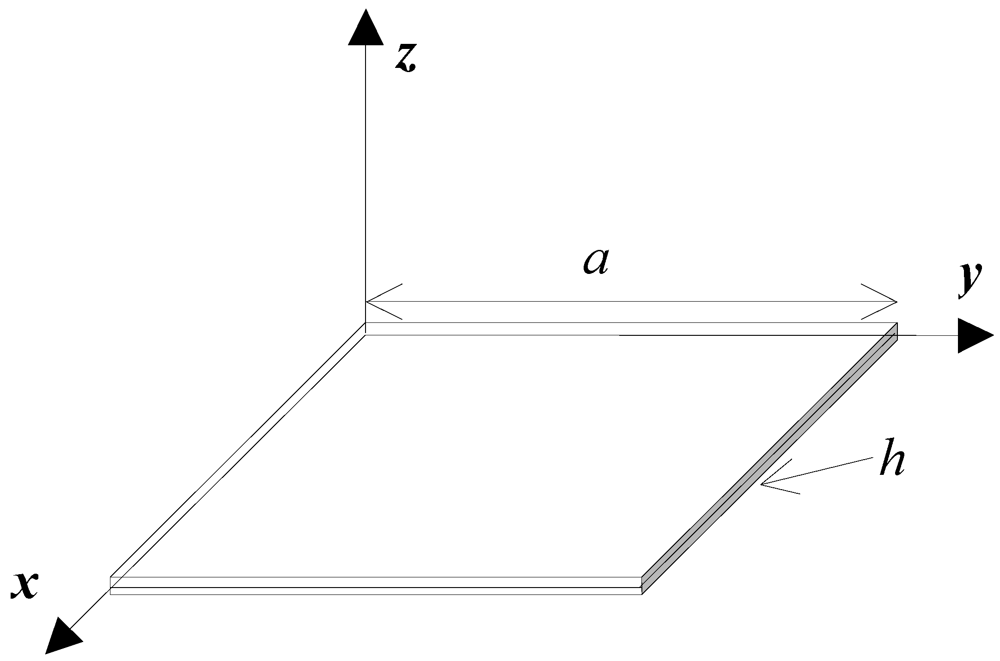
The plate in Figure 1 occupies the space 0 ≤ x ≤ a; 0 ≤ y ≤ a; (h/2) ≤ z ≤ (h/2). The displacements in the x, y and z directions are denoted by u, v and w respectively. A uniform step heat input is applied at (z = h/2). The fourth order differential equation that describes the thermal vibration of a thin plate or membrane, such as the one illustrated in Figure 1, is developed in [10] and presented here:

where E is the Young’s modulus, ν the Poisson’s ration, ρ the density and h the thickness of the plate. MT is the thermal moment generated by the applied heat.
Figure 1.
Coordinate system of a thin plate or membrane.

The solution in the vertical direction w has two components: a static term wst that is not dependent on time and is solved by ignoring the second order time-dependent differential equation, also called the inertia term, and a dynamic term wdyn. The inertia term can be ignored when the time rate of change of the temperature is slow enough so that these terms should not be significant. This is not the case in our study where the temperature is rapidly increased. The dynamic term comes from the solution of the inertia term. The close-form solutions are presented in [10].

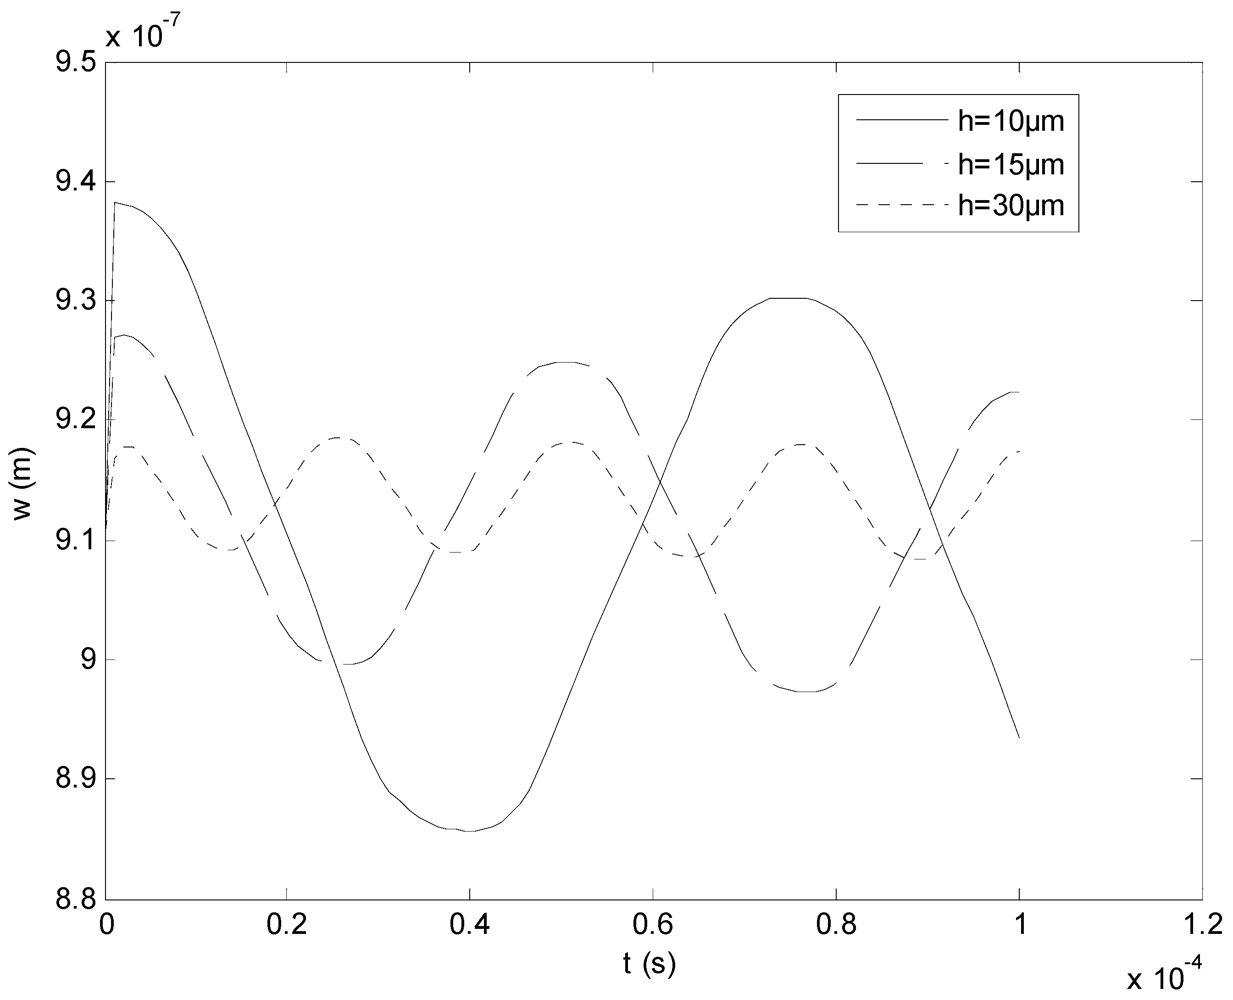
Assuming a simply supported membrane vibrating in the (1,1) mode and substituting typical values for MEMS silicon membranes—listed in Table 1—we produced the plot, shown in Figure 2, of the center deflection of the membrane (x = a/2, y = a/2). We focus our interest on the part of the analysis that provides information on the frequency and the amplitude of the vibration. In this plot the dependence of the frequency of vibration on the thickness of the membrane h is clearly observed. The calculated natural frequencies of vibration of membranes of a = 2.5 mm and h = 10 µm, h = 15 µm and h = 30 µm are f10um = 14,140 Hz, f15um = 20,200 Hz, f30um = 39,580 Hz. Assuming an applied heat generated by the application of 60 × 10−6 J, we can also observe the predicted deflection of the center of the membrane. The static deflection is of 0.9 µm and the amplitude of the vibration varies from about 50 nm for h = 10 µm to less than 10 nm for h = 30 µm.
Figure 2.
Center deflection vs. time of a square membrane actuated with heat excitation, with a = 2.5 mm and h = 10, 15 and 30 µm.
Figure 2.
Center deflection vs. time of a square membrane actuated with heat excitation, with a = 2.5 mm and h = 10, 15 and 30 µm.


| Material | Silicon |
|---|---|
| Density ρ | 2,230 kg/m3 |
| Young’s modulus E | 1.69 × 10¹¹ Pa |
| Poisson’s ratio ν | 0.3 |
| Coefficient of thermal expansion α | 2.6 × 10⁻⁶/°C |
| Thermal conductivity k | 150 W/m °C |
| Heat capacity cp | 0.7 J/gc |
| Thermal diffusivity κ = k/ρcp | 0.8 × 10⁻⁴ m2/s |
This analysis can also provide information on the mode shape of the vibration provided that the boundary conditions of the membrane are known. According to [12] the natural modes of vibration depend on the boundary conditions of the membrane. Both clamped and simply supported membranes result in a (1,1) shape mode. On the other hand, free membranes result in a (2,2) mode. For the application of this membrane as a viscosity sensor, the (1,1) mode is preferred, as it would result in the intended shearing of the fluid being tested. As mentioned above, we performed the analysis by assuming a simply supported structure vibrating in a (1,1) mode but our case seems to be between a simply supported and a free membrane. Due to the nature of the microelectronic process used to fabricate the structures [9], the silicon edge is not clamped and is free to slide in the normal direction to the plane. The silicon edge is only weakly constrained in the vertical direction. Therefore, we are assuming a mode of vibration which we will try to verify with the analysis and measurement results presented in the next sections of this paper.
3. Static Characterization and Electrical Calibration
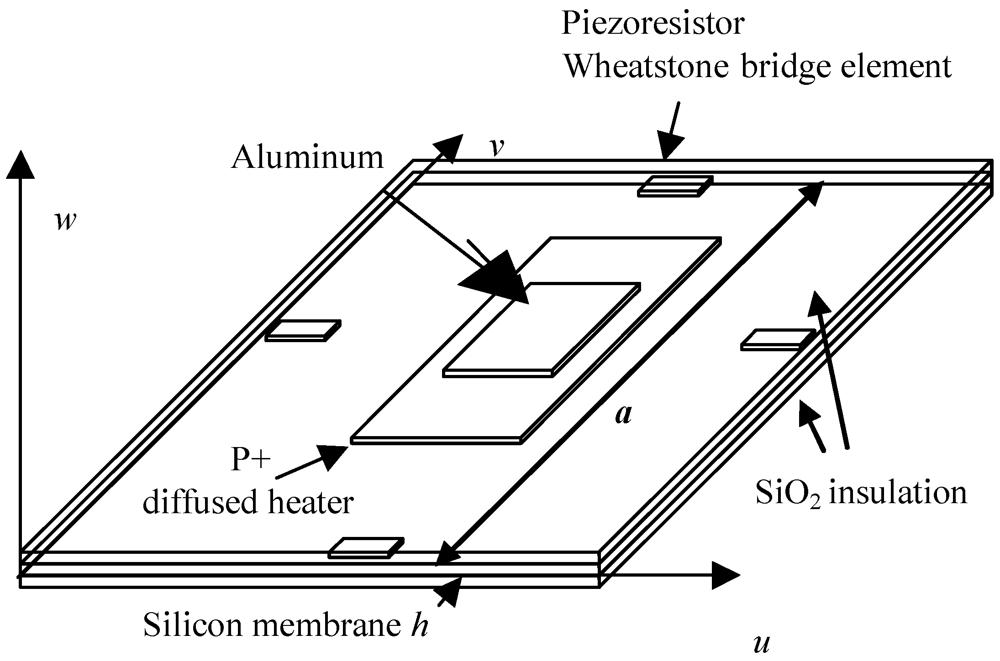
Static displacement characterization was performed with fabricated thin-membrane structures so that electrical measurements can be used to measure the movement of the membranes. Thermally actuated membranes were fabricated as described in [9]. A schematic representation of such structures is shown in Figure 3. A P+ diffused resistor of 100 Ω/sq, with a junction depth of 5 µm is used as the thermal actuator. The membrane is designed to be square to simplify processing by using a well-established anisotropic KOH etch. The movement of the membrane is sensed with an n-doped polysilicon (40 Ω/sq) Wheatstone bridge, which has been calibrated in [13] and results in a sensitivity of 1.35 mV/µm when a 5 V supply is used. The top aluminum layer on the center of the membrane is used to enhance the bowing effect of the silicon membrane through the bimetal effect. The bimetal effect on non-idealized silicon membranes has been studied in detail by several authors [14,15].
Figure 3.
Graphical representation of the thin silicon membrane with the P+ diffused heater actuator, the aluminum bimetal area and piezoresistor Wheatstone bridge sensing elements.
Figure 3.
Graphical representation of the thin silicon membrane with the P+ diffused heater actuator, the aluminum bimetal area and piezoresistor Wheatstone bridge sensing elements.

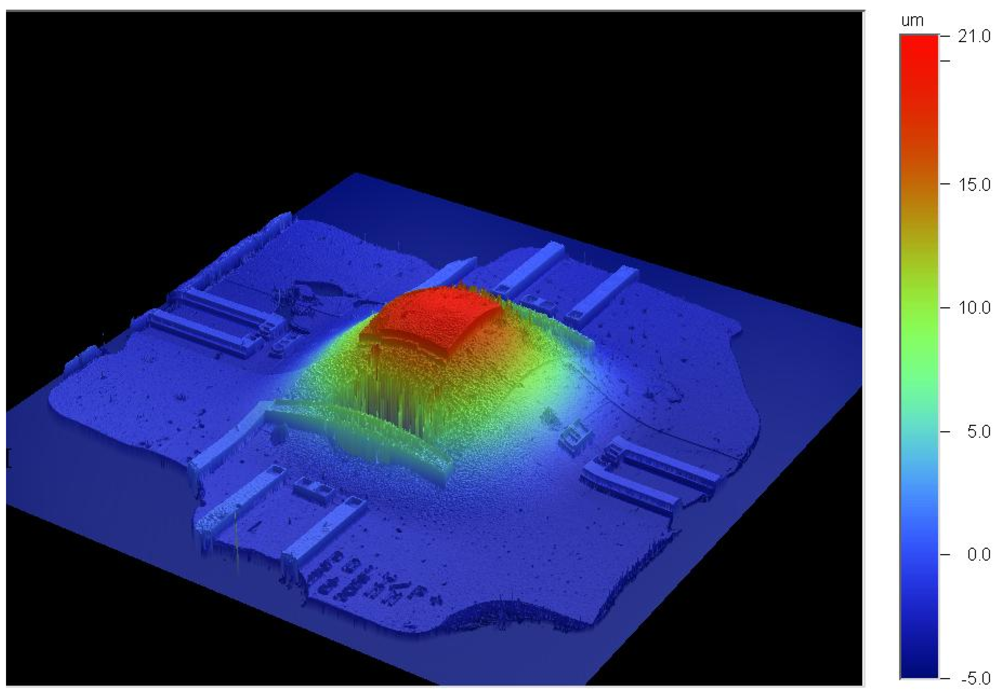
The static vertical displacement of the fabricated devices was measured with a Veeco Wyko NT-1100TM real-time dynamic optical surface profiler. The vertical deflection is calibrated to the voltage output of the polysilicon Wheatstone bridge by increasing the applied current through the resistor and measuring the maximum deflection at the center of the membrane after a settling time. The typical 3D output can be seen in Figure 4. The membrane seems to take a parabolic shape as it deflects up from its rest position. Figure 4 shows a center displacement of 23 µm when a DC current of 70 mA is applied to the heating resistor. In our application we are expecting displacement values in the nanometer range. Nevertheless, calibrating the output voltage to large displacement values should still result in an acceptable correlation when measuring the smaller displacements.
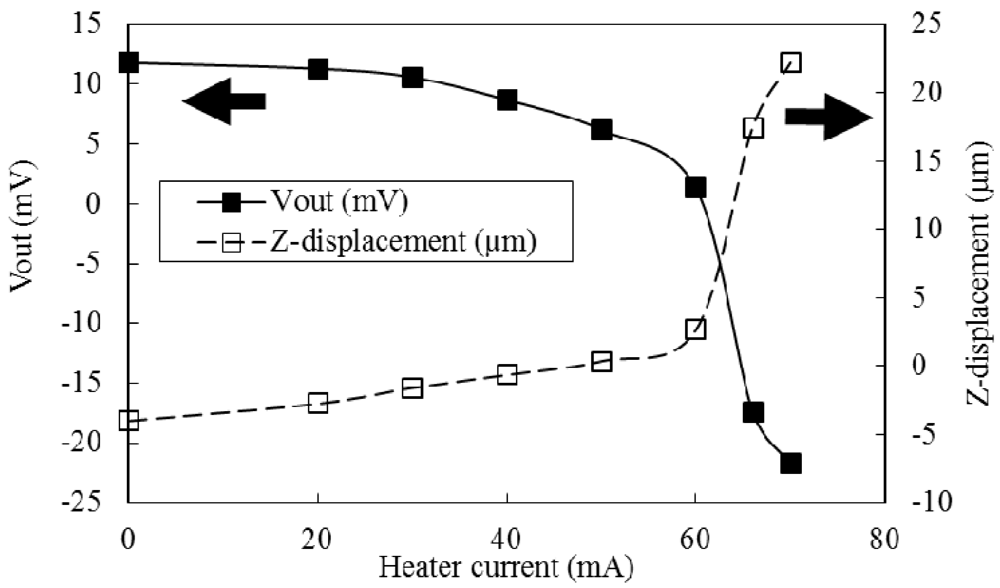
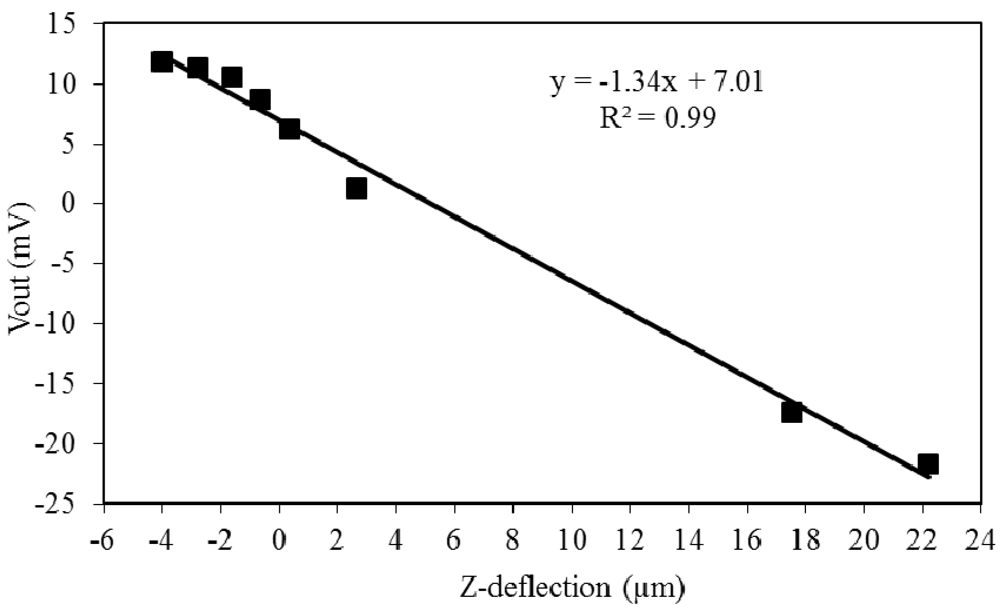
Figure 5 and Figure 6 show the correlation between the deflection at the center of the membrane and the voltage output measured with the Wheatstone bridge as the heating current is increased. Smaller displacements can be expected for lower heating currents. The membrane will tend to buckle up or down when a critical temperature is reached as observed when the current is increased beyond 60 mA. We will operate our devices well below this critical temperature. A good fit is obtained for a linear relationship of 1.341 mV/µm with R2 > 0.9 when VBridge = 5 V. The analytical analysis of this type of structure and the correlation to the above experimental data is shown in more detail in [13].
Figure 4.
Typical 3D output obtained with Veeco Wyko NT-1100TM real-time optical surface profiler.

Figure 5.
Electrical output voltage and center displacement as a function of heating current.

Figure 6.
Correlation of the electrical voltage output to the center displacement.

4. Dynamic Characterization
4.1. Finite Element Analysis
In order to investigate the time dependent vibration behavior of the membranes under sudden loads, a commercially available software package, COMSOL Multiphysics®, was used with its electrostatic-DC, heat conduction and stress-strain modules. The 3D domain consists of 2 subdomains: a silicon-membrane (2.5 mm × 2.5 mm × 15 µm) with a heating resistor (1.2 mm × 0.8 mm × 5 µm) embedded in the top 5 µm of the membrane. Stress-strain and heat equations are solved in both domains but the electrostatic equation is only solved in the resistor. For the electrostatic equation, a sheet resistance of 100 Ω/sq is used for the resistor. To obtain numerical convergence, rather than utilizing a step function, a 20 V bias is ramped at one end of the resistor in 5 µs and is left on for 20 µs before it is removed. For the stress-strain equation, simply supported boundary conditions were applied to all edges of the membrane.
The phase lag effect in the heat transfer analysis is not considered due to the fact that our analysis does not focus on what happens in the immediate vicinity of the thermal excitation but rather on the long-term oscillatory behavior that results from this thermal excitation. For this reason, the damping effect was not included in the stress-strain equation. However, it was expected that intrinsic thermal damping would lead to a quick decay of the oscillations [16] and result in a change in the vibration frequency. This effect on the vibration frequency would be significant but small and fall within an acceptable difference if we take into account the other approximations that are assumed in this analysis.
The material properties of both domains for the stress-strain and the heat transfer equations, typical bulk properties of silicon, are listed in Table 1. We took into account the anisotropy of the Young’s modulus of silicon reported in [17] but realize that for small displacement, as is the case in these structures, the plane cross-section, which is initially perpendicular to the axis of the plate, is assumed to remain planar and perpendicular to the neutral axis during bending. As such, the stress-strain equation only needs to be solved for the x and y directions according to the orientation convention presented in Figure 1. For (100) oriented silicon wafers, the Young’s modulus in the perpendicular directions of the axis of the membrane are equal according to [17]. Thin oxide and aluminum layers are neglected in the simulations because their geometries with high aspect ratios would require much higher mesh requirements.
The resistor is meshed by 36 and 54 elements along its long edges while the long outer edges of the membrane are meshed by 37 elements each. Both domains have 1 element in thickness. Mesh points are interpolated by quadratic elements for temperature, electric potential and displacement field variables. The discretization leads to approximately 47,600 tetrahedral elements and 368,500 degrees of freedom. This time dependent problem was solved by the iterative Biconjugate Gradient Stabilized Method solver while the variables were fully coupled. Geometric Multigrid V-Cycle was utilized by lowering element orders to linear. A Successive Order Relaxation algorithm was used as the pre and post smoother in addition to a Parallel Direct Sparse Solver as the coarse solver. The solver took strictly half microsecond time steps with relative and absolute tolerances of 10−4 and 10−5 respectively.
The results match those predicted by the theory presented in the previous section indicating that the sudden thermal load sets the membrane in motion to vibrate at its natural frequency. The typical energy bias applied to the membrane shows only a slight increase in temperature of the membrane, matching the measurements shown in [9]. The initial response is to move either up or down, depending on the layers of materials on the membrane, and oscillate around this static displacement location. This correlates with the theory developed by Boley [10] as well as with our electrical measurements presented below. As the heat dissipates away from the center of the membrane the membrane will relax back to the starting position.
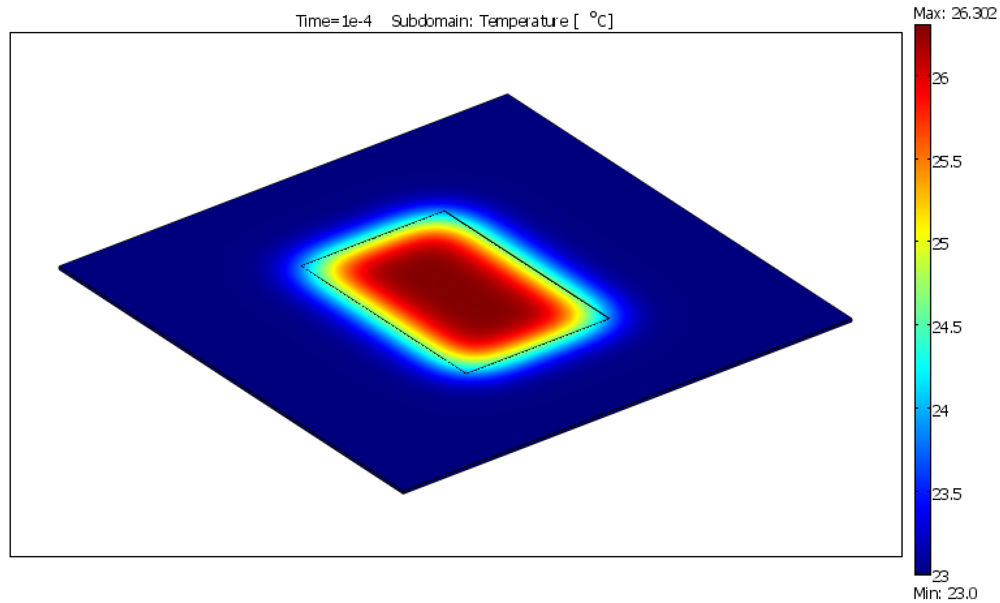
Joule heating results in a temperature increase at the center of the membrane. The temperature increase, due to the bias conditions of 20 V for 20 µs, is only 3.3 °C. This confirms the measurements taken with the in-situ diodes presented in [9]. This peak temperature is reached in 35 µs, 10 µs after the heating bias has been removed. The temperature will then decay slowly down to room temperature.
The temperature distribution of the membrane near its peak temperature is shown in Figure 7. It can be observed that the temperature is highest at the center of the membrane and follows the same shape of the heating resistor and becomes more circular in shape as the heat leaves this region.
Figure 7.
Temperature distribution of the membrane after a 20 V–20 µs pulse.

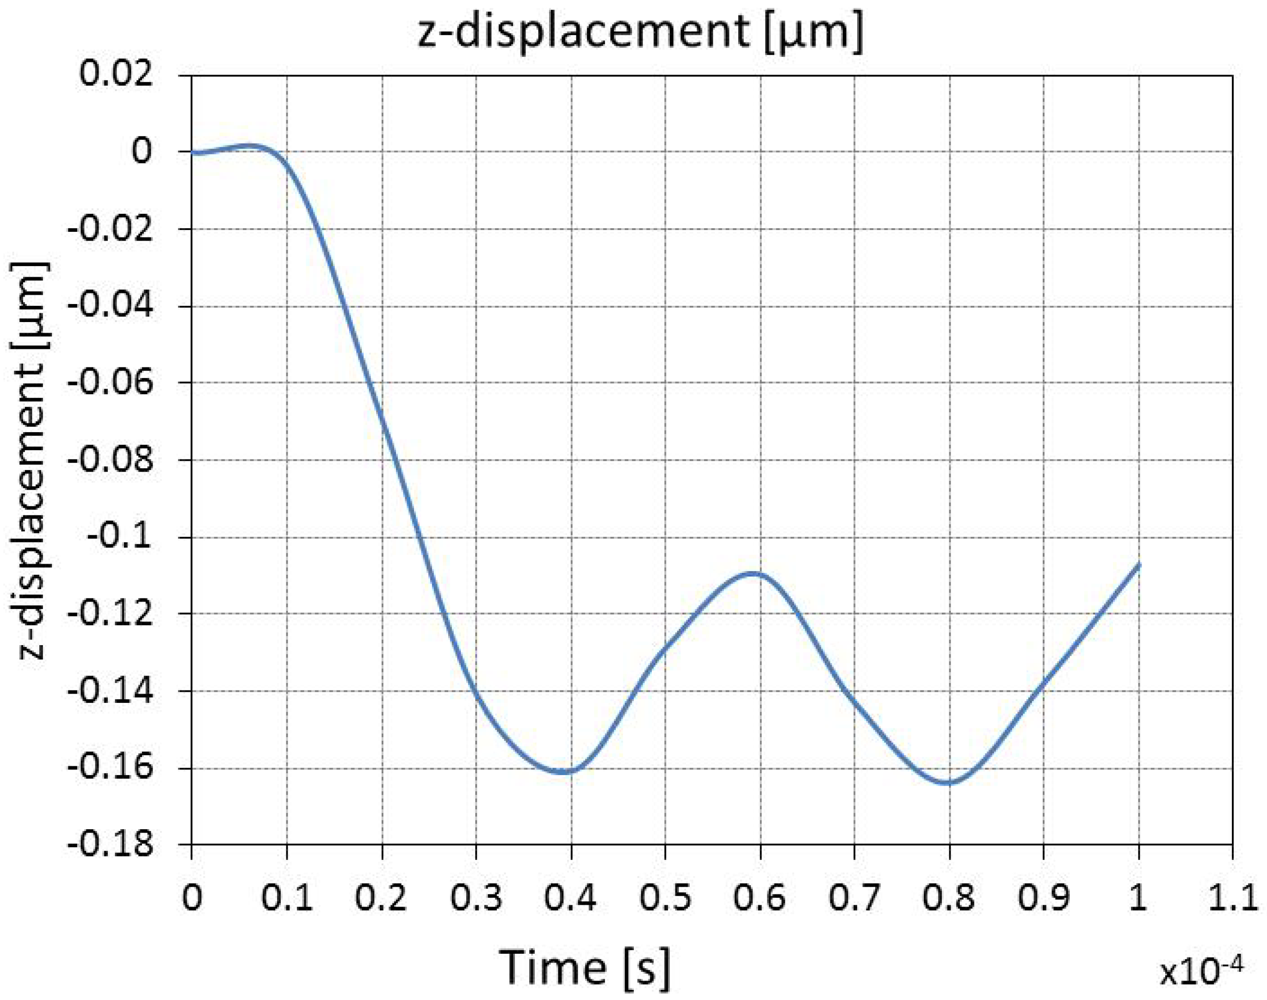
Figure 8 shows the time progression of the vertical displacement of the center of the membrane. As predicted by the theory and observed in the experimental data, the membrane will experience a static displacement and a dynamic displacement. The static displacement is lower than that predicted by the theory presented in the previous sections, but the simulation results match what is observed experimentally. This difference could be due to the choice of the parabolic heat transfer model instead of the more accurate hyperbolic model that is suggested by [11]. We are not concerned about this initial displacement as our sensor application relies on the cyclical vibration that takes place after this initial displacement; the dynamic displacement.
Figure 8.
Membrane response to a 20 V–20 µs pulse of a 2.5 mm silicon membrane with a P+ diffused heater.
Figure 8.
Membrane response to a 20 V–20 µs pulse of a 2.5 mm silicon membrane with a P+ diffused heater.

The dynamic displacement value of ~60 nm around the static displacement matches both the theoretical and experimental results. The period of the oscillation is 41 µs, a frequency of 24,390 Hz, which is the natural frequency of vibration of this membrane structure [12]. Thus, confirming that the inertia given to the membrane through the burst of heat will set the membrane to mechanically oscillate at its natural frequency.
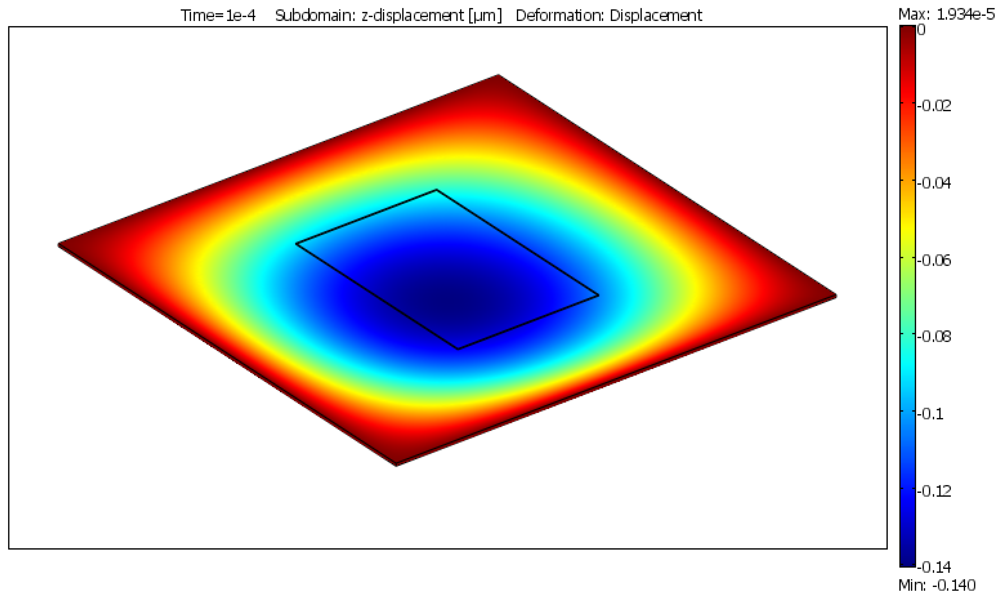
Figure 9.
Membrane deformation in response to a 20 V–20 µs pulse of a 2.5 mm silicon membrane with a P+ diffused heater.
Figure 9.
Membrane deformation in response to a 20 V–20 µs pulse of a 2.5 mm silicon membrane with a P+ diffused heater.

The shape of the membrane during this oscillation is important in order to determine its interaction with the fluid being tested. As seen in Figure 9, the deformation shape does not follow the shape of the heater. Instead, it takes a circular shape due to the boundary constraints of the simply supported square membrane. As such, it is important to conclude that the shape of the membrane during actuation will be assumed to be the same independent of the size and shape of the heater.
4.1. Mode of Vibration
In order to observe the mode of vibration of the membranes we analyzed the shape of the membrane using two different excitation schemes. First we used a piezoelectric actuator to find the resonant frequency of the membranes and observed the vibration mode shape. This allowed us to verify the frequency and mode of vibration. Secondly, we used a burst heat excitation through the in situ membrane heaters to set the membrane to vibrate freely and then we captured one full cycle of the vibration. Both of these measurements were performed using the Dynamic MEMS (DMEMS) option of Veeco’s Wyko NT-1100TM real-time dynamic optical surface profiler. The DMEMS option allows the user to synchronize the actuator signal with profilometer measurements to obtain accurate measurements of the surface of the sample.
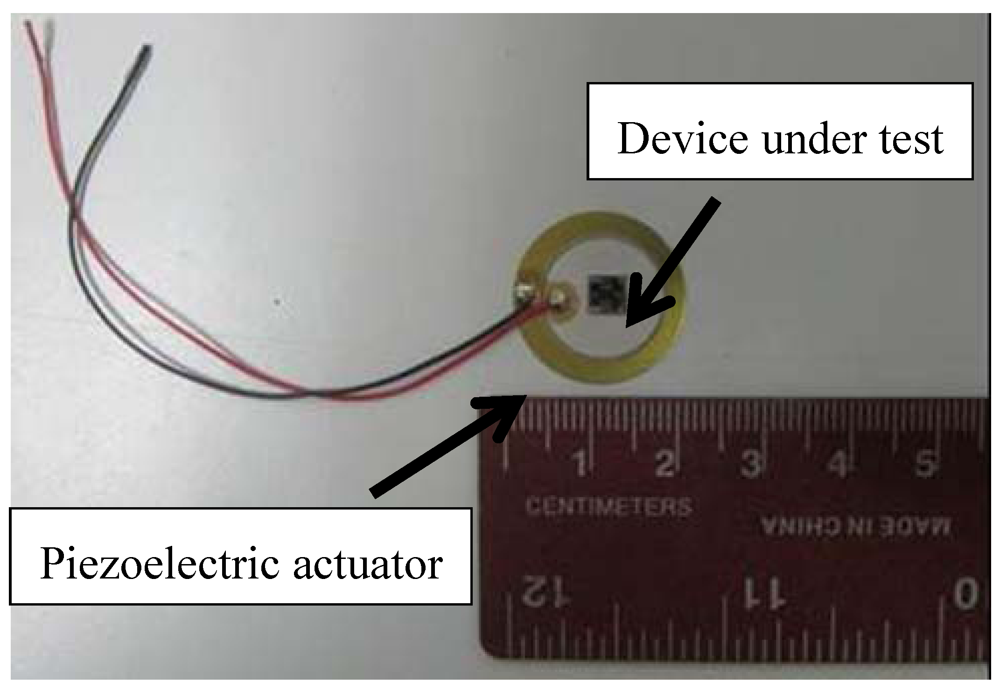
A fabricated device was affixed with epoxy to a piezoelectric actuator as shown in Figure 10. This piezoelectric actuator was biased with a high voltage by the DMEMS system and moved up and down. This movement also affected the devices, which were glued to its surface. The membrane of the device being tested was monitored by performing a surface profile measurement at a synchronized time interval. The frequency of the signal was increased until the surface profile indicated a resonant condition of the membrane. This happens when the deflection of the membrane dramatically increases with respect to the fixed frame of the structure. Once the frequency of resonance was determined, additional surface profiles were taken during one full cycle of resonance.
Figure 10.
Sensor glued to piezoelectric actuator to explore resonant frequency and mode of vibration of the membranes.
Figure 10.
Sensor glued to piezoelectric actuator to explore resonant frequency and mode of vibration of the membranes.

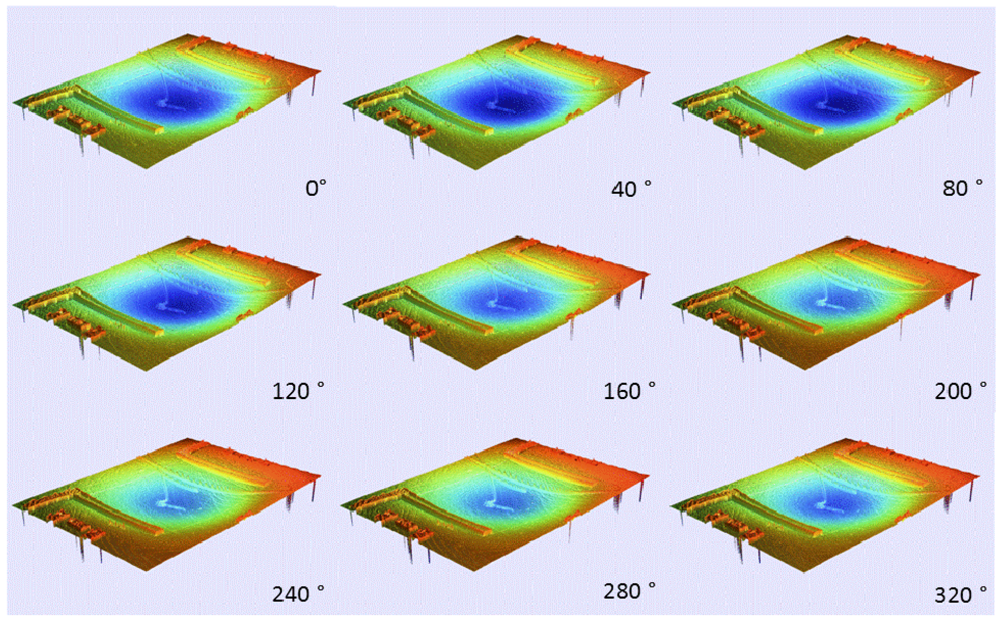
Figure 11 shows a composite of pictures illustrating a full oscillation cycle of a device with a P+ diffused heater in 40 degree increments. It can be observed that the membrane is originally down and it will oscillate up and down by a few nanometers. The data presented here shows that this displacement is not enough to break the original horizontal plane of the device. The measured resonant frequency of 14,500 Hz falls within the expected values for such a device. The mode of resonance is the fundamental mode, up and down in the center of the membrane, which is desired for the fluid measurements to be undertaken. The amplitude of the oscillation is relative to the amplitude of the actuator and is not relevant as it will be different, and much lower, when heat excitation is utilized.
Figure 11.
Full cycle of resonance of membrane actuated via a piezoelectric actuator.

This measurement is important because it confirms that the fabricated structures will vibrate in the (1,1) mode when excited at their natural frequency. The result confirms the validity of the boundary conditions assumed during both the analytical and simulation analysis. In the next section we analyze the vibration behavior of the membrane in response to heat excitation. If the shape and frequency of this vibration matches the results obtained here, it will indicate that the membrane is indeed vibrating at its natural frequency.
4.2. Free Vibration with Heat Excitation
The DMEMS measurement capabilities in the Wyko profilometer require that the movement of the structure to be measured is cyclical. The surface measurements are taken over several cycles at a determined time interval, which is synchronized with the actuation signal. As seen in the previous section, this is straightforward when the structure moves at the same frequency as the actuation signal. On the other hand, to measure the free vibration of a structure as a response to an impact load, as is the case in our devices, the measuring technique needs to be modified.
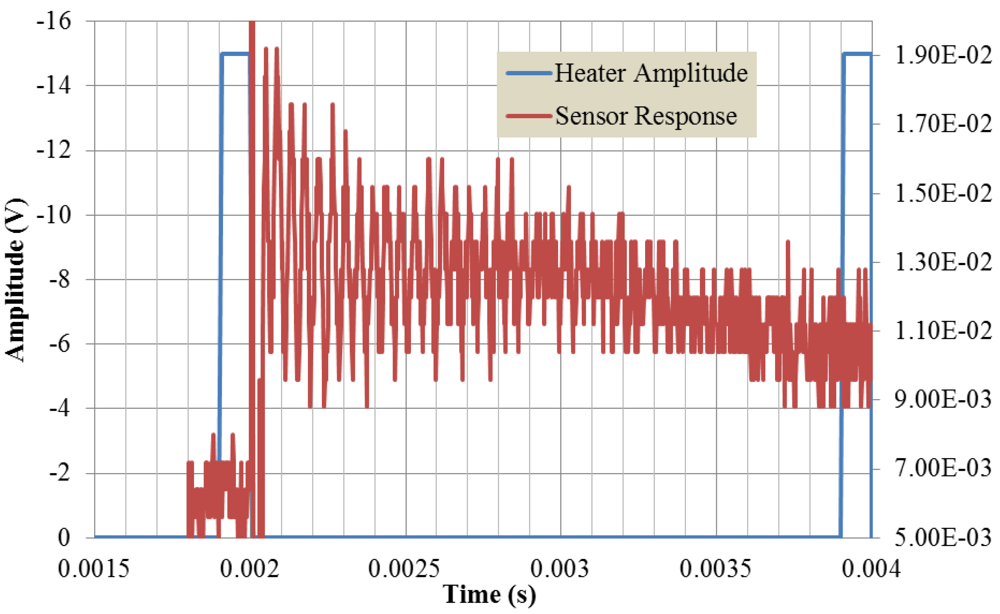
It is important to understand the nature of the excitation and the expected response of the structure in order to obtain accurate measurements. As such, an oscilloscope is used to electrically monitor the membrane movement. As can be seen in Figure 12, the membrane will start to oscillate as soon as the excitation signal is removed. The heater is rapidly increased to −15 V for 20 µs at the end of the cycle in order to line up the sensor response at t = 0 of the next cycle. The frequency of oscillation of this particular device, D11, is 17,224 Hz and the oscillation decays to noise level after 20 cycles or ~1 ms.
Figure 12.
Heat excitation and membrane signal output during profilometer measurements.

The actuation signal was set to a frequency of 500 Hz, which corresponds to a period of 2 ms. The Wyko tool will perform measurements at a given time interval according to this actuation signal frequency. Dividing this time period by the 360 degrees, which the tool assumes as the full cycle of the oscillations, results in 5.556 µs/degree.
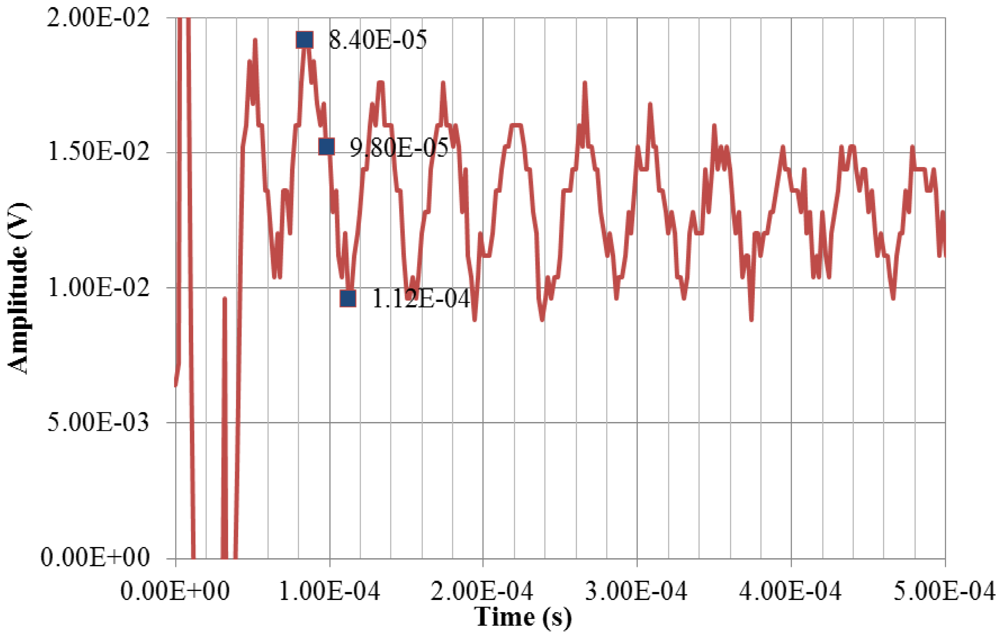
Figure 13.
Detail of membrane electrical signal output during profilometer measurements.

Figure 13 shows a close up view of the sensor signal. During the first few microseconds the signal is noisy. The measurements are taken during the second oscillation at t = 84 µs, 98 µs and 112 µs to obtain the maximum, middle and minimum position of the oscillation. These correspond to 15°, 17.5° and 20° of the actuator cycle respectively. The maximum value of this oscillation should be observed at 84 µs and the minimum at 112 µs. Knowing that the expected sensitivity is of 1.341 mV/µm, according to the calibration values obtained in the previous section, and keeping in mind that the output voltage has been amplified by a factor of 45 through an instrumentation amplifier, the oscillation level that we are trying to measure is of 290 nm.
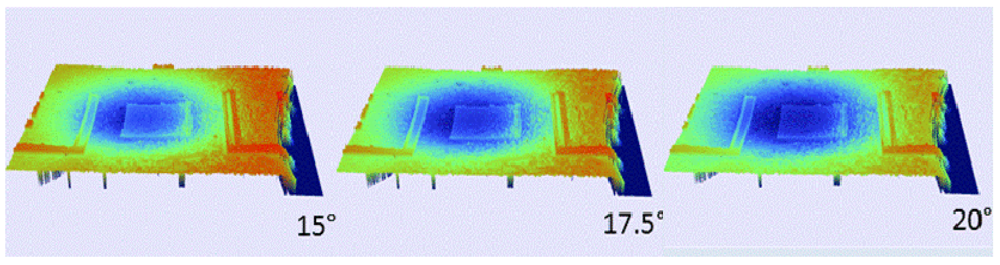
Figure 14.
Surface profile results at top, middle and bottom of oscillation. These measurements were taken with a Wyko profilometer on a thermally actuated membrane vibrating at 17 KHz. The cycle amplitude is measured to be about 190 nm.
Figure 14.
Surface profile results at top, middle and bottom of oscillation. These measurements were taken with a Wyko profilometer on a thermally actuated membrane vibrating at 17 KHz. The cycle amplitude is measured to be about 190 nm.

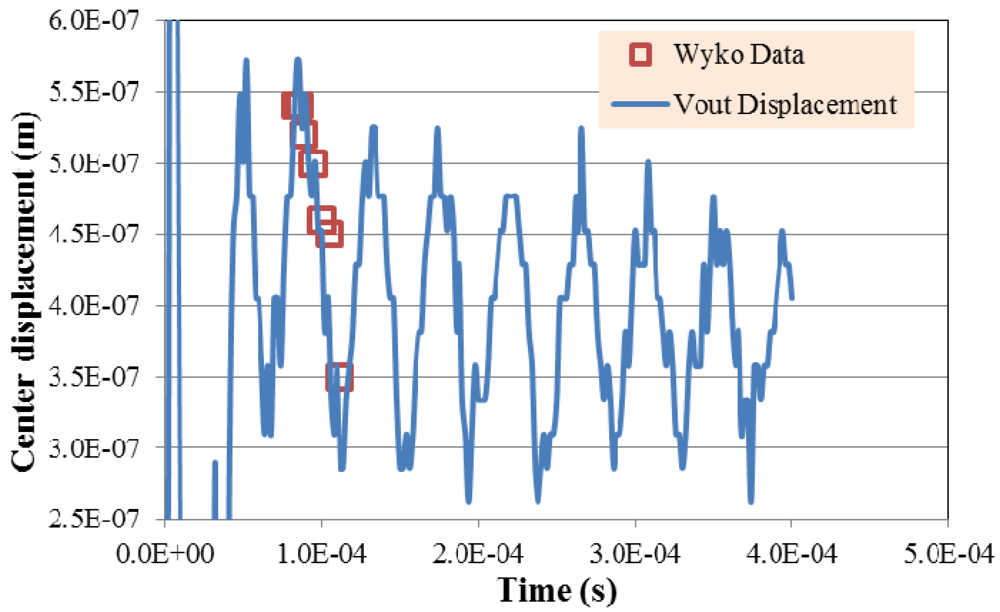
Figure 15.
Overlay of the electrical output and the center displacement measurements obtained with the Wyko profilometer for sensor D11 vibrating in air via heat excitation.
Figure 15.
Overlay of the electrical output and the center displacement measurements obtained with the Wyko profilometer for sensor D11 vibrating in air via heat excitation.

The resulting surface profiles are presented in Figure 14 for the maximum, center and minimum displacement points. The total displacement measured with this method is 190 nm. This number is comparable to the 60 nm obtained through simulation and analytical analysis and lower than the 290 nm obtained with the electrical measurements. Figure 14 shows a membrane with non-symmetrical deformation due to fabrication misalignment of the heater, such that the heater was not placed on the center of the membrane. Even with this non-ideal condition, the membrane displacement still resulted in a symmetrical deformation about the center of the membrane. This further confirms the simulation results, which indicated that the shape of the membrane during oscillation correspond to the (1,1) mode, irrespective of the shape or placement of the heating elements. Figure 15 shows the data extracted from the Wyko measurements overlaid with the data obtained from the electrical measurements in units of displacement (m), after the calibration factor has been applied. The data for the open square symbols was obtained by capturing surface profiles of the membrane at the indicated times and measuring the relative center displacement of the membrane.
This is the first time that the actual shape of a thermally-actuated micromachined silicon-membrane has been experimentally observed during thermally-induced vibrations. These observations confirm that the membrane is vibrating when excited with a burst of heat as predicted by the theory and the simulation. It also confirms that this vibration is at its fundamental natural frequency as a (1,1) mode. More importantly, the vibration amplitude matches both the electrical measurements and the simulation’s values. Moreover, these results also confirm that the static calibration is valid for dynamic measurements.
4. Conclusions
A Veeco Wyko NT-1100TM real-time dynamic optical surface profiler tool has been used to confirm the shape mode of vibration of a thermally actuated silicon membrane to be used as a viscosity sensor. Analytical and simulated results predicted a (1,1) resonant mode, which was conditioned by the assumption of a simply supported structure, at a frequency around 21,000 Hz and with a center displacement amplitude between 20 and 100 nm. The experimental measurements confirmed that the assumed boundary conditions were appropriate as a (1,1) resonant mode was also observed. Electrical and profilometer measurements indicated a vibration frequency of 17,100 Hz and center displacement amplitude of 290 nm and 190 nm respectively. These measurements confirm the validity of the theoretical analysis and simulation. Sources of error arise from the non-ideal silicon membrane and its fabrication variations in geometry and size. Also important is the fact that the profilometer results match the electrical measurements and confirm that these can be used to monitor the vibration of the membrane as the membrane is used as a sensor to measure fluid viscosity.
References
- Wang, J.; Ren, Z.; Nguyen, C. 1.156-GHz self-aligned vibrating micromechanical disk resonator. IEEE Trans. Ultrason. Ferroelectr. Freq. Control 2004, 51, 1607–1628. [Google Scholar] [CrossRef]
- Meyer, J.; Giesler, T. Micromachined acousto-gravimetric transducer with applications to biomedical sensing. In Proceedings of the Annual Conference on Engineering in Medicine and Biology, San Diego, CA, USA, 28-31 October, 1993; pp. 987–988.
- Mafsiwef, L.F. Application of Flexural Mechanical Resonators to Simultaneous Measurements of Liquid Density and Viscosity. In Proceedings of the 1999 IEEE Ultrasonics Symposium, Lake Tahoe, NV, USA, 17–20 October 1999; pp. 457–460.
- Hirai, Y.; Mori, R.; Kikuta, H.; Kato, N.; Inoute, K.; Tanaka, Y. Resonance characteristics of micro cantilever in liquid. Jpn. J. Appl. Phys. 1998, 37, 7064–7069. [Google Scholar]
- Andrews, M.; Harris, P. Damping and gas viscosity measurements using a microstructure. Sens. Actuat. A 1995, 49, 103–108. [Google Scholar] [CrossRef]
- Matsiev, L.F. Application of Flexural Mechanical Resonators to High Throughput Liquid Characterization. In Proceedings of the2000 IEEE Ultrasonics Symposium, San Juan, Puerto Rico, 22–25 October 2000; 1, pp. 427–434.
- Brand, O.; English, J.M.; Bidstrup, S.A.; Allen, M.G. Micromachined Viscosity Sensor for Real-Time Polymerization Monitoring. In Proceedings of the 1997 International Conference on Solid-State Sensors and Actuators, Chicago, IL, USA, 16–19 June 1997; 1, pp. 121–124.
- Demirci, M.U.; Nguyen, C. Higher-Mode Free-Free Beam Micromechanical Resonators. In Proceedings of the Frequency Control Symposium and PDA Exhibition Jointly with the 17th European Frequency and Time Forum, Tampa, FL, USA, 4–8 May 2003; pp. 810–818.
- Puchades, I.; Fuller, L.F. A Thermally Actuated Microelectromechanical (MEMS) device for measuring viscosity. J. MEMS 2011, 20, 601–608. [Google Scholar]
- Boley, B.; Weiner, J. Theory of Thermal Stresses; Krieger Publishing Company: Malabar, FL, USA, 1985. [Google Scholar]
- AL-Huniti, N.S.; Al-Nimr, M.A.; Meqdad, M.M. Thermally induced vibration in a thin plate under the wave heat conduction model. J. Therm. Stress. 2003, 26, 943–962. [Google Scholar] [CrossRef]
- Blevins, R.D. Formulas for Natural Frequency and Mode Shape; Van Nostrand Reinhold Company: New York, NY, USA, 1979. [Google Scholar]
- Puchades, I.; Fuller, L.F. Design and Evaluation of a MEMS Bimetallic Thermal Actuator for Viscosity Measurements. In Proceedings of the (University Government Industry Micro/nano) Symposium (UGIM 2008), Louisville, KY, USA, 13–16 July 2008; pp. 93–96.
- Arya, R.; Rashid, M.M.; Howard, D.; Collins, S.D.; Smith, R.L. Thermally actuated, bistable, oxide/silicon/metal membranes. J. Micromechanics Microengineering 2006, 16, 40–47. [Google Scholar] [CrossRef]
- Puers, R.; Cozma, A.; Bruyker, D.D. On the mechanisms in thermally actuated composite diaphragms. Sens. Actuat. A 1998, 67, 13–17. [Google Scholar] [CrossRef]
- Bongsang, K.; Jha, C.M.; White, T.; Candler, R.N.; Hopcroft, M.; Agarwal, M.; Park, K.K.; Melamud, R.; Chandorkar, S.; Kenny, T.W. Temperature Dependence of Quality Factor in MEMS Resonators. In Proceeding of the 19th IEEE International Conference on Micro Electro Mechanical Systems (MEMS 2006), 22–26 January 2006; pp. 590–593.
- Hopcroft, M.A.; Nix, W.D.; Kenny, T.W. What is the young’s modulus of silicon? J. MEMS 2010, 19, 229–238. [Google Scholar]
© 2012 by the authors; licensee MDPI, Basel, Switzerland. This article is an open-access article distributed under the terms and conditions of the Creative Commons Attribution license (http://creativecommons.org/licenses/by/3.0/).
Share and Cite
MDPI and ACS Style
Puchades, I.; Koz, M.; Fuller, L. Mechanical Vibrations of Thermally Actuated Silicon Membranes. Micromachines 2012, 3, 255-269. https://doi.org/10.3390/mi3020255
AMA Style
Puchades I, Koz M, Fuller L. Mechanical Vibrations of Thermally Actuated Silicon Membranes. Micromachines. 2012; 3(2):255-269. https://doi.org/10.3390/mi3020255
Chicago/Turabian StylePuchades, Ivan, Mustafa Koz, and Lynn Fuller. 2012. "Mechanical Vibrations of Thermally Actuated Silicon Membranes" Micromachines 3, no. 2: 255-269. https://doi.org/10.3390/mi3020255