Article

Temperature Frequency Characteristics of Hexamethyldisiloxane (HMDSO) Polymer Coated Rayleigh Surface Acoustic Wave (SAW) Resonators for Gas-Phase Sensor Applications

by
Karekin D. Esmeryan
,
Ivan D. Avramov
* and
Ekaterina I. Radeva
Georgi Nadjakov Institute of Solid State Physics, 72, Tzarigradsko Chaussee Blvd., 1784 Sofia, Bulgaria
*
Author to whom correspondence should be addressed.
Micromachines 2012, 3(2), 413-426; https://doi.org/10.3390/mi3020413
Submission received: 29 March 2012 / Revised: 18 April 2012 / Accepted: 27 April 2012 / Published: 2 May 2012
(This article belongs to the Special Issue Micromachined High Frequency Acoustic Wave Resonators and Filters)

Abstract

:
Temperature induced frequency shifts may compromise the sensor response of polymer coated acoustic wave gas-phase sensors operating in environments of variable temperature. To correct the sensor data with the temperature response of the sensor the latter must be known. This study presents and discusses temperature frequency characteristics (TFCs) of solid hexamethyldisiloxane (HMDSO) polymer coated sensor resonators using the Rayleigh surface acoustic wave (RSAW) mode on ST-cut quartz. Using a RF-plasma polymerization process, RSAW sensor resonators optimized for maximum gas sensitivity have been coated with chemosensitive HMDSO films at 4 different thicknesses: 50, 100, 150 and 250 nm. Their TFCs have been measured over a (−100 to +110) °C temperature range and compared to the TFC of an uncoated device. An exponential 2,500 ppm downshift of the resonant frequency and a 40 K downshift of the sensor’s turn-over temperature (TOT) are observed when the HMDSO thickness increases from 0 to 250 nm. A partial temperature compensation effect caused by the film is also observed. A third order polynomial fit provides excellent agreement with the experimental TFC curve. The frequency downshift due to mass loading by the film, the TOT and the temperature coefficients are unambiguously related to each other.

1. Introduction

The Rayleigh type surface acoustic wave (RSAW) mode has enjoyed considerable interest among the sensor community over the last three decades because of several unique features that are difficult or impossible to achieve with other technologies [1,2]. A two-port RSAW resonator coated with a chemosensitive polymer film makes an excellent high-resolution gas-phase sensor featuring fast response time, superb overall stability, high sensitivity and dynamic range and low sensor noise [3,4,5]. Such RSAW sensors currently find a variety of applications in sensor systems for analysis of chemical and biological gasses, medical diagnostics, electronic noses, environmental monitoring, etc. [6,7,8,9].
In most practical sensor systems precise temperature control is applied to the sensor devices and interface circuitry to eliminate undesired temperature induced frequency shifts that may corrupt the sensor readings. The sensor heads are typically kept at constant temperature using Peltier elements to provide reproducible results over a large number of measurement cycles. In portable and battery powered systems [10], however, that operate in environments of variable temperature [11] these measures are very difficult, even impossible to achieve since temperature control building blocks are bulky and consume a lot of power. This makes maintaining constant temperature in the system impossible. And despite the fact that in most cases the sensor devices are fabricated on temperature compensated cuts of piezoelectric quartz, temperature induced frequency shifts may compromise the response of the sensor to the gas of interest.
A well-known method for eliminating the temperature effect is to use a dual-delay-line sensor configuration in which one delay line is used as a reference and the other one as a sensor [12,13]. Then the beat frequency between both delay line channels that contains the sensor information is evaluated. In such a system it is assumed that temperature variation will cause equal frequency shifts in both delay line channels and therefore the beat frequency will be independent of temperature. Unfortunately, the dual-delay-line configuration is not the best choice for portable systems operating over a large temperature range. On one hand, it requires increased circuit complexity and higher battery power. On the other hand, a dual channel configuration operating on a low beat frequency is prone to injection locking—a problem that again requires even more sophisticated data extraction circuitry. The most serious problem, however is that it is extremely difficult and expensive to select two polymer coated delay lines with exactly the same temperature frequency characteristics (TFC) for precise temperature compensation of the beat frequency. Even small fabrication tolerances in the metallization parameters from device to device on the same wafer or variations of the polymer thickness may result in turn-over temperature (TOT) differences of the delay lines used [14,15,16]. This will result in significant measurement errors especially at the edges of the operating temperature range where small temperature variations result in large frequency shifts.
For all these reasons, in this paper, we consider the single channel system in which one sensor provides a composite sensor signal containing both: gas concentration data and temperature induced frequency shifts. If the TFC of the polymer coated sensor device is known and a simultaneous thermal measurement provides a temperature reading at the time of the gas concentration measurement, then the temperature induced sensor’s frequency shift at that temperature can be calculated and used for a precise correction of the sensor response to provide exact gas concentration data. This study shows how this is done with RSAW resonant sensors coated with solid hexamethyldisiloxane (HMDSO) polymer films that are widely used in a variety of gas detection systems [17]. Due to the precise experimental technology reproducible thin films are obtained with a very high deposition rate. Moreover, by changing the plasma polymerization conditions, the monomer flow rate and the current density of the glow discharge, HMDSO polymers with desirable gas sensitive properties in wide range can be synthesized. Systematic experimental data on the TFCs of 433 MHz sensors on ST-cut quartz coated with thin solid HMDSO films are provided. The influence of the HMDSO film thickness on the TOT and the shape of the quasi quadratic TFC are studied in detail. Second and third order polynomial coefficients for precise interpolation of the frequency shift versus temperature dependence are extracted from experimental data on the tested devices and can be used successfully in the temperature compensation algorithm.

2. Operation Principle of Polymer Coated RSAW Based Resonant Sensors

The operation principle of a polymer coated RSAW resonant gas-phase sensor, illustrated in Figure 1, is fairly simple. A two-port RSAW resonator fabricated on a temperature compensated cut of piezoelectric quartz, typically ST-cut for minimum temperature sensitivity at room temperature, is coated with a thin chemosensitive layer and mounted in a sensor head [5]. The sensing layer should feature physical sorption. This means that it should be able to adsorb gas molecules when a gas with a certain concentration is applied to it until equilibrium is reached. Then, when the gas is flushed away with dry air from the sensor head, all adsorbed gas molecules should restlessly escape from the layer.
Figure 1. Operation principle of a Rayleigh type surface acoustic wave (RSAW) resonant sensor coated with a chemosensitive film.
Micromachines 03 00413 g001
When the layer adsorbs gas molecules, it becomes heavier and the mass loading on the sensor surface increases. As a result, the SAW propagation velocity decreases and a frequency downshift ∆fs of the sensor resonance, referred to as “sensor signal” is observed. This is evident from Figure 2 that shows how a polymer coated 433 MHz RSAW resonator shifts its resonant frequency down by ∆fs = 38 KHz (88 ppm) as a result of tetrachloroethylene vapor probing at 1,000 ppm concentration. If that same measurement is performed at different temperatures, then a temperature induced frequency shift, according to the TFC of the sensor device, will be superimposed onto the sensor signal. Therefore, at constant gas concentration, the measurement will provide a different reading of the sensor signal at each temperature. This means that we deal with a composite sensor signal containing a gas concentration and temperature induced portion. The latter has to be precisely known and subtracted from the composite signal to obtain the true gas concentration reading.
Figure 2. Frequency responses (upper curves) and phase response (lower curve) of a polyisobutilene (PIB) coated RSAW sensor prior to (right curve) and after (left curve) tetrachloroethilene vapors are applied to the sensor surface.
Micromachines 03 00413 g002
If the sensor device from Figure 2 is used to stabilize the frequency of a feedback loop sensor oscillator then ∆fs can be precisely measured with a high-resolution frequency counter [5]. The short-term stability of the sensor oscillator will yield the detection limit or the minimum change in gas concentration that the sensor system can resolve [17]. The latter is called “resolution” of the sensor system and is easily calculated using the measured value of the oscillator’s short-term frequency fluctuations. If for the above 433 MHz sensor oscillator these fluctuations are within ±1 Hz/s, then the sensor resolution would be 38 Hz/ppm vapor concentration meaning that the system can resolve 26 ppb (parts per billion) in 1 s measurement time. In a practical sensor system, variation in temperature and gas concentration is a slow process, compared to the measurement time. Therefore, in this 1 s measurement time we assume that temperature and gas concentration variations do not cause significant dynamic frequency shifts during the measurement and the system records the sensor frequency at a static gas concentration and temperature.

3. The Temperature Sensitivity Problem

If a portable sensor system is intended to operate over a large temperature range then the temperature sensitivity of the sensor devices becomes a serious issue. This problem is illustrated with the example in Figure 3, which compares the sensitivity to changes in relative humidity (RH) of a RSAW resonant sensor, coated with 150 nm thick HMDSO polymer film (Figure 3(a)) with the TFC of that same sensor device measured over a (−80 to +100) °C temperature range (Figure 3(b)). It is evident that the 500 ppm temperature sensitivity of this sensor over that temperature range exceeds by a factor of 5 its sensitivity to RH changes that are within 100 ppm in the (25 to 100%) range. If the base line (0 frequency shift) for the vapor measurement is set at 25% RH and the TOT of −30 °C is used as a reference line for the temperature measurement, then, according to the data plots in Figure 3(a,b), at 70% RH and 25 °C the composite sensor reading will be 150 ppm. From this value, 100 ppm will be the temperature induced frequency shift (see Figure 3(b)) and only 50 ppm will be the actual sensor response to the 45% relative humidity change (from 25 to 70%) that we are interested in (see Figure 3(a)). This example illustrates the necessity of a precise correction of the sensor readings with temperature induced frequency shifts if gas concentration measurements are performed in the above temperature range. This, in turn, requires an additional temperature measurement with each gas concentration measurement, exact knowledge of the TFC of the coated RSAW device and a calculation or look-up table (LUT) for correct reading of the compensation value. In the next sections we will discuss the influence of the HMDSO film on the TFCs of coated RSAW sensors and will provide temperature coefficient data that can be used for successful temperature compensation of the sensor readings.
Figure 3. (a) Humidity sensing characteristic of a 150 nm hexamethyldisiloxane (HMDSO) polymer coated RSAW resonant sensor and (b) its temperature frequency characteristic over a (−80 to +100) °C temperature range.
Micromachines 03 00413 g003

4. Experimental Work

In this section we will briefly describe the RSAW resonant devices, the HMDSO polymer coating method and the measurement of the TFCs of the coated devices.

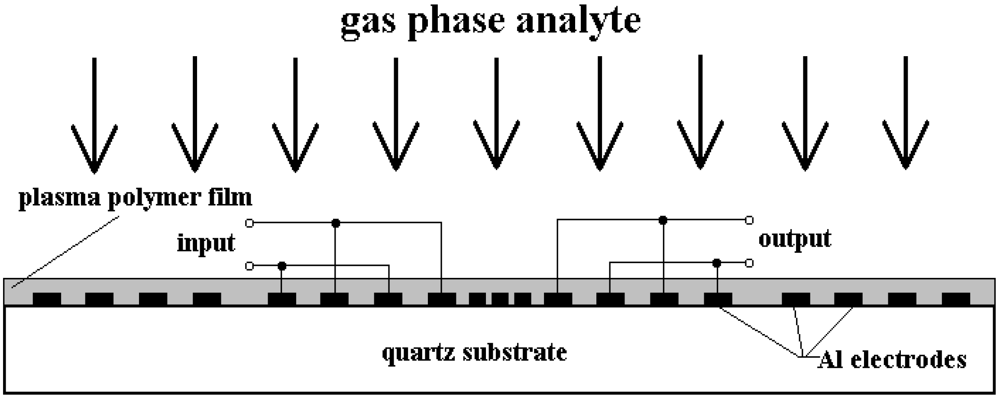
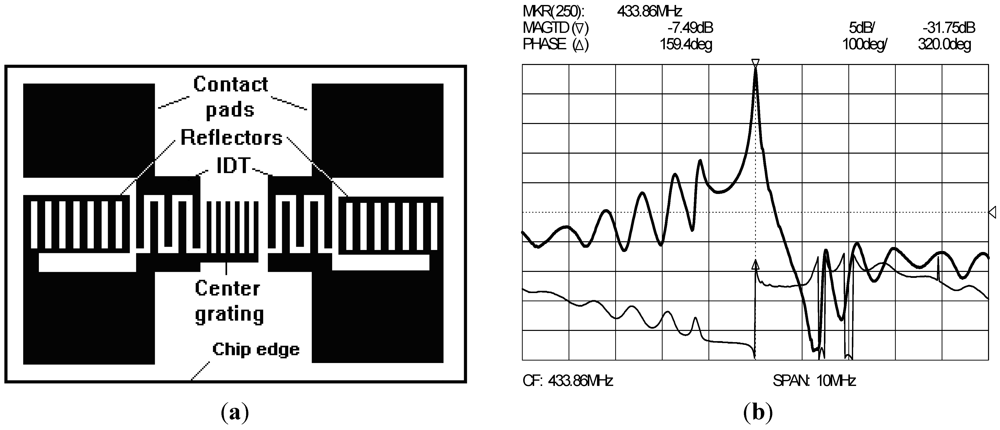
4.1. The RSAW Sensor Resonators

In our SAW sensor work we prefer to use two-port resonators on temperature compensated cuts of quartz rather than SAW delay lines. The reason is that, even after coating with the chemosensitive film, two-port resonators retain much lower unmatched device insertion loss and higher Q than their delay line counterparts [17] and thus provide much less noise in the sensor oscillator. Not every two-port resonator design, however, is appropriate for gas sensor applications. A two-port resonator, designed for maximum Q in communication applications rarely makes a good sensor device since its loaded Q and insertion loss degrade very rapidly with film coating. Care has to be taken to design the sensor device in such a manner that it can tolerate fairly thick chemosensitive films without serious degradation of loss and loaded Q while providing maximum gas sensitivity. This is achieved by maximizing the electrical coupling to the load and extending the active resonance zone to a maximum while retaining single mode operation. Design details of an excellent sensor resonator, using a corrosion proof gold electrode structure for operation in highly reactive gas phase environments, are provided in [18]. The layout schematic of the RSAW sensor device that we used here is shown in Figure 4(a). As with any two-port SAW resonator, it consists of two interdigital transducers (IDT), two periodic reflector gratings to form a standing wave pattern and a center waveguide grating for acoustic coupling between input and output IDT. Strong coupling to the load is achieved by carefully optimizing the number of finger pairs in each IDT and the acoustic aperture. Maximum gas sensitivity is achieved by maximizing the center grating length while maintaining a single well-behaved resonance such as the one characterized in Figure 4(b). The sensor devices of this type that we used in this study have a typical uncoated insertion loss in the 6 to 8 dB range and a loaded Q of about 5,000. After HMDSO film coating at 250 nm thickness the loss increased up to about 12 dB and the loaded Q degraded to about 2,000. These values are good enough to build a sensor oscillator with 1 × 10⁻⁹/s short term stability as required for high-resolution gas concentration measurements.
Figure 4. (a) Layout schematic of a typical two-port RSAW sensor resonator and (b) frequency (upper curve) and phase (lower curve) responses of the uncoated RSAW device used in this work.
Micromachines 03 00413 g004

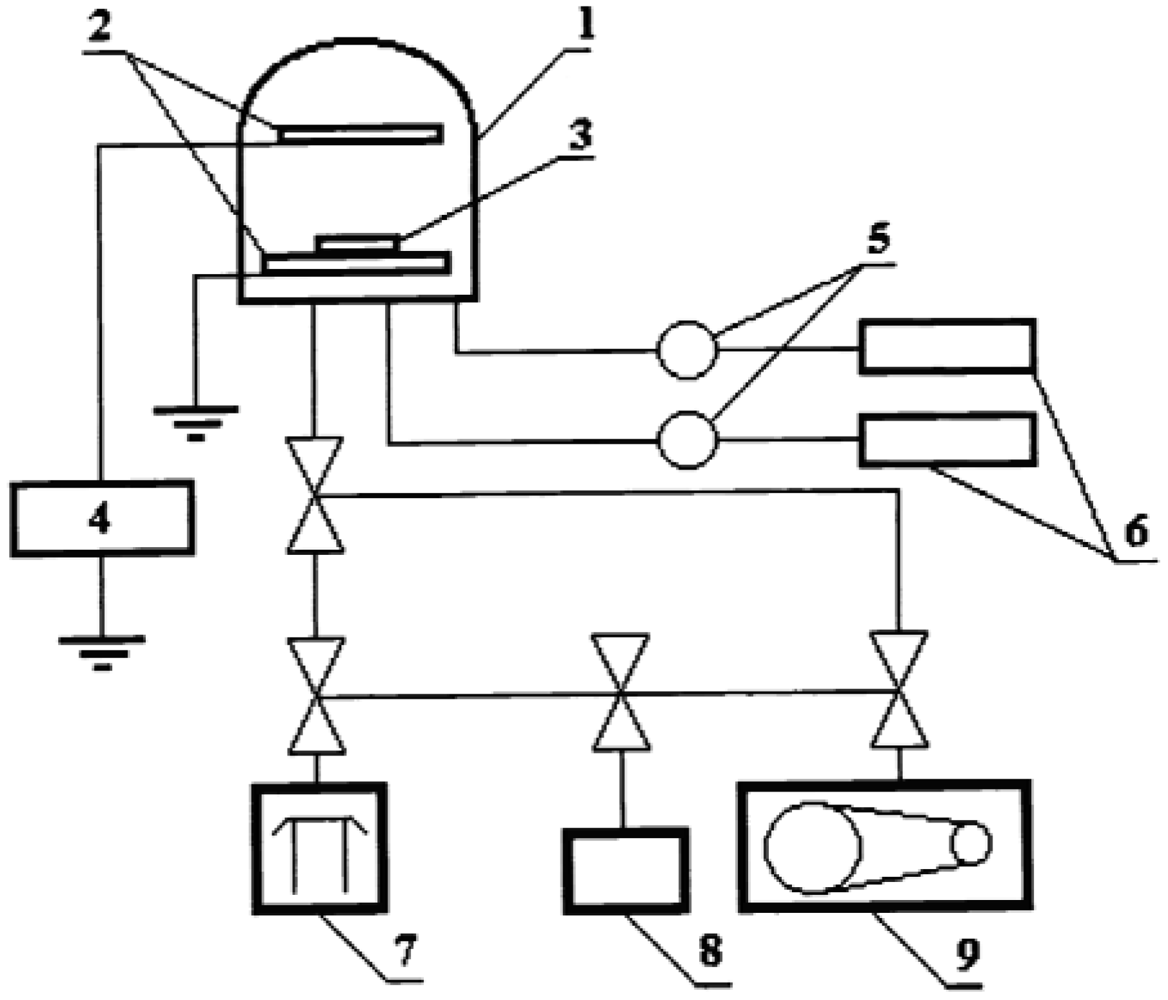
4.2. The HMDSO Deposition System

The HMDSO polymer is obtained from an organosilicon monomer in a plasma polymerization process. This type of polymer has been used for over a decade in a variety of sensor applications since it has several very attractive features. On one hand, it allows well controlled and reproducible high deposition rates. On the other hand, tailoring the physical and chemical properties to specific applications such as depth of the surface sorption and sensitivity to certain chemical compounds is possible by doping and controlling the process parameters. HMDSO polymer films have a highly branched and cross linked structure, resulting in excellent adhesion to almost every substrate. They are mechanically stable over temperature and time and do not change their sensitivity over many cycles of gas probing. Due to surface sorption they feature fast response times and quickly desorb the amount of the measured gas. Finally, they are stiff and highly elastic and do not seriously degrade the loss and Q of the acoustic wave resonator as explained in the previous section.
The schematic and building blocks of the RF plasma reactor that we used for HMDSO polymer deposition are shown in Figure 5. In the reactor chamber (1), the capacitively coupled glow discharge RF current is generated between two horizontally aligned electrodes (2) placed 60 mm above each other. This current is used to create low temperature plasma from Merck HMDSO monomer at >99% concentration, which is dispersed as gas in the chamber. The plasma excitation of the monomer gas is performed at 27.12 MHz using a RF power generator (VEM Inducal Berlin, Germany). The optimum monomer flow rate of 2.0 L/h is adjusted and controlled by a gas flow controller (GMR, NOVIS, Bulgaria). The current density is set at 0.16 mA/cm2. Polymerized HMDSO polymer films build up onto the surface of the RSAW resonators placed on a Teflon plate (3) which serves as a sample holder. The polymer thickness is estimated from the frequency readings of a mass-sensitive quartz crystal microbalance (QCM) before and after HMDSO polymer deposition.
Figure 5. Schematic of the RF plasma reactor for HMDSO polymer deposition: 1—reactor chamber; 2—electrodes; 3—sample holder; 4—generator; 5—microvalves; 6—containers for monomers; 7—diffusion pump; 8—vacuum balloon and 9—rotary pump.
Micromachines 03 00413 g005

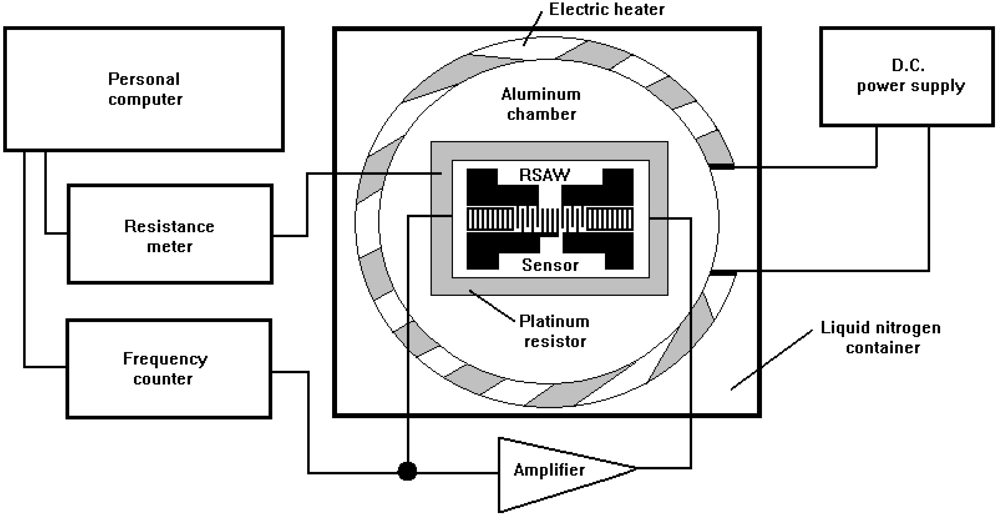
4.3. The TFC Measurement Setup

The block diagram of the setup for automatic TFC measurement on the coated RSAW sensors is shown in Figure 6. The sensor device is placed inside an aluminum (Al) chamber on top of a calibrated platinum (Pt) resistor used as temperature sensor. The sensor has good thermal contact with the RSAW device and the bottom of the chamber which is a massive Al cylinder with a machined-out cavity closed with a thick removable Al cover. This arrangement minimizes thermal gradients between the chamber, RSAW device and Pt sensor during the temperature measurement. An electric heater mounted around the Al chamber is used for heating the system. The chamber with heater is placed in a penopolyurethane foam container holding the liquid nitrogen used for cooling. The RSAW sensor is connected via long coaxial cables to a broadband amplifier forming a feedback loop sensor oscillator. The amplifier is placed outside the chamber at room temperature to avoid possible temperature induced electrical phase shifts that may corrupt the frequency data. The temperature dependent frequency of the sensor oscillator is measured by a high-resolution frequency counter while the temperature data are extracted by a resistance meter connected to the Pt resistor. A personal computer controls the frequency counter and resistance meter and processes the data in real time presenting the TFC on the computer screen. Before the measurement starts, liquid nitrogen is added to the penoplyurethane container until the system is cooled down to about −100 °C. Then the heater power is slowly turned up until stable temperature readings are obtained. Temperature-frequency data pairs are stored in the computer in 2 K steps until the temperature increases up to about 110 °C. Then the measurement is terminated. About 6 h is required for an accurate and gradient free TFC measurement over the −100 to +110 °C range.
Figure 6. Block schematic of the temperature frequency characteristics (TFC) measurement setup.
Micromachines 03 00413 g006

5. Results and Discussion

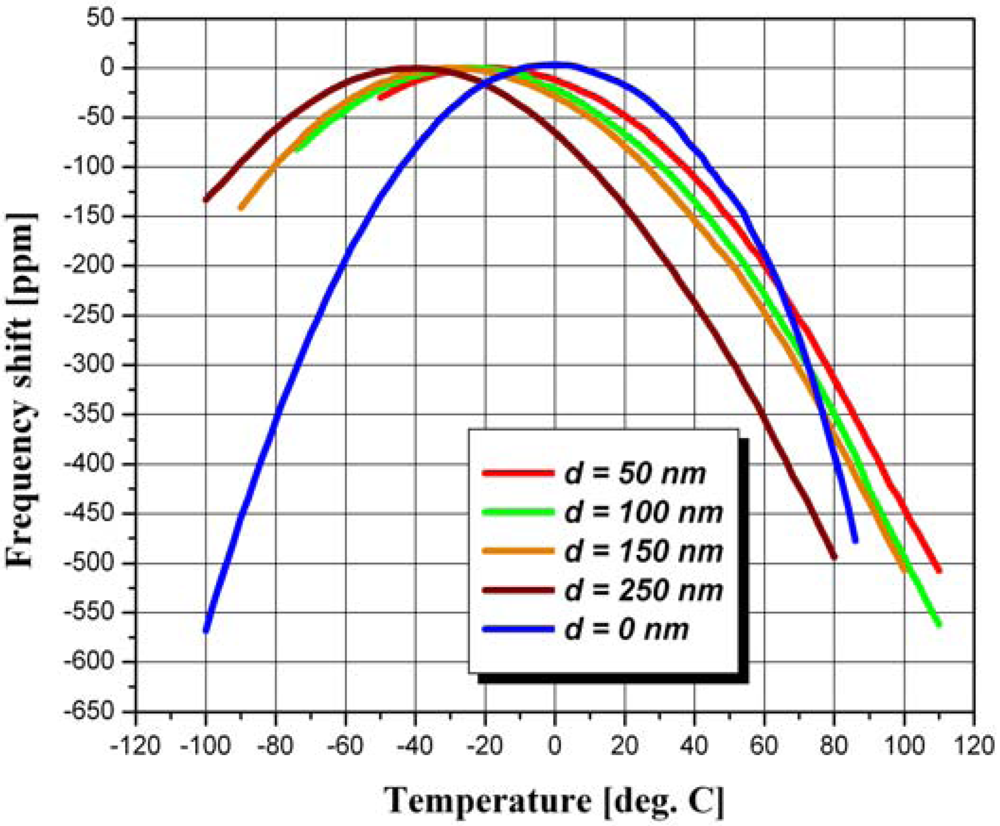
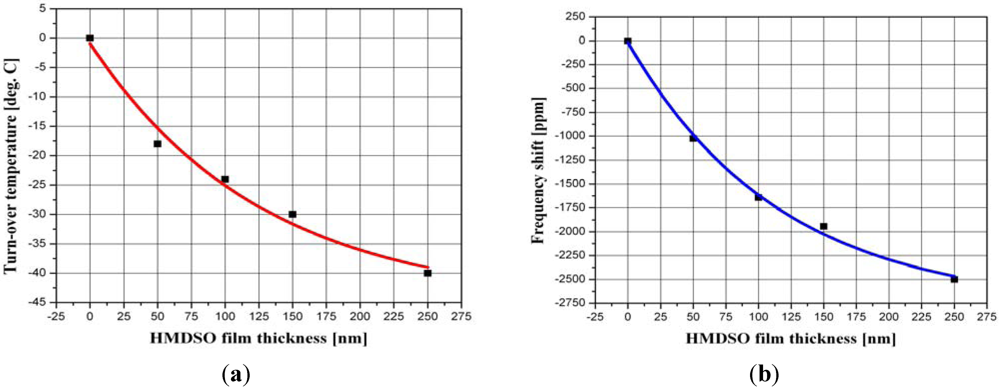
5.1. Influence of the HMDSO Polymer Thickness on the Resonance Frequency and the Turn-Over Temperature in RSAW Resonant Sensors

The TFCs of RSAW sensors coated at 4 different polymer thicknesses, including an uncoated sensor are compared in Figure 7. These data plots show that the stiff polymer film does not only shift down the device (TOT) but also changes the slopes of the parabolic TFC curve. These slopes become less steep, which means that a slight improvement of the overall temperature stability of the sensor, compared to the uncoated device, can be expected as a result of polymer deposition. Similar behavior has been reported also by other authors that have used SiO2 overlays on LiNbO3 and LiTaO3 [19,20,21]. On the other hand, the TOT versus polymer thickness has a very similar exponential behavior as the resonance frequency shift that occurs as a result of increased mass loading on the RSAW device surface caused by the HMDSO film. Both dependencies are compared in Figure 8(a,b) accordingly. This means that once the resonance frequency shift of the RSAW sensor at a certain polymer thickness is known (see Figure 8(b)), the actual turn-over temperature of that sensor can also be predicted according to Figure 8(a)). Then, if the temperature coefficients of the TFC are known at that thickness, the overall temperature induced frequency shifts at the edges of the temperature range of interest can also be estimated even without a detailed TFC measurement. This, however, does not mean that these predictions can be accurate enough to perform a precise separation of the gas concentration data from temperature induced frequency shifts. Since due to Al film thickness variation there is always a slight variation of the TOT from device to device even on the same quartz wafer the uncertainties of such predictions would result in unacceptably high compensation errors. Therefore, for precise temperature correction of the sensor data, an accurate TFC measurement according to Section 4.3 is required.
Figure 7. TFCs of HMDSO polymer coated RSAW sensors at 4 different film thicknesses compared to an uncoated sensor.
Micromachines 03 00413 g007
Figure 8. (a) Turn-over temperature and (b) resonance frequency shift versus HMDSO polymer thickness in RSAW based resonance sensors. The red and blue curves are exponential fits.
Micromachines 03 00413 g008

5.2. Temperature Coefficients of the TFC Dependencies

As shown in [22], the complete temperature dependence of a SAW resonator is represented by the relationship:
Micromachines 03 00413 i001
where Δf is the temperature induced frequency shift, f0 is the resonant frequency, T is the absolute temperature and T0 is a reference temperature which is in our case the turn-over temperature (TOT). The coefficients a0, b0 and c0 are the first, second and third order temperature coefficients, respectively, that depend on the elastic constants at the selected crystal cut orientation. For ST-cut quartz the first order temperature coefficient is 0 and the third order one is negligibly small so that Equation (1) results in parabolic temperature dependence.
A practical sensor operates over a range of absolute temperatures and, as shown in Figure 8(a), T0 of the TFC will shift down as the HMDSO polymer thickness increases. This is also evident from the data plots in Figure 7. Since the coated RSAW resonator is fabricated on ST-cut quartz, a close to parabolic TFC dependence is still to be expected, however, we found that the following equation provides a better fit to the experimental data in Figure 7.
Micromachines 03 00413 i002
Here the coefficients a and b are responsible for the TFC shift as a result of polymer deposition while c and d determine the curvature, i.e., the slopes and symmetry of the TFC dependence. Ideally, since the devices are fabricated on ST-cut quartz, the third order coefficient d should be 0 which would reduce Equation (2) to a quadratic dependence. However, as shown by the data plots in Figure 9(a,b), a third order polynomial fit in which d ≠ 0 provides a better agreement with the experimental data than a second order polynomial fit in which d = 0. The discrepancy between experiment and second order fit in this case is clearly seen at around −30 °C and at the lower temperature edge of −100 °C in Figure 9(a). The third order fit on the other hand (see red curve in Figure 9(b)) is in perfect agreement with the experimental data plot (in black). This leads us to the conclusion that the TFC of a polymer coated RSAW sensor contains a small third order term that should not be neglected if precise temperature correction of the sensor data is aimed at.
Figure 9. (a) Experimental (black) and second order polynomial fit (red) of the TFC data from the 150 nm HMDSO polymer coated RSAW device and (b) the same data plot (black) but interpolated with a third order polynomial fit (red).
Micromachines 03 00413 g009
Table 1 and Table 2 compare the coefficients of Equation 2 for the second order and third order polynomial fit of the experimental data for all 5 devices from Figure 7. As evident from the right-most column in Table 2 the cubic coefficient d is about three orders of magnitude smaller than the quadratic coefficient c but it results in the difference seen in Figure 9(a) versus (b).
Table 1. Coefficients of the second order polynomial fit for the 5 TFCs in Figure 7.
Thichness [nm]ab [K−1]c [K−2]
03.76864−0.04955−0.03143
50−12.8912−1.24357−0.03153
100−21.41928−1.56463−0.03161
150−28.29861−1.72997−0.03167
250−63.55321−2.79867−0.03435
Table 2. Coefficients of the third order polynomial fit for the 5 TFCs in Figure 7.
Thichness [nm]ab [K−1]c [K−2]d [K−3]
04.4180.04149−0.0318−1.76656E-5
50−10.6505−1.27397−0.033042.4608E-5
100−20.26231−1.62035−0.032321.32147E-5
150−27.49848−1.88854−0.03212.90786E-5
250−65.73898−3.00826−0.0334.49081E-5
As evident from the data in Figure 8 and Table 2, the polymer thickness, the resonant frequency shift, the TOT shift, and the third order polynomial fit coefficients are unambiguously related to each other. Once the TOT of the uncoated device is known and a measurement of the resonant frequency is performed prior to and after polymer deposition, the resonant frequency shift due to polymer mass loading is enough to predict the TOT point and calculate the entire TFC with Equation (2) and the polynomial fit coefficients from Table 2 without even measuring it.
Also, a compensation of the T0 shift of the coated device and its adjustment at a desired temperature is possible by a crystal cut correction using the cut orientation dependence from Figure 8 in [23]. If we take, for example, the 150 nm coated ST-cut device whose T0 is shifted down to −30 °C according to Figure 8(a), then by using the data in Figure 8 from [23], the quartz cut orientation has to be corrected from −42 for ST-cut to −38° rotated Y-cut to move T0 to +25 °C (room temperature). Keeping in mind that the standard temperature operation range of portable systems is (−45 to +85) °C, such a cut orientation correction would result in a greatly improved overall temperature stability of the polymer coated sensor, which in this case would not exceed 150 ppm at the extreme edges of this 130 K temperature span on both sides of T0. Without cut correction the temperature induced frequency shift at +85 °C would be 450 ppm (3 times larger) as shown by the data plot in Figure 8(b).

6. Conclusions

This study has provided experimental data on the temperature stability of ST-cut resonant sensors coated with glassy HMDSO polymer films for gas sensor applications. As a result of mass loading on the surface of the RSAW device, an exponential downshift of the resonant frequency and device turn-over temperature vs. HMDSO polymer thickness is observed. The parabolic shape of the TFC dependence is retained, however, a slight temperature compensation effect that results in less steep slopes of the TFC curves on both sides of the turn-over temperature is observed as a result of polymer deposition. We found that, compared to a second order polynomial fit, a third order fit provides better and nearly perfect agreement with the experimental data, although its cubic coefficient is much smaller than the quadratic coefficient responsible for the parabolic TFC shape. HMDSO film thickness, resonant frequency shift, turn-over temperature and the third order polynomial fit coefficients are unambiguously related with each other. Thus, just by measuring the resonance frequency prior to and after the film deposition, it is possible to predict the TFC and its turn-over point and estimate the sensor’s overall thermal stability over the temperature range of interest, without measuring the TFC. If a sensor is coated at a desired HMDSO polymer thickness, this allows adjustment of its turn-over point at a desired temperature, e.g., room temperature, by a correction of the crystal cut orientation. For precise temperature correction of the gas concentration readings, however, a full TFC measurement is required.
This work concerns the temperature performance and compensation of RSAW based resonant sensors on ST-cut quartz that are coated with solid chemosensitive HMDSO polymer films. The authors believe that the data provided and the thermal compensation method suggested may be useful to those designing RSAW based gas sensor systems with solid chemosensitive layers that operate over a large temperature variation range. Semisolid and soft (rubbery) polymer films that feature better sorption properties and higher sensitivities than their solid polymer counterparts will also affect the temperature behavior of the sensors but in a different way. Further work with those films is of practical interest and is planed in the near future.

Acknowledgments

The authors wish to gratefully acknowledge SAW Components Dresden GmbH in Germany for fabricating the RSAW resonators and the Research Center Karlsruhe for providing them for use in this study.

References

  1. White, R.M. Surface acoustic wave sensors. In Proceedings of IEEE 1985 Ultrasonics Symposium, San Francisco, CA, USA, 16–18 October 1985; pp. 490–494.
  2. White, R.M. Acoustic sensors for physical, chemical and biochemical applications. In Proceedings of IEEE 1998 International Frequency Control Symposium, Pasadena, CA, USA, 27–29 May 1998; pp. 587–594.
  3. Barie, N.; Rapp, M.; Ache, H.J. UV crosslinked polysiloxanes as new coatingmaterials for SAW devices with high long-term stability. Sens. Actuat. B Chem. 1998, B46, 97–103. [Google Scholar]
  4. Bender, F.; Waechter, L.; Voigt, A.; Rapp, M. Deposition of high-quality coatings on SAW sensors using electrospray. In Proceedings of IEEE Sensors Conference, Toronto, ON, Canada, 22–24 October 2003; 1, pp. 115–119.
  5. Rapp, M.; Reibel, J.; Stier, S.; Voigt, A.; Bahlo, J. SAGAS: Gas Analyzing sensor systems based on surface acoustic wave devices—An issue of commercialization of SAW sensor technology. In Proceedings of IEEE International Frequency Control Symposium, Orlando, FL, USA, 28–30 May 1997; pp. 129–132.
  6. Staples, E.J. Dioxin/furan detection and analysis using a saw based electronic nose. In Proceedings of IEEE 1998 Ultrasonics Symposium, Sendai, Japan, 5–8 October 1998; 1, pp. 521–524.
  7. Staples, E.J.; Matsuda, T.; Viswanathan, S. Real time environmental screening of air, water and soil matrices using a novel field portable GC/SAW system. In Proceedings of the Environmental Strategies for the 21st Century Asia Pacific Conference, Singapore, April 1998; pp. 8–10.
  8. Frye, G.C.; Martin, S.J. Dual output acoustic wave sensor for molecular identification. In Proceedings of 1991 International Conference on Solid-State Sensors and ActuatorsTRANSDUCERS ’91, San Francisco, CA, USA, 24–27 June1991; pp. 566–569.
  9. Wessa, T.; Kueppers, S.; Mann, G.; Rapp, M.; Reibel, J. On-line monitoring of process HPLC by sensors. Organ. Process Res. Dev. 2000, 4, 102–106. [Google Scholar]
  10. Frye, G.C.; Martin, S.J.; Cerenosek, R.W.; Pfeifer, K.B.; Anderson, J.S. Portable acoustic wave sensor systems. In Proceedings of IEEE Ultrasonics Symposium, Lake Buena Vista, FL, USA, 8–11 December 1991; pp. 311–316.
  11. Zhang, P.; Chen, M.; He, P.; Ma, R. Study on surface acoustic wave CO gas sensor based on electroactive polymers. Yadian yu Shengguang/Piezoelectrics and Acoustooptics 2010, 32, 709–712. [Google Scholar]
  12. Wang, W.; He, S.; Li, S.; Liu, M.; Pan, Y. Advances in SXFA-coated SAW chemical sensors for organophosphorous compound detection. Sensors 2011, 11, 1526–1541. [Google Scholar]
  13. Ayala, V.C.; Eisele, D.; Reindl, L.; Josse, F. Temperature stability analysis of LGS for SH-SAW sensor applications. In Proceedings of 2010 IEEE International Frequency Control Symposium, Newport Beach, CA, USA, 1–4 June 2010; pp. 142–145.
  14. Shimizu, Y.; Terazaki, A.; Sakaue, T. Temperature dependence of SAW velocity for metal film on α-quartz. In Proceedings of IEEE Ultrasonics Symposium, Annapolis, MD, USA, 29 September–1 October 1976; pp. 519–522.
  15. Henry, E.; Ballandras, S.; Bigler, E.; Marianneau, G.; Martin, G.; Camou, S. Influence of metallization on temperature stability of SAW devices. In Proceedings of IEEE Ultrasonics Symposium, Toronto, ON, Canada, 5–8 October 1997; 1, pp. 221–225.
  16. Chung, M.-H.; Wang, S.T.; Huang, A.C.S. Study of frequency-temperature characteristics of quartz with various cut angle and metal thickness of electrode. In Proceedings of the 2004 IEEE International Frequency Control Symposium and Exposition, Montreal, QC, Canada, 23–27 August 2004; pp. 617–620.
  17. Avramov, I.D. Polymer coated rayleigh SAW and STW resonators for gas sensor applications. In Acoustic Waves—From Microdevices to Helioseismology; Beghi, M.G., Ed.; 2011; pp. 521–546, Chapter 23. [Google Scholar]
  18. Avramov, I.D.; Voigt, A.; Rapp, M. Rayleigh SAW resonators using gold electrode structure for gas sensor applications in chemically reactive environments. IEE Electron. Lett. 2005, 41, 450–452. [Google Scholar]
  19. Parker, T.E. SiO2 film overlays for temperature stable surface acoustic wave devices. Appl. Phys. Lett. 1975, 26, 75–77. [Google Scholar] [CrossRef]
  20. Yin, J.H.; Wu, W.Q.; Zhang, D.; Shu, Y.A. Temperature characteristics of rayleigh wave in SiO2/128" Y-X LiNbO3 structure. In Proceedings of IEEE Ultrasonics Symposium, Denver, Co, USA, 14–16 October 1987; 1, pp. 237–240.
  21. Cheng, C.-C.; Chung, C.-J.; Chen, Y.-C.; Kao, K.-S. Temperature effect on the characteristics of surface acoustic wave on SiO2 thin films. In Proceedings of 2004 IEEE Ultrasonics Symposium, Montreal, QC, Canada, 23–27 August 2004; 3, pp. 1884–1887.
  22. Hawkes, P.W. Sensitivity to external perturbations and the design of detectors. In Advances in Electronics and Electron Physics; Academic Press, Inc.: Sand Diego, CA, USA, 1990; Volume 77, pp. 125–127. [Google Scholar]
  23. Parker, T.E.; Montress, G.K. Precision surface-acoustic-wave (SAW) oscillators. In Proceedings of Transaction on UltrasonicsFerroelectrics and Frequency Control, Chicago, IL, USA, May 1988; 35, pp. 342–364.

