1. Introduction
Emerging interest in microfluidic machines that directly utilize fluidic energy to execute core operations has prompted the development of self-regulated machines that, by virtue of their autonomous operation, have also garnered much attention as potential platforms for basic biomedical research [
1,
2,
3].
Biological and physiological systems are fundamentally regulated by oscillatory processes operating at discrete spatial and temporal scales. Our understanding of these systems, consequently, has benefited from the development of pulsatile stimulation techniques capable of manipulating the temporal dynamics of these processes and investigating the role of timing within them. Historically, the
in vitro study of these processes in cultured cells was advanced primarily by two types of assays: one in which a single stimulus is bath-applied and later washed off (e.g., pulse-chase analysis [
4,
5], and BrdU “birth dating” [
6]); and one in which a continuous long-term temporal stimulation pattern is applied by way of an external control apparatus [
7]. Advancements in microfluidic technology have catalyzed the translation of such assays, in parallel with the development of novel counterparts, to forms supported by these emerging micro-scale—“lab-on-a-chip”—platforms [
8,
9,
10,
11].
Microfluidic devices often emulate electronic circuitry and utilize integrated conduits and embedded valves to direct and manipulate fluid flows. The control systems underlying their operation, however, have typically remained external from the fluidic devices themselves [
12,
13,
14]. An awareness that this rise in peripheral equipment cost may limit “next-generation” microfluidic systems has motivated the development of autonomous, pre-programmed, fluidic systems [
1,
12,
13,
14,
15,
16,
17]. Foremost among these is the microfluidic oscillator [
18].
Not unlike how electronic oscillators were among the first broadly adopted automated electrical circuits; self-oscillating microfluidic devices provide a simple, yet useful, first target for microfluidic automation [
1,
2] as evidenced by the growing body of literature describing experimental methods, wherein cells cultured within micro-devices are chemically stimulated in a pulsatile, rather than continuous, manner [
8,
10,
19,
20]. One such method for cellular interrogation modifies stimulation events by altering the duration of an applied stimulus and/or rest period; effectively manipulating the oscillation frequency and duty cycle of the stimulatory system [
19]. Through this approach, it has been observed that different responses may be elicited from the same population of cells by manipulating these stimulatory parameters.
The work presented here was motivated by the questions: how can a single microfluidic oscillator circuit be designed to best support multiple stimulatory frequencies and rest periods; and how can this be done in a manner that is easy to understand and perform by non-microfluidic experts? We have previously demonstrated the ability to alter oscillation frequency by modifying flow rate, and to alter duty cycle by modifying the device itself [
1,
2]. As the technical burden of repeatedly designing and fabricating different devices for each desired duty cycle is both difficult and tedious; we asked if a continuous and predictable modification of duty cycle could be achieved by simply modifying the syringes used to provide volumetric inflow.
The challenge associated with modifying volumetric inflow rate lies in the effect this may have upon the threshold opening pressure of each valve [
21]. Due to the complexity of the relationship between volumetric flow rate and duty cycle, predicting the duty cycle resulting from a change in volumetric flow rate is not trivial. Additional challenges arise if two syringe pumps are used to generate differing volumetric inflows, owing largely to inherent pump-to-pump variability and general inflow rate unsteadiness that may produce unstable oscillations [
22]. Here we report the predictable modulation of duty cycle using two syringes mounted upon a single syringe pump such that volumetric flow rate ratio and fluidic capacitance are coupled. This setup is advantageous in that it allows duty cycle to be considered simply as a function of the volumetric inflow rate ratio; requiring no modifications of the microfluidic circuit to robustly produce distinct duty cycles.
2. Working Principle
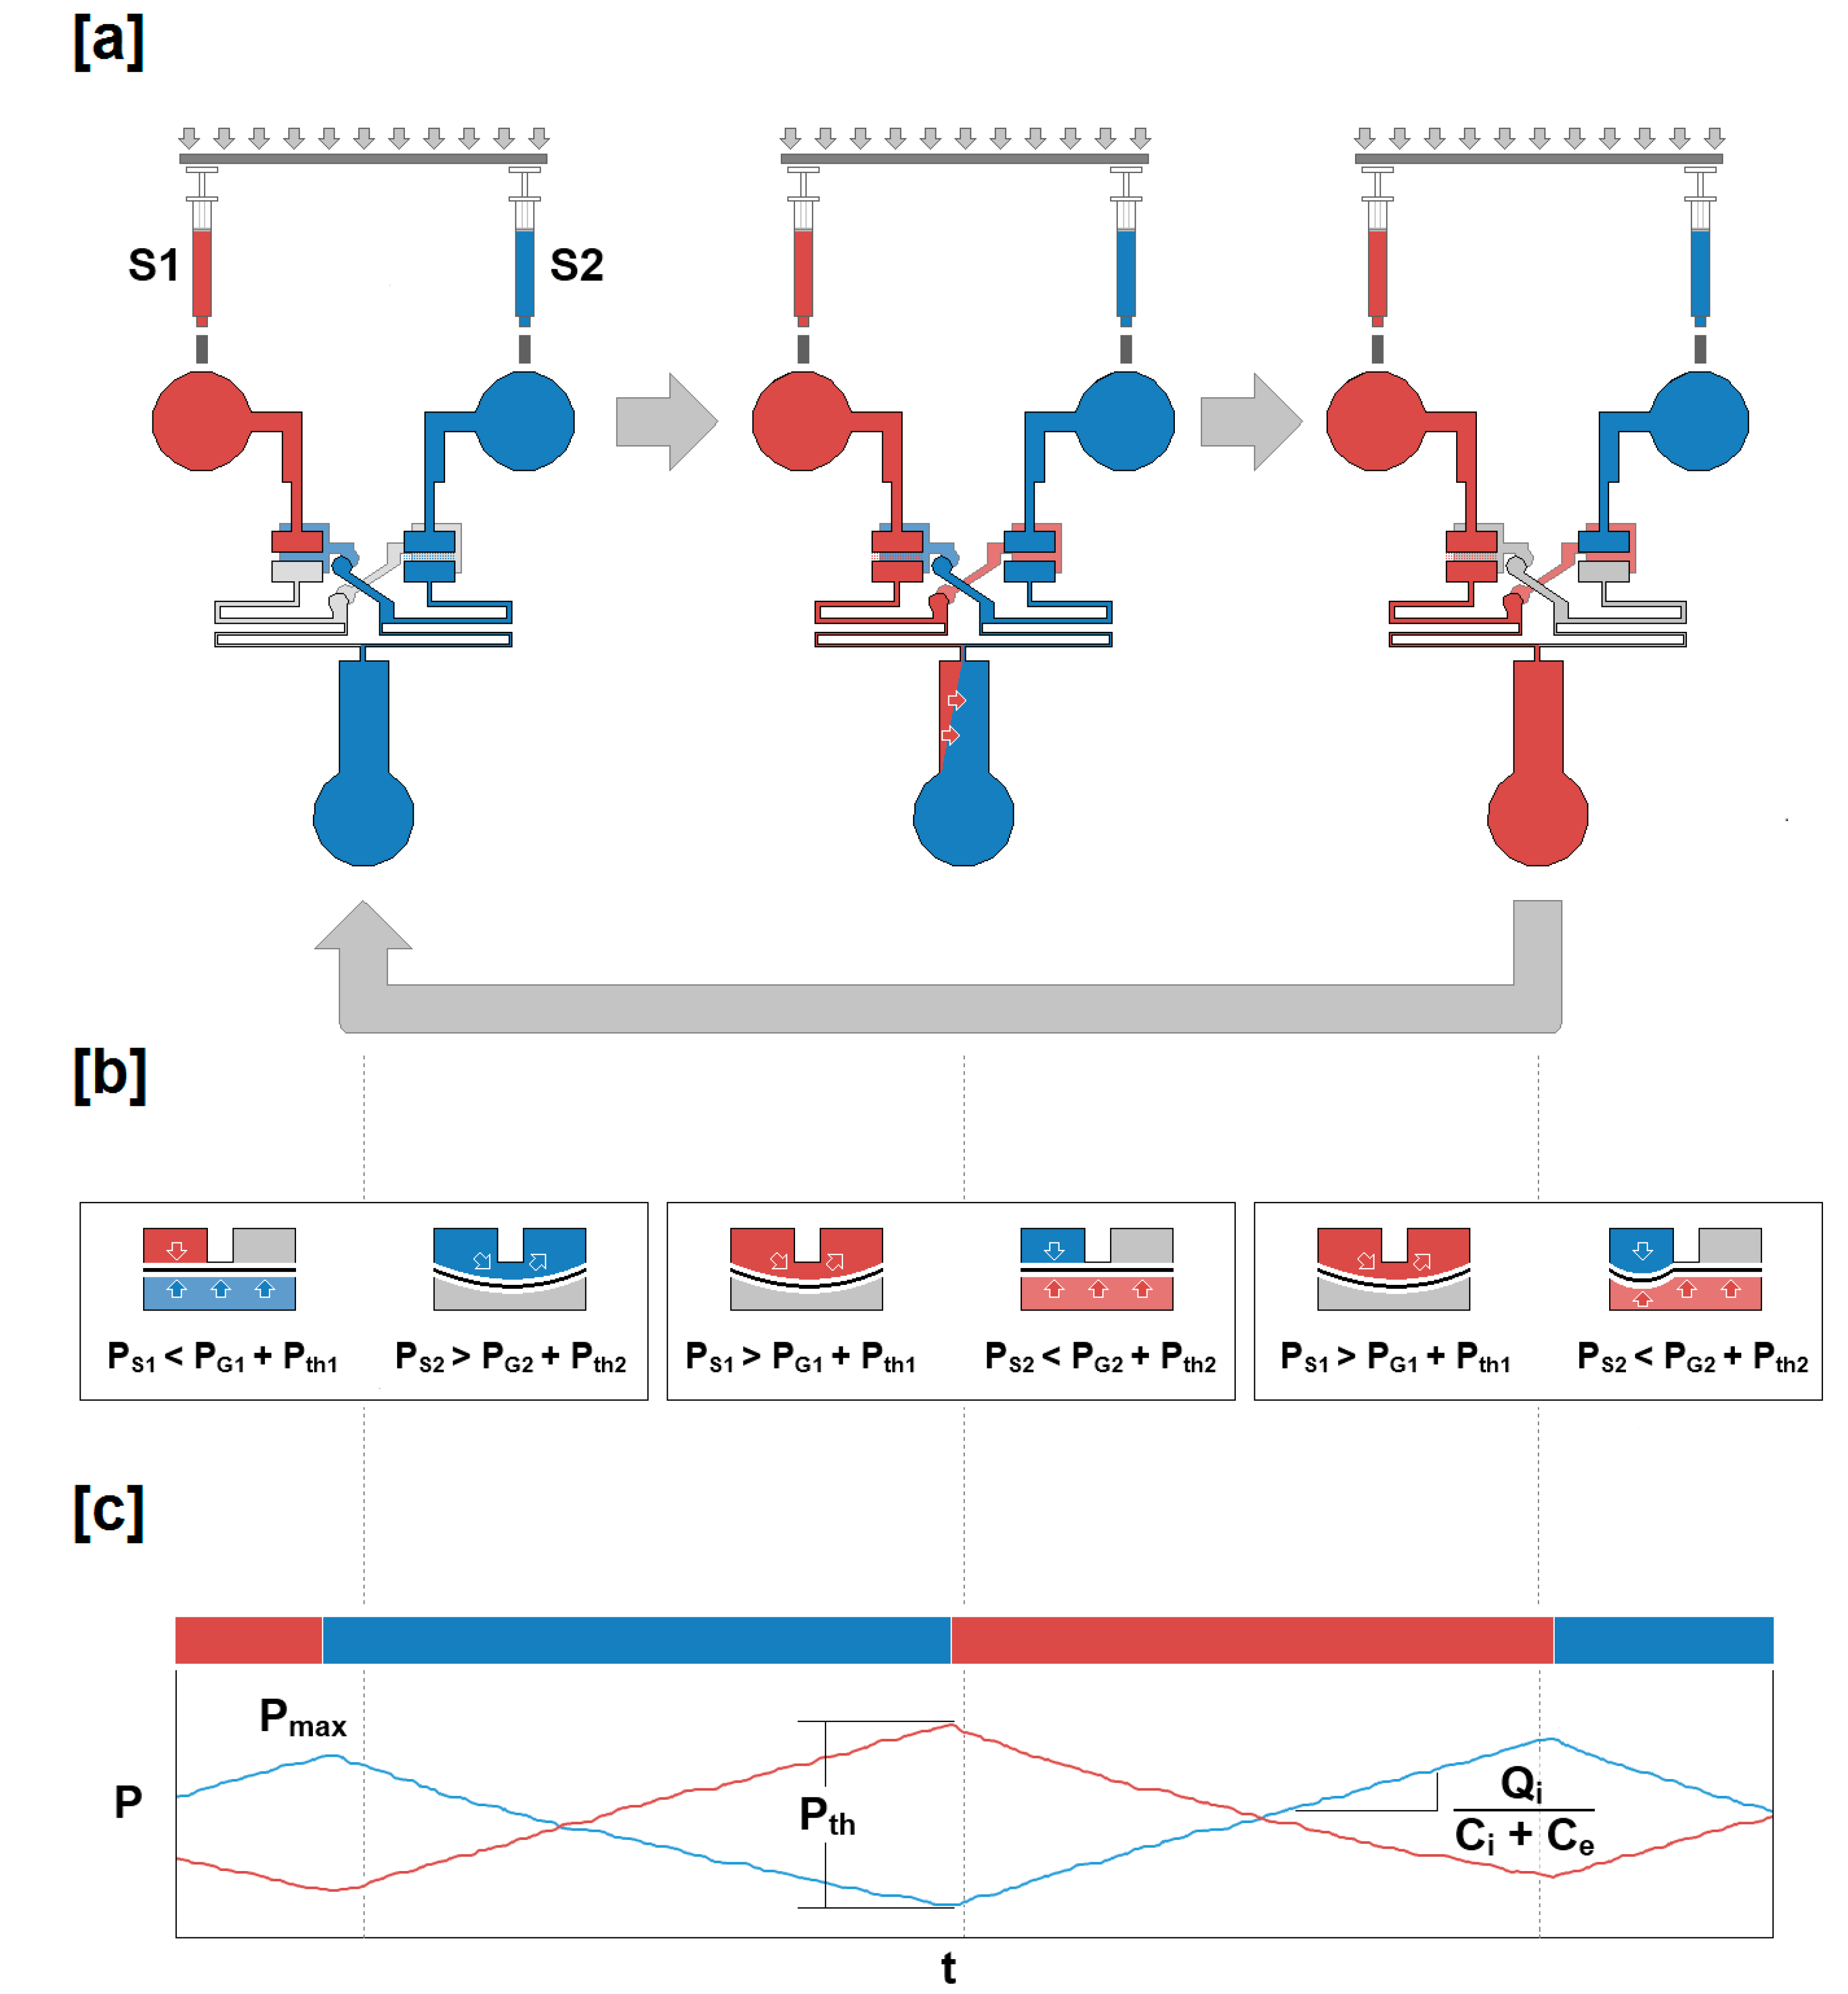
The microfluidic oscillator functions by converting two constant volumetric flow rate inflows to one oscillatory outflow through the activity of two normally-closed three-way valves that generate oscillations in fluid outflow through the alternate obstruction of each inflow (
Figure 1).
Briefly, if we denote the two valves valve 1 and valve 2, and arbitrarily assume that valve 2 is initially in an open position—allowing fluid to flow across it; a portion of the outflow from valve 2 will be diverted from its drain terminal to the gate terminal of valve 1. The gate terminal refers to the conduit leading to the region below the membrane valve unit. The accumulation of fluid within this region supplies the gate pressure of valve 1 (PG1); preventing the downward deflection of the membrane, and consequently preventing valve 1 from transitioning to an open position while PG1 exceeds the source pressure of valve 1 (PS1) generated by the accumulation of fluid in the portion of the valve upstream from the valve 1 gate.
When
PS1 has surpassed the sum of
PG1 and the inherent pressure threshold of
valve 1 (
Pth1), determined by the specific mechanical properties of the membrane, the membrane is deflected downward, and fluid is allowed to travel through
valve 1. A portion of this outflow is then diverted from its drain terminal to the gate terminal of
valve 2, as the outflow from
valve 1 had been diverted previously, and supplies the gate pressure necessary to force the accumulation of fluid upstream of
valve 2, until the difference between
PS2 and
PG2 has exceeded
Pth2 (
Figure 1a,b). The coordination of these processes, resulting in the anti-synchronized opening and closing of both valve units, produces an oscillatory outflow (described in greater detail in previous work [
2,
21]).
Figure 1.
Schematic for the experimental system. The three panels displayed represent the behavior of the microfluidic oscillator at three time points during operation under symmetric flow conditions. (a) Two fluids (blue and red) are introduced through two syringes mounted on a single syringe pump. The fluids enter the device at a constant rate, but are converted into an oscillatory outflow when passing through the valves. (b) A cross section of each valve unit at the time points displayed in panel (a). Initially, the source pressure (PS1) is insufficient (PS1 < PG1 + Pth1) to displace the membrane downward, allowing the blue fluid to outflow. When the pressure has reached its maximum value (Pmax), the membrane is displaced (PS1 > PG1 + Pth1), allowing the red fluid to outflow until sufficient source pressure (PS2) has accumulated within the chamber above the opposite membrane (PS2 > PG2 + Pth2) allowing the blue fluid to outflow. (c) The time points within the pressure data time series corresponding to the valve and outflow profiles presented in panels (a) and (b) are indicated. A sample Pmax and Pth are also represented, as well as the relationship between inflow rate (Qi), internal capacitance (Ci), and external capacitance (Ce).
![Micromachines 05 01254 g001]()
Functionally, as the gate pressure of the valve regulating one flow is itself regulated by the volumetric outflow rate across the other, we assume the following characteristic:
This expression, where
Qin,
C and
P represent inflow rate, fluidic capacitance, and pressure respectively, may be expanded to describe the threshold-dependent mechanism underlying the functionality of the valves. Conceptually, the transition between a closed-to-open or open-to-closed valve-state is governed by the values of
Pth and
PG set by the mechanical properties of the membrane and buildup of fluid pressure below the membrane (
Figure 1b), respectively, and the rate at which fluid pressure builds within the valve region above the membrane (
PS) [
2]. The relationship between inflow rate and capacitance, thus, may be used to determine duty cycle as a function of time:
Under symmetric flow conditions, Q1 ≅ Q2, where the mechanical properties of the membrane and valve compartments are preserved across both valves, the assumption is Pth1 ≅ Pth2 and C1 ≅ C2, allowing us to consequently define duty cycle solely as a function of volumetric flow rate.
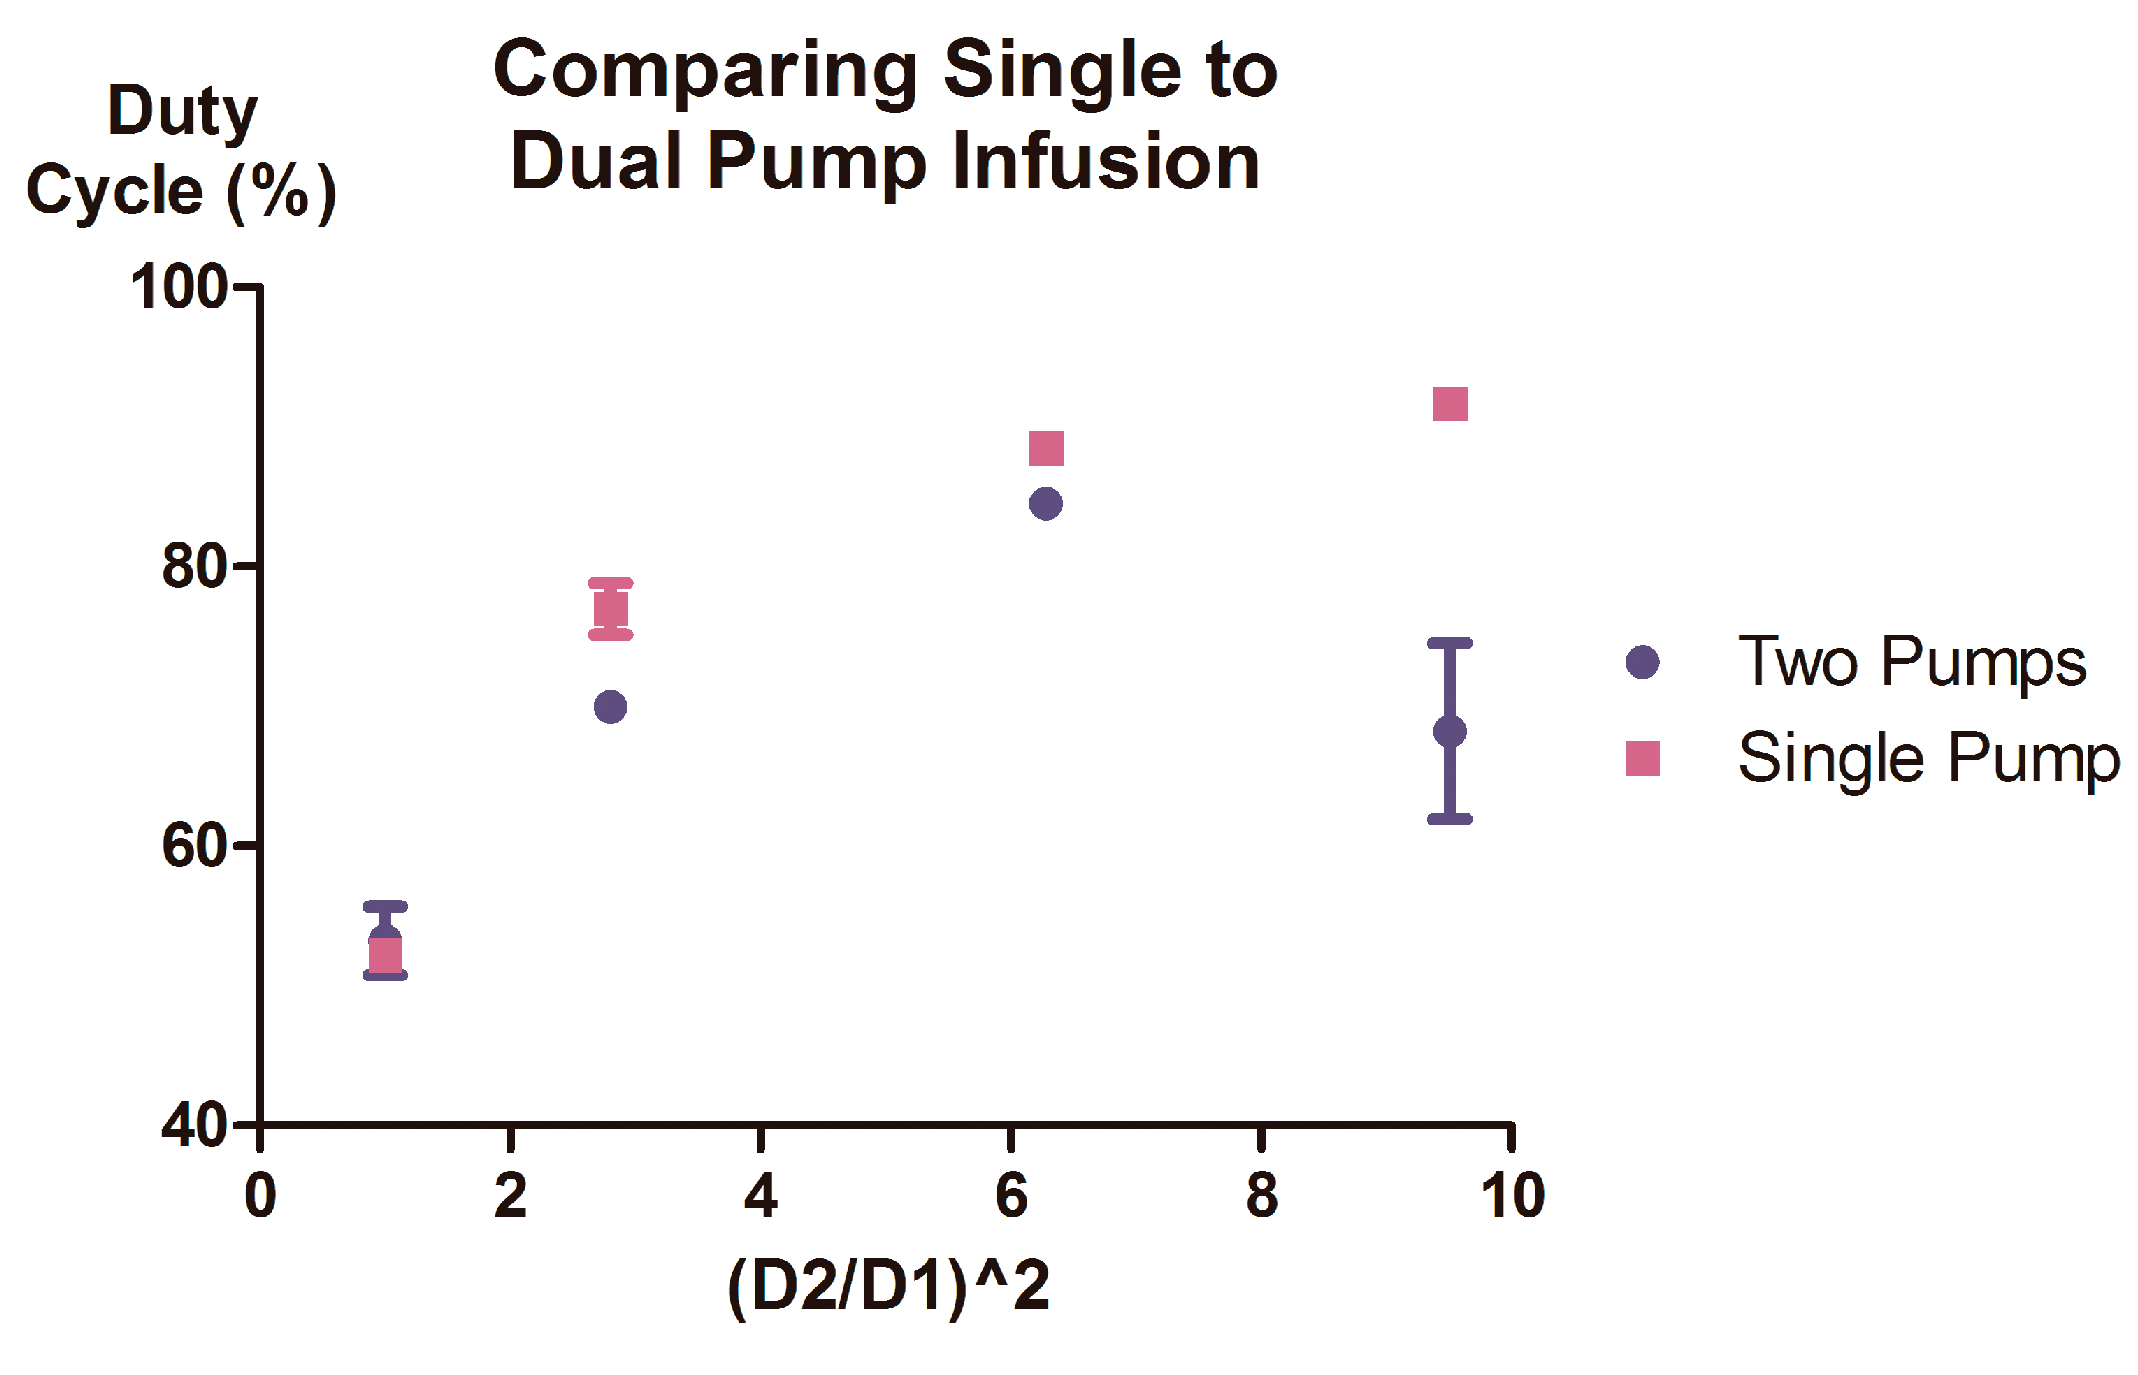
Equation (4) depicts an attractive relationship that relates duty cycles simply to volumetric inflow ratios. By this definition, the introduction of asymmetry to the volumetric inflow rates of each fluid,
Qi, would produce asymmetric duty cycles. However, in asymmetric conditions where
Q1 ≠
Q2 (e.g.,
Q1 <
Q2), the syringe supplying the greater volumetric inflow (
Q2) will result in a greater threshold pressure for the valve regulating the lesser volumetric inflow, and consequently,
Pth1 >
Pth2. The presence of this asymmetry suggests that the use of two identical syringes, evacuated at asymmetric linear velocities, would rely upon a complex balance between
Qin,
C, and
P such that the duty cycles produced may not be accurately modeled by Equation (4). One way to maintain the relationship shown in Equation (4) would be to modulate
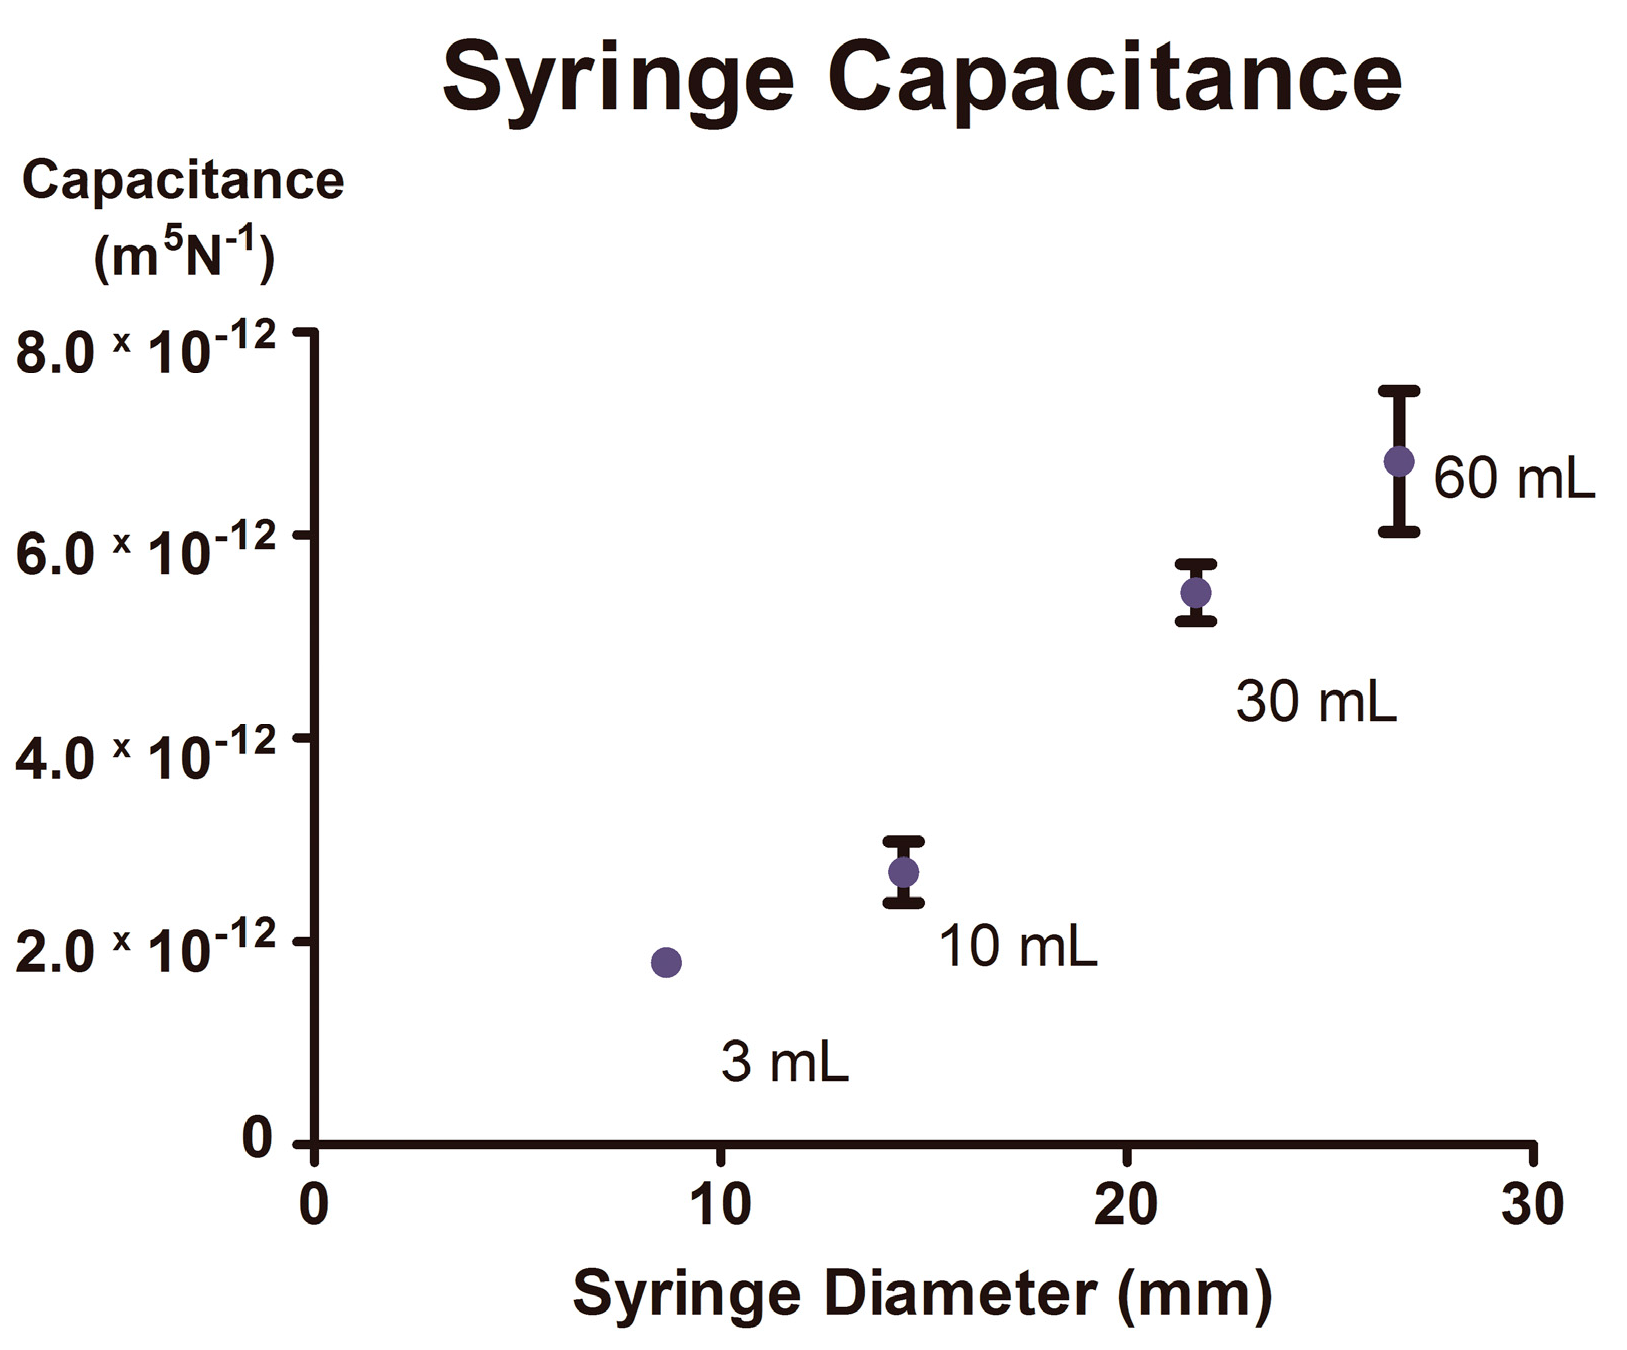
Ci together with
Qi so that
Pthi ×
Ci ≈ constant. One way to achieve this conveniently is by mounting two plastic syringes of different cross-sectional area on one syringe pump (
Figure 2), and utilizing the compliance of the syringe components [
23] and resulting capacitive differences of the syringes [
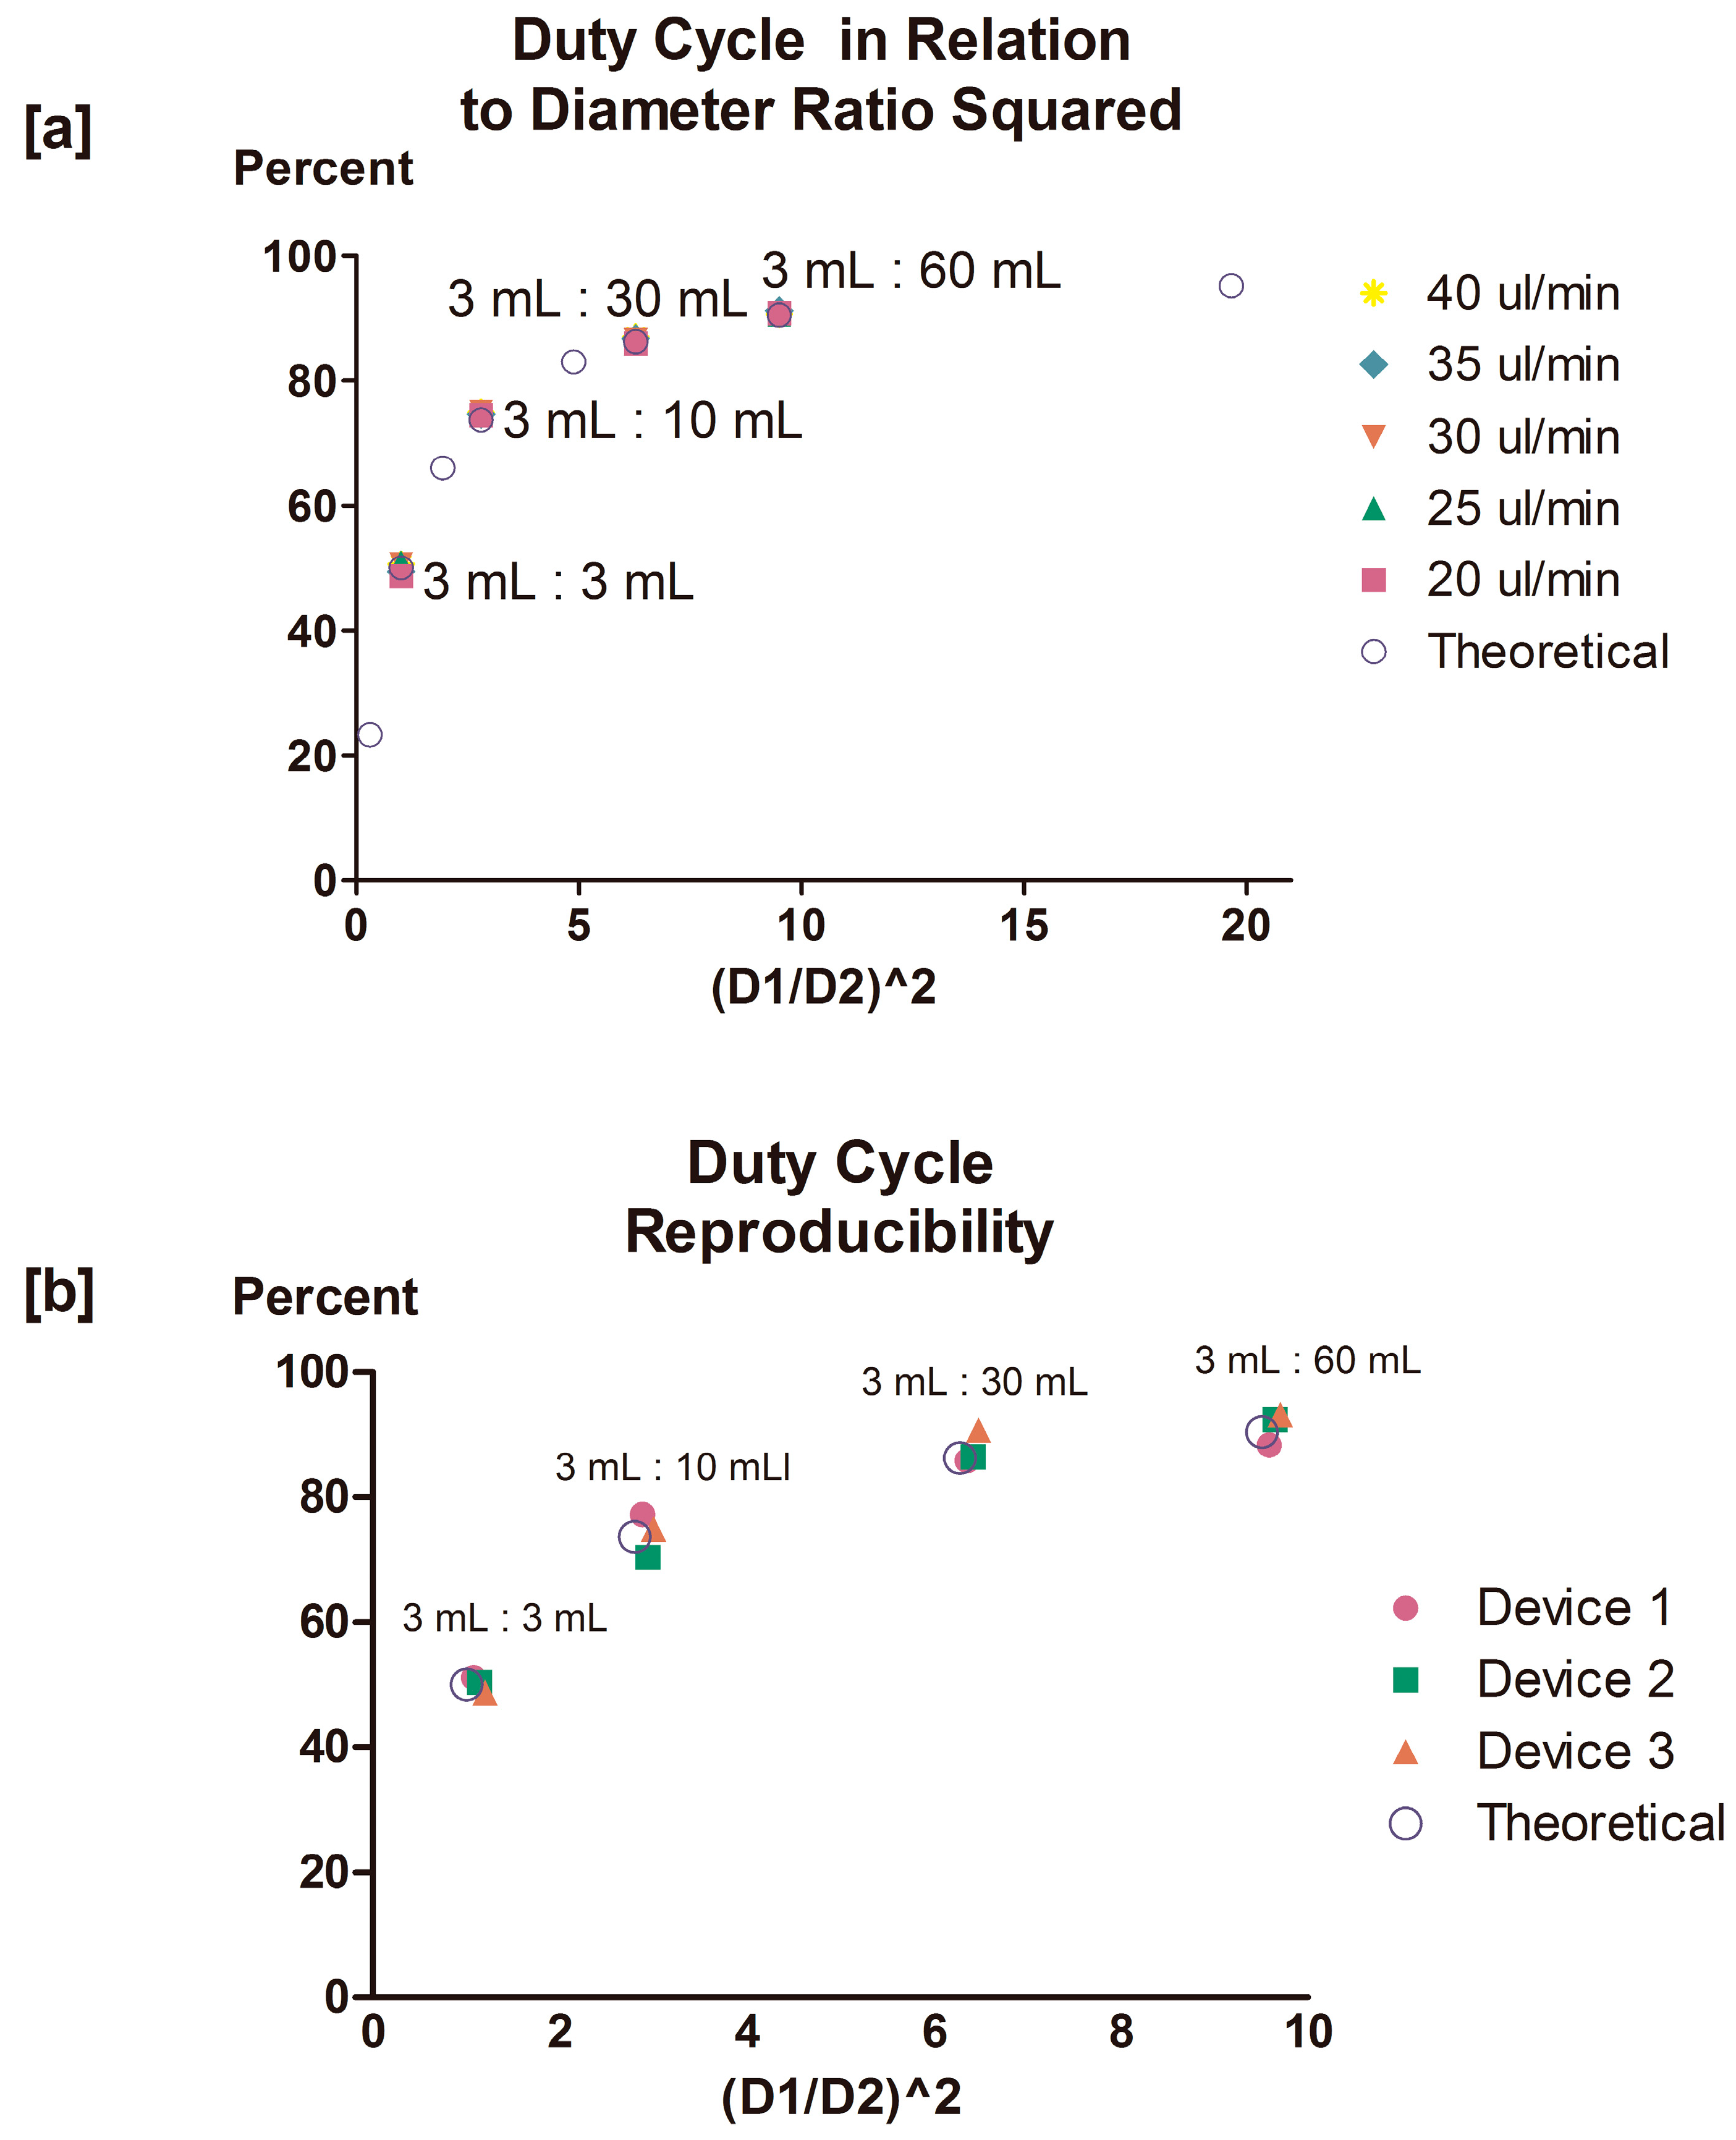
12]. Within the described system, as syringe outflow rate is a function of velocity and syringe cross-sectional area, and as both syringes are evacuated at the same linear velocity, we may further refine our definition of duty cycle as being a function of syringe diameter (
Figure 2b). By using syringes of different diameters, we apply Equation (4) and demonstrate predictability of duty cycle values as a function of the combination of syringes used (
Table 1).
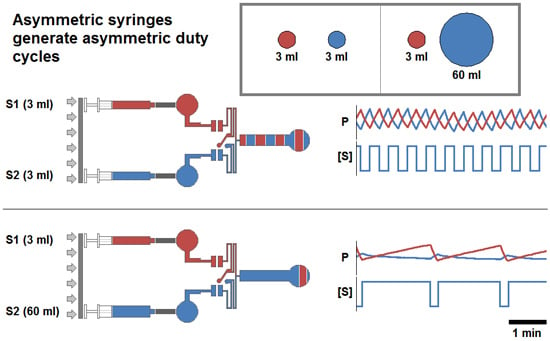
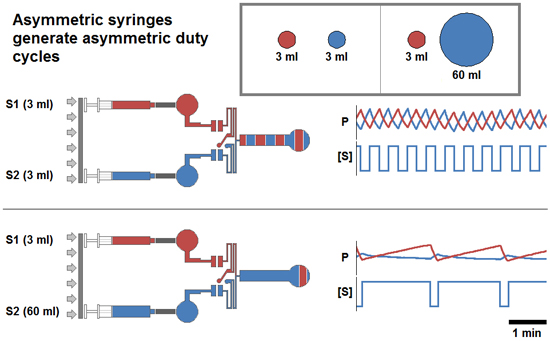
Figure 2.
Schematic for the experimental generation of symmetric and asymmetric volumetric flow rates, and changes in duty cycle and pressure profile produced as a function of syringe diameter. (a) Two sample conditions where Syringe 1, (red), and Syringe 2, (blue), are mounted on a single syringe pump. The ratios illustrated are the symmetric 3 mL:3 mL (upper) and asymmetric 3 mL:60 mL (lower). Within the experimental protocol , Syringe 1 was held constant in all pairings while Syringe 2 was varied to achieve symmetric (50%) and asymmetric (>50%) duty cycles; and total volumetric inflow rate remained constant. Experimentally generated pressure profile waveforms are presented against alternating background bands representing the fluid outflow profile. (b) Pressure profile and stimulation period for the four inflow ratio regimes. Pressure profiles were generated while the syringe pump was moving at a constant linear velocity such that the total volumetric inflow rate (the sum of the inflows supplied by each syringe) was maintained at a volumetric flow rate of 20 μL/min. The pressure profiles recorded (P) are presented above each trace representing the concentration of a fluidic stimulant ([S]) provided via Syringe 2, in the outflow.
![Micromachines 05 01254 g002]()
3. Materials and Methods
3.1. Master Mold Fabrication
Microfluidic oscillator master molds were fabricated upon 4″-silicon wafers using the negative photoresist, SU-8 (MicroChem, Newton, MA, USA). Following air-cleaning of the wafer, SU-8 2075 photoresist was deposited on the wafer and spin-coated at 500 rpm (acceleration of 440 rpm/s) for 10 s and at 2100 rpm (acceleration of 440 rpm/s) for 30 s. The coated wafer was then placed on a hotplate for pre-exposure baking at 65 °C for 5 min, 95 °C for 20 min and then allowed to gradually cool to room temperature by allowing it to remain on the hotplate after the plate was turned off. The SU-8 substrate was then exposed with conventional UV (~17 mJ/cm²) for 30 s using a mask aligner (Hybrid Technology Group), and then placed on a hotplate for post-exposure baking at 65 °C for 5 min, 95 °C for 10 min and then allowed to gradually cool to room temperature as before. Unexposed regions of photoresist were dissolved by repeatedly immersing the wafer in fresh SU-8 developer solution (MicroChem, Newton, MA, USA) for 60 s intervals until all non-exposed/cross-linked regions of SU-8 were removed. The completed mold was then placed within a gravity convection oven (DX-400, Yamato Scientific America, Santa Barbara, CA, USA) for 15 min at 120 °C and, upon returning to room temperature, was treated (silanized) in a desiccator for 1 h in the presence of vaporized tridecafluoro-1,1,2,2-tetrahydrooctyl-1-trichlorosilane (United Chemical Tech., Bristol, PA, USA).
3.2. Microfluidic Oscillator Fabrication
The microfluidic oscillator device consists of three polydimethylsiloxane (PDMS) layers assembled as previously described [
1,
2]. Briefly, the device features (100 μm height) were imprinted in the top and bottom layers, and a PDMS membrane (target thickness: 20 μm) was positioned between them (
Figure 1).
1:10 PDMS (Sylgard 184, Dow Corning, Midland, MI, USA) was poured onto the master mold and allowed to cure within a gravity convection oven at 60 °C for 6 h. The cured PDMS slab was then removed from the mold and cut into individual device layers. Concurrently, PDMS membranes were fabricated by spin-coating 1:10 PDMS onto glass slides pre-treated with silane as before. PDMS membranes were then cured within a gravity convection oven for 5 min at 120 °C and 10 min at 60 °C. Prior to final assembly, a 2-mm biopsy punch was used to remove PDMS from the inlet and outlet ports of the top device layer. The bottom layer and membrane were then treated by plasma oxidation (Covance MP, FemtoScience, Hwaseong-si, Gyeonggi-do, South Korea) to facilitate bonding and, following bonding, were then placed in a gravity convection oven at 120 °C for 5 min and at 60 °C for 10 min. Thru-holes were then made in the membrane to allow fluid communication between the top and bottom device layers, using a 350-μm biopsy punch (Ted Pella Inc., Redding, CA, USA). The top layer was then treated by plasma oxidation to facilitate bonding with the membrane-bottom layer assembly. Following treatment, but preceding bonding, the normally closed region of the top layer was “deactivated” by being brought into direct contact with an unoxidized PDMS “stamp”. Following final bonding, assembled devices were incubated for 2 min within a gravity convection oven at 120 °C.
3.3. Microfluidic Oscillator Testing and Data Processing
Microfluidic oscillators were tested by connecting pressure sensors (Model 142PC05D, Honeywell, NJ, USA) at the device inlets via Tygon tubing (Saint-Gobain™ Tygon™ R-3603 Clear Laboratory Tubing, Saint-Gobain Performance Plastics, Akron, OH, USA) to measure source pressure. Source pressure data was collected for both valves to quantify pressure buildup and release corresponding to fluid accumulation and evacuation, respectively, through the valves; our previous work highlighted the relationship between source pressure and drain pressure [
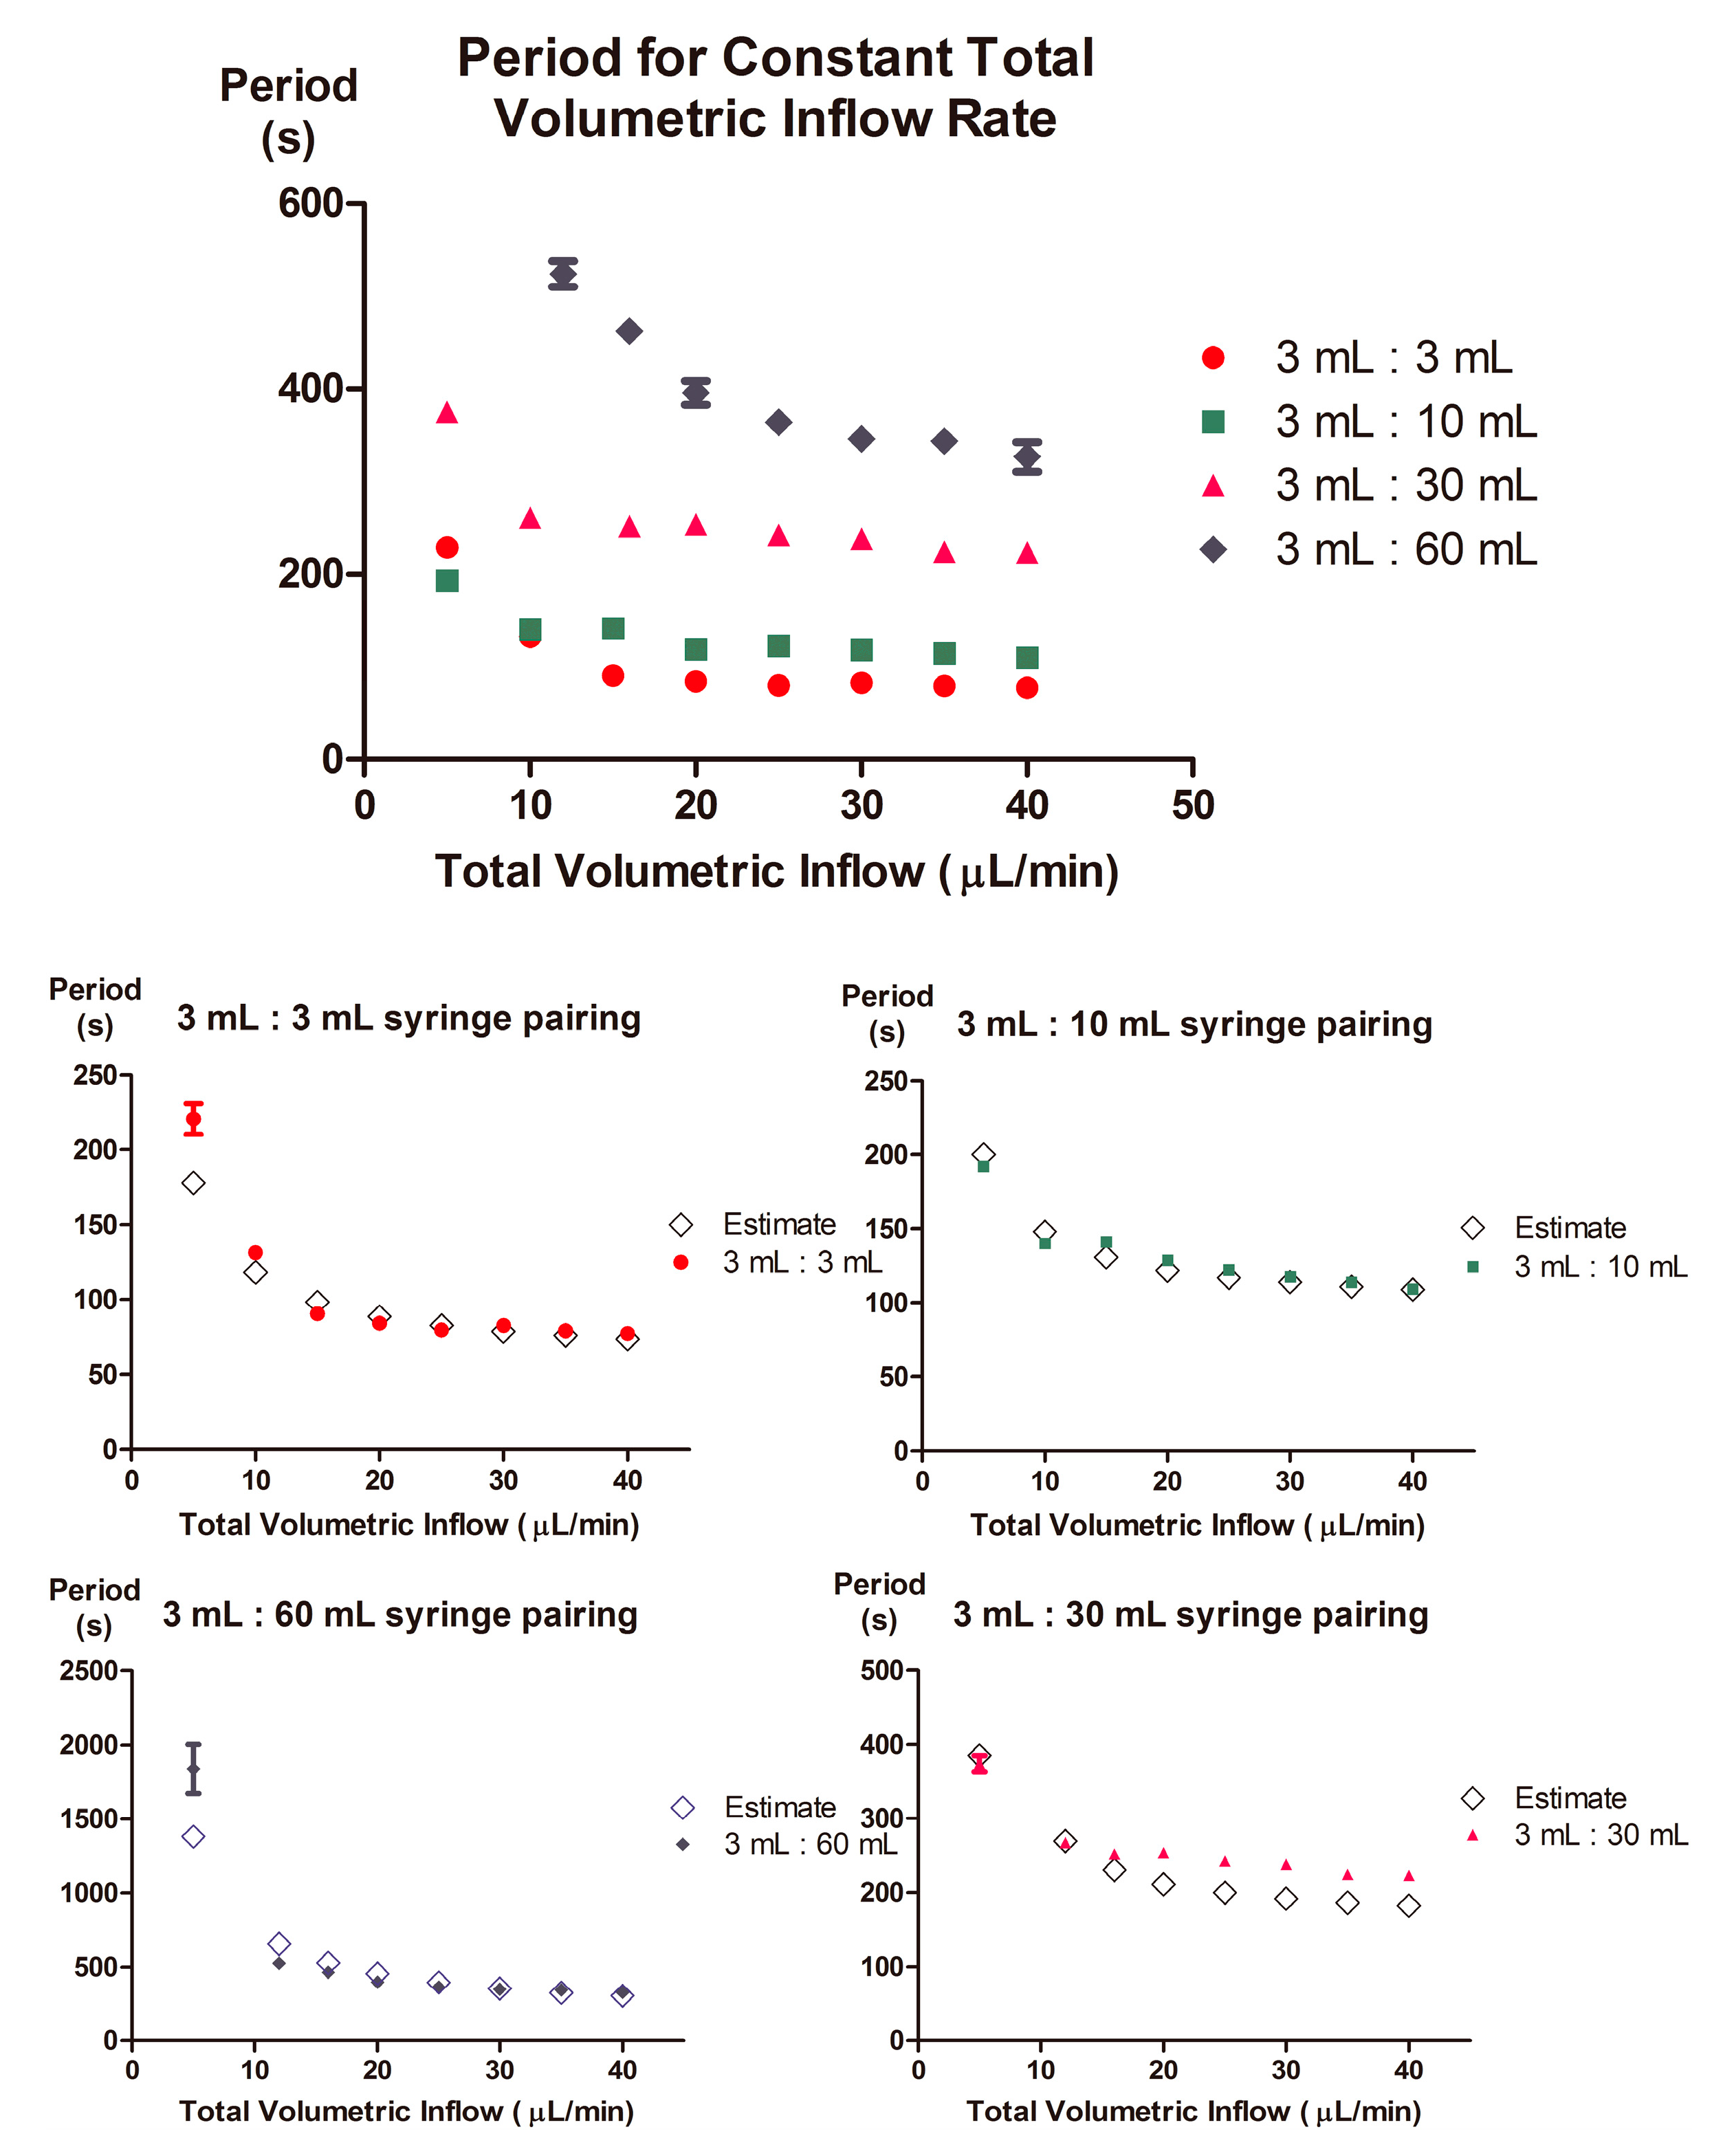
24]. The occurrence of fluidic oscillations and the coincident timing of these oscillations relative to source pressure profiles were verified visually. All subsequent quantification and assessment, however, was performed using source pressure data. Data was obtained at a sampling rate of 1000 Hz, every 100 data points were averaged (resulting in 1 data point per 100 ms), and stored using LabVIEW (National Instruments, Austin, TX, USA). Data was recorded for a minimum of four hours, of which the data acquired during the first hour for each condition was examined and discarded to ensure the volumetric flow and capacitance of the fluidic system had stabilized, and only the subsequent time (three hours) was assessed. Syringe pumps (Model KDS220, KD Scientific, Holliston, MA, USA and Model Fusion 200, Chemyx, Stafford, TX, USA) were used to provide constant volumetric flow to the device. One input, a 3 mL syringe (
Syringe 1) remained connected to one inlet port for the entirety of the study, while the second (
Syringe 2) was allowed to alternate between 3 mL, 10 mL, 30 mL and 60 mL plastic syringes (Becton, Dickinson and Company, Franklin Lakes, NJ, USA). The syringe pump was programmed with total volumetric inflow rates appropriate for each syringe pairing, such that
Q2 ≥
Q1 and
Q2 +
Q1 =
Qtotal.Voltage data were collected using LabVIEW and processed, in part, using the open-source peakdet [
25].


 ,
, 


