Article

Analysis of Thermal Performance in a Bidirectional Thermocycler by Including Thermal Contact Characteristics

1
Department of Biomechatronics Engineering, National Pingtung University of Science and Technology, 1, Shuefu Road, Neipu, Pingtung 912, Taiwan
2
Department of Mechanical Engineering, National Pingtung University of Science and Technology, 1, Shuefu Road, Neipu, Pingtung 912, Taiwan
*
Author to whom correspondence should be addressed.
Micromachines 2014, 5(4), 1445-1468; https://doi.org/10.3390/mi5041445
Submission received: 17 October 2014 / Revised: 21 November 2014 / Accepted: 4 December 2014 / Published: 12 December 2014
(This article belongs to the Special Issue Biomedical Microdevices)

Abstract

:
This paper illustrates an application of a technique for predicting the thermal characteristics of a bidirectional thermocycling device for polymerase chain reaction (PCR). The micromilling chamber is oscillated by a servo motor and contacted with different isothermal heating blocks to successfully amplify the DNA templates. Because a comprehensive database of contact resistance factors does not exist, it causes researchers to not take thermal contact resistance into consideration at all. We are motivated to accurately determine the thermal characteristics of the reaction chamber with thermal contact effects existing between the heater surface and the chamber surface. Numerical results show that the thermal contact effects between the heating blocks and the reaction chamber dominate the temperature variations and the ramping rates inside the PCR chamber. However, the influences of various temperatures of the ambient conditions on the sample temperature during three PCR steps can be negligible. The experimental temperature profiles are compared well with the numerical simulations by considering the thermal contact conductance coefficient which is empirical by the experimental fitting. To take thermal contact conductance coefficients into consideration in the thermal simulation is recommended to predict a reasonable temperature profile of the reaction chamber during various thermal cycling processes. Finally, the PCR experiments present that Hygromycin B DNA templates are amplified successfully. Furthermore, our group is the first group to introduce the thermal contact effect into theoretical study that has been applied to the design of a PCR device, and to perform the PCR process in a bidirectional thermocycler.

1. Introduction

Since polymerase chain reaction (PCR) was invented in the early 1980s by Saiki et al. [1], PCR has commonly been utilized to obtain an exponential amplification of a specific DNA sequence from a small amount of the target DNA. It has emerged as a powerful diagnostic tool for rapid and reliable identification of infectious diseases and genetic disorders. For the efficient and selective amplification, PCR requires rapid temperature changes plus an accurate temperature control.
In order to achieve the requisites for developing PCR devices, many researchers are constantly improving the systems. The designs of the PCR devices can be categorized into the chamber type and the continuous flow type. Some studies have developed the chamber type PCR devices based on the conception of a conventional thermocycler. The mixture is kept static, and the temperature of the reaction chamber is cycled [2]. Some researchers have examined the continuous flow PCR (CFPCR) devices, and the reaction mixture moves through one or several different isothermal regions repetitively in a microchannel or tube [3]. There are three main construction types of the CFPCR reactors: unidirectional, closed-loop and oscillatory reactors. Each one has its own characteristic advantages. For the past few decades, many works have investigated the CFPCR devices integrated with different functions. Frey et al. [4] reported on the recent evolution in the development of CFPCR devices.
In the oscillatory reactor, the reactive sample is moved back and forth among the various constant-temperature regions. Chiou et al. [5] devised a thermocycling machine based on a capillary equipped with a bidirectional pressure-driven flow. Cheng et al. [6] developed a thermal cycling strategy in polymethylmethacrylate (PMMA) microfluidic chips. The sample plug was shuttled back and forth between the desired temperature regions by varying the syringe pressure. Wang et al. [7] demonstrated a droplet-based micro oscillating-flow PCR chip. The PCR mixture was driven by the pressure generated from an injector and flew through the main channel. Frey et al. [4] presented a flow-through reactor by shuttling a submicroliter sample of the PCR mixture over three heaters. An externally actuated pneumatic pump allowed for an autonomous sample manipulation. Ohashi et al. [8] described an oscillating droplet-based PCR device. The transportation of the droplets containing magnetic beads utilized a magnet located underneath the reactor. Chen et al. [9] showed a bidirectional flow DNA amplification microreactor. The reaction plug was transported using a syringe pump. Chen et al. [10] fabricated and tested the thermal characteristics of the oscillatory chamber block under various operational conditions. The sample placed in a chamber had linear movement and came into contact with three different isothermal regions.
While a number of publications on PCR have dealt with the amplification performance of the CFPCR devices, there were few attempts to systematically analyze the thermal characteristics among these devices. Numerical studies of the heat transfer in CFPCR devices have been conducted. Some have dealt with the thermal characteristics of the system as the amount of the PCR mixture is small and the influence of the PCR mixture on the temperature pattern of the device is negligible. Zhang et al. [11] studied the temperature patterns of two kinds of CFPCR systems by using finite element analysis (FEA). Bu et al. [12] proposed a microfluidic chip for DNA amplification. A two-dimensional thermal model was used for the optimization of the location of the heater. Li et al. [13] presented a CFPCR microchip with a serpentine channel of varying width. The optimized spacings between the heaters were determined by utilizing FEA and a semi-analytical heat transfer model. Zhang and Xing [14] developed a thermal gradient PCR. A fin design was utilized to create a desired temperature gradient for their device. Allen et al. [15] investigated the coupling between the reaction and flow during PCR in a Rayleigh-Bénard (RB) convection cell. They numerically solved the combined momentum and heat transfer equations for a two-dimensional RB cell. Chen et al. [16] fabricated a fully integrated microsystem for CFPCR. The commercial software is utilized to determine the geometric characteristics between the heating assemblies that are responsible for creating the three specific temperature regions within the chip.
The heat transfer in the microchannel of the CFPCR system, driven by various forces, was studied. Chen et al. [17] constructed a thermosiphon PCR reactor. A simplified model and a three-dimensional model were used to predict the PCR mixture velocity in and the temperature distribution around the Teflon tubing. Tsai and Sue [18] designed a micro-RT-PCR chip to detect tumor viruses. Commercial software was utilized to simulate the thermal entry length of fluid at different temperature regions. Gui and Ren [19] developed a three-dimensional model to simulate the electrical potential field, the flow field and the temperature field in an electroosmosis-based CFPCR chip. Heat transfer across the entire chip, including both the solid substrates and the liquid regions, was considered. Mohr et al. [20] fabricated a two-temperature CFPCR polymer chip. The predicted temperature distribution along the centerline of the channel was shown as the heat conduction among the solid phase of the chip was included.
In the previous studies on CFPCR devices, only a few researches analyzed the heat transfer across the entire device, including both the solid substrates and the liquid regions [19,20]. The heaters were placed around the working regions and contacted perfectly with the device to maintain three designed temperature regions as required for PCR processes. From our previous study [10], the thermal characteristics of the oscillatory chamber block under various operational conditions were analyzed, and the temperature by numerical simulation was smaller or larger than that by experimental measurement. A temperature drop could be experienced at the interface between the heater surface and the chamber surface in contact. This phenomenon is said to partly be a result of a thermal contact resistance existing between the contacting surfaces. Thermal contact resistance is a complicated phenomenon, influenced by many factors, e.g., contact pressure, interstitial materials, surface roughness and surface cleanliness [21]. Unfortunately, a comprehensive database of contact resistance factors does not exist, a situation which sometimes causes researchers to not take thermal contact resistance into consideration at all. This is understandable because of the many complex surface conditions which may be encountered in practice.
A novel bidirectional thermocycler is built for DNA amplification in this study. The sample is placed in a fixed chamber, and three constant isothermal zones are established and lined up in the system. The chamber is oscillated and comes into contact with three different isothermal zones to complete thermal cycles. Regarding some studies a microfluidic channel design in the CFPCR device increases the possibility of enzymes in PCR mixtures sticking onto the surface of the channel wall. Any enzyme adsorbed by the walls of the chip reduces PCR efficiency. In our work, the surface inhibitory effect is insufficient for serious reaction inhibition. We are motivated to analytically determine the thermal performances of the thermocycler by including the thermal contact characteristics between the heater surfaces and the chamber surface. The specific values of thermal contact resistance are used to simulate the temperature distributions and the thermal ramping rates of the reaction chamber during thermal cycles. Using the air convection coefficient and/or thermal contact resistance, the effects of various boundary conditions on the transient temperatures in the chamber are discussed. Furthermore, the experimental and numerical results are compared, and PCR experiments are tested in our reactor. To our knowledge, our group is the first group to introduce the thermal contact effect into theoretical study that has been applied to the design of a PCR device. By including the thermal contact resistance which is empirical by the experimental fitting into the numerical analysis, the simulated temperature distributions during thermal cycles can be utilized to predict the thermal performance of the PCR device in reality and, furthermore, provide the suitable operation parameters of the device during PCR qualitatively.

2. Theoretical Model

In this study, the aluminum chamber filled with sample solution oscillates among three isothermal blocks, as shown in Figure 1a. The chamber is oscillated and comes into contact with different isothermal zones to complete thermal cycles. When the chamber moves inside the heating region, it absorbs the thermal energy from the heating block. As the PCR chamber passes between two heating blocks, the stored heat will be transferred by ambient air. When the chamber is partially in the heating region and partially in the cooling region, the time-dependent boundary conditions are used and will be discussed later. The mechanisms of heat transfer contain thermal conduction and heat convection. The physical configuration is presented in Figure 1b for modeling the heat transportation of the PCR solution and the chamber. The PCR solution is in a chamber with a cylindrical volume. The geometric shape of the sample volume inside the reaction chamber is a cylinder of diameter 5 mm and height 4 mm. The PCR tube without a cone is inserted into the chamber and contacted with the chamber tightly. The bottom of the reaction chamber is covered with a small volume of mineral oil (less than 5 μL). Because the thicknesses of the PCR tube and the mineral oil film are very thin, the volumes of the PCR tube and mineral oil are excluded in the simulation. We use water as the required sample and the fluid properties are set as the physical and thermodynamic properties of water at 300 K. When the temperature difference inside the reaction chamber is less than 4 K, Rayleigh number (= gβΔTD3v) inside the reaction chamber is less than 6000. Then the flow induced by buoyancy is deficient and heat transfer principally occurs via conduction through the fluid. The convective contribution to heat transfer inside the PCR solution can be neglected [21]. Heating blocks are assumed to be placed around the chamber surface. The thermophysical properties of the chamber and the sample are kept unchanged and uniform during thermal cycles.
The governing equations for a three-dimensional transient energy transfer problem can be written as following to comprehensively predict the unsteady temperature of the solution and the chamber volume (The simple, lumped heat capacity method was used to solve the energy field and to obtain the transient temperature profiles in our previous study [22]). They are given as:
T i τ + W ( τ ) T i z = α i 2 T i
where i is 1 and 2 for the chamber substrate and the sample solution, respectively; T is temperature; τ is time; W(τ) are the z-direction moving velocities of the chamber and solution, and it can be time-dependent; α is thermal diffusivity.
Figure 1. (a) Schematic diagram and (b) physical configuration of the bidirectional thermocycler.
Micromachines 05 01445 g001
It is assumed that the chamber is full of sample solution. The entire system is assumed to be the temperature, T0, initially. At the interface between the solution and the chamber volume, the continuities of temperature and heat flux are set. The bottom surface of the chamber is contacted with the plastic stage, and the adiabatic boundary condition is presumed. The natural convection of the back and front side faces of the chamber (in the z-direction) is also assumed.
In this work, the chamber moves through different heating and cooling regions. On the other outer surfaces of the chamber mass when the chamber is moving inside the cooling regions, i.e., between two heating regions, the convective boundary condition is used as:
k 1 T 1 n = h c ( T 1 T a m b , i )
where k is the thermal conductivity; n is a normal vector field orthogonal to the outer surface; hc is the convective heat transfer coefficient between the outer surface and the ambient; Tamb,i is the ambient temperature of the cooling region i, for i = 1 and 2, and the gaps of the cooling regions are exposed to the different temperatures.
When the chamber is moving inside the heating regions, the thermal contact conductance coefficient is utilized. The thermal contact conductance coefficient, hr, is a property indicating the ability to conduct heat between two bodies in contact. The inverse of this property is termed thermal contact resistance. In our simulation, a specific value of the thermal contact conductance coefficient is assumed and used to simulate the thermal contact resistance between the heater surface and the chamber surface in contact.
k 1 T 1 n = h r ( T 1 T w , i )
where Tw,i is the temperature of the heating block i, for i = 1, 2 and 3. Three heating regions for three PCR steps are a high-temperature region (denaturation), a medium-temperature region (extension) and a low-temperature region (annealing).
When the chamber is partially in the heating region and partially in the cooling region, the boundary conditions can be expressed in the different types. Some boundary conditions demonstrated in Figure 2 and Figure 3 are changed with time, and related to the moving speed. As the chamber moves forward from the heating region into the cooling region, then at:
Z c L c W i < τ < Z c W i ,   k 1 T 1 n = h * ( T 1 T * ) ,   and   { 0 < z < [ L c W i ( τ Z c L c W i ) ] , h * = h r , T * = T w , i [ L c W i ( τ Z c L c W i ) ] < z < L c , h * = h c , T * = T a m b , i
where Lc is the length of the chamber, Wi is the forward speed Wf. When the chamber is moving into the first cooling region (Figure 2a), Zc is LH,1, Tw,i is Tw,1 and Tamb,i is Tamb,1. When the chamber is moving into the second cooling region (Figure 2c), Zc is LH,1 + LG,1 + LH,2, Tw,i is Tw,2 and Tamb,i is Tamb,2. LH,i is the length of the heating region i and LG,i is the length of the cooling region i. As the chamber moves forward from the cooling region into the heating region, then at:
Z c L c W i < τ < Z c W i , k 1 T 1 n = h * ( T 1 T * ) , and { 0 < z < [ L c W i ( τ Z c L c W i ) ] , h * = h c , T * = T a m b , i [ L c W i ( τ Z c L c W i ) ] < z < L c , h * = h r , T * = T w , i
when the chamber is moving into the second heating region (Figure 2b), Zc is LH,1 + LG,1. When the chamber is moving into the third heating region (Figure 2d), Zc is LH,1 + LG,1 + LH,2 + LG,2.
After the chamber reaches the end of the third heating region, it moves back with the speed Wb. As the chamber moves backward from the heating region into the cooling region, the boundary condition is similar to Equation (5). When the chamber moves into the second cooling region (Figure 3a), Zc is τf × Wf + LH,3, Tw,i is Tw,3 and Tamb,i is Tamb,2. τf is the required time for the chamber moving from the starting location of the first heating region to the end of the third heating region and equals to (LH,1 + LG,1 + LH,2 + LG,2 + LH,3Lc)/Wf. When the chamber moves into the first cooling region (Figure 3c), Zc is τf × Wf + LH,3 + LG,2 + LH,2, Tw,i is Tw,2 and Tamb,i is Tamb,1. As the chamber moves backward from the cooling region into the heating region, then, the boundary condition is similar to Equation (4). Zc is τf × Wf + LH,3 + LG,2 when the chamber is moving into the second heating region (Figure 3b). Zc is τf × Wf + LH,3 + LG,2 + LH,2 + LG,1 when the chamber is moving into the first heating region (Figure 3d).
Figure 2. Boundary conditions at different locations when the chamber is moving forward.
Micromachines 05 01445 g002
Figure 3. Boundary conditions at different locations when the chamber is moving backward.
Micromachines 05 01445 g003
The commercial software CFD-ACE+TM (ESI, Paris, France), which uses a finite volume approach, is utilized to examine the three-dimensional transient temperature distribution of the reaction chamber and the sample solution. The user subroutines coded in this study are utilized to create and modify the CFD-ACE-Solver. This can also get information from and to the solver at critical locations in the solution process. The details of the numerical methodology can be found in our previous study [10]. When the chamber is moving between two heating regions, the convective heat transfer coefficient, hc, between the outer surface and the ambient is specified. However, when the chamber is moving inside the heating region, hr is taken as a specific value to approximately simulate the thermal contact conductance coefficient.

3. Materials and Experimental Methods

The construction of the bidirectional thermocycler is shown in Figure 4. It comprises a rectangular reaction chamber, three aluminum blocks with individual cartridge heaters, several thermocouples for sensing and measuring the temperatures, three thermal control modules, a moving stage with a linear motor and a PMMA frame.
Figure 4. Photography and experimental setup of the finished device.
Micromachines 05 01445 g004

3.1. Experimental Setup

The reaction chamber is 12 mm long, 12 mm wide and 12 mm high. The geometric shape of the sample volume inside the reaction chamber is a cylinder of diameter 5 mm and height 4 mm. The chamber is fabricated in aluminum using a high-precision micromilling machine (EGX-400 Engraving Machines Plus, Roland, Irvine, CA, USA). A thin layer of polydimethylsiloxane (PDMS, Sylgard 184, Dow Corning Corp., Midland, MI, USA) monomer/curing agent mixture (10:1, w/w) is coated on the inner surface of the reaction chamber. The PCR tube (0.2 mL, Bio-Rad, Hercules, CA, USA) without a cone is inserted into the chamber and contacted with the chamber tightly. The chamber is placed on top of the hot plate followed by incubation at 65 °C to complete the PDMS polymerization. Then the bottom of the reaction chamber is covered with a small volume of mineral oil (less than 5 μL). The samples are placed in a fixed chamber to reduce problems of surface compatibility and avoid an inhibition of the PCR by interactions of biomolecules with the walls. The chamber oscillates via the moving stage among the denaturation, extension and annealing zones. A PCR cycle is completed before the reagent enters the denaturation zone, and another thermal cycle will be started. The moving direction is again reversed as the reagent reaches the end of the denaturation zone. After a designated number of thermal cycles, such as 35 cycles, the reagent can be taken out of the chamber for gel electrophoresis. The device owns the flexibility to change the reaction rate by changing the moving speed of the PCR mixture. This thermocycler combines the merits of the chamber-type PCR system and the CFPCR system.
The size of the thermostatic block is different and chosen for matching the demands of the temperature program in the PCR process. A slot at the central part of the block along the z-direction is made by the micromilling machine, and the chamber block can pass through it without contacting. The three aluminum segments are equipped with three cartridge heaters and three thermocouples for controlling the temperature precisely. The three parts are mounted together linearly on a PMMA frame with air gaps of 12 mm between them in order to avoid a thermal interference among the three isothermal blocks. These gaps are the cooling regions with natural convection.
Each aluminum block is equipped with one bore (about 3.2 mm). The resistance cartridge heater (3.175 mm diameter, 3.81 mm length, 120 V, 60 W, C1J6-L12, Watlow, St. Louis, MO, USA) and a K-type thermocouple (K30-2-506, Watlow, USA) are inserted into the bore of the block to form the heating region. Some thermal grease (11.2 W/mK, PK-3, Prolimatech, Taichung, Taiwan) is applied between these contacting components to ensure effective heat conduction. A thermal insulation rubber is attached to the top and the sidewall of the aluminum block to prevent heat loss. The temperature difference of the block surface at three measured points is within 2 K, and the deviation in temperature over the surface of the heating block is small. The thermocouple which is adhered onto the surface of the cartridge heater is connected to a data acquisition system (PM6C1EC Control Box, 120 V, 15 A SSR, Watlow, USA). The control box receives the temperature signal obtained from the thermocouple and determines the power input to the cartridge heater using a proportional/integral/derivative (PID) controller.
After the sample is injected into the reaction chamber, all three heaters are programmed to maintain the specific temperatures which correspond to the denaturation, extension and annealing zones, respectively. The whole system is insulated by a PMMA cover to avoid the thermal disturbance effect from the external atmosphere. The other thermocouples which are used to sense the central temperature inside the chamber, the chamber temperature located on the surface of the chamber in the z-direction and the temperatures at the mid of the top surface of three heating blocks are also connected to a data acquisition system (NI 9211, National Instruments, Austin, TX, USA) that converts the analog signal to a digital one. A computer receives the temperature signals through the analog input module and records the real-time temperature profiles.
Three thermostatic segments are linearly arranged along the motor rack (SmartT VL-ST60, Montrol, Taoyuan, Taiwan) and utilized for DNA amplification. The bidirectional repeatability of the moving stage is less than 40 μm. This motor is connected to a microprocessor system and communicates with a computer through the RS-232 port. The moving speed is programmable by setting the moving distance and the moving time in the program.

3.2. Samples and PCR Protocols

A 591-bp fragment of Hygromycin B DNA is amplified in 25 μL under the following conditions: 0.8 ng/μL DNA, 2.5 μL Dimethyl sulfoxide (DMSO), 1 μL dNTPs (each 10 mM), 2.5 μL 10 × PCR buffer, 1 mM MgCl2, 0.1 μg/μL BSA, 10 μM of each prime (hpt 591-F 0.5 μL and hpt 591-R 0.5 μL), 5 U/μL Taq polymerase, and double-distilled water. The forward primer and the reverse primer created for amplification are as follows: 5'-ACAGCGTCTCCGACCTGATGCA-3' and 5'-AGTCAATGACCGCTGTTATGCG-3' for the 591 bp fragment of the gene, respectively.
In order to validate the performance of the bidirectional thermocycler, the PCR amplification is also performed with a commercial thermocycler (MJ Mini™ 48-Well Personal Thermal Cycler, Bio-Rad). The cycling protocol comprises 35 cycles of denaturation at 367 K for 40 s, annealing at 334 K for 60 s, and extension at 345 K for 60 s. Two hundred and forty seconds for the initial denaturation and 300 s for the final extension are added. Total run time of PCR is approximately 105 min for control amplification.
After the PCR process is finished, the products are collected in a vial from the chamber and mixed with 1× blue dye. The PCR products are analyzed by gel electrophoresis (Mini-Sub Cell GT System, Bio-Rad). 10 μL of each sample are loaded onto 2% of agarose gel (Certified Molecular Biology Agarose, Bio-Rad) and electrophoresed in 10× Tris/Boric Acid/EDTA (TBE) buffer. The gel is run for about 30 min at 250 V. After electrophoresis, the gel is stained with 10 mg/mL ethidium bromide solution (Bio-Rad) and visualized by UV transillumination.

4. Results and Discussion

In the following we comprehensively examine the influences of thermal and operational parameters on the temperature distributions and the ramping rates inside the chamber. The chamber is exposed to three heating regions and two convective cooling regions. The experimental temperature profiles and numerical simulations while taking the thermal contact conductance coefficients into consideration are then compared. Finally, the PCR experiments are carried out in this bidirectional thermocycler.

4.1. Various Parameters on the Heat Transfer

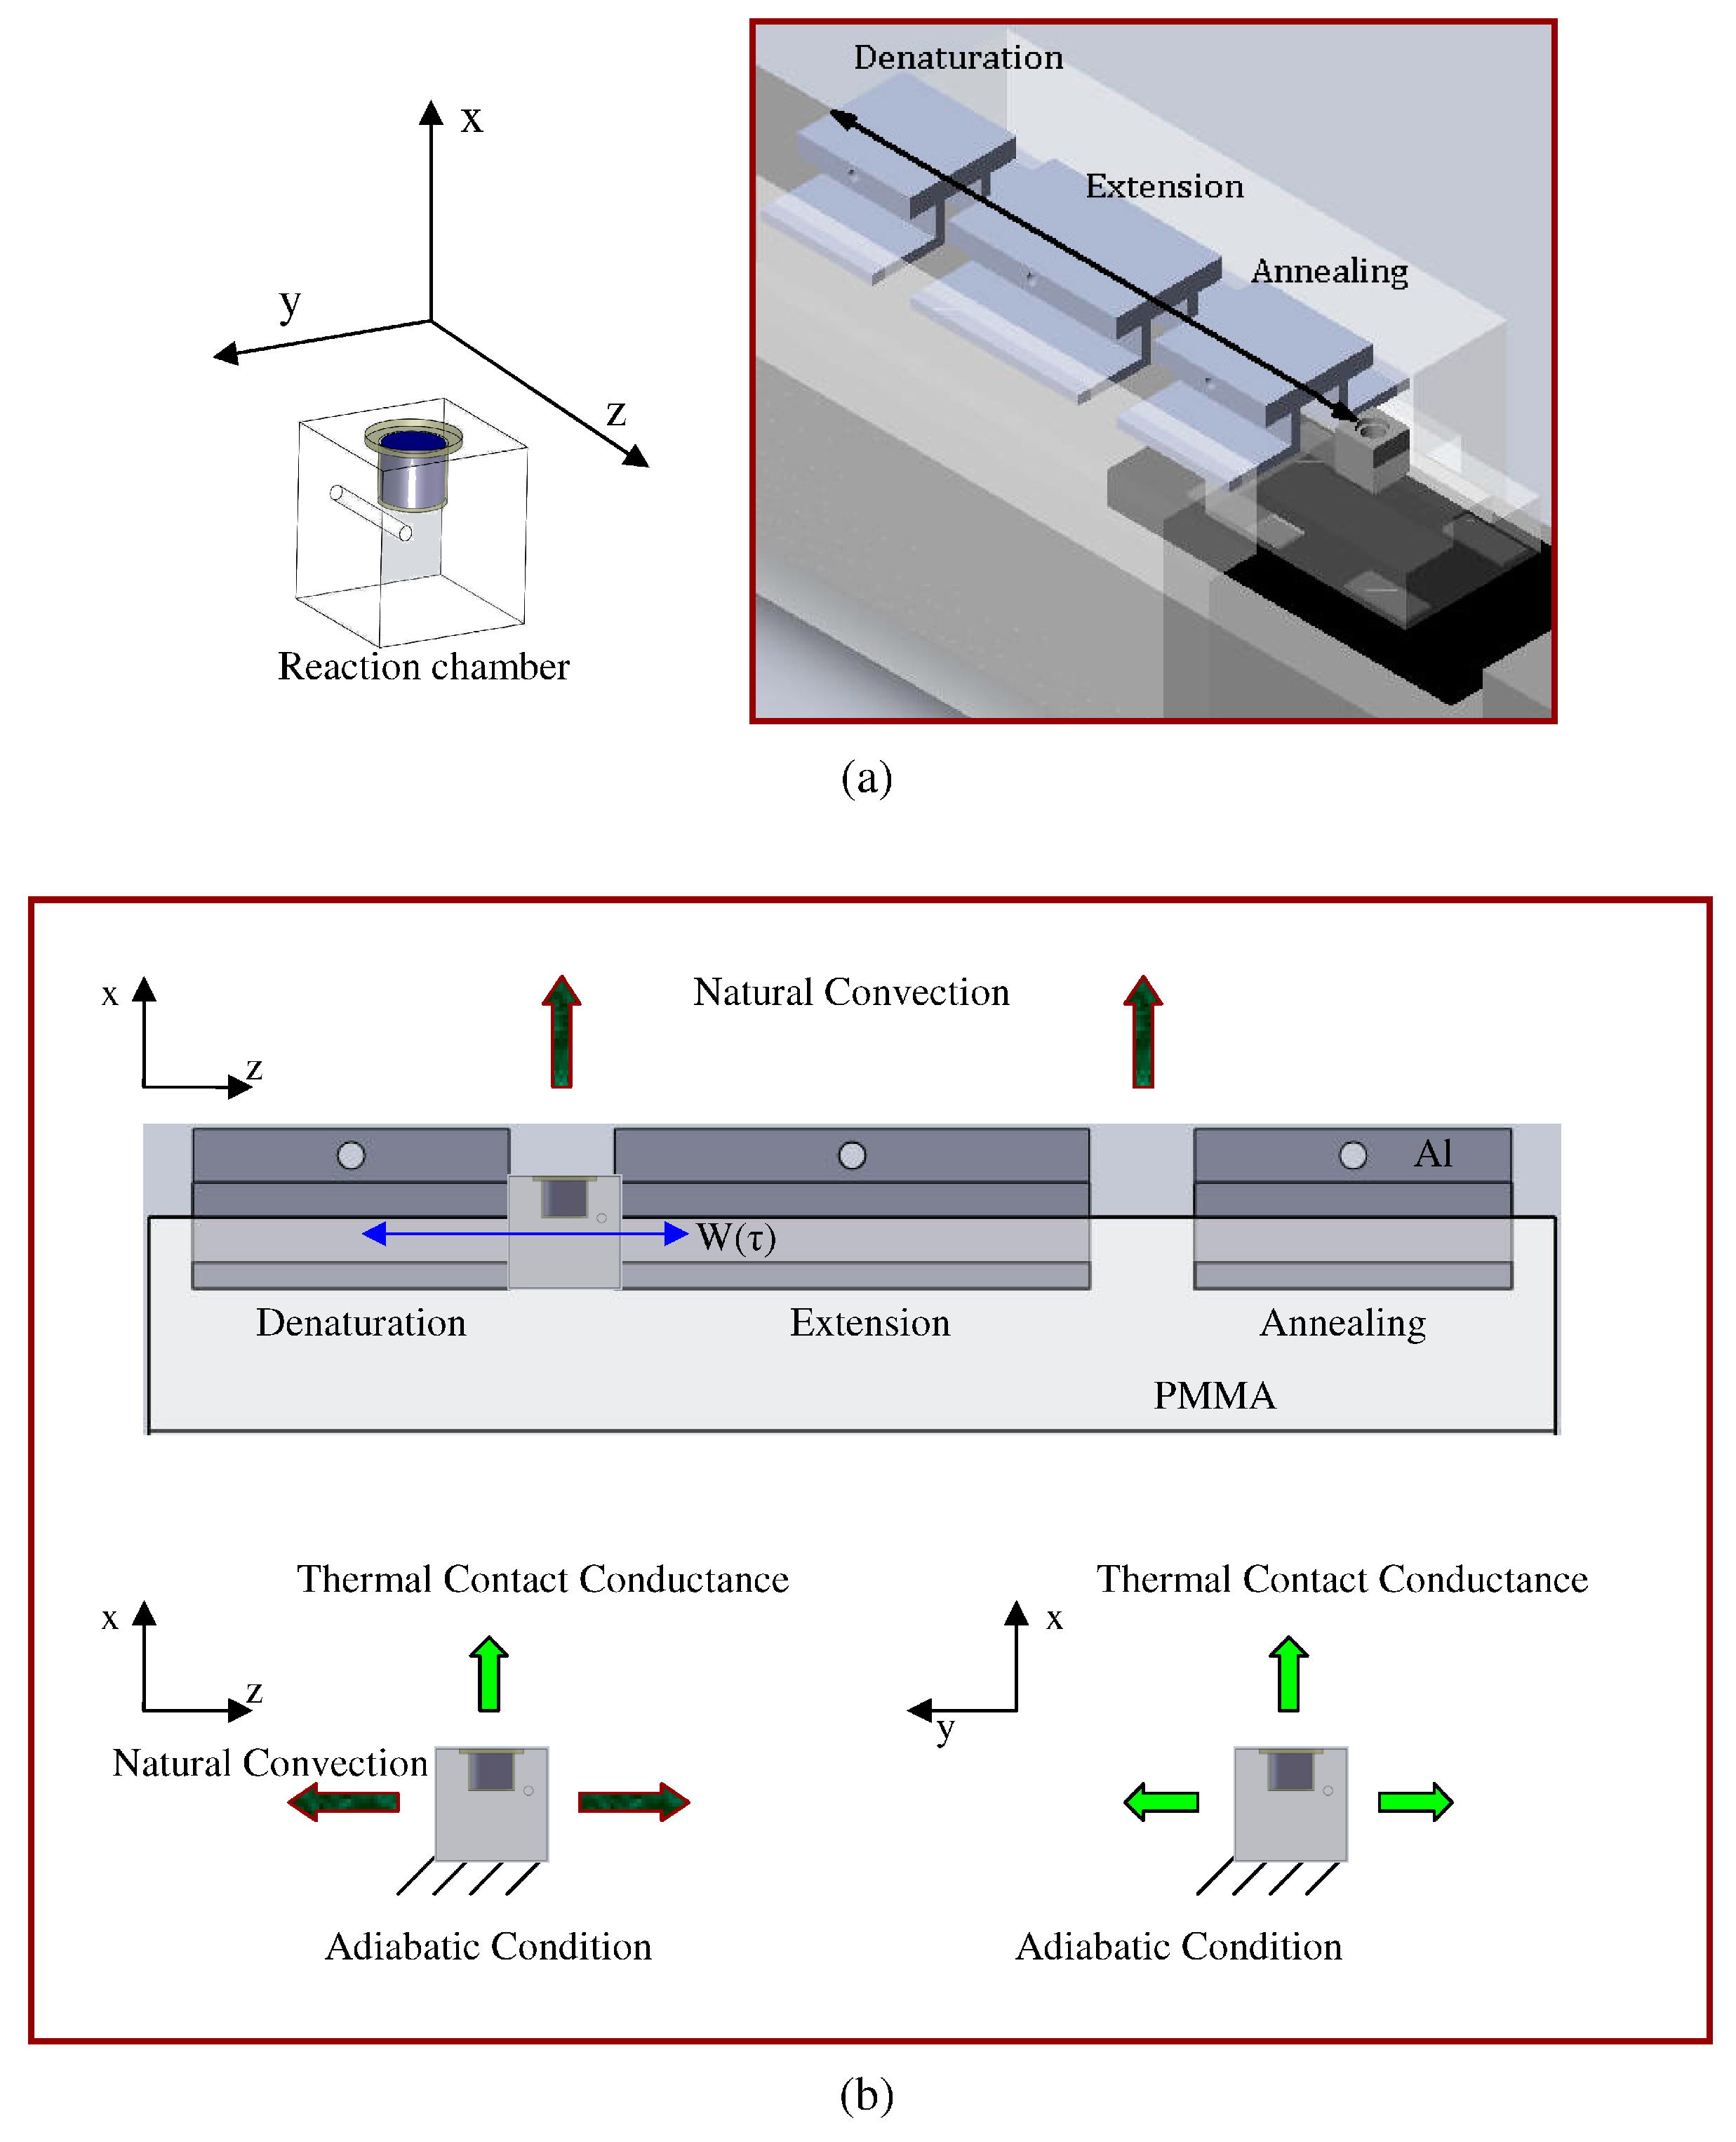
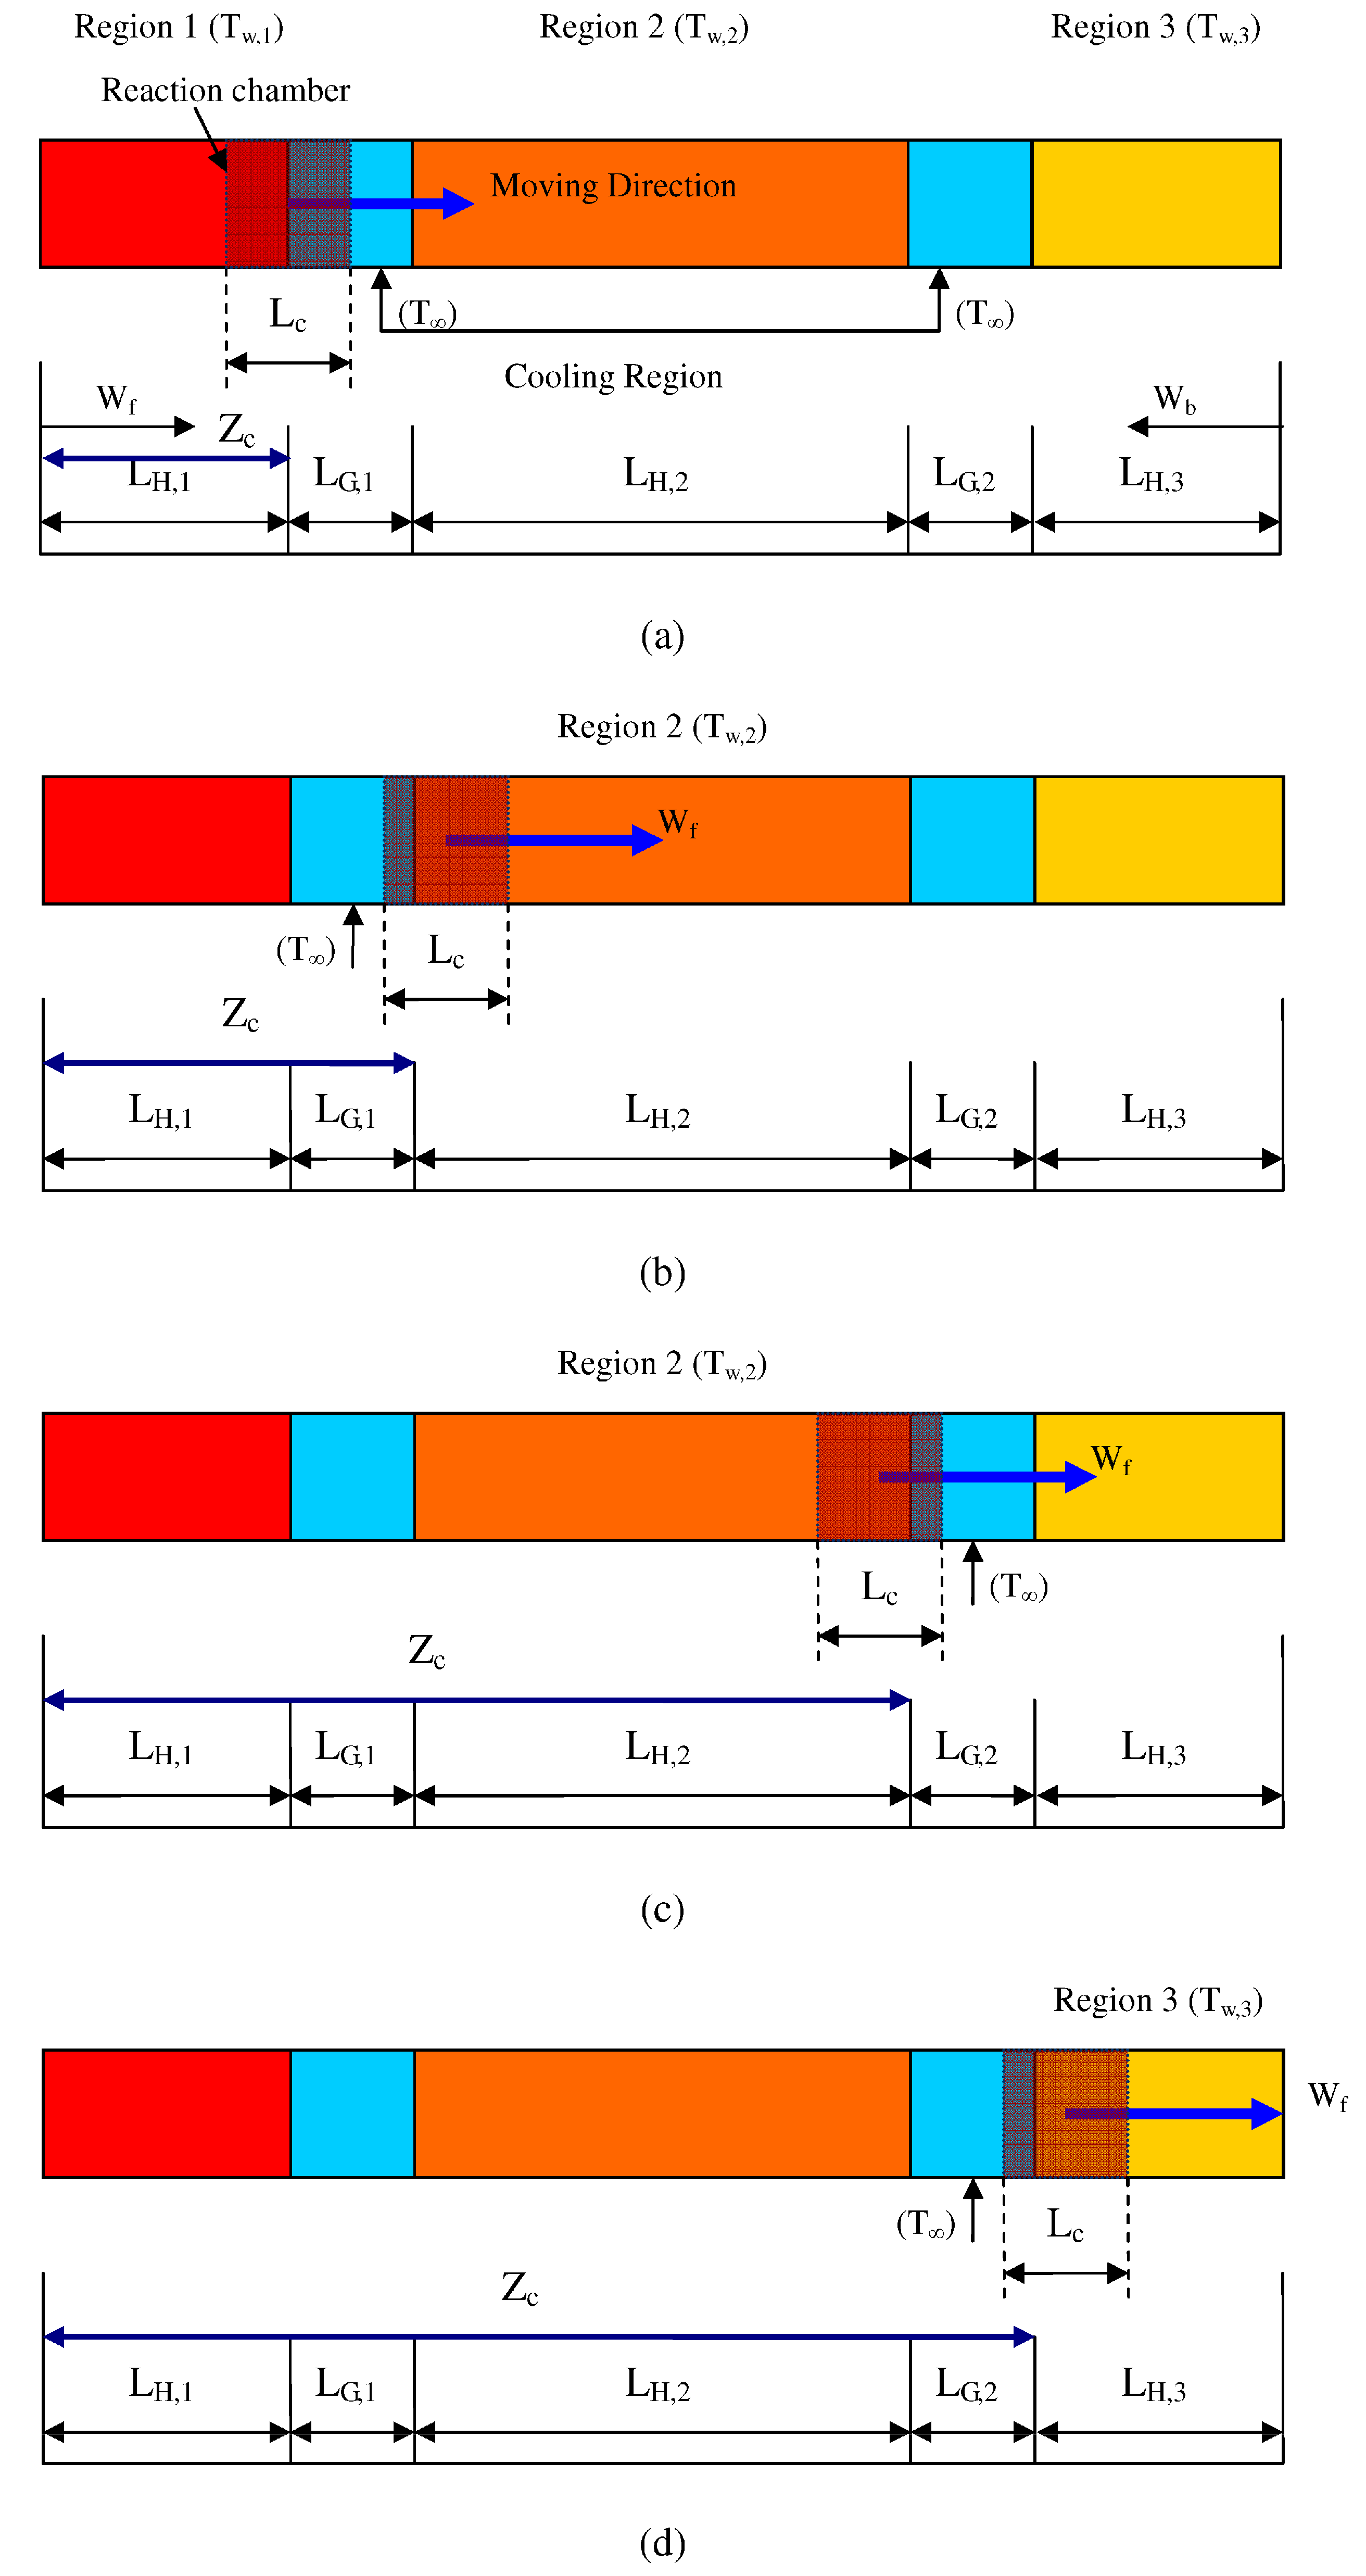
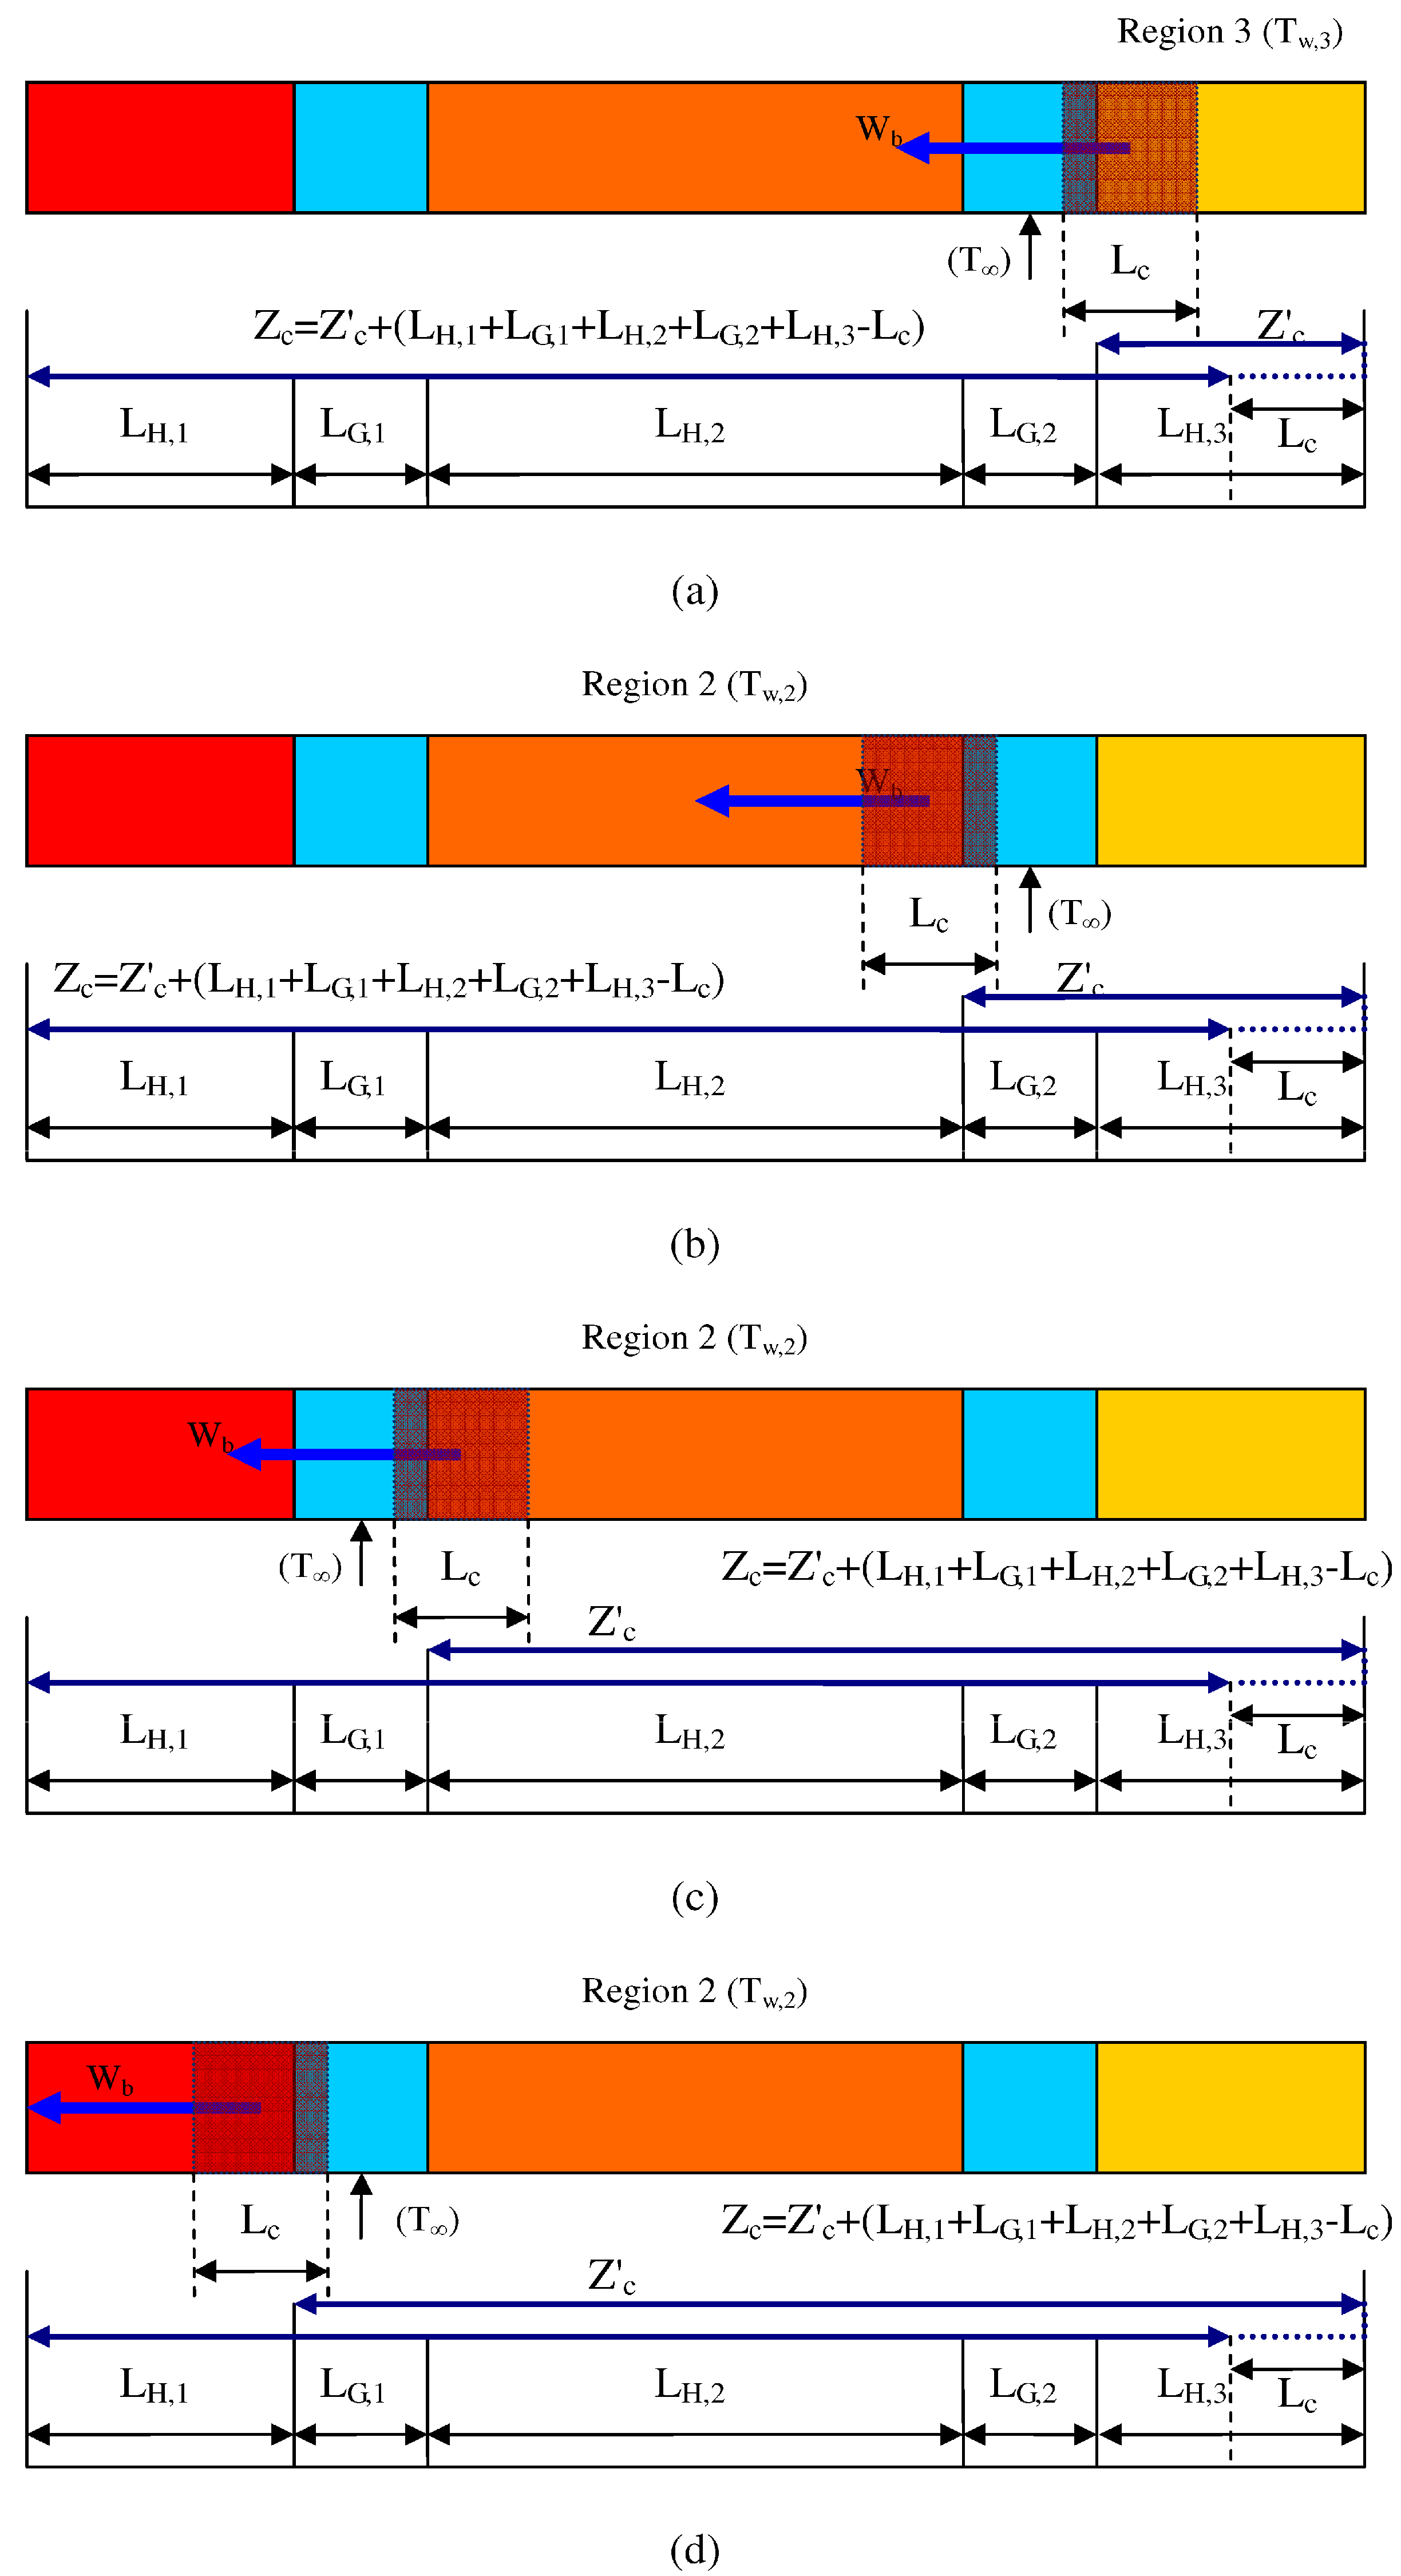
This section focuses on the influence of various parameters on the heat transfer in the physical problem. Closely examining the pattern of numerical temperature distributions for various thermal contact conductance coefficients, external convective parameters and operational parameters should reveal the nature of thermal characteristics during thermal cycling. During one thermal cycle, the chamber moves along the path at a forward speed equal to 4.2 mm/s from the beginning of the first heating region, then changed to 0.6 mm/s at the beginning of the second cooling region, and finally a backward speed equal to 0.6 mm/s. Aluminum is selected to be the chamber substrate. The chamber moves through the three heating blocks at temperatures of 369, 345 and 328 K. The thermal contact conductance coefficient, hr, is set to be 700 W/m2K [23,24]. The heat of the back and front side faces of the chamber is transferred by air convection. The heat transfer coefficient for natural convection, hc, is set to be 6.5 W/m2K [21]. The gaps between the heating blocks are exposed to temperatures of 350 and 335 K which are average temperatures of three measured points in the air gaps between region T1 (369 K)/region T2 (345 K) and region T2/region T3 (328 K), respectively. The above values of the parameters are used unless otherwise stated.
In this study, the PCR chamber oscillates among three working regions. It is not practical to assume that the heaters are in perfect contact with the chamber to maintain three designed temperature regions as required for PCR processes. In reality even the flat surfaces of all materials become rough when seen through a microscope. When two such surfaces contact each other, the interface between them offers some resistance to heat transfer. This resistance is called the thermal contact resistance, and a temperature drop will be observed at the interface between the two surfaces in contact [21]. When two materials are in contact, surface roughness introduces gaps between these contacting materials, which are usually filled with air. The thermal conductivity of air is much lower than the conductivity of common solid materials. Therefore, the heat transfer due to conduction is smaller in noncontacting regions than that in perfectly contacting regions [
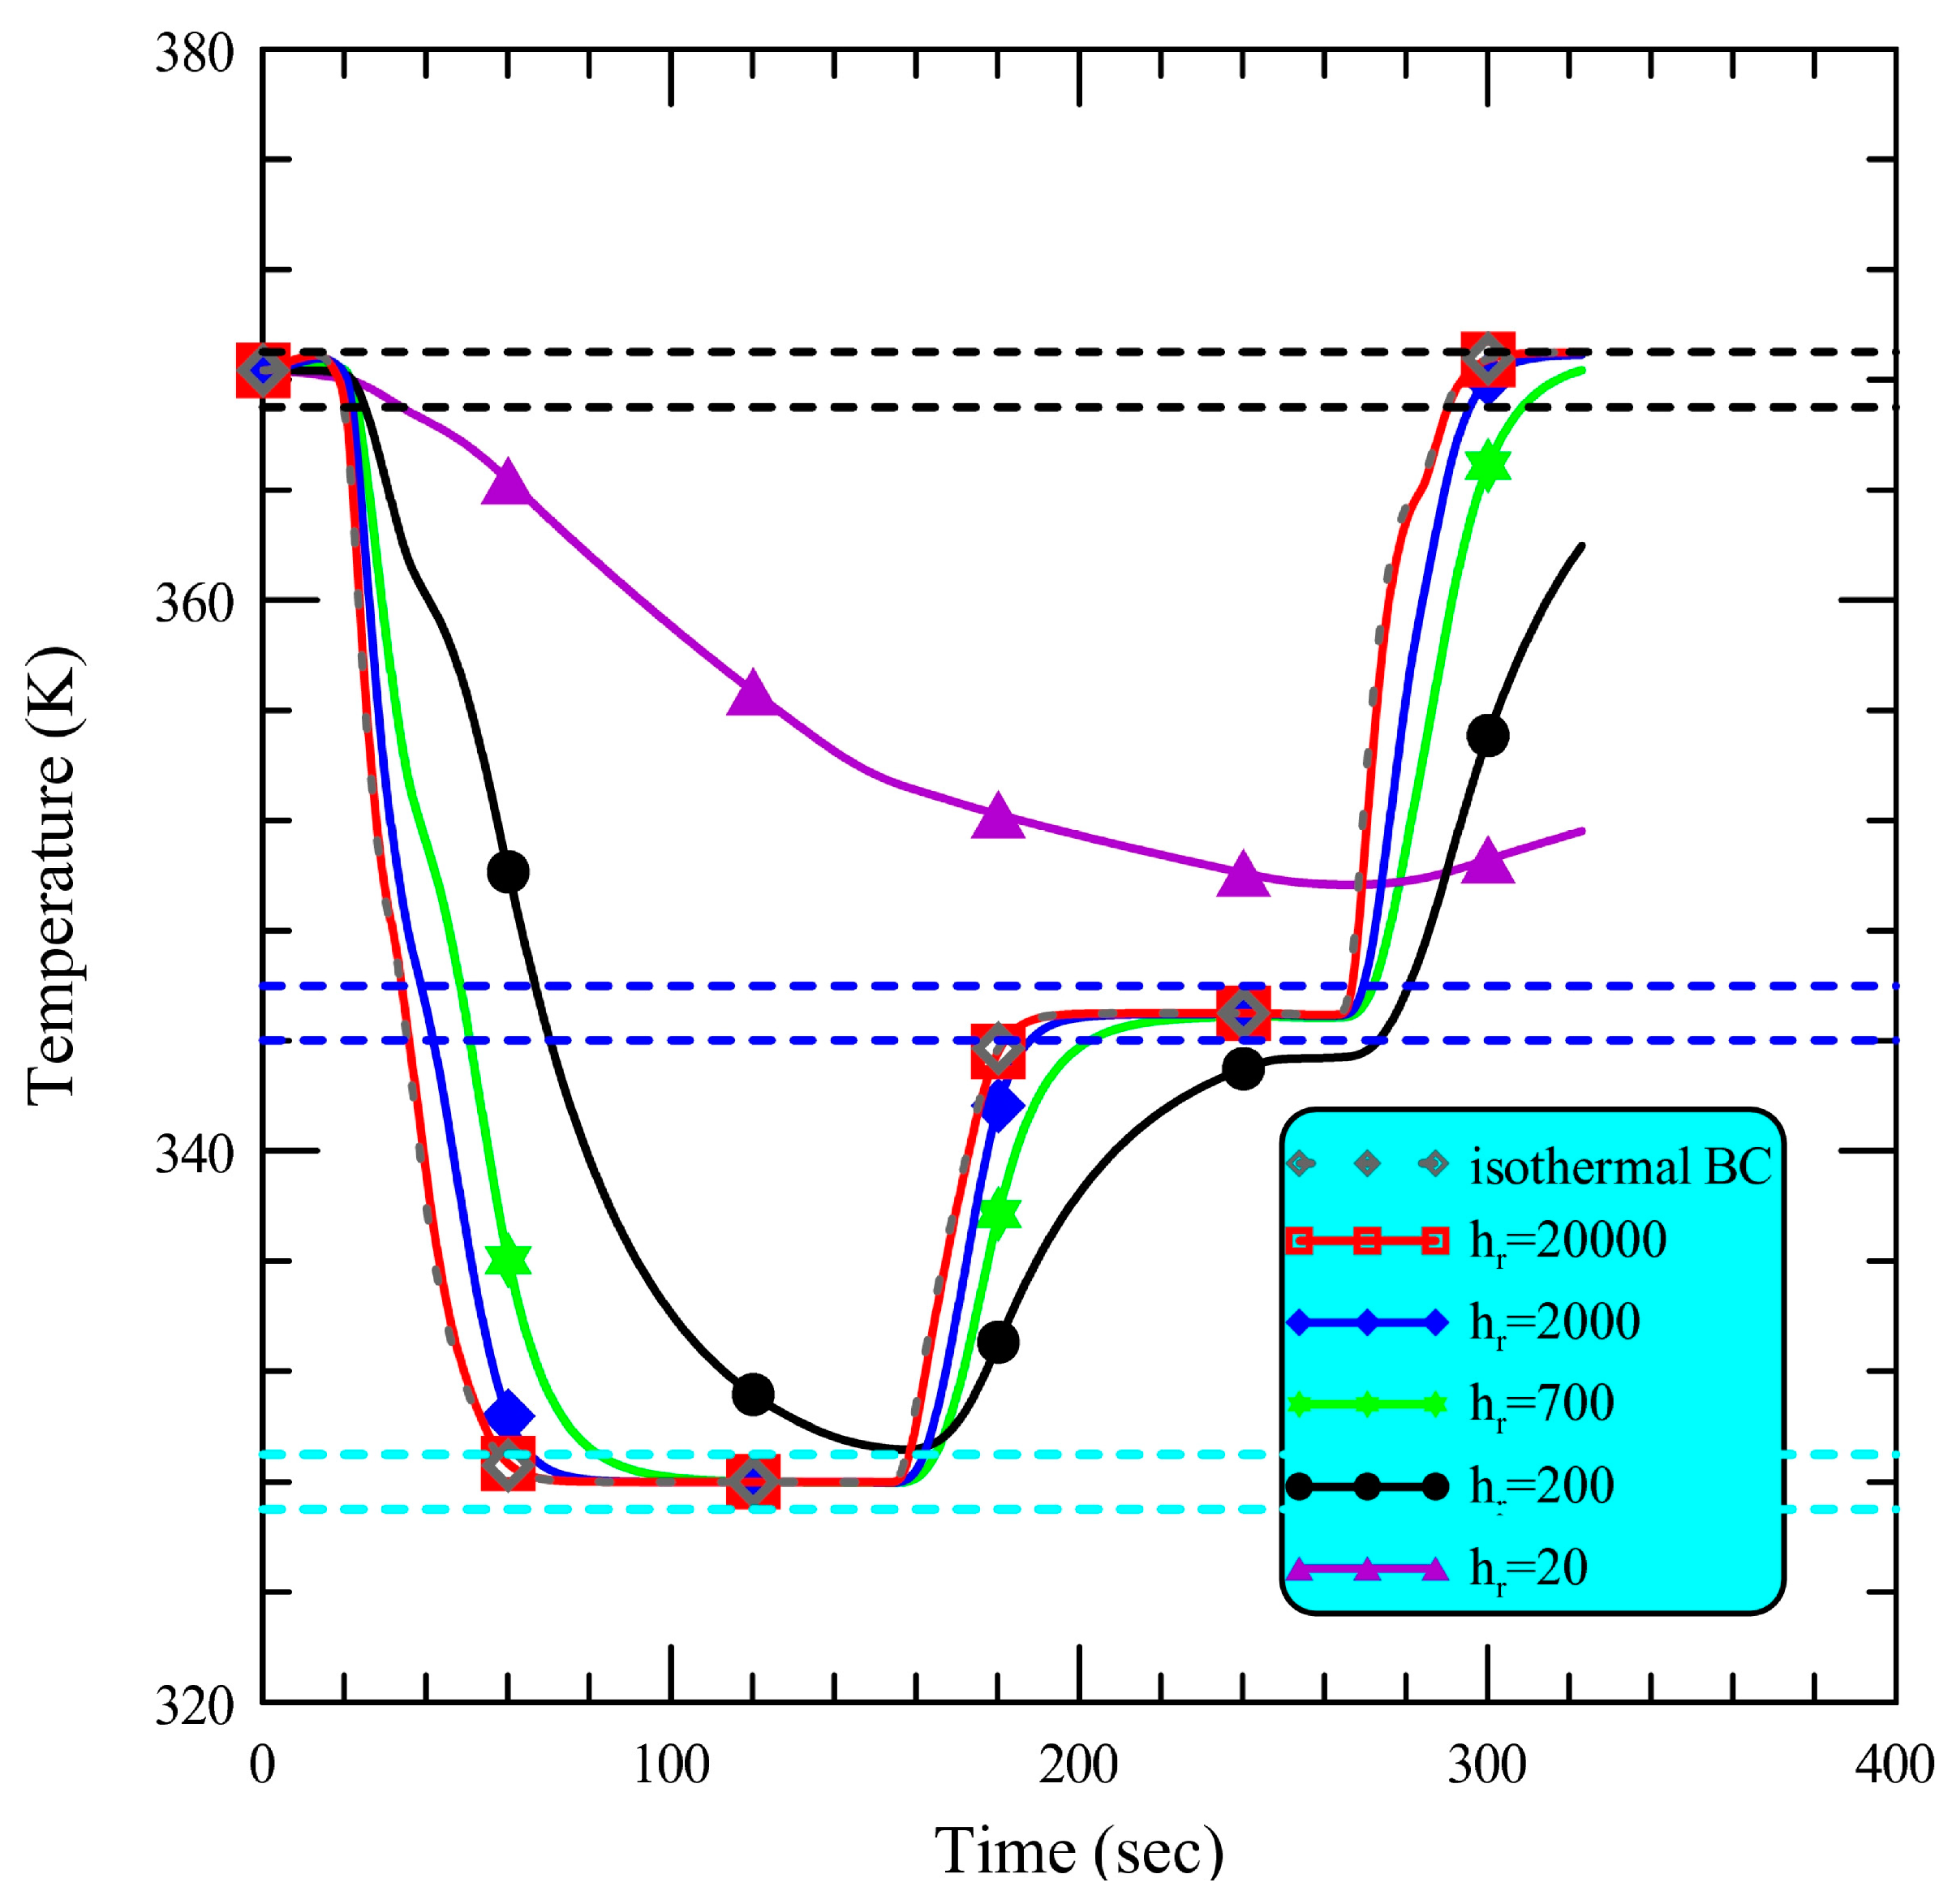
23]. Thermal contact resistance is the inverse of the thermal contact conductance coefficient. Up to now no comprehensive theory can be used to predict the thermal contact conductance coefficient, nor have experimental studies yielded completely reliable empirical correlations. Usually, the thermal contact conductance coefficient is occasionally reported in the absence of more specific information. Simulation results of the central temperature profiles of the sample at various thermal contact conductance coefficients, hr, between the heater surface and the chamber surface in contact are revealed in Figure 5. The result of the specified isothermal boundary condition at the chamber surface when the chamber is moving inside the heating region is also shown in Figure 5 (grey dashed line with rhombus markers). The imposed isothermal boundary condition at the chamber surface represents that the heaters are assumed to be contacted perfectly with the chamber. The central temperature of the sample keeps at the required denaturation temperature for about 20 s at the beginning of the thermal cycle, the temperature drops abruptly to the required annealing temperature by moving to the annealing region, then the extension temperature is reached inside the chamber when the chamber moves back to the extension region, and finally the temperature is increased to be the denaturation temperature and the next thermal cycle starts after the chamber enters the denaturation region. Changes to the value of hr can have a significant impact on the temperature field, where hr increases from 20 to 20,000 W/m2K. The temperature profile with the isothermal boundary condition is almost the same as that with an hr of 20,000 W/m2K. It shows that the contact surface imposed with the isothermal boundary condition is the interface with a very large hr. The heat resistance can be negligible between the heater and the chamber surfaces, and the perfect contact at the interface is assumed. The dotted lines shown in Figure 5 are the chamber temperatures uniformly distributed with a variation less than 2 K during three PCR steps (i.e., denaturation step ranged from 367 to 369 K, extension step from 344 to 346 K, and annealing step from 327 to 329 K). The sample temperature can reach the reaction temperature rapidly with a high hr when the chamber moves into the working region, and the duration times can be kept longer at the higher value of hr. The heat transfer from the heater to the PCR chamber is reduced with the decreasing of the value of hr. It results in the increasing of the required times to reach the specific temperatures. For an hr less than 200 W/m2K, the sample temperature profiles cannot reach the required PCR temperatures. A small hr can be seen as high thermal contact resistance. We found that the total reaction time is long when the contact resistance is large. By improving the thermal contact effect between the chamber surface and the heater surface, the required PCR time will be dramatically reduced.
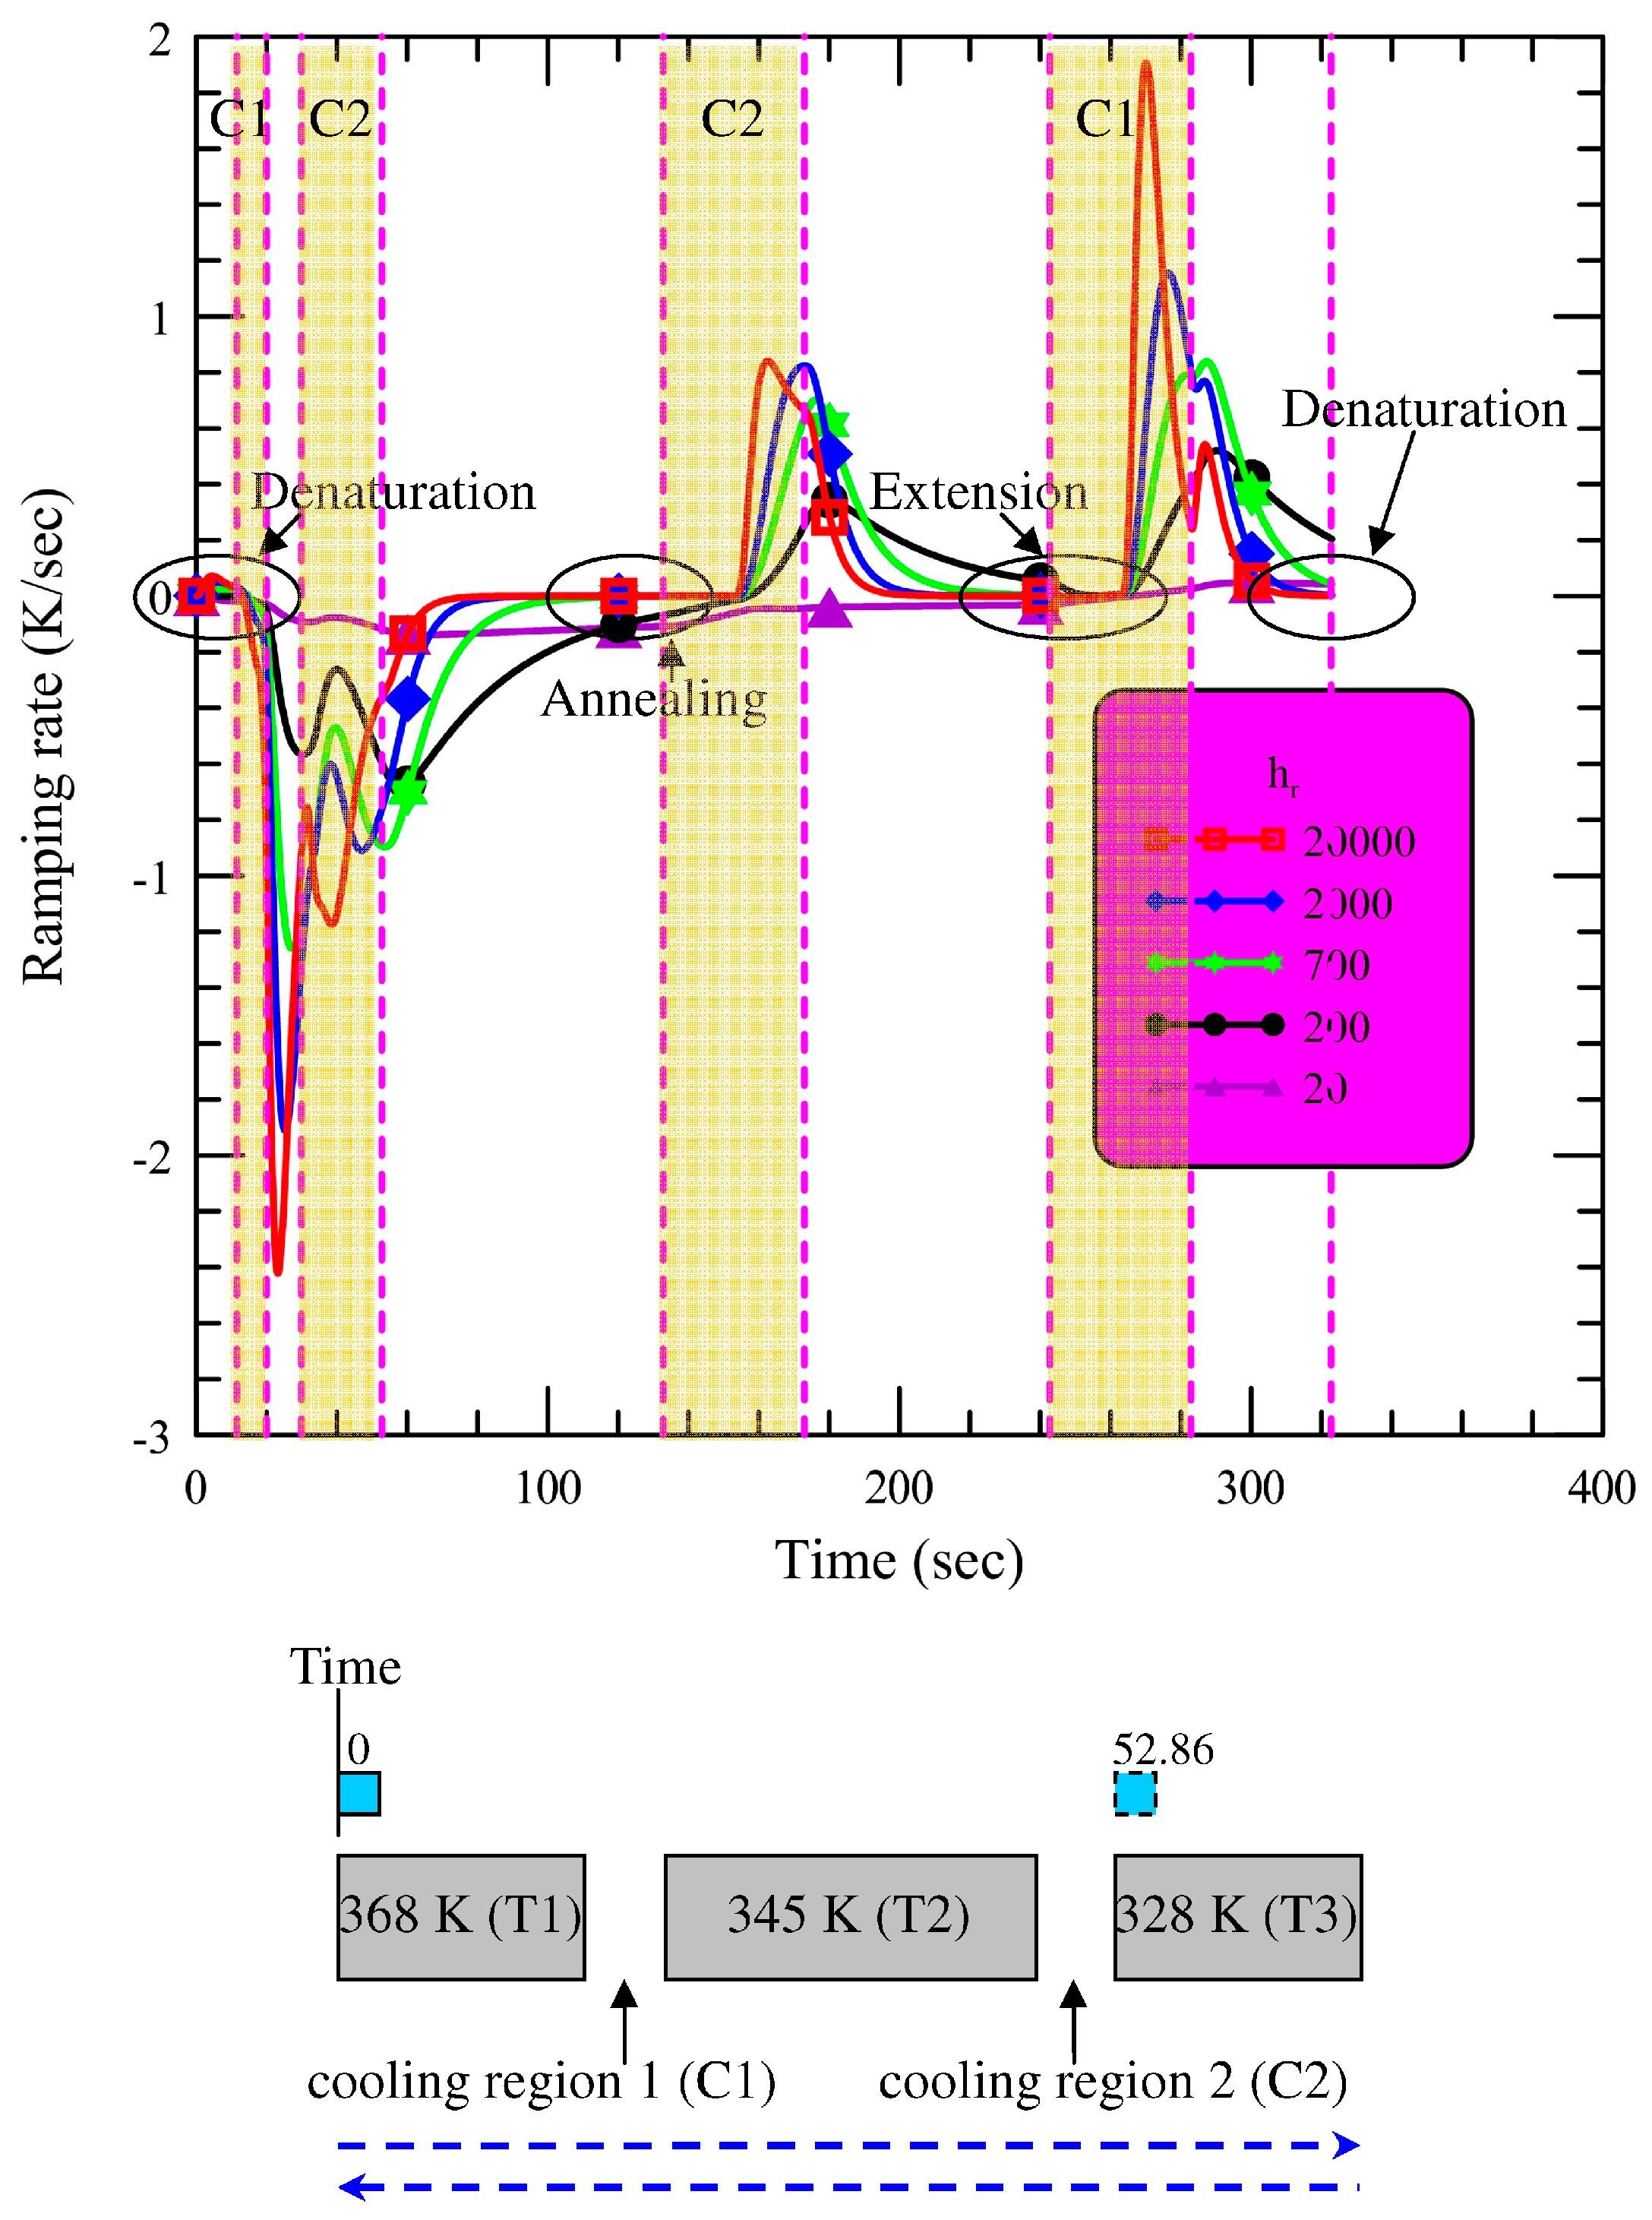
For efficient DNA amplification, the temperature change of the sample is one of the main concerns during the PCR process. Ramping rate is defined as the rate of change in temperature over time, as it determines how fast the PCR device can change temperatures, and therefore how rapidly it can achieve a given number of thermal cycles. From the previous results in Figure 5, it shows that the effects of various thermal contact conductance coefficients have a significant impact on the thermal field of the reaction chamber. To further realize the influence of various hr on the temperature change of the chamber, the profiles of the ramping rates of the sample are depicted in Figure 6. The positive value of the ramping rate is taken as the heating rate, and the negative one is the cooling rate. The chamber starts from region T1 (368 K), then passes region T2 (345 K) and approaches region T3 (328 K). During the time period from 0 to 52.86 s, the chamber temperature is decreased from 368 to 328 K and the DNA sample is moving from the denaturation step to the annealing step. Results show a negative ramping rate of the chamber and the maximum cooling rate rises with the increasing of hr. With the higher hr the chamber temperature can reach the reaction temperature more rapidly and drop faster. When the chamber goes through region T2, we can find that the cooling rate starts to decrease. And then the chamber passes the second cooling region and the cooling rate increases again. After entering region T3, the cooling rate decreases for a second time and the zero value of the ramping rate is shown. It means that the annealing step is proceeding. When the chamber arrives at the end of region T3, the linear motor is reversed. When the chamber comes into region T2 from region T3, the positive ramping rate of the chamber is shown. The zero value of the ramping rate is observed again, and the sample in the chamber is moving on to the extension step. The chamber keeps moving to region T2 and one thermal cycle is finished when the chamber re-enters region T1. The chamber continues from region T2 to region T1. It shows that the heating rate increases rapidly and the denaturation step is coming. And then the maximum heating rate can be enhanced with the increasing of hr. Thus the ability to conduct heat between the heater and the chamber surface is dominated by the thermal contact conductance coefficient. The ramping rate of the chamber during PCR can be improved by reducing the thermal contact resistance.
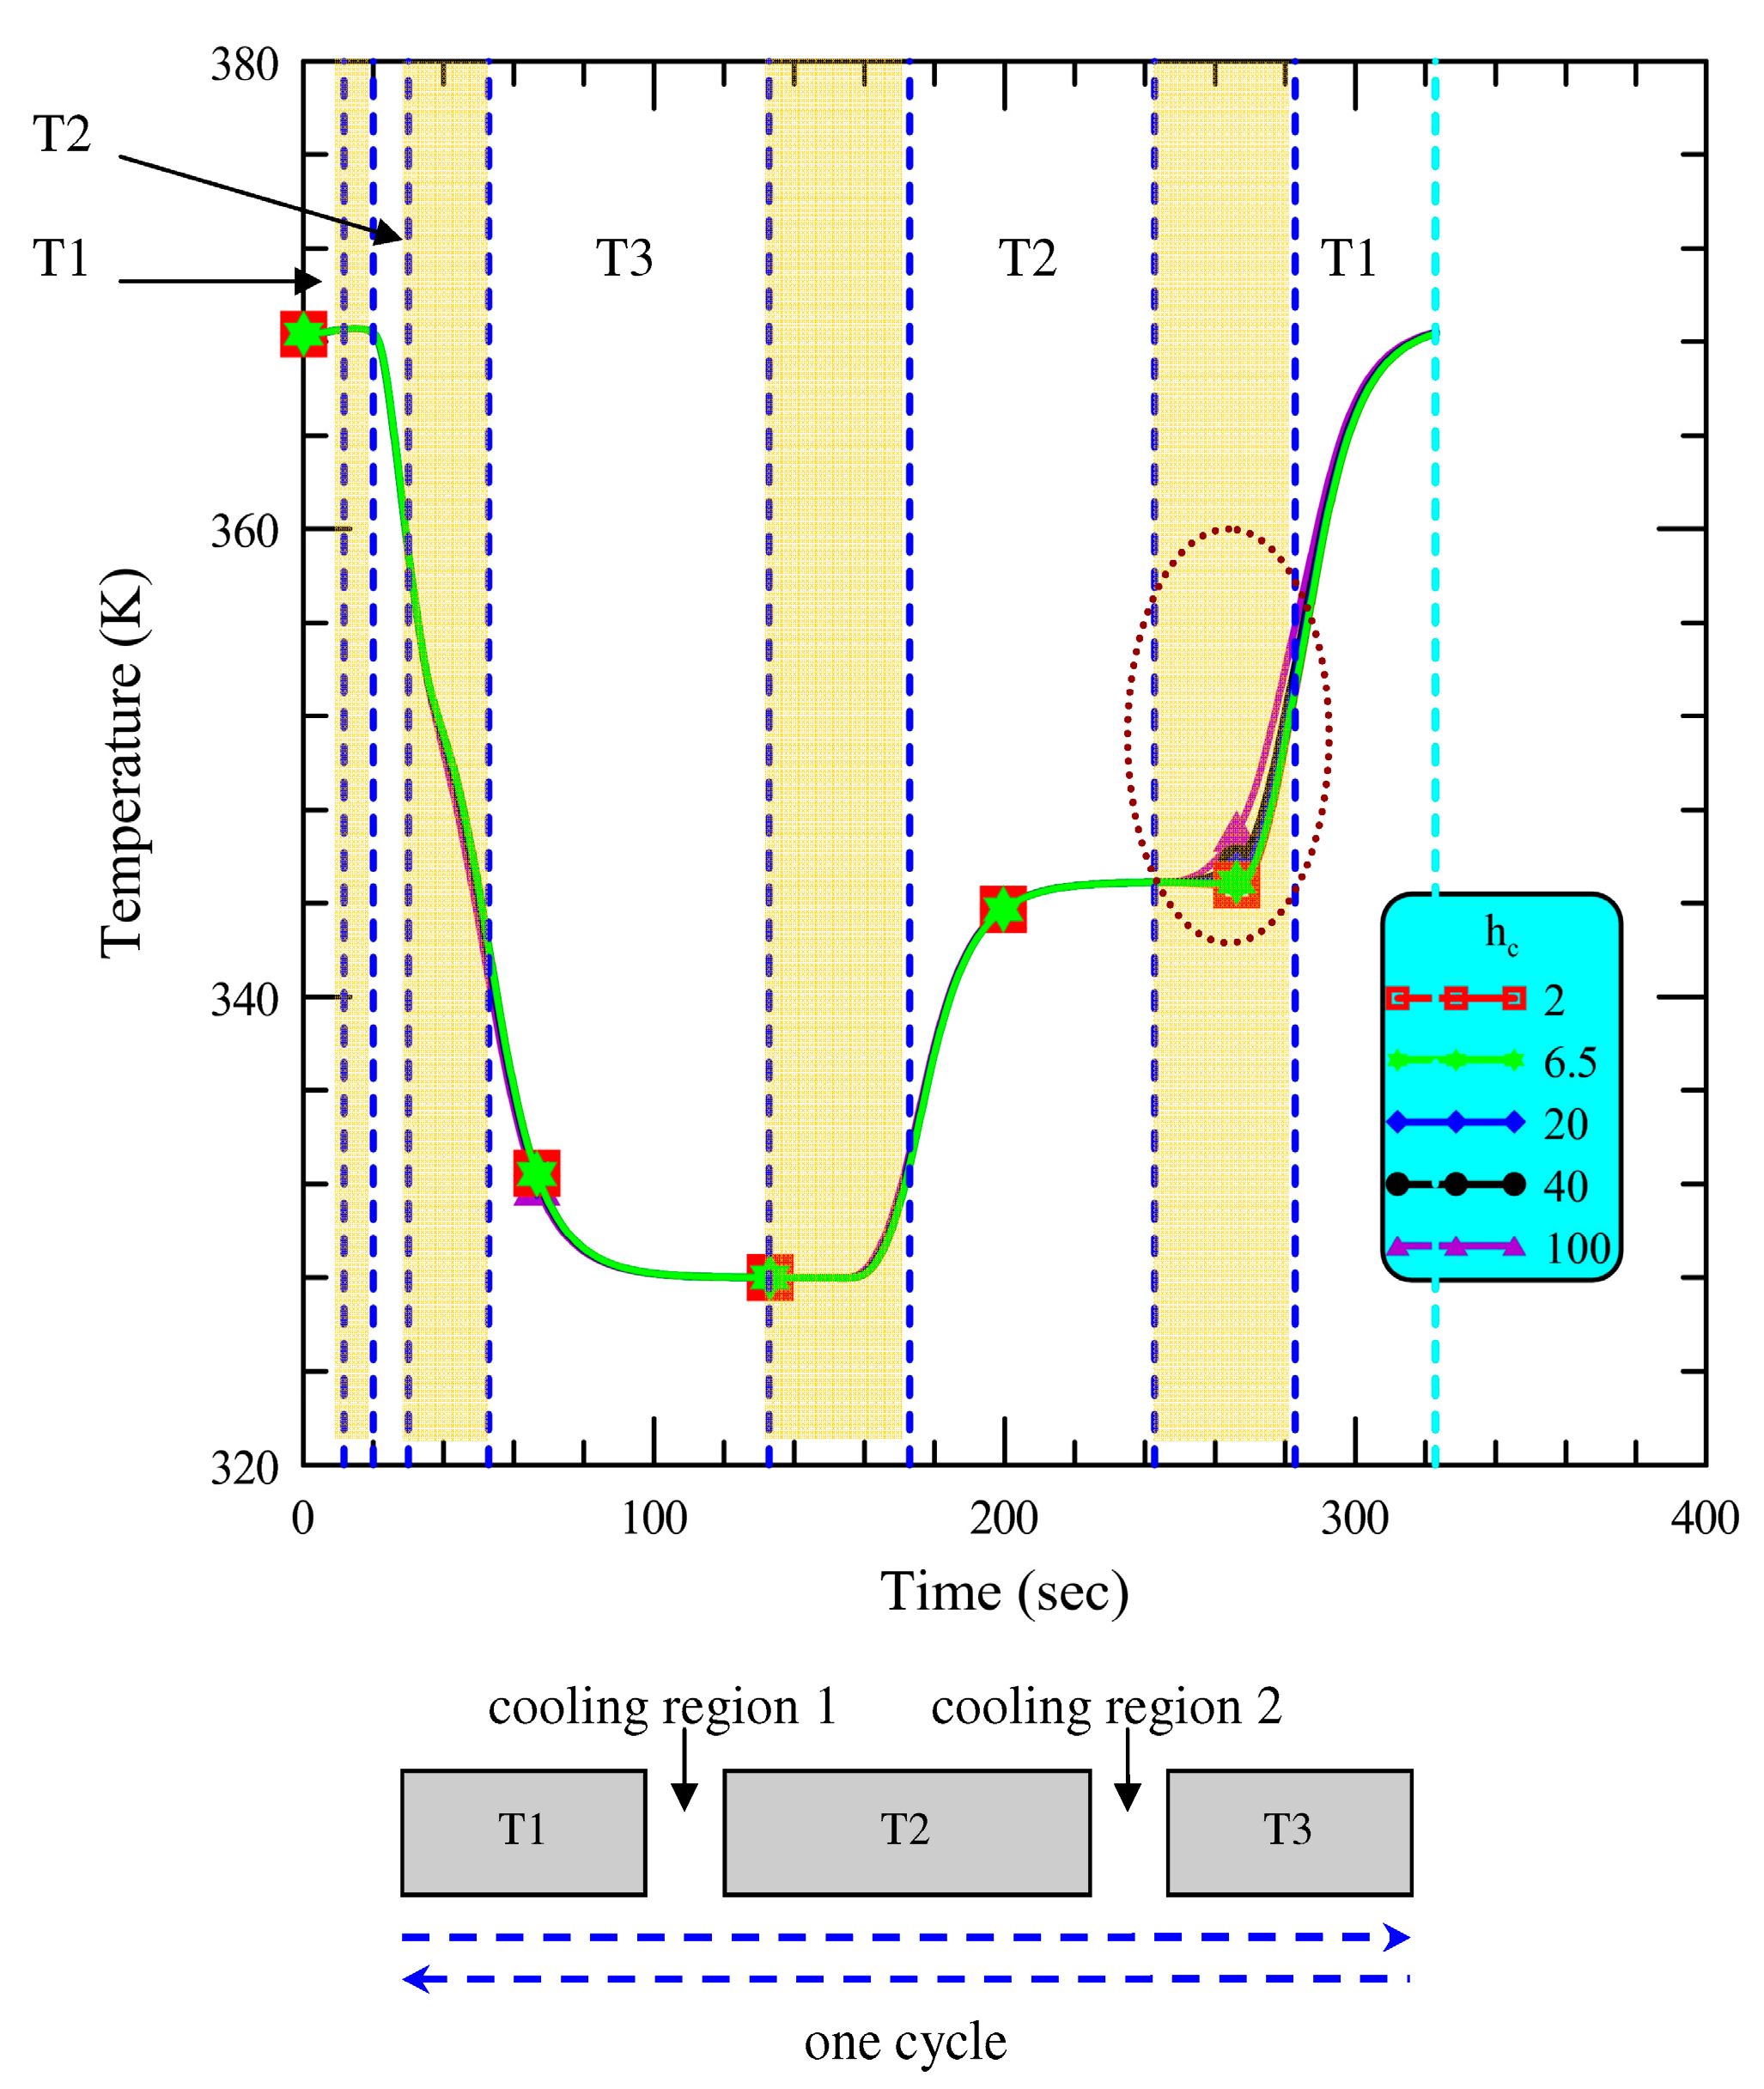
As the PCR chamber passes between two working regions, the stored heat will be transferred by ambient air. In order to examine the convection cooling effect, the influence of various convective heat transfer coefficients on the temperature in the reaction chamber is illustrated in Figure 7. Simulation results of the central temperature of the sample are revealed. The PCR chamber oscillates among three temperature regions (region T1, region T2 and region T3). The chamber moves through region T1 (right side in Figure 7), and the temperature reaches the denaturation temperature gradually. When the chamber passes through region T1, the speed of the chamber is escalated to 4.2 mm/s. The chamber passes region T2 quickly. The speed is then dropped down to 0.6 mm/s at the beginning of cooling region 2 and the temperature approaches the annealing temperature. When the chamber proceeds with the annealing step, the linear motor is reversed to push it back. The speed of the chamber is kept at 0.6 mm/s and the chamber continues and the annealing reaction is completed. The chamber keeps moving to region T2 and starts the extension step. One PCR thermal cycle is completed when the chamber re-enters region T1. The moving direction is again reversed as the chamber reaches the end of region T1. The result shows that the temperature of the sample can achieve the reaction temperature during the reaction time, and the temperature profiles are almost the same when hc ranges from 2 up to 100 W/m2K. Through these two cooling regions (golden regions in Figure 7), the duration time is 2.86, 20, 20, and 20 s, respectively, for each cooling region (from left side to right side in Figure 7). During these periods, the chamber is partially in the heating region and partially in the cooling region. Only when the chamber moves backward through the cooling region between region T2 and region T1, the temperature of the sample with the convective heat transfer coefficient equal to 100 W/m2K is higher than the others (the oval shown in Figure 7). It results from the large temperature difference between the chamber surface and the heater surface plus the high forced convective effect. The gaps between the heating blocks are exposed to temperatures of 350 K and 335 K which are higher than the ambient temperature (i.e., 300K). So the ability of the air cooling effect is not great, and the difference among the effects of various convection coefficients on the central temperature of the chamber is not obvious. Even when cooling by the forced convective effect at the cooling regions, where hc is greater than 20 W/m2K, the stored energy inside the chamber transferred by ambient air is similar.
Figure 5. The center temperature profiles of sample with various thermal contact conductance coefficients.
Micromachines 05 01445 g005
Figure 6. The ramping rates of sample with various thermal contact conductance coefficients.
Micromachines 05 01445 g006
Figure 7. The center temperature profiles of sample with various external convective heat transfer coefficients.
Micromachines 05 01445 g007
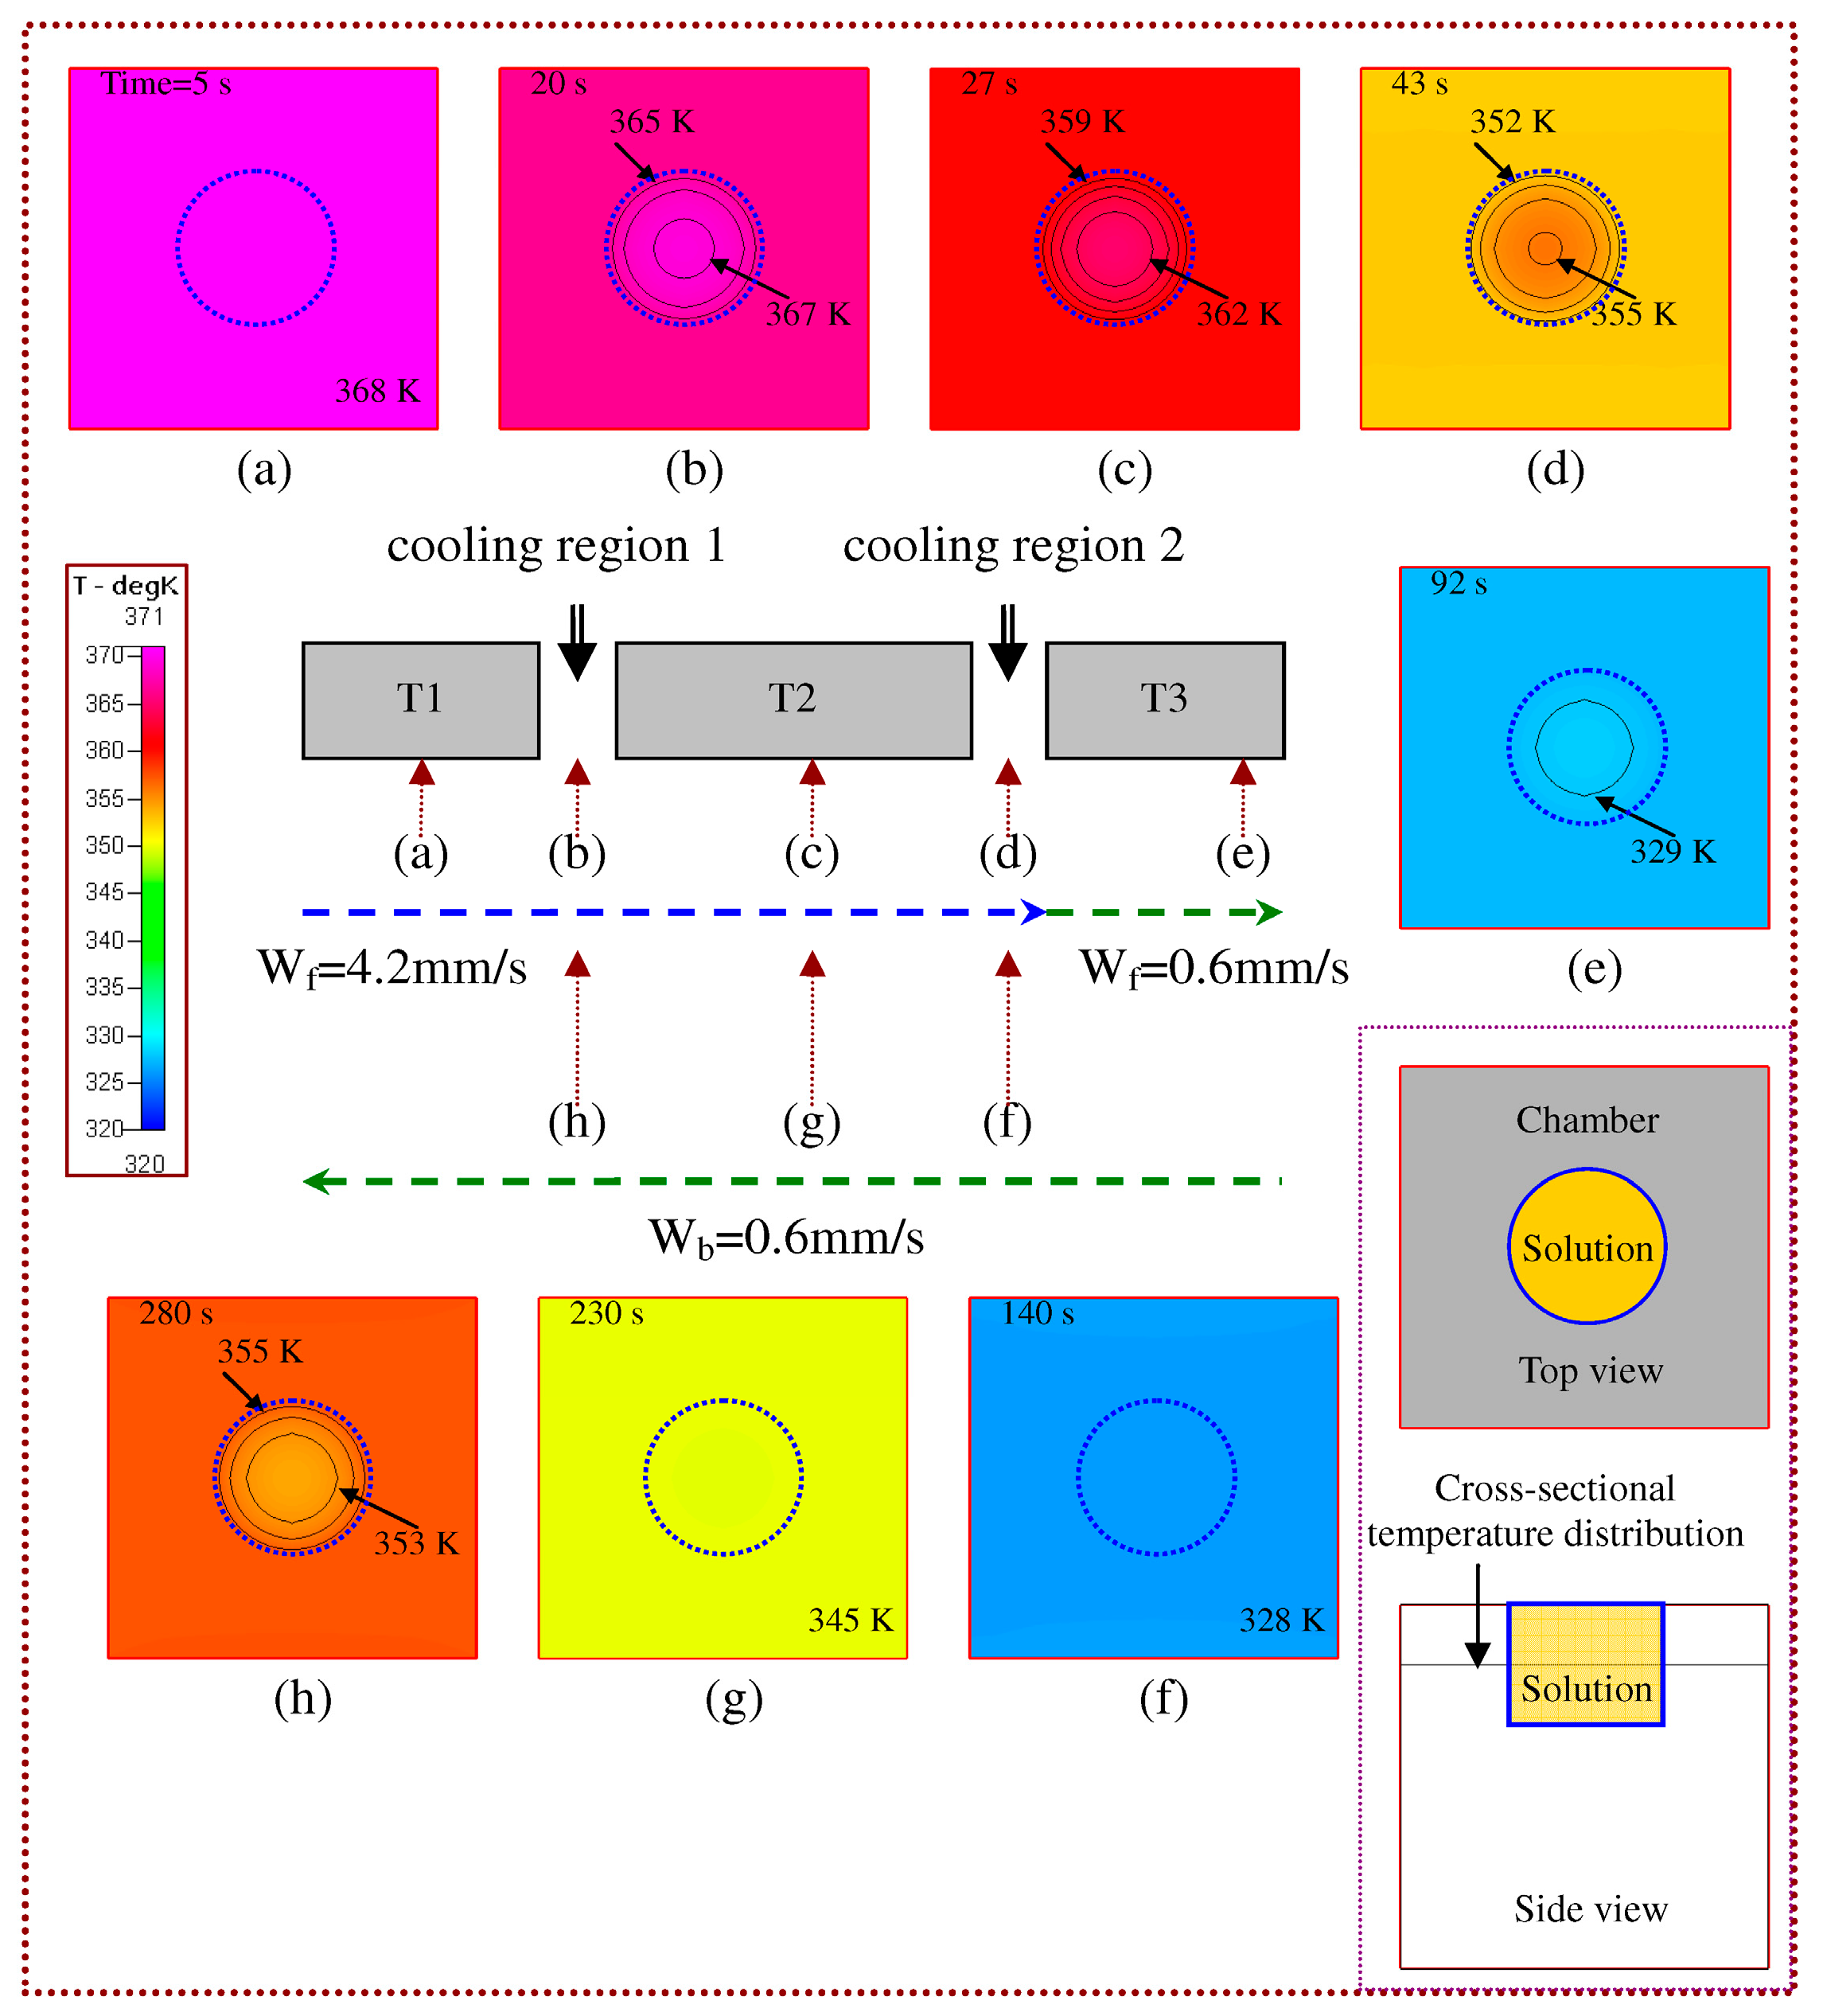
To further perform a comprehensive analysis of the thermal characteristics in the chamber, the cross-sectional temperature distributions are used. From the previous results in Figure 7, it can be found that the influence of various convection coefficients on the central temperature of the chamber can be neglected. The temperature distributions on the cross section at a depth of 2 mm below the chamber surface (shown at the bottom of the right-hand side in Figure 8) at the times of 5, 20, 27, 43, 92, 140, 230, and 280 s are illustrated from Figure 8a–h) for hc set at 6.5 W/m2K. These pictures demonstrate the contour maps of the cross-sectional temperature distributions when the chamber is near the central locations of region T1, cooling region 1, region T2, cooling region 2, region T3, cooling region 2, region T2 and cooling region 1, respectively. Because the thermal diffusivity of the chamber is very large, the non-uniformity of the temperature distribution at the outer area is negligible. The speed of the chamber is increased to 4.2 mm/s after the chamber moves forward from region T1. When the chamber passes through region T1 between 0 and 11.43 s, the temperature distribution is uniform and almost equal to 368 K. The denaturation temperature in the chamber is shown in Figure 8a. When the chamber enters the cooling region 1 between 11.43 and 20 s, the heat is transferred from the chamber to the ambient air and the chamber temperature is decreased. The non-uniform temperature distribution inside the solution can be observed (Figure 8b). The solid line in Figure 8b refers to the contours of constant temperature. The spacing between two adjacent contour lines is 1 K. During the period from 20 to 30 s, the chamber moves through region T2. The energy transferred from the chamber becomes large and the non-uniformity effect of the solution temperature is very clear (Figure 8c). As the chamber passes over region 2, it slows down to a speed of 0.6 mm/s. When the chamber reaches at the end of region T3, the linear motor is reversed. The speed of the chamber is kept at 0.6 mm/s and the chamber proceeds backward to region T1. The temperature distributions in Figure 8d,h show a little non-uniformity when the chamber moves forward through the following cooling regions respectively. Results shown in Figure 8e,g present the uniform temperature distributions of the chamber and thus the annealing and the extension steps can be achieved. It is obvious that the uniform temperature inside the solution of the chamber can be obtained during the three PCR steps.
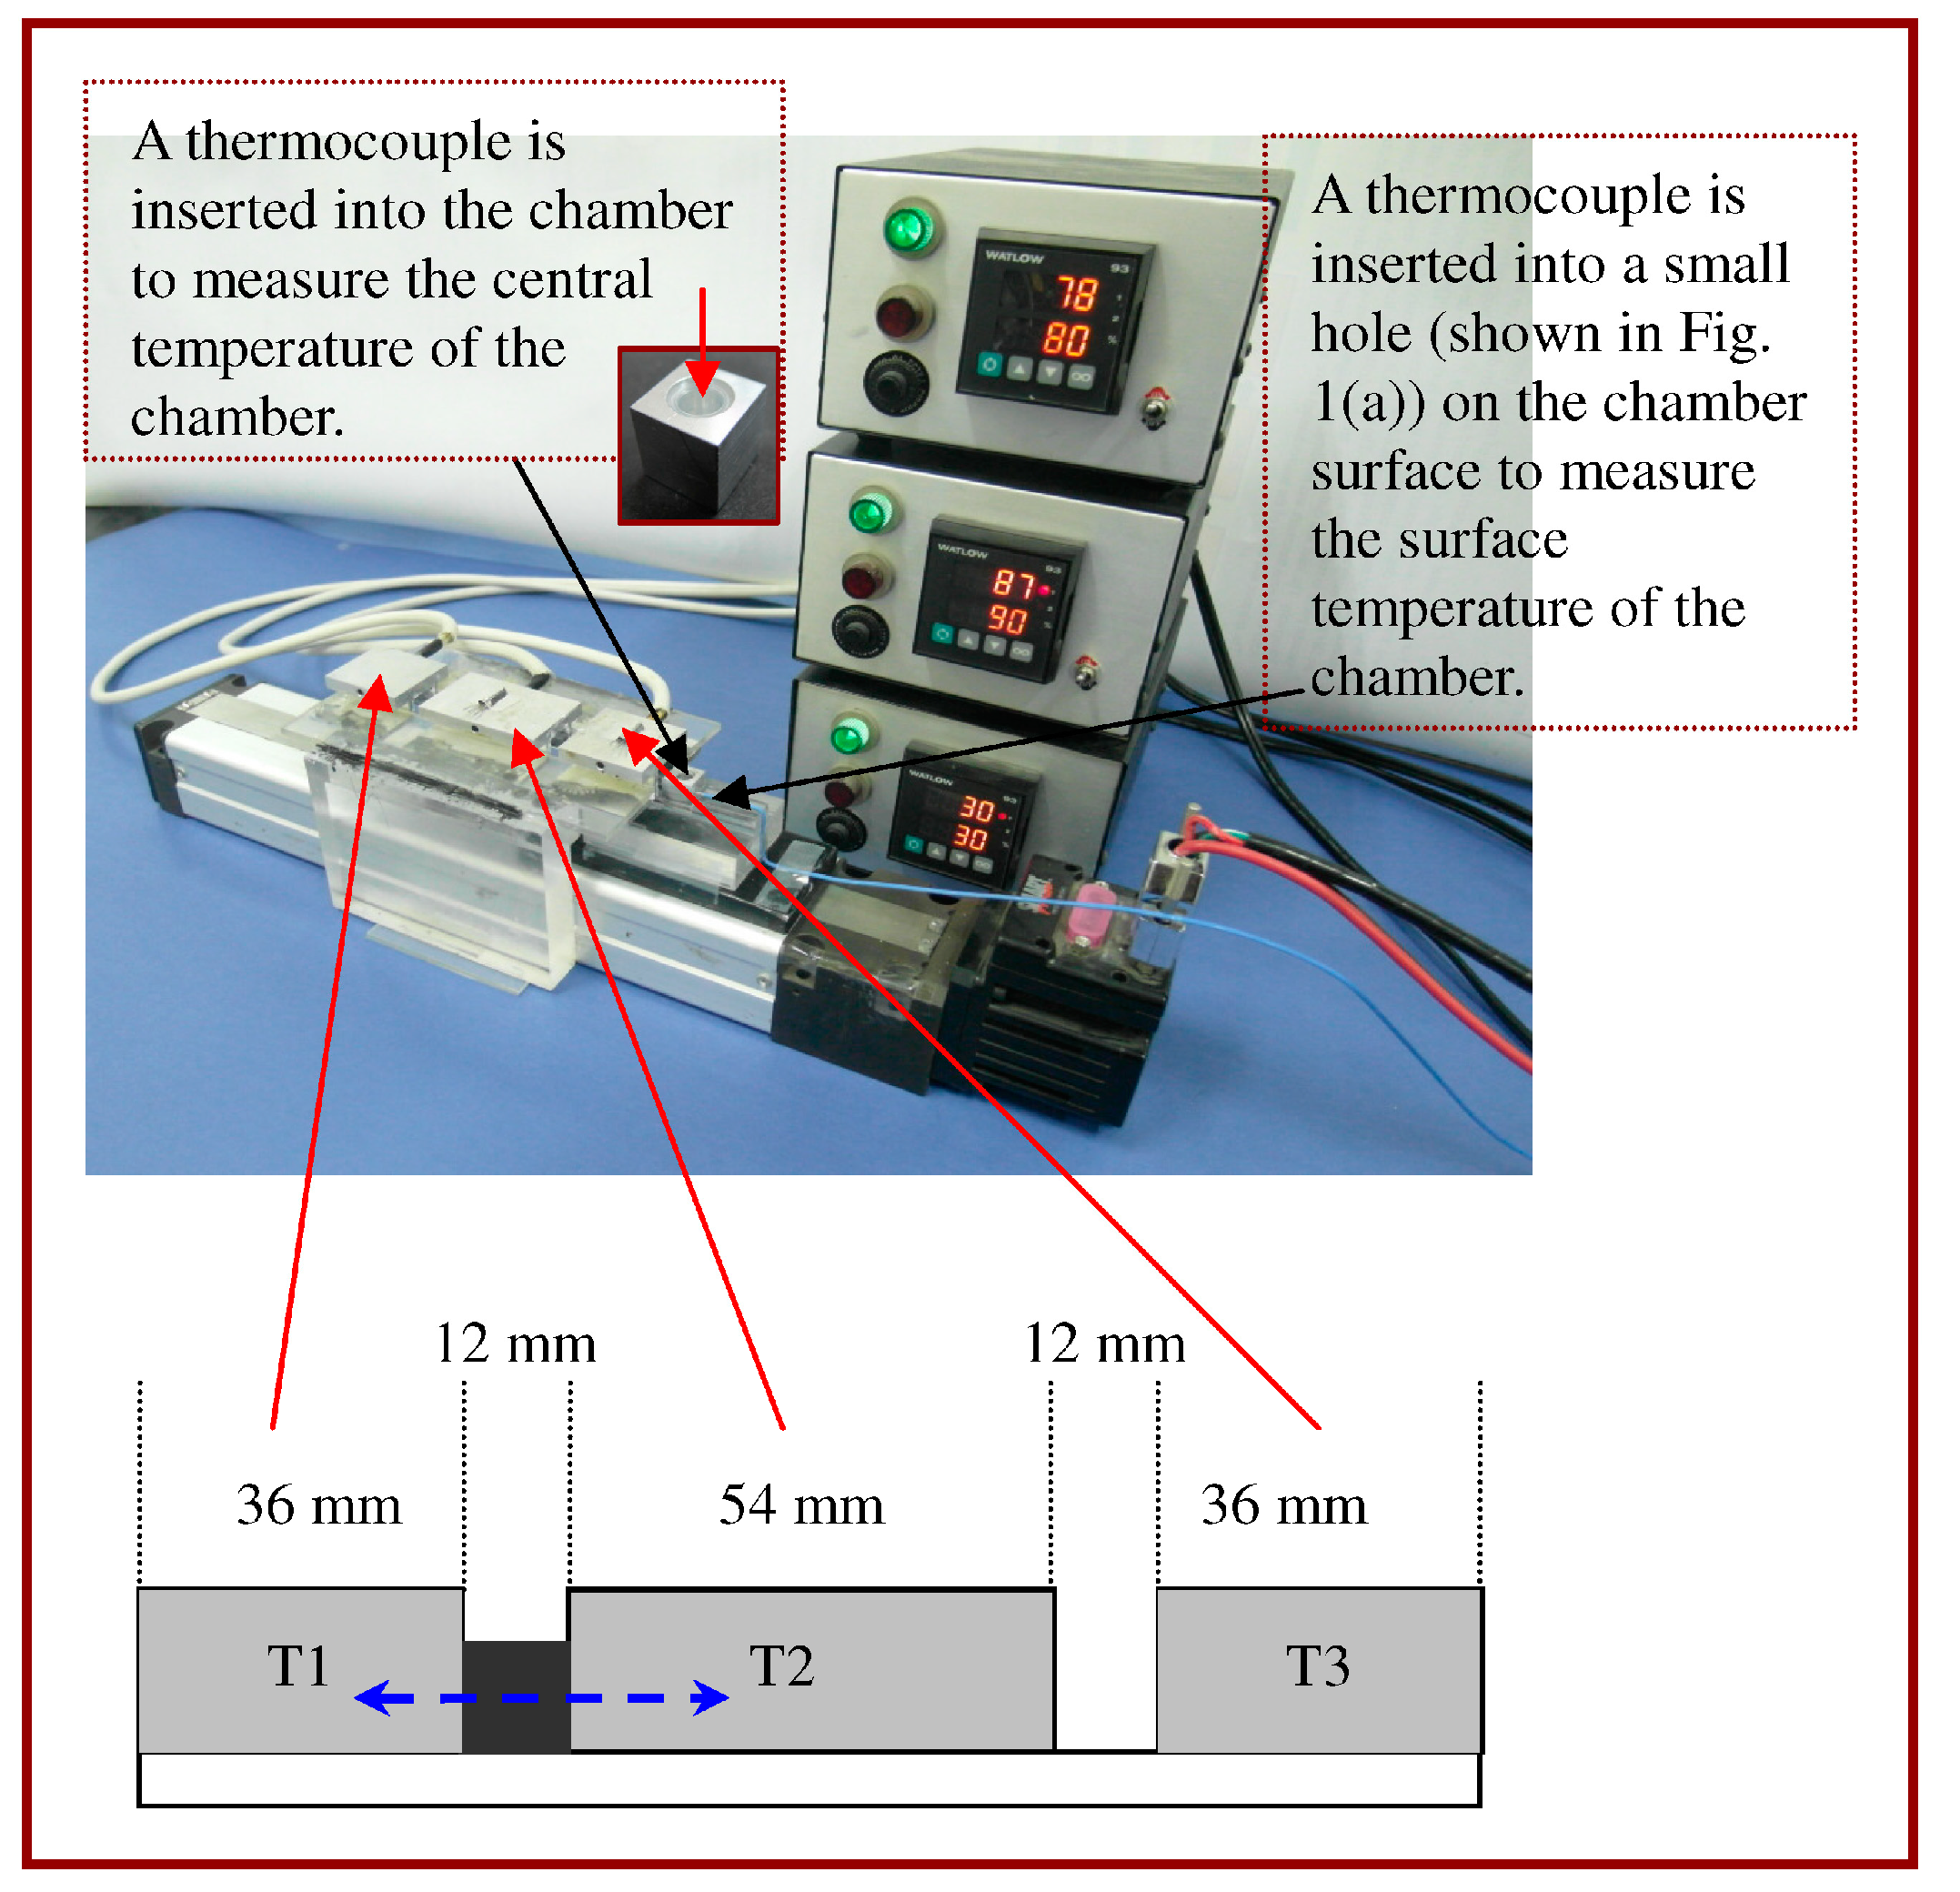
In our simulation, the region T1 is heated to 368 K, the region T2 is maintained at 328 K, and the region T3 is set at 345 K. It is not reasonable to assume that the ambient temperature is equal to 300 K (i.e., the ambient temperature) in the 12 mm gap which is sandwiched between two high temperature regions. The temperatures between two temperature regions at three points are measured. One of them is located at the central location of the cooling region. The distance between two neighboring measured points is 3 mm. Then the gaps between the heating blocks are exposed to the temperatures of 350 K and 335 K which are the average temperatures measured in the air gaps between region T1/region T2 and region T2/region T3, respectively. The temperature between the working regions is affected by the temperatures of the working regions, and the convection effect at the boundary surfaces is dominated by the temperature difference between the chamber temperature and the ambient temperature. To understand the natural convection on the chamber temperature, the effect of various ambient temperatures on the temperature in the reaction chamber is also investigated, but not shown. The ambient temperature can be changed from 300 to 350 K. In the cooling region, the sample temperature dips below the temperature of the working region. Then the temperature starts to rise as the chamber enters another working region. The sample temperature can achieve the reaction temperature during the reaction time for different ambient temperatures. However, the influence of various cooling temperatures on the sample temperature is negligible.
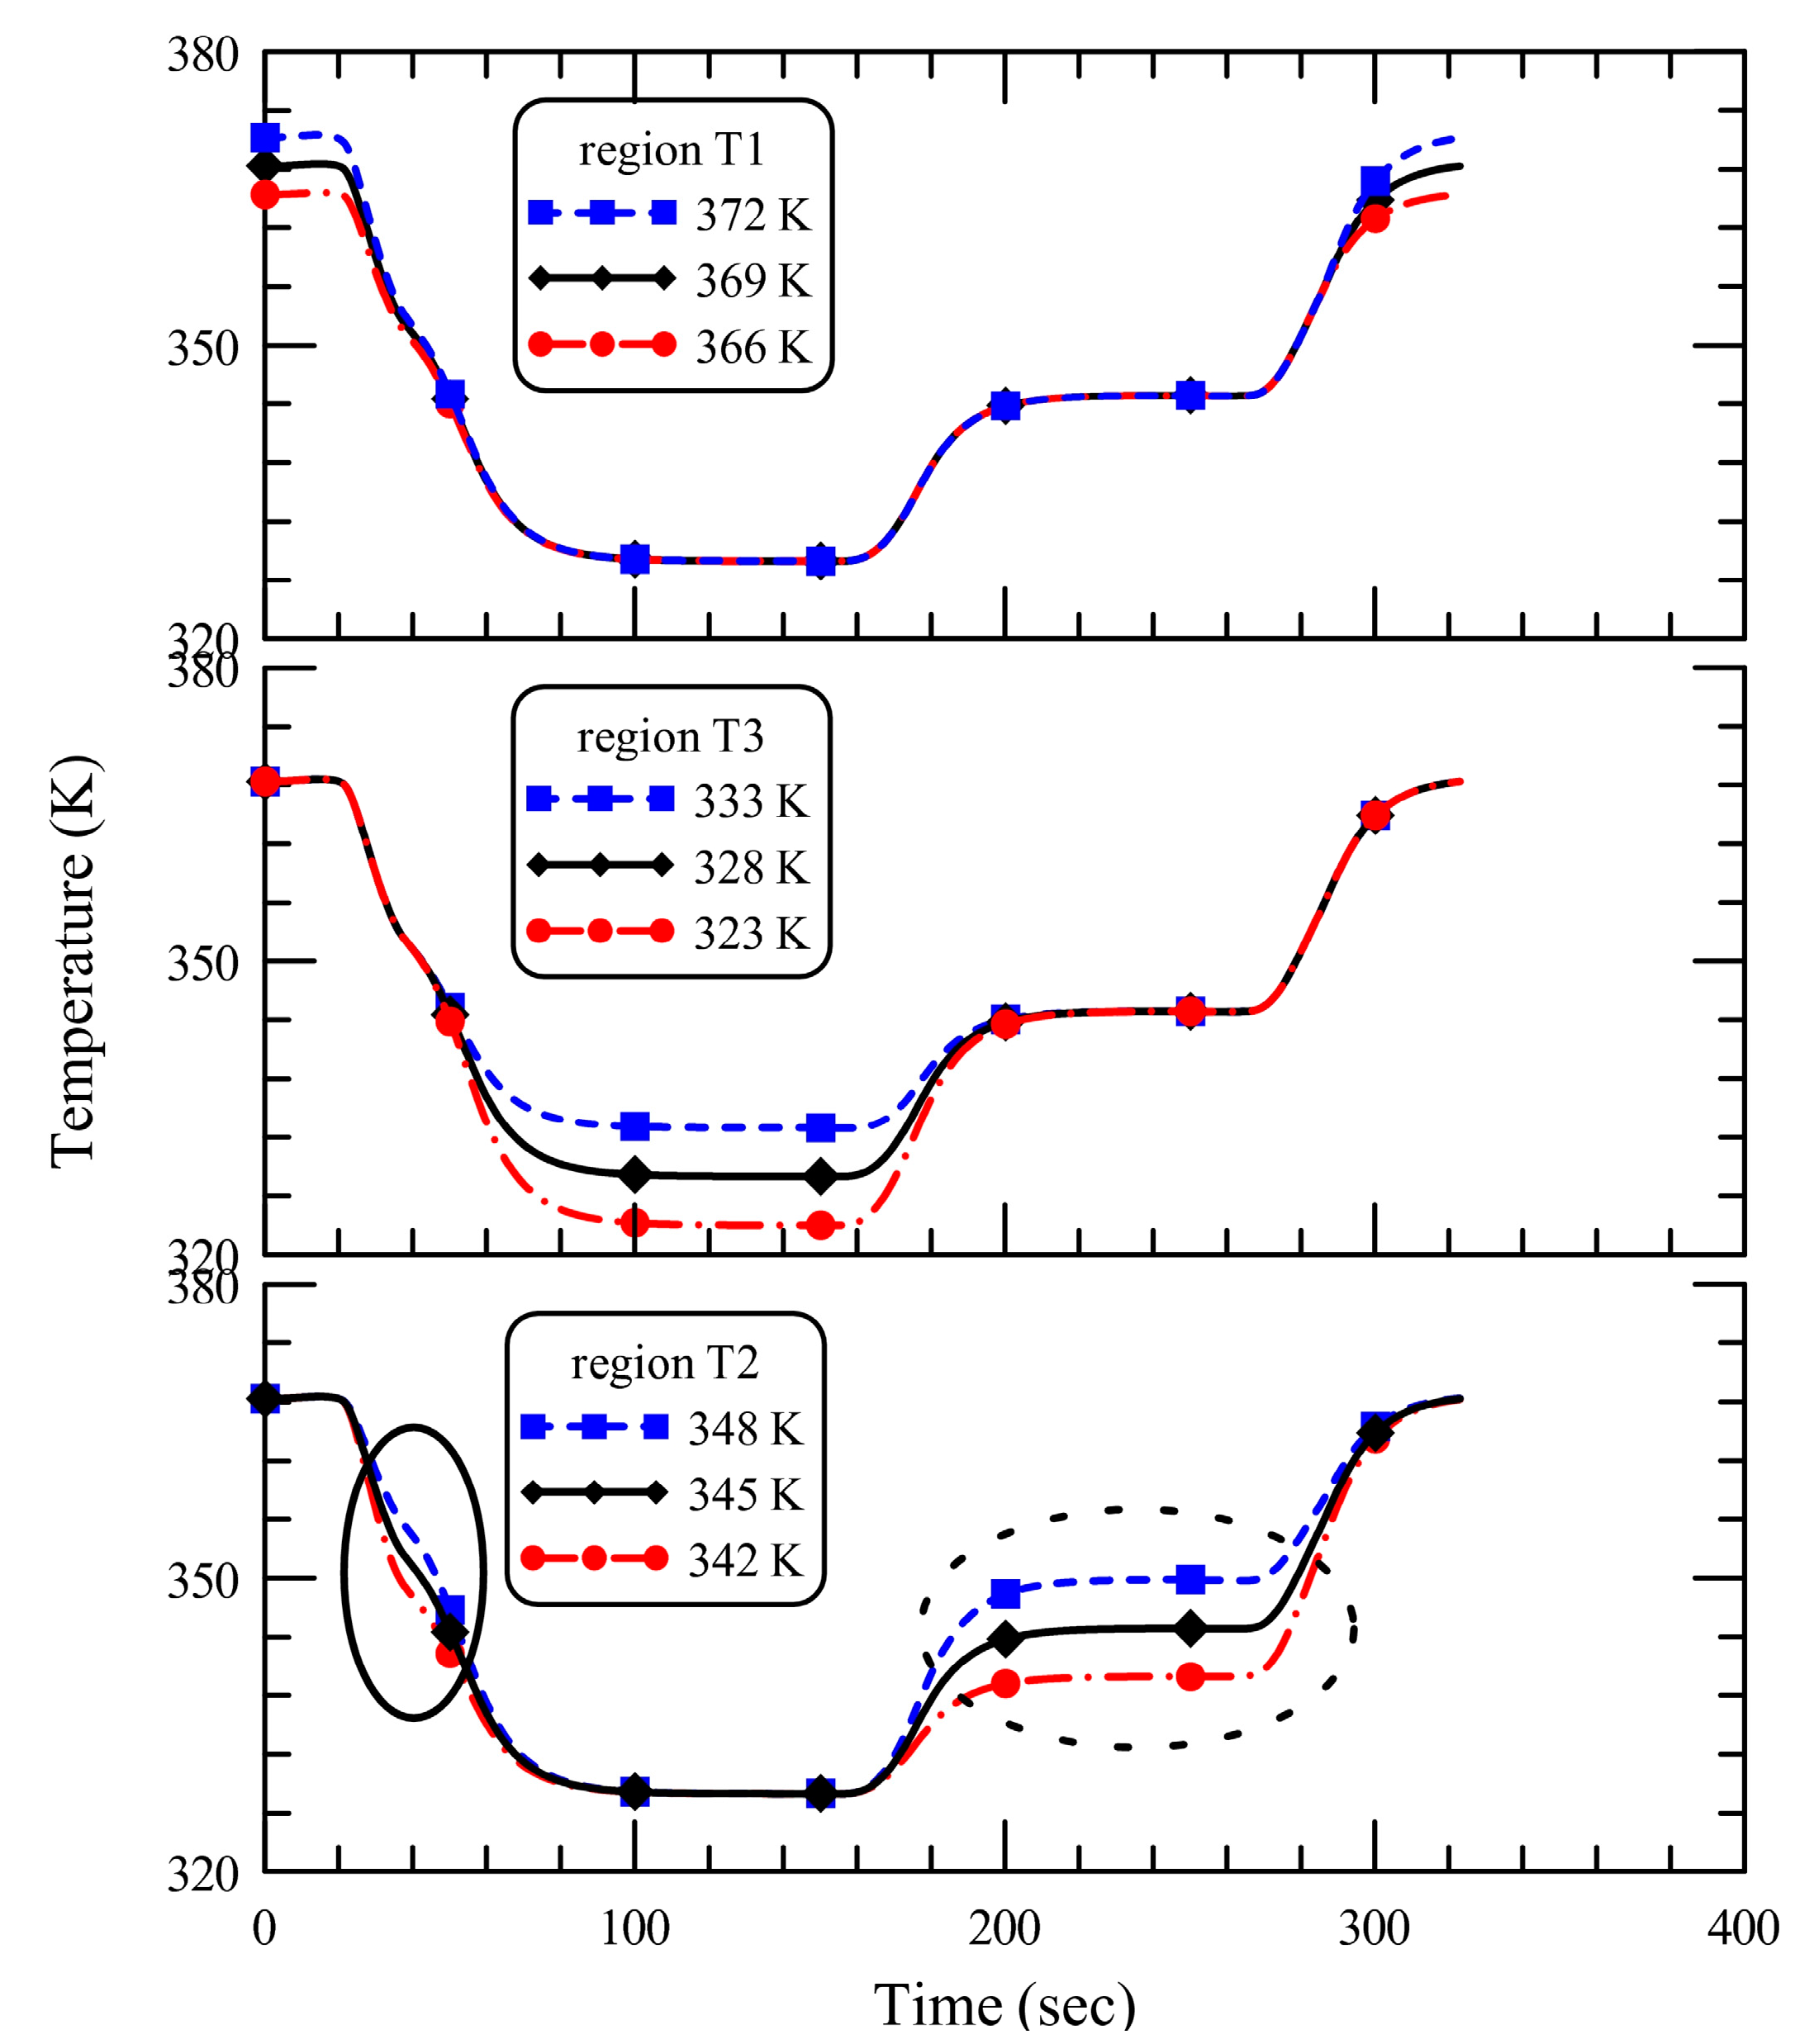
In the design of the CFPCR devices, thermal isolation is essential to realize the programmed heating temperature maintenance and reduce thermal interference between the different temperature heaters. The thermal interference effect means that a temperature change in one section is caused by heat generation in the other. Researchers have shown that insulation features, such as air gaps, are built into the PCR device to minimize heat transfer between heating regions and prevent thermal interference. The chamber temperature is changed as the PCR chamber oscillates along three isothermal regions. The influence of various temperatures of the three heating regions on the central temperature profiles of the sample is illustrated in Figure 9. The three temperature regions are separated from each other by 12 mm air gaps. The sample temperatures during the annealing and the extension zones are almost the same even when the temperatures of region T1 are different (the top part of Figure 9). This could be attributed to the proper thermal isolation between different temperature regions by air gaps. Similar results can be observed for different temperatures of region T3 (at the middle part of Figure 9). It is difficult to tell the difference among the sample temperatures during the denaturation and the extension zones. During the thermal cycle, the chamber moves forward along the path from the beginning of region T1, passes by region T2, reaches the end of region T3, and then turns backward until it finally reaches the original position. We find that the sample temperature is influenced by the temperature of region T2 when the chamber moves back and forth between regions T1 and T3. From the results at the bottom part of Figure 9, it is apparent that the sample temperature is unchanged during the denaturation and the annealing zones, and heavily influenced by the temperature of region T2 (marked by dashed line). Furthermore, the effects of various temperatures of region T2 on the profiles of the sample temperatures is also shown during the period from 20 to 52.86 s (marked by solid line). Since the duration time inside region T2 is short, this effect is insignificant due to the high forward speed of the chamber.
Figure 8. The temperature distributions on the cross section at a depth of 2 mm below the chamber surface at the times of (a) 5, (b) 20, (c) 27, (d) 43, (e) 92, (f) 140, (g) 230, and (h) 280 s, respectively.
Micromachines 05 01445 g008
Figure 9. The center temperature profiles of sample with (a) various temperatures of region T1, (b) various temperatures of region T2, and (c) various temperatures of region T3.
Micromachines 05 01445 g009

4.2. Experimental Study and DNA Amplification

From our previous study regarding the transient temperature profile of the reaction chamber in the bidirectional thermocycler [
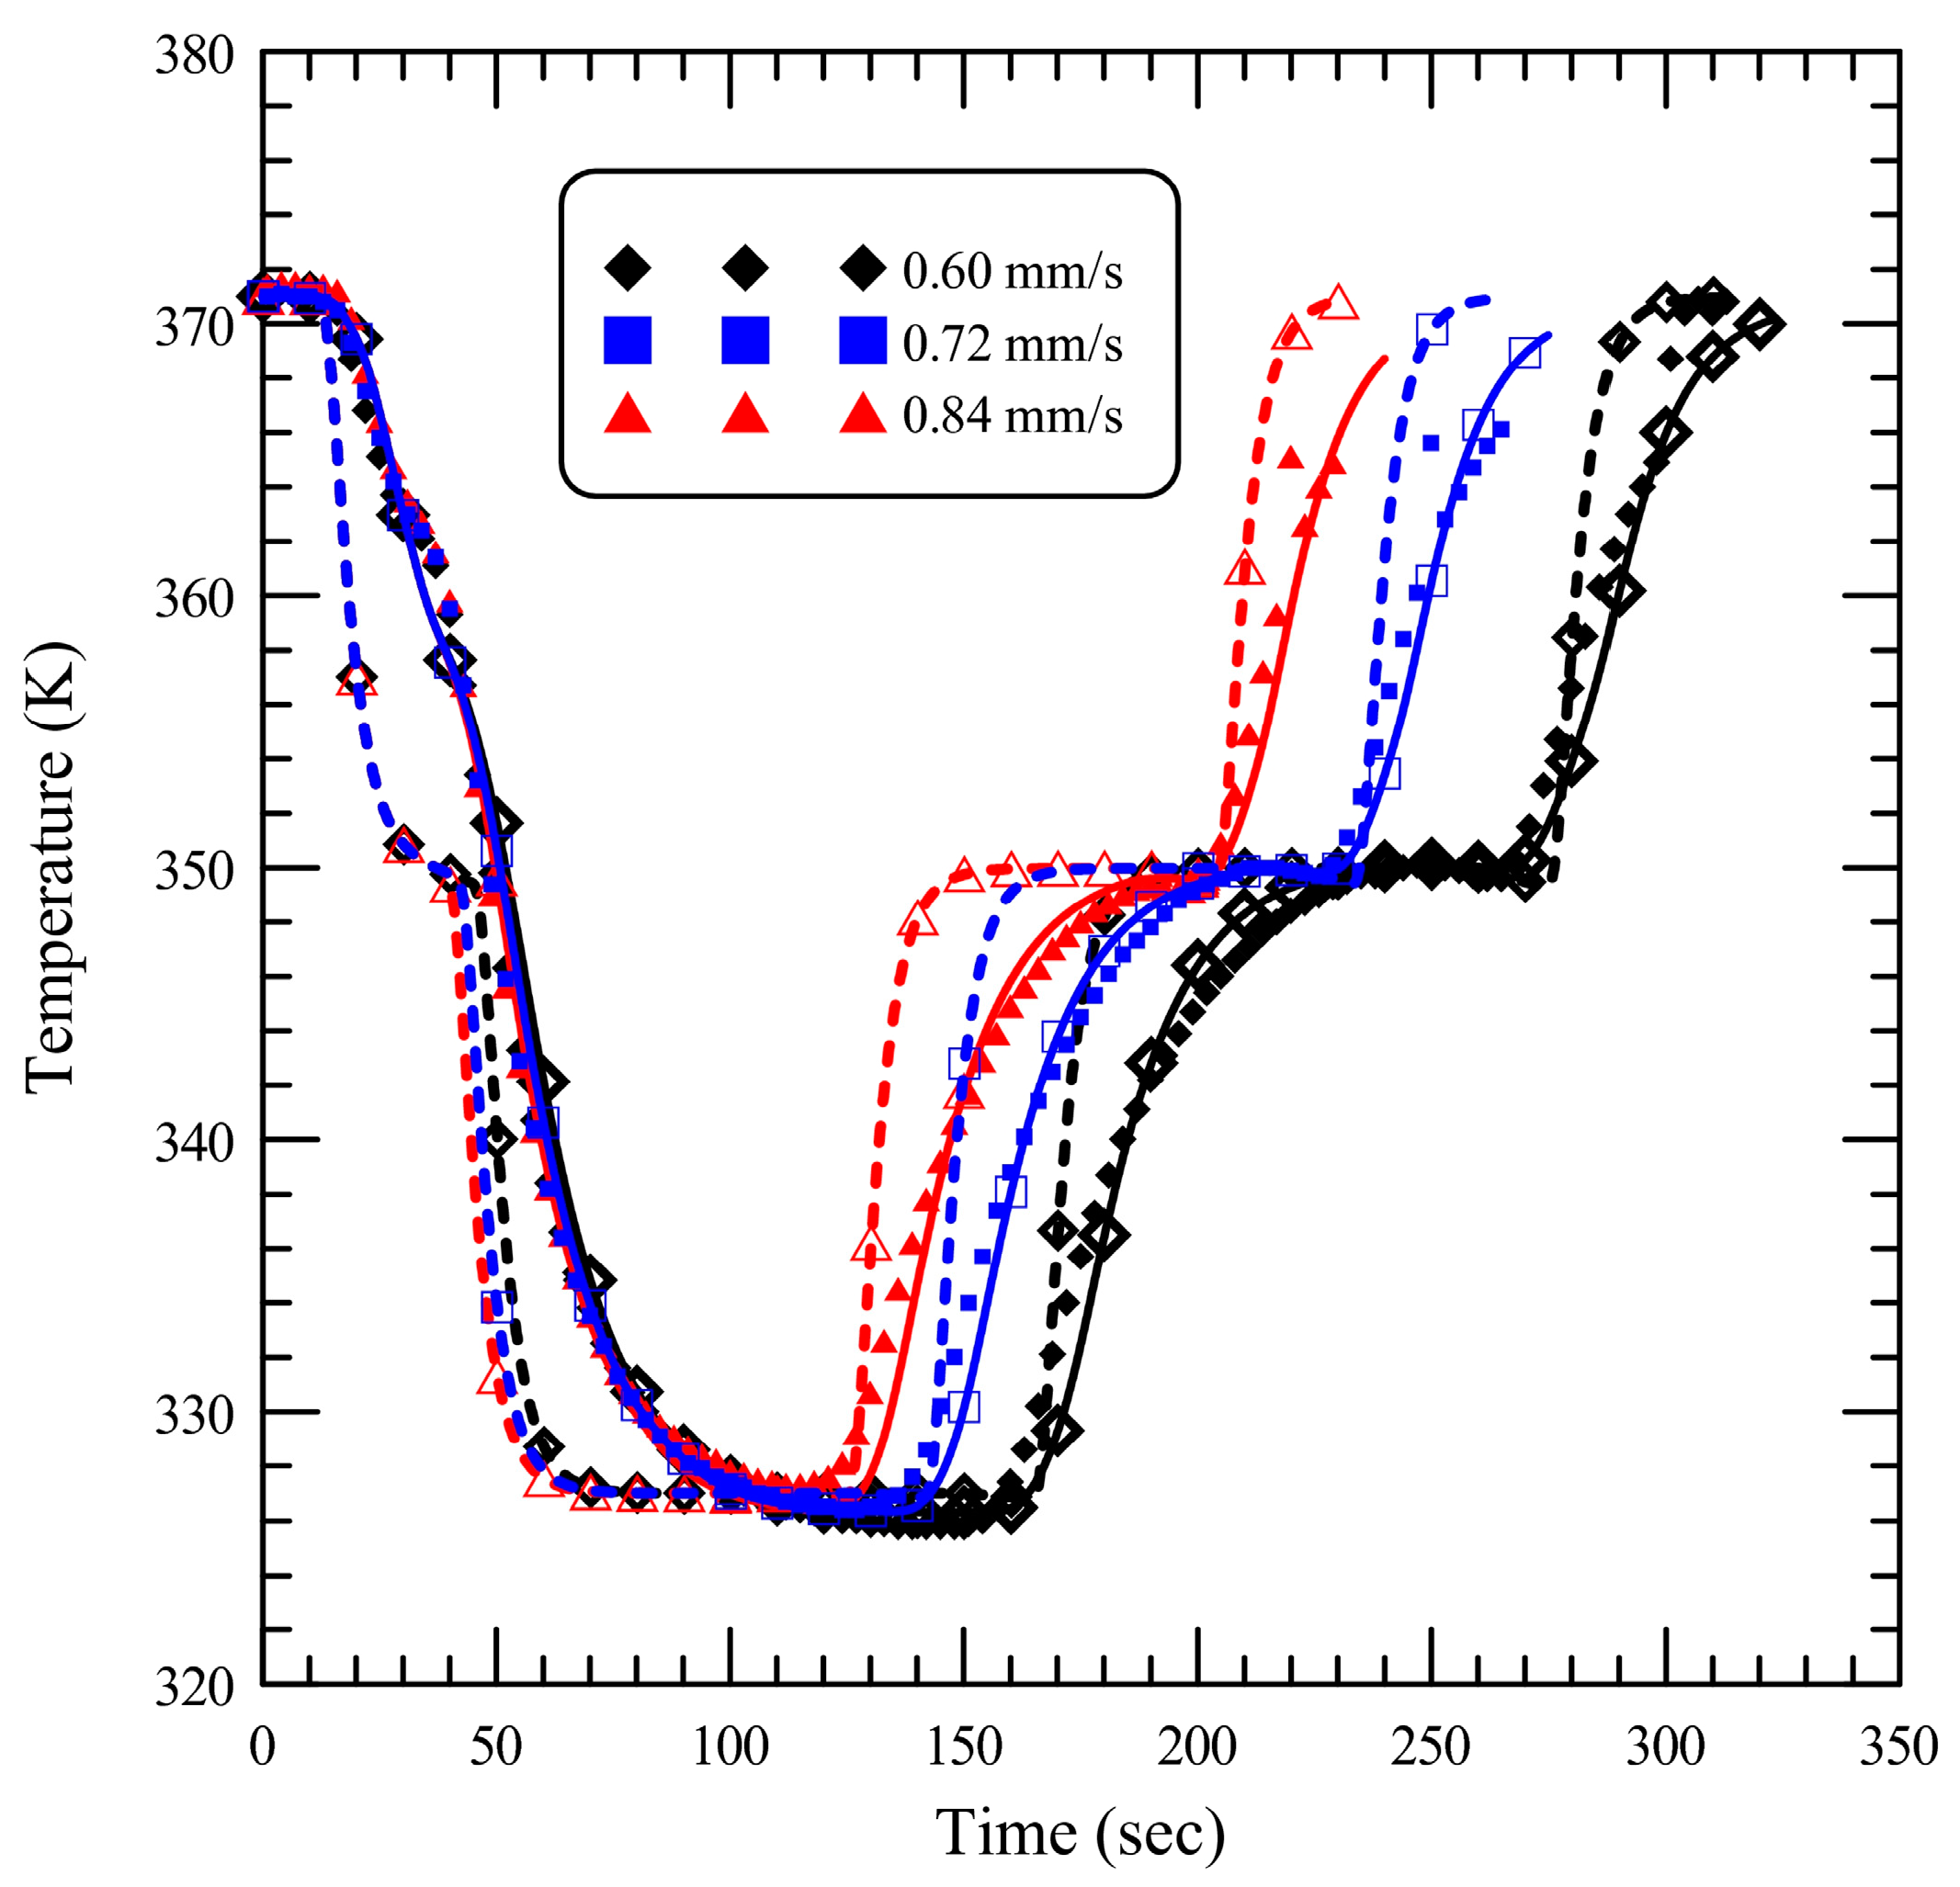
10], the temperature results in the central location of the sample by the numerical simulation and the experimental measurement showed some discrepancies. A temperature drop could be experienced at the interface between the heater surface and the chamber surface that are in contact. With the introduction of the thermal contact conductance coefficient into our theoretical studies, Figure 10 shows simulation results of the cases at a forward speed equal to 4.2 mm/s from the beginning of the first heating region, then changed to 0.6, 0.72, and 0.84 mm/s at the beginning of the second cooling region, and finally a backward speed equal to 0.6, 0.72, and 0.84 mm/s, respectively. The simulation results are compared with experimental results measured at the center of the chamber. The chamber moves through the three working regions at temperatures of 371, 351 and 326 K. The heat transfer coefficient for natural convection, hc, is set to be 6.5 W/m2K, and the thermal contact conductance coefficient for aluminum/aluminum with air, hr, is about 700 W/m2K [23,24]. Furthermore, the temperature profiles of the central solution with the perfect contact between the heater and chamber surfaces are also demonstrated. Although the contact resistance between the chamber and the aluminum block and the convective heat transfer coefficient during the cooling regions are still unpredictable, the temperature by numerical simulation shows a very good similarity to the measured data at three moving speeds. So to take thermal contact resistance into consideration in the thermal simulation of the bidirectional reactor system is recommended to obtain a reasonable temperature profile during the thermal cycling process. By including the thermal contact resistance, which is empirical by the experimental fitting into the numerical analysis, the simulated temperature distributions during thermal cycles can be utilized to predict the thermal performance of the PCR device in reality and, furthermore, provide the suitable operation parameters of the device during PCR qualitatively.
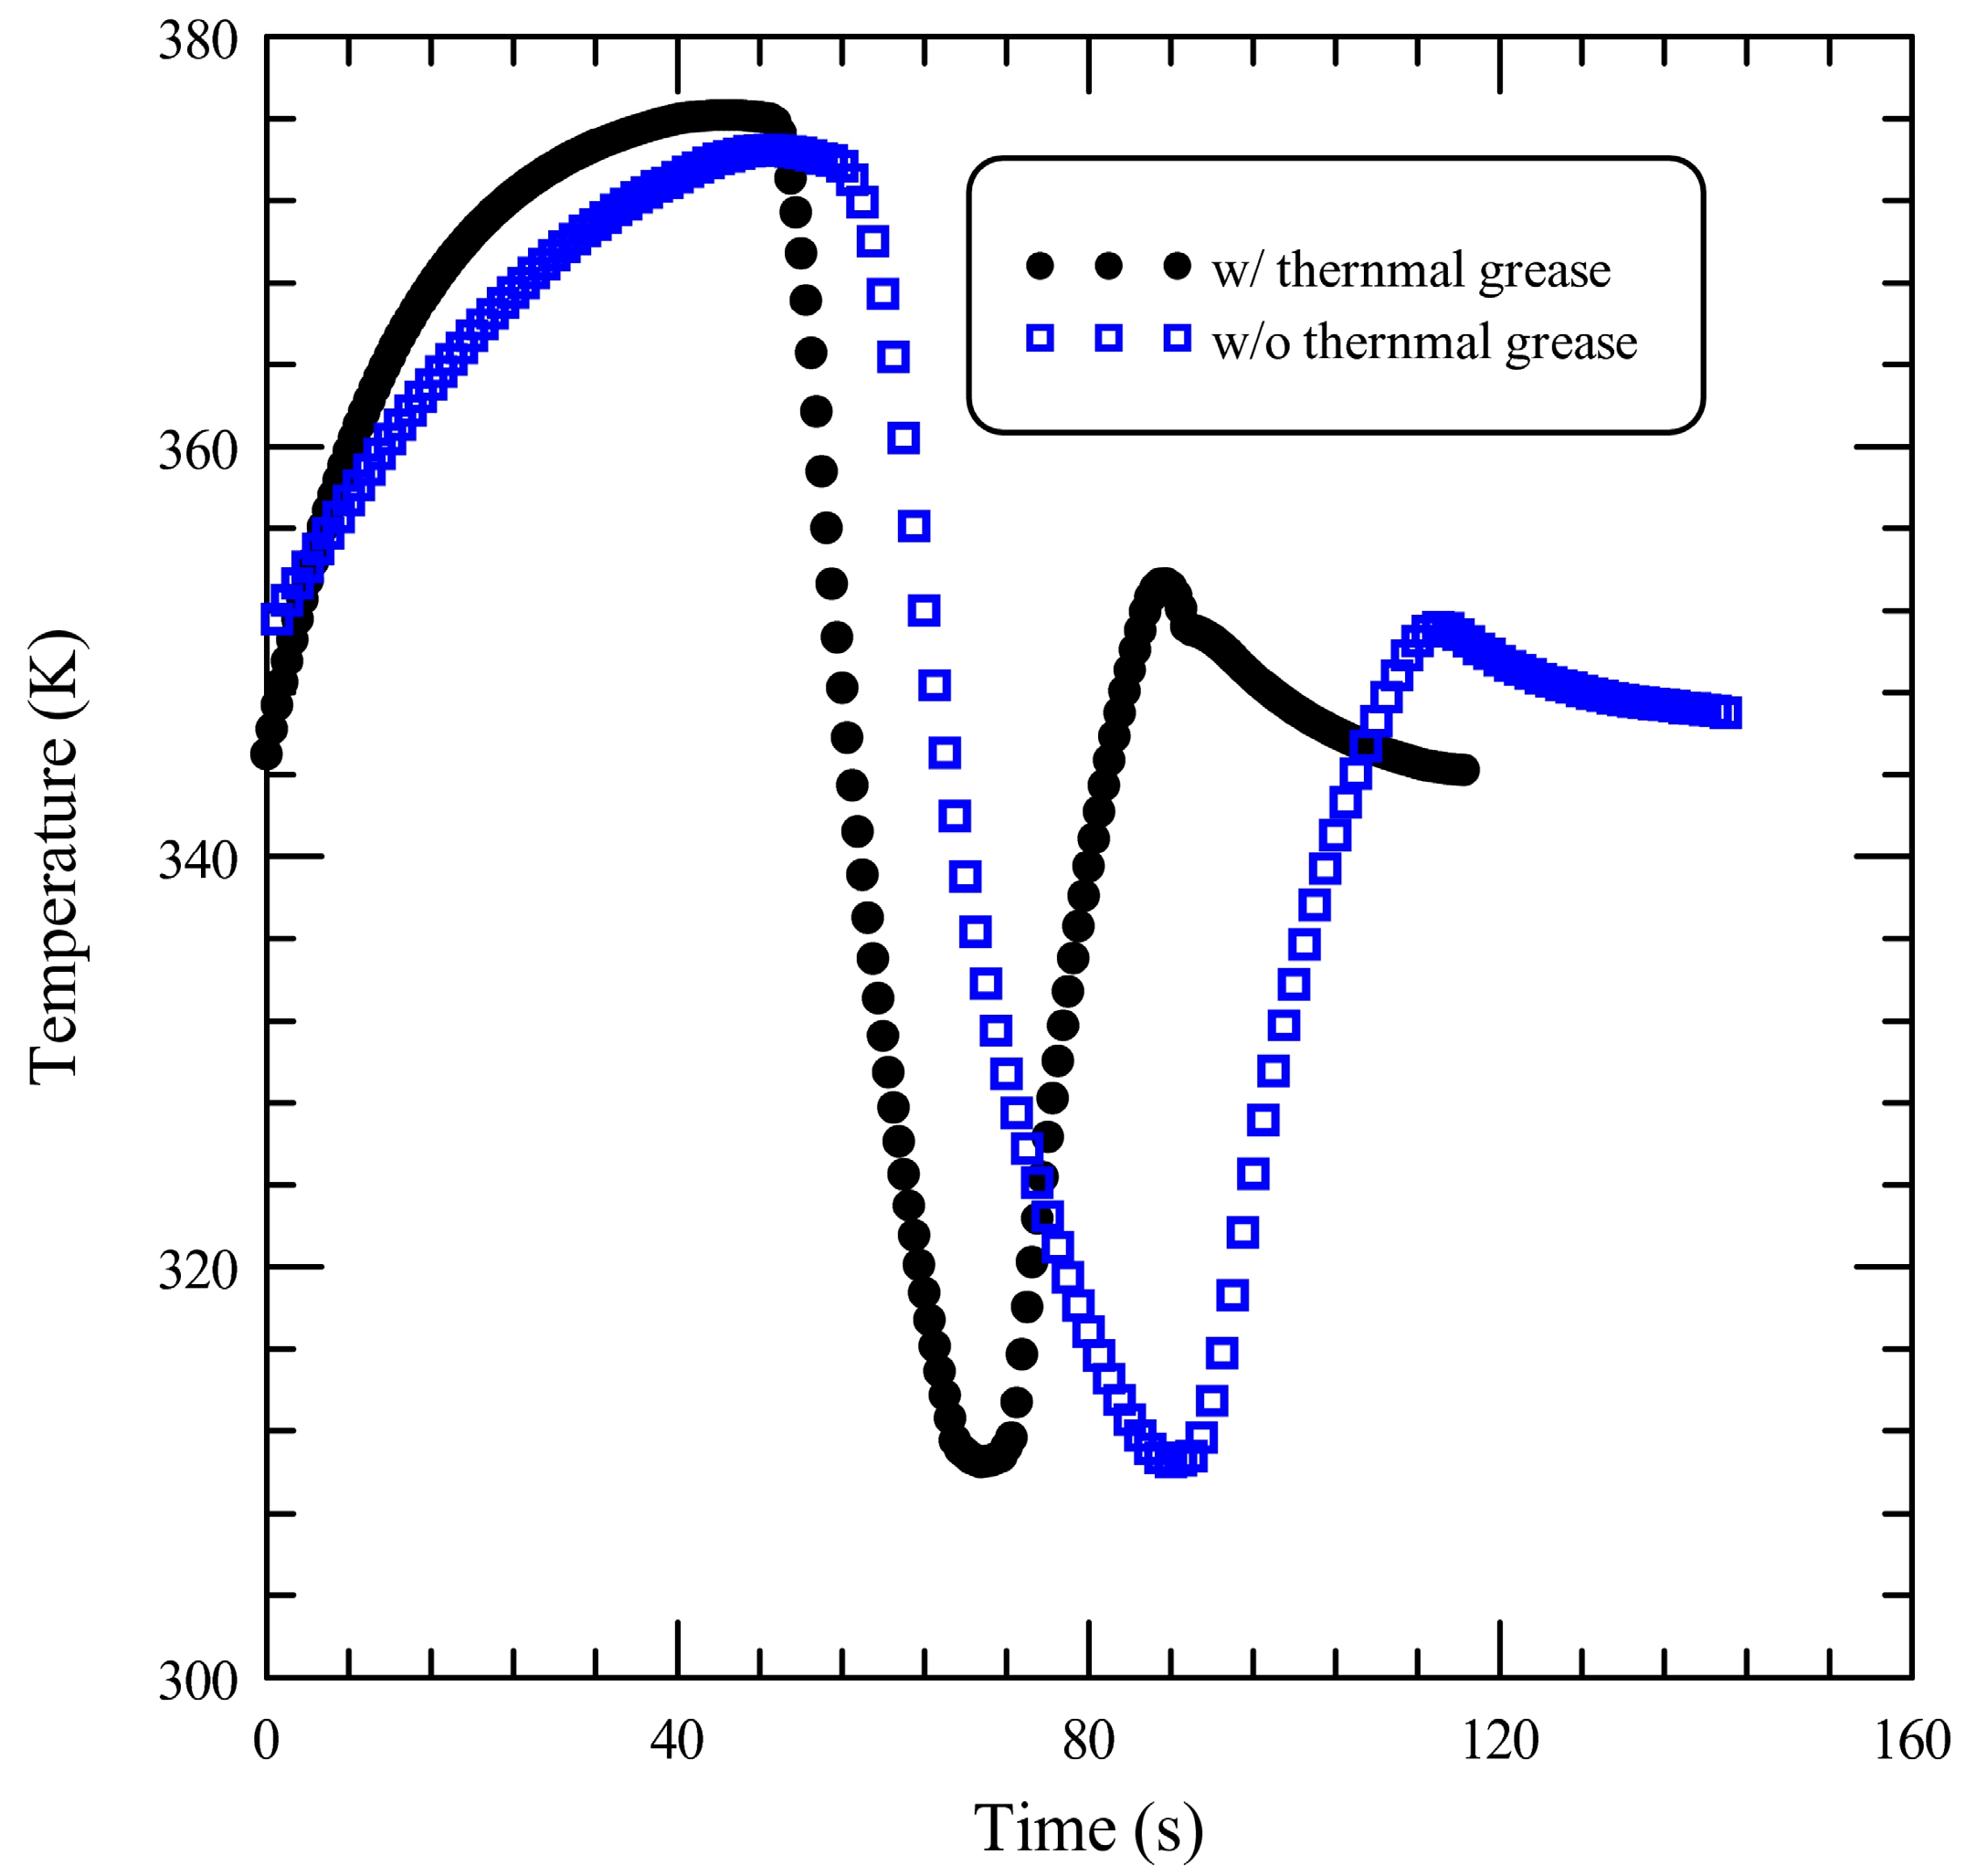
Due to the imperfectly flat surfaces of the chamber and the heater block, some thermal grease is applied between these contacting components to increases heat conduction. The comparison between the central temperatures of the solution with and without thermal grease on the contacting surfaces is depicted in Figure 11. By applying the thermal grease between the contact surfaces, the thermal resistance effect will be reduced. It can be seen that the ramping rate (the slope of the temperature profiles) is larger for the case with thermal grease than that without thermal grease. By keeping the chamber temperature deviated with a variation of less than 2 K and the duration time at each step more than 10 s, the chamber moves along the path at a forward speed equal to 3.3 or 2.8 mm/s from the beginning of the first heating region, then changed to 1.1 or 0.9 mm/s at the beginning of the second cooling region, and finally a backward speed equal to 1.1 or 0.9 mm/s with or without thermal grease on the contacting surfaces, respectively. It is found that the thermal contact effect between the chamber surface and the heater surface is improved, and the required reaction time is dramatically reduced by 20%.
Figure 10. Comparison of experimental results and numerical temperature profile at a forward speed of chamber equal to 4.2 mm/s from the beginning of the first heating region, then changed to 0.6, 0.72, and 0.84 mm/s at the beginning of the second cooling region, and finally a backward speed equal to 0.6, 0.72, and 0.84 mm/s, respectively. Diamond-shaped marks (◊), square-shaped marks (□), triangular marks (Δ) denote the results at the speed of 0.6, 0.72 and 0.84 mm/s, respectively. The marks filled with color are the experimental results. The marks without background color are the numerical results. Solid lines represent the results with hr of 700 W/m2K. Dashed lines represent the results with perfect contact between two surfaces.
Micromachines 05 01445 g010
Figure 11. Comparison of the center temperature profiles of sample with and without thermal grease on the contacting surfaces.
Micromachines 05 01445 g011
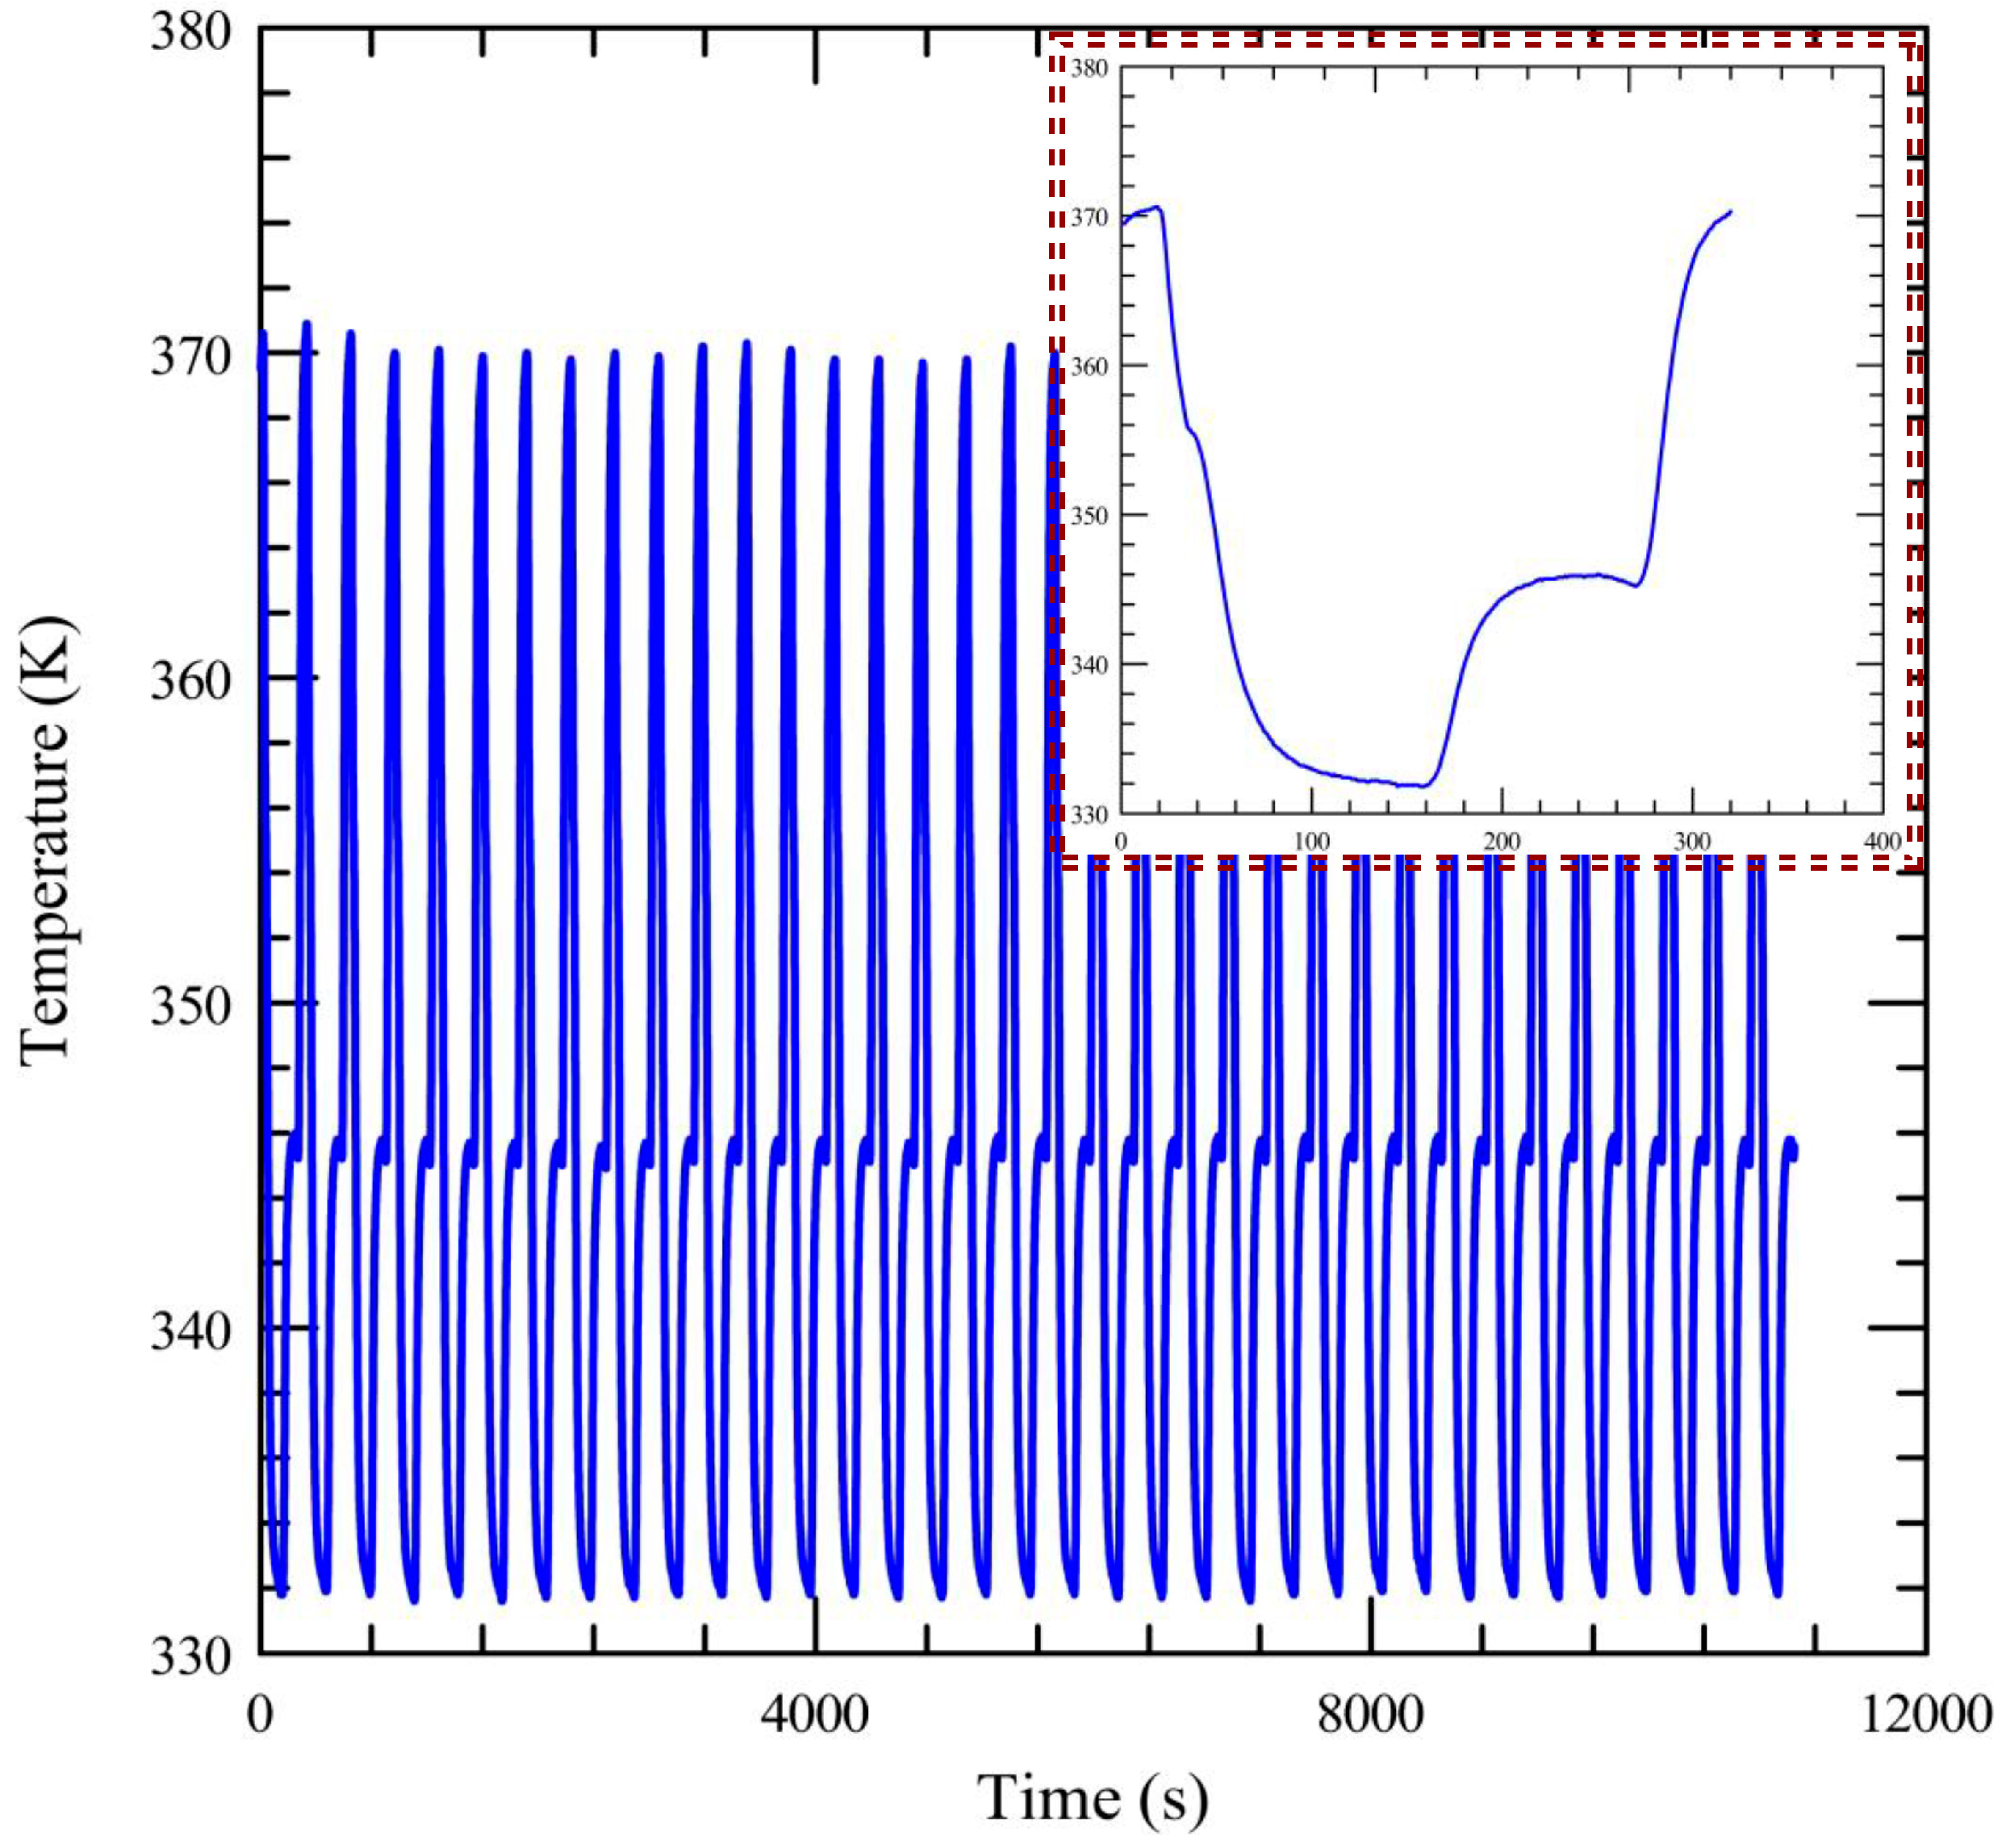
The stability of the bidirectional thermocycler is examined and demonstrated in Figure 12. The small picture illustrated at the top right side of Figure 12 is the temperature profile of the fifth cycle at the center of the sample during the whole thermal cycling process. The chamber moves through three sequential isothermal (371, 351 and 326 K) zones. The chamber is loaded with water covered by some mineral oil. The thermal cycling profile of the central location of the sample is monitored by the thermocouple inserted into the chamber near the center of the sample. The maximum heating and cooling rates during this thermal cycle are 0.878 and 1.037 K/s, respectively. The standard deviations of the temperatures at 34 cycles of measurements are within 0.4 K, and the temperature deviation in the sample during the three working regions is measured to be less than 2 K. It demonstrates that the temperature curve of the sample at the first cycle is similar to that at the last cycle, and the stability of this bidirectional thermal cycler chamber is then confirmed. The surface temperature of the chamber is also measured on the surface of the chamber in the z-direction, and compared with the center temperature of the chamber. When the PCR is proceeding, it is not recommended to insert the thermocouple into the chamber and thus the measurement of the surface temperature can be used to be the reference information.
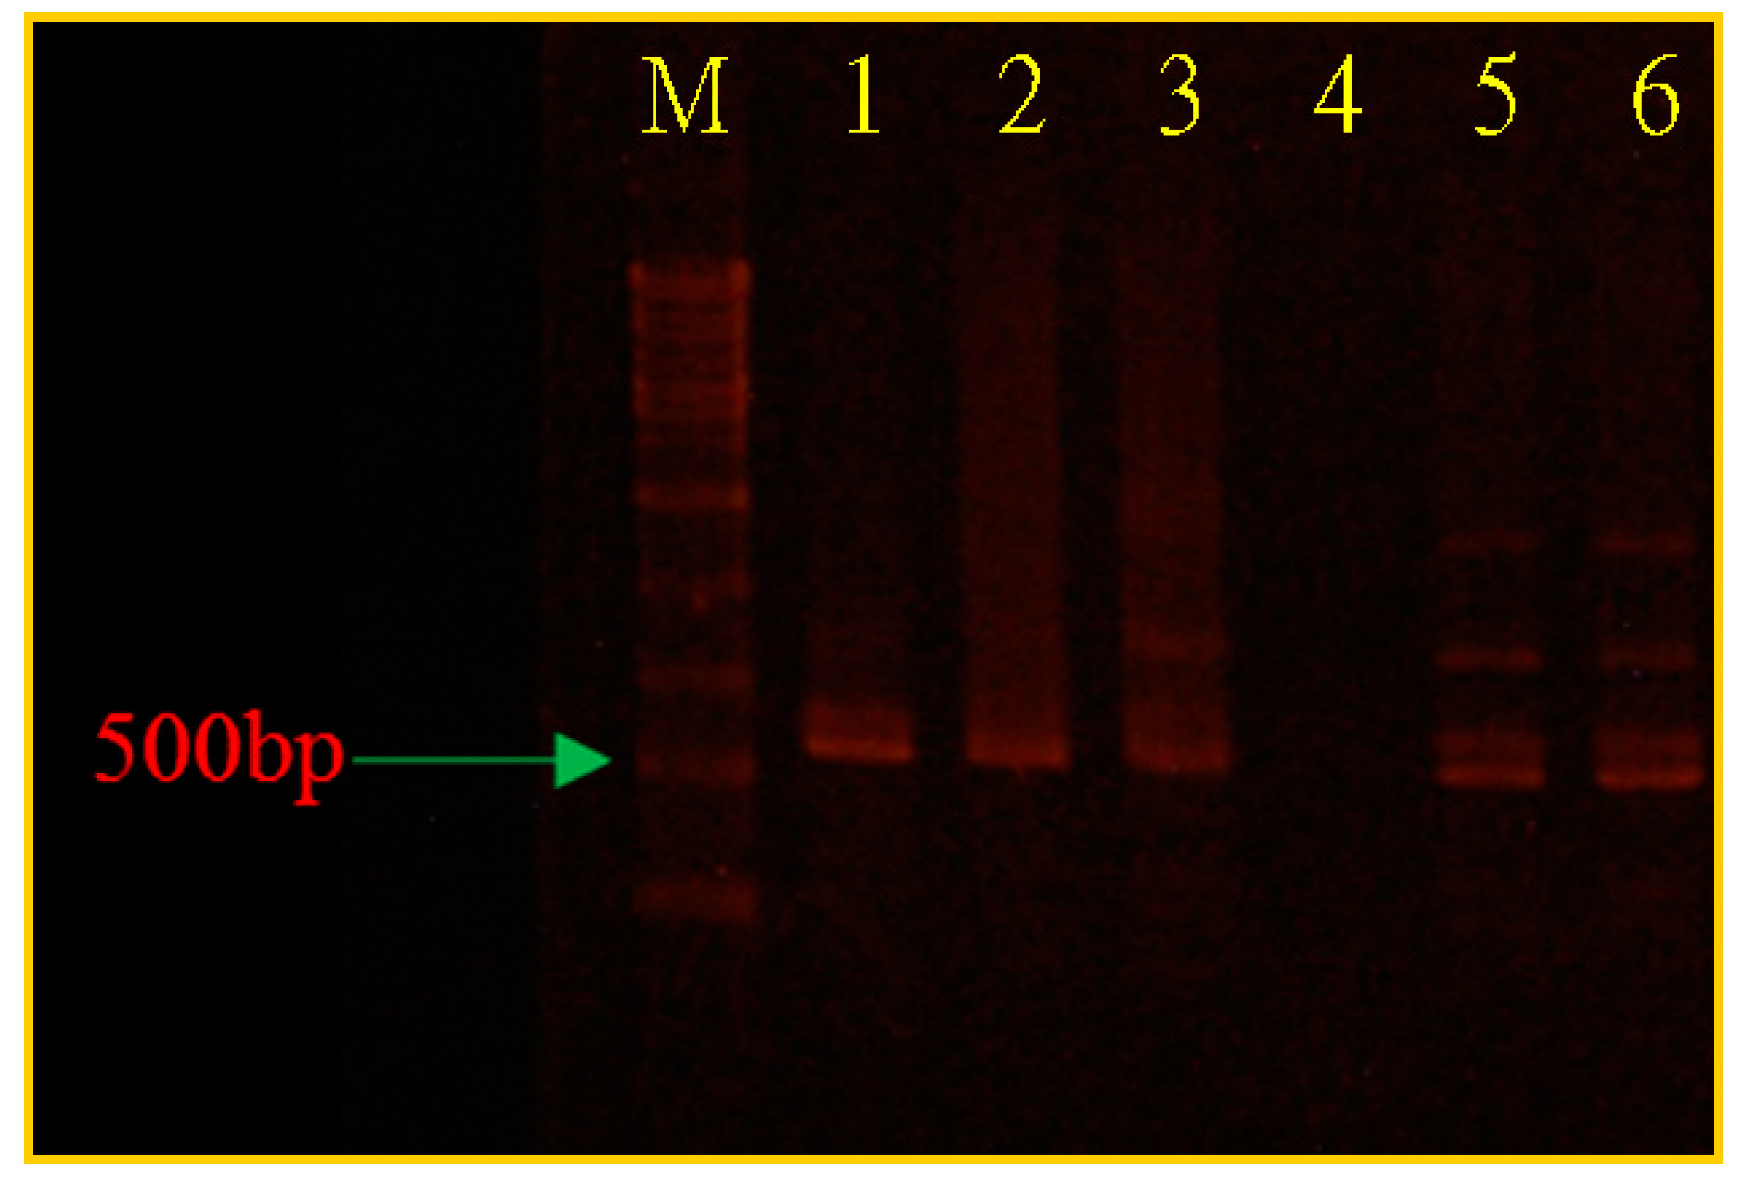
During the thermal cycling process, the chamber moves along the path at a forward speed equal to 4.2 mm/s from the beginning of the first heating region, then the speed is changed to 0.6 mm/s at the beginning of the second cooling region. Finally, the backward speed is equal to 0.6 mm/s. The performance of PCR amplification and the results of electrophoresis of PCR products are shown in Figure 13. PCR for a positive control is performed in a commercial machine using the same PCR mixture (lane 1 in Figure 13). A mixture containing all the reagents in the PCR mixture but the DNA template for a negative control is injected into the chamber and collected after the total thermal cycles for analysis (lane 4 in Figure 13). From this gel electrophoresis analysis, the amplification products are successfully amplified in our device (lanes 2, 3, 5 and 6 in Figure 13) and the conventional thermal cycler. The 591-bp, PCR product is observed. Thus, the bidirectional thermocycler performs the PCR amplification successfully. The amounts of amplification products of three different input Taq polymerases (0.1 μL and 0.5 μL) are studied and presented in Figure 13 (lanes 1 and 2, respectively). The concentration of the PCR product is enhanced as the amount of the input Taq polymerase is increased. Figure 13 also shows the results from gel electrophoresis of PCR products obtained at the input Taq polymerase of 2.5 μL and the moving speed of 0.6 mm/s and 0.72 mm/s (lanes 5 and 6) by keeping the forward speed at a value of 4.2 mm/s, respectively. The results clearly show that the amounts of the PCR product are almost the same even as the moving speed increases. Despite the increase in moving speed and the reduction in residence time for the PCR process, the fluorescence intensities are not decreased. It represents the fast thermal cycling ability of our bidirectional thermocycler. However, there exist some non specific bands in Figure 13 (e.g., lanes 5 and 6). The reason for non-specific bands in our PCR results may be from a possible contamination. In the bidirectional thermocycler the PCR chamber is made of aluminum. The PCR tube without a cone is inserted into the chamber and contacted with the chamber tightly. The bottom of the reaction chamber is covered with a small volume of mineral oil. Then the PCR solution can be isolated from the wall of the reaction chamber. Because the metal materials might poison the Taq polymerase, the contamination might be occurred if the bottom of the reaction chamber is not totally covered with the mineral oil.
Figure 12. The repeatability and the stability performances of the bidorectional thermocycler.
Micromachines 05 01445 g012
Figure 13. Agarose gel electrophoresis of the polymerase chain reaction (PCR) yield. Lane M: size marker; lane 1: positive control; lane 2: 0.1 μL of input Taq polymerase, 0.6 mm/s of moving speed; lane 3: 0.5 μL of input Taq polymerase, 0.6 mm/s of moving speed; lane 4: negative control; lane 5: 2.5 μL of input Taq polymerase, 0.6 mm/s of moving speed; lane 6: 2.5 μL of input Taq polymerase, 0.72 mm/s of moving speed.
Micromachines 05 01445 g013

5. Conclusions

A novel bidirectional thermocycler is built for DNA amplification in this study. The sample is placed in a fixed chamber, and three constant isothermal zones are established and lined up in the system. The chamber is oscillated and comes into contact with three different isothermal zones to complete thermal cycles. In order to predict the accurate thermal characteristics of a bidirectional thermocycling device, the thermal contact effect between the heating blocks and the reaction chamber is introduced into the theoretical study. Because the thicknesses of the mineral oil, the PDMS film, and the PCR tube in our device is small, the thermal resistance in our simulated domain for the DNA solution is several hundred times more than that for the mineral oil, the PDMS film, or the PCR tube. So the volumes of the PCR tube, the PDMS film, and the mineral oil are excluded in the simulation. The thermal contact conductance coefficients between the heating blocks and the reaction chamber dominate the temperature distributions and ramping rates inside the PCR chamber. Results also show that the effects of various ambient parameters between two working regions on the temperature profiles can be neglected. It means that the PCR process in the thermocycler can perform successfully with the variation of the ambient conditions. Moreover, the effects of various temperatures of each heating region on the thermal performance of the other heating regions are also negligible. The thermal interference effects are not in need of considering in our device. When the thermal contact conductance coefficient, hr, of 700 W/m2K is empirically obtained and set between the heating blocks and the reaction chamber, the comparison between the experimental data and numerical temperature profile shows a very good agreement. So to take thermal contact resistance into consideration in the thermal simulation of the bidirectional reactor system is recommended to predict a reasonable temperature profile during the thermal cycling process in reality. In our device, it is found that the thermal contact effect between the chamber surface and the heater surface is improved by applying some thermal grease on the contacting surfaces. The required reaction time is dramatically reduced by 20%. Furthermore, the temperature deviation in the chamber during the three working regions is measured to be less than 2 K. The temperature curve of the chamber at the first cycle is similar to that at the last cycle, thus confirming the stability of this bidirectional thermal cycler chamber. Finally, we utilized this bidirectional PCR system to perform the PCR experiment with results showing that DNA templates were amplified in our reactor successfully.

Acknowledgments

The authors would like to thank the National Science Council of the Republic of China for financially supporting this research under Contract No. MOST 103-2313-B-020-006-. Daryl Switak is appreciated for his editorial assistance.

Author Contributions

Jyh Jian Chen is a person who makes substantial contributions to conception and design, and acquisition of data, participates in drafting the article, and gives final approval of the version to be submitted; Kun Tze Li is a person who provides numerical simulation, and makes analysis and interpretation of data; Wei Hua Chen is a person who provides experimental measurement, and makes analysis and interpretation of data; Yao Tsung Yang is a person who performs the experiments.

Conflicts of Interest

The authors declare no conflict of interest.

References

  1. Saiki, R.K.; Scharf, S.; Faloona, F.; Mullis, K.B.; Horn, G.T.; Erlich, H.A.; Arnheim, N. Enzymatic amplification of beta-globin genomic sequences and restriction site analysis for diagnosis of sickle cell anemia. Science 1985, 230, 1950–1954. [Google Scholar] [CrossRef]
  2. Pak, N.; Saunders, D.C.; Phaneuf, C.R.; Forest, C.R. Plug-and-play, infrared, laser-mediated PCR in a microfluidic chip. Biomed. Microdevices 2012, 14, 427–433. [Google Scholar] [CrossRef] [PubMed]
  3. Hartung, R.; Brösing, A.; Sczcepankiewicz, G.; Liebert, U.; Häfner, N.; Dürst, M.; Felbel, J.; Lassner, D.; Köhler, J.M. Application of an asymmetric helical tube reactor for fast identification of gene transcripts of pathogenic viruses by micro flow-through PCR. Biomed. Microdevices 2009, 11, 685–692. [Google Scholar] [CrossRef] [PubMed]
  4. Frey, O.; Bonneick, S.; Hierlemann, A.; Lichtenberg, J. Autonomous microfluidic multi-channel chip for real-time PCR with integrated liquid handling. Biomed. Microdevices 2007, 9, 711–718. [Google Scholar] [CrossRef] [PubMed]
  5. Chiou, J.; Matsudaira, P.; Sonin, A.; Ehrlich, D. A closed-cycle capillary polymerase chain reaction machine. Anal. Chem. 2001, 73, 2018–2021. [Google Scholar] [CrossRef] [PubMed]
  6. Cheng, J.Y.; Hsieh, C.J.; Chuang, Y.C.; Hsieh, J.R. Performing microchannel temperature cycling reactions using reciprocating reagent shuttling along a radial temperature gradient. Analyst 2005, 130, 931–940. [Google Scholar] [CrossRef] [PubMed]
  7. Wang, W.; Li, Z.X.; Luo, R.; Lü, S.H.; Xu, A.D.; Yang, Y.J. Droplet-based micro oscillating-flow PCR chip. J. Micromech. Microeng. 2005, 15, 1369–1377. [Google Scholar] [CrossRef]
  8. Ohashi, T.; Kuyama, H.; Hanafusa, N.; Togawa, Y. A simple device using magnetic transportation for droplet-based PCR. Biomed. Microdevices 2007, 9, 695–702. [Google Scholar] [CrossRef] [PubMed]
  9. Chen, L.; West, J.; Auroux, P.A.; Manz, A.; Day, P.J.R. Ultrasensitive PCR and real-time detection from human genomic samples using a bidirectional flow microreactor. Anal. Chem. 2007, 79, 9185–9190. [Google Scholar] [CrossRef] [PubMed]
  10. Chen, J.J.; Yang, Y.T. Modeling and experiment of shuttling speed effects on the OSTRYCH. Appl. Therm. Eng. 2011, 31, 2797–2807. [Google Scholar] [CrossRef]
  11. Zhang, Q.; Wang, W.; Zhang, H.; Wang, Y. Temperature analysis of continuous-flow micro-PCR based on FEA. Sens. Actuators B Chem. 2002, 82, 75–81. [Google Scholar] [CrossRef]
  12. Bu, M.; Melvin, T.; Ensell, G.; Wilkinson, J.S.; Evans, A.G.R. Design and theoretical evaluation of a novel microfluidic device to be used for PCR. J. Micromech. Microeng. 2003, 13, S125–S130. [Google Scholar] [CrossRef]
  13. Li, S.; Fozdar, D.Y.; Ali, M.F.; Li, H.; Shao, D.; Vykoukal, D.M.; Vykoukal, J.; Floriano, P.N.; Olsen, M.; McDevitt, J.T.; Gascoyne, P.R.C.; Chen, S. A continuous-flow polymerase chain reaction microchip with regional velocity control. J. Microelectromech. Syst. 2006, 15, 223–236. [Google Scholar] [CrossRef] [PubMed]
  14. Zhang, C.; Xing, D. Parallel DNA amplification by convective polymerase chain reaction with various annealing temperatures on a thermal gradient device. Anal. Biochem. 2009, 387, 102–112. [Google Scholar] [CrossRef] [PubMed]
  15. Allen, J.W.; Kenward, M.; Dorfman, K.D. Coupled flow and reaction during natural convection PCR. Microfluid. Nanofluid. 2009, 6, 121–130. [Google Scholar] [CrossRef]
  16. Chen, J.J.; Shen, C.M.; Ko, Y.W. Analytical study of a microfludic DNA amplification chip using water cooling effect. Biomed. Microdevices 2013, 15, 261–278. [Google Scholar] [CrossRef] [PubMed]
  17. Chen, Z.; Qian, S.; Abrams, W.R.; Malamud, D.; Bau, H.H. Thermosiphon-based PCR reactor: Experiment and modeling. Anal. Chem. 2004, 76, 3707–3715. [Google Scholar] [CrossRef] [PubMed]
  18. Tsai, N.C.; Sue, C.Y. SU-8 based continuous-flow RT-PCR bio-chips under high-precision temperature control. Biosens. Bioelectron. 2006, 22, 313–317. [Google Scholar] [CrossRef] [PubMed]
  19. Gui, L.; Ren, C.L. Analytical and numerical study of Joule heating effects on electrokinetically pumped continuous flow PCR chips. Langmuir 2008, 24, 2938–2946. [Google Scholar] [CrossRef] [PubMed]
  20. Mohr, S.; Zhang, Y.H.; Macaskill, A.; Day, P.J.R.; Barber, R.W.; Goddard, N.J.; Emerson, D.R.; Fielden, P.R. Numerical and experimental study of a droplet-based PCR chip. Microfluid. Nanofluid. 2007, 3, 611–621. [Google Scholar] [CrossRef] [Green Version]
  21. Holman, J.P. Heat Transfer; McGraw-Hill: New York, NY, USA, 2009. [Google Scholar]
  22. Chen, J.J.; Chen, W.H.; Shie, Y.S. The effect of thermal contact resistance on heat management in a shuttling PCR system. Appl. Mech. Mater. 2013, 284, 1941–1945. [Google Scholar]
  23. Cengel, Y.A. Heat Transfer: A Practical Approach; McGraw-Hill: New York, NY, USA, 2002. [Google Scholar]
  24. Milanez, F.; Yovanovich, M.M.; Mantelli, M.B.H. Thermal contact conductance at low contact pressures. J. Thermophys. Heat Transf. 2004, 18, 37–44. [Google Scholar]

