Article

Uniform Cell Distribution Achieved by Using Cell Deformation in a Micropillar Array

1
Department of Mechano-Micro Engineering, Interdisciplinary Graduate School of Science and Engineering, Tokyo Institute of Technology, G5-27, 4259, Nagatsutacho, Midori-ku, Yokohama, Kanagawa 2268503, Japan
2
Department of Biomolecular Engineering, Graduate School of Bioscience and Biotechnology, Tokyo Institute of Technology, B-60, 4259, Nagatsutacho, Midori-ku, Yokohama, Kanagawa 2268503, Japan
*
Author to whom correspondence should be addressed.
Micromachines 2015, 6(4), 409-422; https://doi.org/10.3390/mi6040409
Submission received: 18 February 2015 / Revised: 10 March 2015 / Accepted: 10 March 2015 / Published: 1 April 2015

Abstract

:
The uniform dispersion of cells in a microchamber is important to reproduce results in cellular research. However, achieving this is difficult owing to the laminar flow caused by the small dimensions of such a chamber. In this study, we propose a technique to achieve a uniform distribution of cells using a micropillar array inside a microchamber. The cells deform when they pass through a gap between the micropillars. The deformation causes a repetitive clog-and-release process of cells at the gaps between the micropillars. The micropillar array generates random flow inside the microchamber, resulting in the uniform distribution of the cells via cell accumulation. In the experiment, the distribution of cells in the microchamber with the micropillar array is uniform from end to end, whereas that in the microchamber without the micropillar array is centered. The deviation of the cell distribution from the ideally uniform distribution in the microchamber with the micropillar array is suppressed by 63% compared with that in the microchamber without the micropillar array. The doubling time of the cells passed through the micropillar array did not change relative to that of normal N87 cells. This technique will be helpful for reproducing results in cellular research at the micro scale or for those using microfluidic devices.

Graphical Abstract

1. Introduction

The microfluidic device is a key technology for micro total analysis systems (μTASs) or lab-on-a-chip, and is expected to enhance a wide variety of chemical and biological studies. The combination of microfluidic devices with conventional chemical analysis can achieve high throughput analysis, screening, and chemical reactions using ultralow solution volumes. Furthermore, this combination can also be used for biological applications. In the biological field, the advantages of the microfluidic device are as follows: (1) easy manipulation of cells owing to device dimensions comparable to the size of the cells, (2) multiple processing capacity on a single device, (3) the ability to manipulate single cells, and (4) well-controlled conditions because of the laminar flow [1,2]. By using such advantages, many biological devices—such as a cell observation device under well-controlled conditions [3], a cell sorting device [4], a single cell analysis device [5], and a cell interaction analyser [6]—have been developed.
Although microfluidic devices are suitable for cellular research, they have several drawbacks owing to their small dimensions. One is the difficulty of aligning cells in a uniform distribution inside a microchamber. Flow at the micro scale, where the Reynolds number is extremely small relative to the threshold for causing turbulent flow (~2300), is usually laminar [7] and thus does not uniformly spread the cells inside the microchambers. In addition, cells cannot be separated once they aggregate. Therefore, they often show inhomogeneous distributions [8]. However, one of the most important factors in cellular research is the density of cells in the culture medium. The cellular density affects many properties of cells, such as their morphology [9,10], viability [11,12,13], metabolism [14], reaction toward cytokines [15], expression pattern of intracellular proteins [16,17], and differentiation [18,19,20,21]. The conditions around cells—such as the shear stress [22] as well as concentrations of growth factor [23], nutrients [24], and waste [24] from cells—are also affected, resulting in different results across cellular experiments. Under a heterogeneous cellular distribution, the properties are different between locations with high and low cellular densities. Furthermore, the properties cannot be reproduced when the cellular distribution varies for each experiment. To consider the results in cellular researches and arrive at conclusions, experiments must be repeatable. Given these problems, techniques to uniformly align cells in the microchambers are highly necessary.
Some such techniques have been developed, and there are two types: uniform patterning of adhesive sites on the substrates of the microchamber [25,26,27], and uniformly distributed microstructures to capture cells within microchambers [28,29]. By using these techniques, cells can be uniformly aligned using simple microstructures. However, the adhesive sites and microstructures themselves become obstacles and restrict growing direction and area in these techniques. The obstacles near the cells often affect cell characteristics such as the cell differentiation, morphology, proliferation, adhesion, and gene expression. These can be observed from some studies of the relationship between the obstacles and the cell characteristics [30,31]. These restrictions often prevent precise studies on cell activities.
To remove these restrictions, we propose a technique to achieve the uniform distribution of cells using a micropillar array inside a microchamber. The micropillar array generates a random flow caused by a repetitive cell clog-and-release process at the gaps between the micropillars, owing to their deformation from going through the gaps. After the clogged cells undergo deformation and are released, they return to their initial shapes. We thus achieve a uniform distribution of cells inside the microchamber. In this method, the micropillars are not intended to capture cells but to generate a random flow. As a result, the cell culture area that is located downstream of the micropillar array has no obstacles.

2. Experimental Section
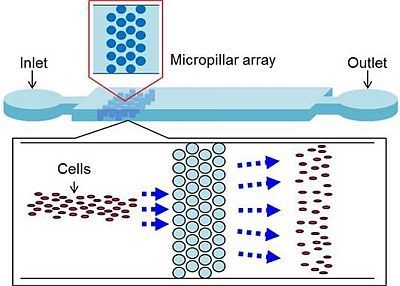
2.1. Principle

2.1.1. Uniform Cell Distribution by Micropillar Array

The concept of uniformly dispersing cells by using a micropillar array is illustrated in Figure 1. The micropillar array consists of hundreds of micropillars uniformly arranged so that the distances between adjacent pairs of pillars are equal. The gaps between the micropillars are well adjusted so that the cells are loosely captured and passed through the gaps with low pressure. The array is located inside the microchamber to generate a random flow, which leads to the uniform distribution of cells inside the microchamber along the generated stream lines. The cells are introduced into the microchamber, after which they flow into the micropillar array. The random flow is generated when the cells clog the micropillar array results in their uniform distribution. The distributed cells are left and incubated in the microchamber to use for further operations (e.g., cytotoxicity assay).
Figure 1. Concept of uniform cell dispersal by a micropillar array. The cells introduced into the microchamber are dispersed uniformly by the micropillar array. Blue arrows indicate the direction of cell motion.
Micromachines 06 00409 g001
The working principle of the micropillar array comprises three processes: clogging of the gaps by the cells (Figure 2), the clog-and-release motion of the cells caused by their deformation (Figure 3), and the random release of the cells (Figure 4). When the cells flow into the micropillar array (Figure 2a), they become clogged at the gaps between micropillars (Figure 2b). Consequently, the direction of the flow is changed [32] and subsequent cells move along the new streamlines. These cells flow towards the micropillar array and become clogged at other gaps which change the flow direction again (Figure 2c). This clogging process is repeated many times, and gradually the cells spread widely. Eventually, the gaps at the front of the micropillar array become fully clogged (Figure 2d).
Next, the cells clogged at the gaps are pushed by the incoming flow of liquid. The clogged cells undergo deformation and pass through the gap. This results in random flow due to differences in the elasticity and size of individual cells. The random flow gradually carries the cells downstream in the gap. Once the clogged cells are released from the gaps, they move along the random flow and become clogged at gaps in the second row (Figure 3a). After the released cells fill all the gaps in the second row, the cells are again gradually pushed through and released from the gaps, and as a result they flow toward the third row (Figure 3b). This clog-and-release process is repeated and cascades downstream (Figure 3c), until the cells are released from the gap at the last row (Figure 3d).
The directions of the cells released from the micropillar array randomly change owing to the position and direction of release at the gaps between the micropillars through which the clogged cells can pass (Figure 4). The cells flow toward the outer sides (Figure 4a) when released from the central part, and toward the central area of the microchamber (Figure 4b) when released simultaneously from the outer sides of the array. The cells flow upward/downward (Figure 4c) when released from the lower/upper gaps, and in parallel (Figure 4d) when the timing and direction of their release are identical.
Figure 2. Schematic illustration of clogging process. (a) Cells flow straight toward the micropillar array. (b) When the cells reach the micropillar array, they become clogged at gaps between the micropillars. The clogged cells cause the flow direction change. (c) Other cells arrive at the micropillar array and become clogged at other gaps, changing the flow direction again. (d) The gaps at the front of the micropillar array become fully clogged. Blue arrows indicate the direction of cell motion.
Micromachines 06 00409 g002
Figure 3. Schematic illustration of the repetitive clog-and-release process. (a) Once the clogged cells are released from the gaps in the front row of the micropillar array, they move along the flow and become clogged at gaps in the second row. (b) The cells are again gradually pushed through the gaps and flow toward the third row. (c) This clog-and-release process cascades downstream. (d) The cells are released from the gap at the last row. Blue arrows indicate the direction of cell motion.
Micromachines 06 00409 g003
Figure 4. Schematic illustrations of random release process. The direction and rate of flow change in different ways. (a) The cells flow toward the outer sides. (b) The cells move toward the central area of the microchamber. (c) The cells flow upward/downward when released from the lower/upper gaps. (d) The cells flow in parallel when the timing and direction of their release are identical. Blue arrows indicate the direction of cell motion.
Micromachines 06 00409 g004

2.2. Experimental

2.2.1. Device Design

Figure 5 shows the microfluidic device used to form a uniform cell distribution. It consists of an inlet, an outlet, and a microchamber for storing cells. The microchamber contains the micropillar array for generating the random flow inside the microchamber. The microchamber is 2 mm in width, 14 mm in length, and 50 μm in height. The diameter of the micropillar is 100 μm and the interval between pillars is 5 μm. This interval was determined to satisfy the requirement that the pillars loosely capture the cells and allow them to pass through the gaps with low pressure. In this study, we tested cells of comparable size (10–20 μm) at intervals ranging from 5 to 20 μm in 5-μm steps, and found that an interval of 5 μm was optimal. An interval greater than 5 μm is too large, such that the cells simply passed through the intervals. An interval less than 5 μm is too narrow to fabricate using the fabrication method. The optimal size of the interval may change depending on cell size or stiffness. In characteristic assays of cells or cytotoxicity assays, usually only one type of cell is cultured at the same time. Therefore, the interval of the pillars is set to only one size. The Reynolds number of the water flow through the microchamber was approximately 0.17, which resulted in the laminar flow. This device is designed for disposable use.
Figure 5. Schematic illustration of microfluidic device. It consists of an inlet, an outlet, and a microchamber containing a micropillar array. The micropillar array generates random flow and achieves uniform cell distribution in the microchamber.
Micromachines 06 00409 g005

2.2.2. Device Fabrication

The microfluidic devices were fabricated using a replica molding method. To prepare the mold, a negative photoresist (SU-8 3000, MicroChem, Newton, MA, USA) 50 μm in thickness was spin-coated onto a silicon wafer. This was exposed to ultra violet (UV) light and developed to obtain the mold. To facilitate the detachment of replicas, the mold was exposed to CHF3 plasma for 1 min and coated with carbohydrate fluoride, using reactive ion etching (RIE; RIE-101L, SAMCO, Kyoto, Japan). The RIE conditions were 50 W input energy, 13 Pa pressure, and 30 sccm flow rate. After fabrication of the mold, the polydimethylsiloxane (PDMS; SILPOT184, Dow Corning Toray, Chiyoda, Japan) base and curing agent were mixed (10:1 weight ratio). The mixed PDMS was poured onto the mold and cured at 100 °C for 1 h. After curing, the PDMS replica was peeled from the mold. Access ports were created with a disposable biopsy punch. To obtain good adhesion between the PDMS replica and a slide glass, they were exposed to O2 plasma for 10 s by using RIE. The conditions were 75 W in input energy, 6.7 Pa in pressure, and 50 sccm in flow rate. They were bonded together under a weight at 100 °C for 1 h. The fabricated microfluidic device is shown in Figure 6a. The microchamber is filled with water, colored with red food dye for visibility. It contains a micropillar array inside the microchamber (Figure 6b).
Figure 6. Fabricated microfluidic device. (a) Top view of the fabricated microfluidic device filled with water, colored with red food dye to improve visibility. The dashed rectangular line shows the position of the micropillar array. (b) Magnified image of the micropillar array shown in the dashed line rectangular of the figure (a). The diameter of each micropillar is 100 μm and the interval between the micropillars is 5 μm.
Micromachines 06 00409 g006

2.2.3. Cell Culture and Preparation of Cell Suspensions

N87 human gastric cancer cells were used because the cells easily aggregate, which makes it difficult to distribute them uniformly. They were obtained from ATCC (Manassas, VA, USA). The cells were maintained in Dulbecco’s modified Eagle medium (DMEM; D-MEM (high glucose) with l-glutamine, phenol red, and sodium pyruvate, Wako, Osaka, Japan) supplemented with 10% fetal bovine serum (FBS; Fetal Bovine Serum regular, Corning), 100 µg/mL streptomycin, and 100 U/mL penicillin (Penicillin-Streptomycin solution (×100), Wako) in an incubator at 37°C and 5% CO2 concentration. The cells were cultured in cell culture dishes and subcultured every 3 days. Trypsin (0.25% w/v Trypsin solution with phenol red, Wako) was used to detach the cells to prepare a concentrated cell suspension. After detachment, trypsin was diluted sufficiently to be deactivated by DMEM containing FBS. The density of the detached cells was adjusted to obtain a cell suspension of 1.0 × 10⁷ cell/mL in density.

2.2.4. Experimental Setup

A schematic illustration of the experimental setup is shown in Figure 7. It consists of three components: (i) a microfluidic device to disperse cells uniformly; (ii) a syringe pump (KDS200, KD Scientific, Holliston, MA, USA) to introduce a cell suspension and other reagents into the device; and (iii) a microscope (IX-73, Olympus, Shinjuku, Japan) to visualize the introduced cells. A syringe mounted on the syringe pump was connected to the microfluidic device through a silicone tube and a stainless steel pipe. The concentrated cell suspension (1.0 × 10⁷ cell/mL) was introduced into the microfluidic device. The cells in the microchamber were observed under the microscope. To avoid contamination, the microfluidic device was sterilized in an autoclave (KTS-2322, ALP, Hamura, Japan), and exposed to a UV lamp for 10 min after the introduction of deionized water into the microchamber. Phosphate buffered saline (PBS; PBS(-), Wako) was introduced at a flow rate of 40 µL/min for 10 min to wash the microchamber. After washing, DMEM was introduced into the microchamber. The cell suspension was then introduced into the microchamber at a flow rate of 10 µL/min.
Figure 7. Schematic illustration of experimental setup. Cell suspension is introduced into (i) the microfluidic device by using (ii) a syringe pump. The cells are observed under (iii) a microscope.
Micromachines 06 00409 g007

3. Results and Discussion

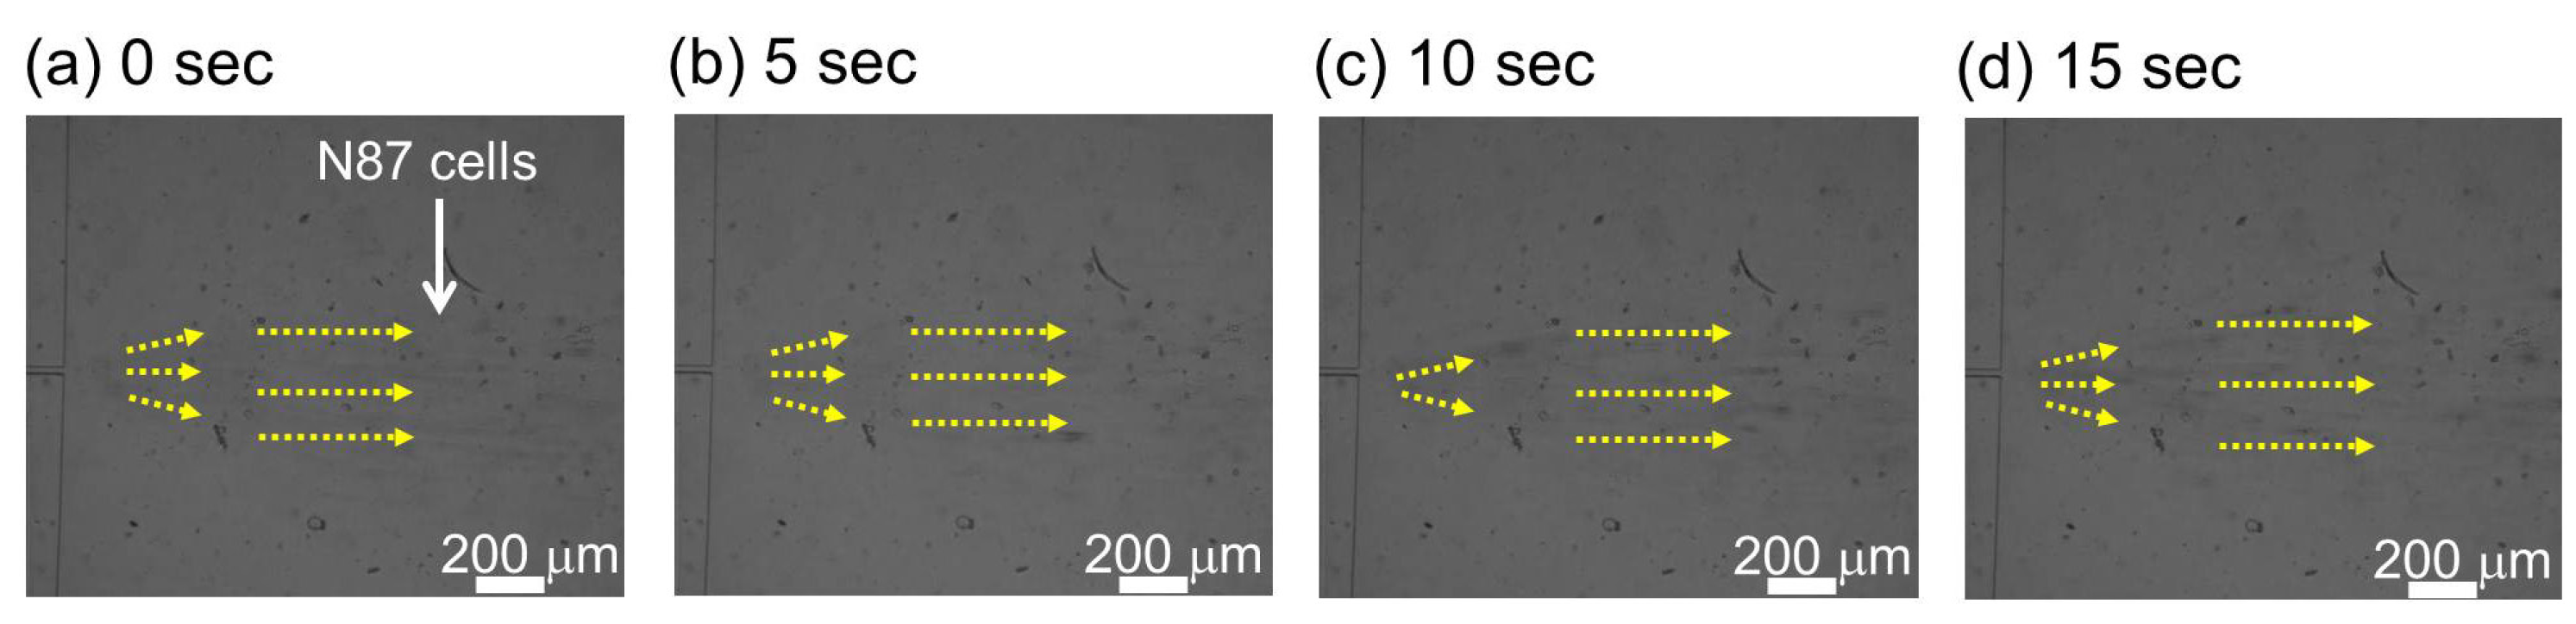
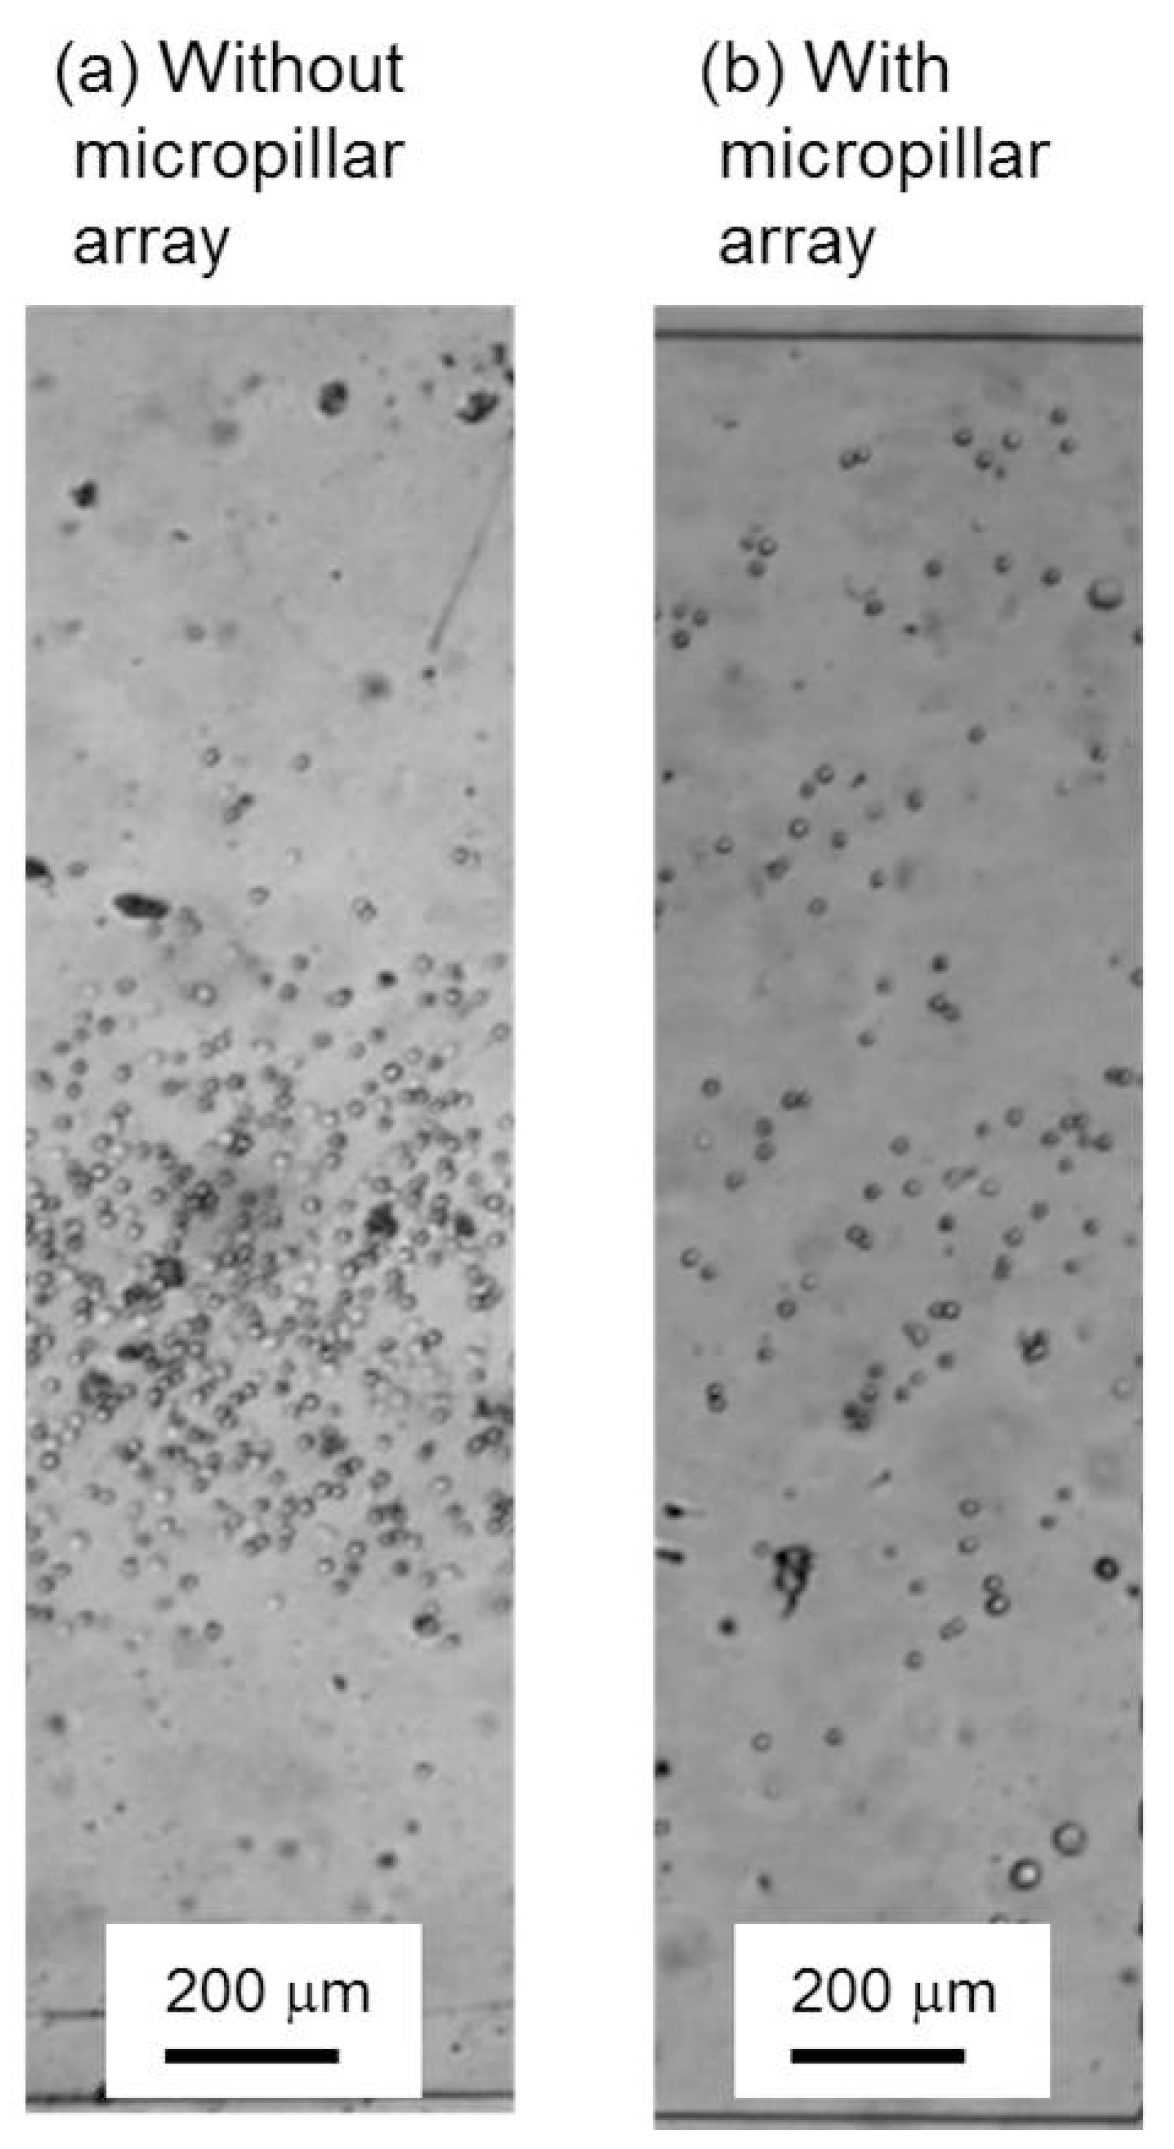
3.1. Cell Introduction into Microchamber without Micropillar Array

The N87 cells were introduced into a microchamber without a micropillar array (Figure 8 and Video S1). The N87 cells were introduced from a narrow microchannel 20 μm in width (Figure 8a). Five seconds later, the spread of the N87 cells increased from 20 μm (the microchannel) to 250 μm around the central part of the microchamber (Figure 8b). With this distribution, the N87 cells did not spread uniformly but were concentrated at the center of the microchamber. The cell distribution remained unchanged after 10 s (Figure 8c) and was still similar after 15 s (Figure 8d).
Figure 8. Serial images of N87 cells introduced into a microchamber without a micropillar array. (a) N87 cells are introduced. Images at (b) 5 s, (c) 10 s, and (d) 15 s after introduction of the cells. Yellow arrows indicate the direction of cell motion.
Micromachines 06 00409 g008

3.2. Cell Introduction into Microchamber with Micropillar Array

The N87 cells were introduced into a microchamber with a micropillar array (Figure 9 and Video S2) from a narrow microchannel 20 μm in width (Figure 9a) as in the case without the micropillar array (Figure 8a). The cells moved straight along the stream lines in the microchamber. However, the cells came across the micropillar array, moved around the micropillar array, and then spread wider at 10 s after the cell introduction (Figure 9b). At 20 s, some cells passed through the micropillar array, and generated random flow down the stream of the micropillar array (Figure 9c). The accumulation of the random flows achieved a uniform distribution of the N87 cells in the microchamber. The number of N87 cells decreased to 47% calculated by counting cell numbers at before and after the micropillar array.
Figure 9. Serial images of the motions of N87 cells introduced into a microchamber with a micropillar array. (a) The cells flow straight towards the micropillar array. (b) Once they reach the micro pillar array at 10 s, the spread of the cells widens. (c) The cells after the micropillar array spread at 20 s. Yellow arrows indicate the direction of cell motion.
Micromachines 06 00409 g009

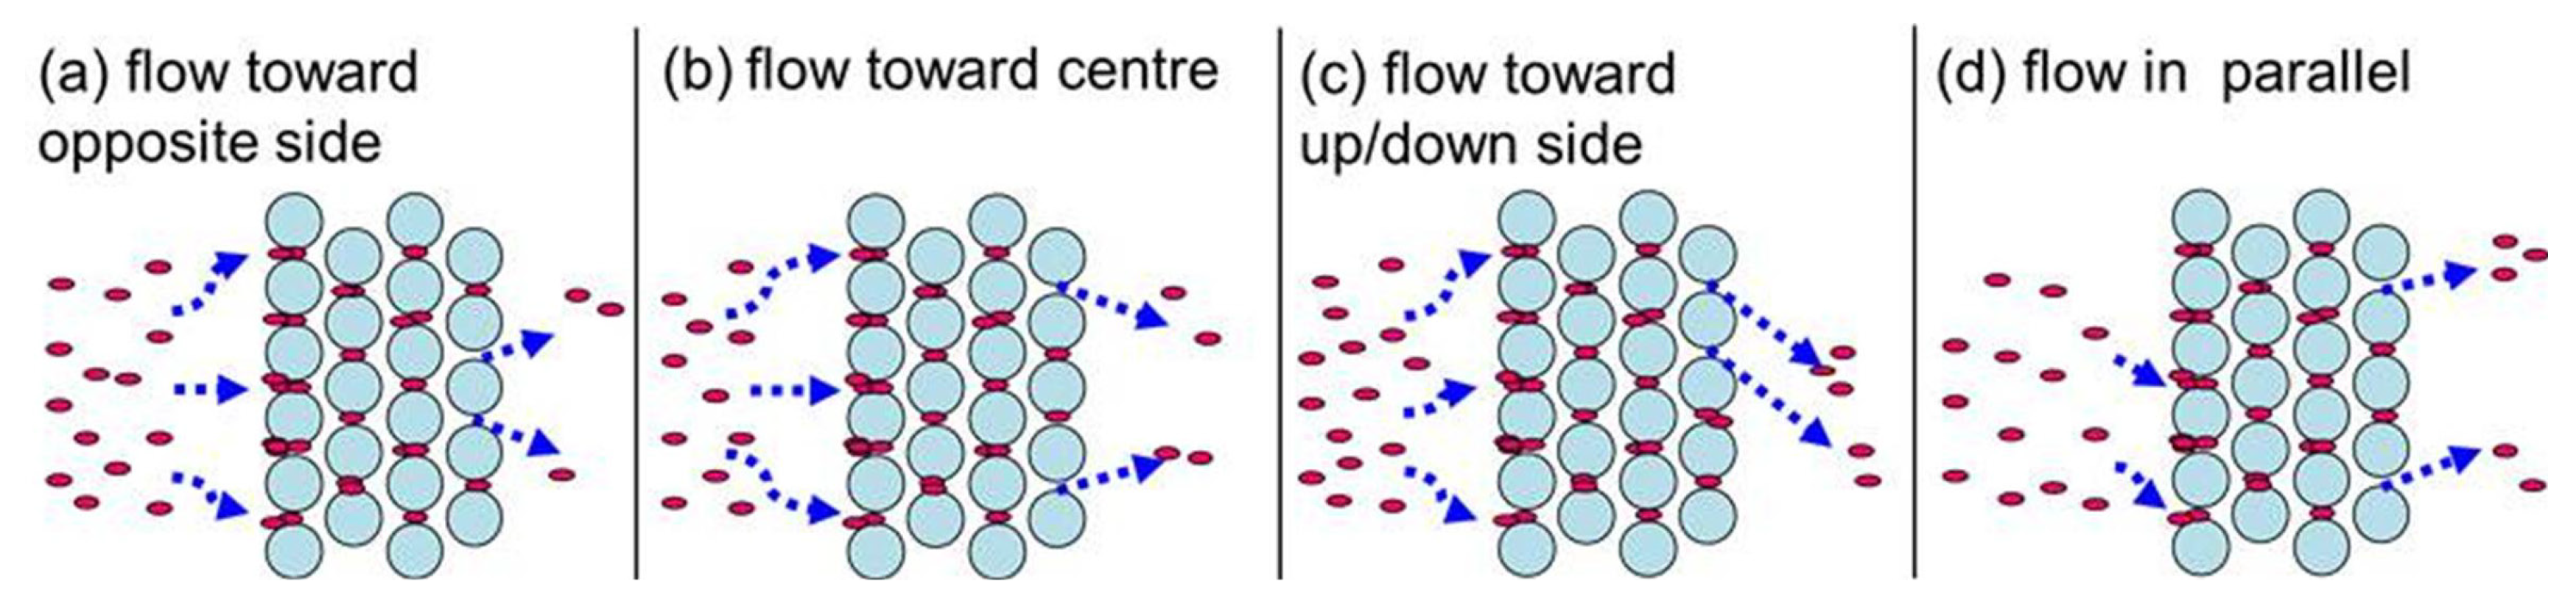
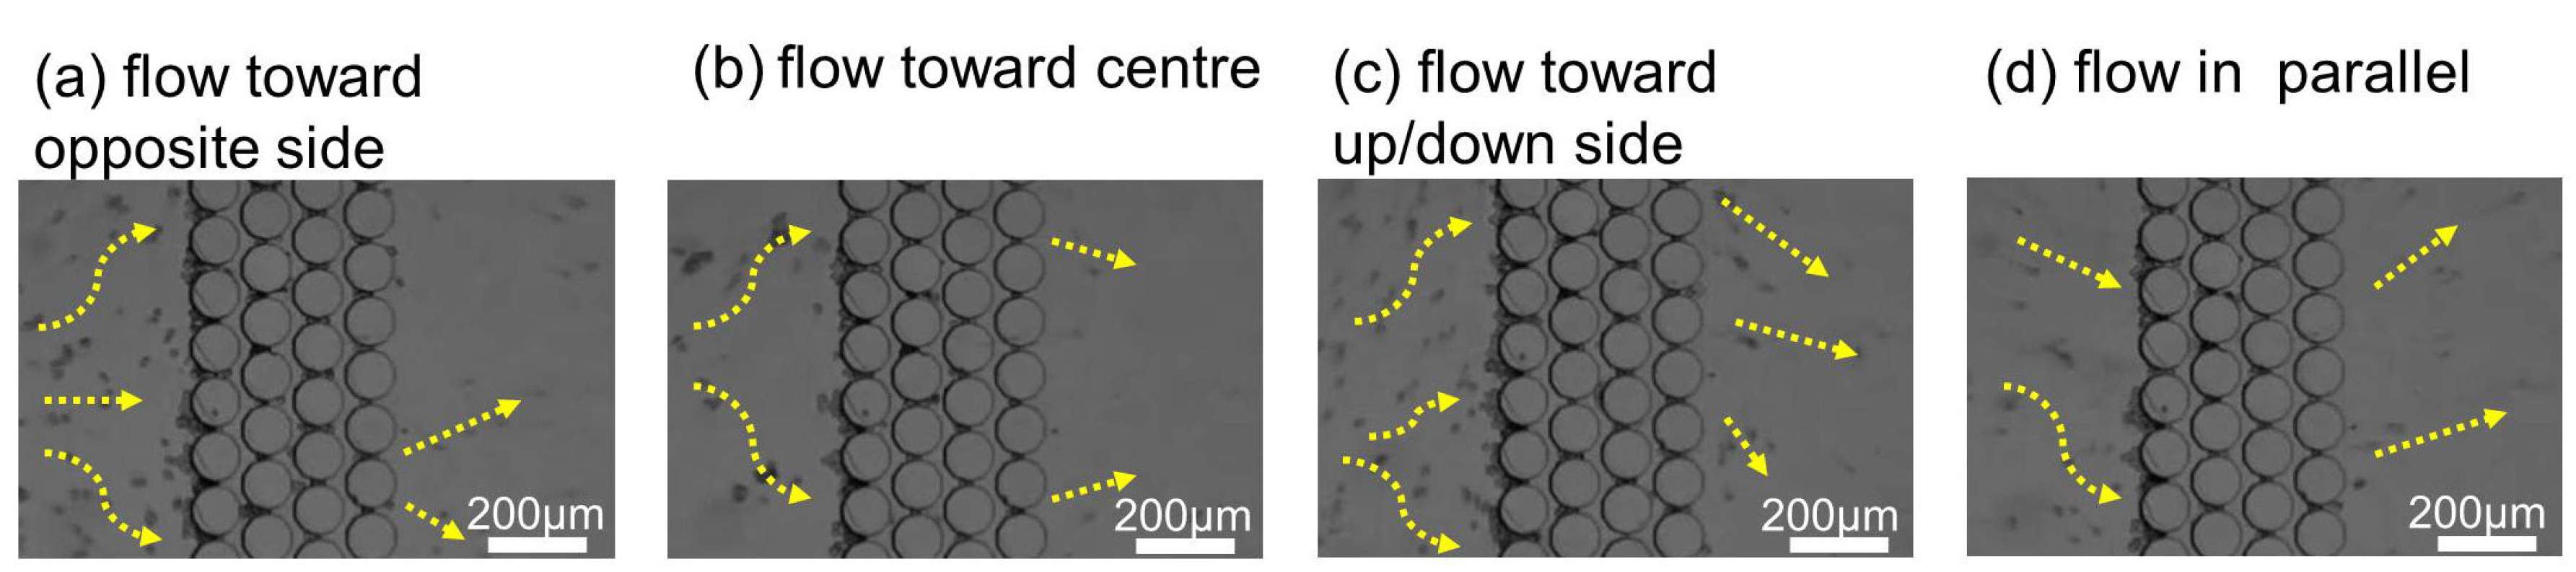
3.3. Detailed Motion of N87 Cells in Micropillar Array

The motions of N87 cells in the micropillar array, which achieved uniform distribution of cells in the microchamber, were grouped into the three processes of (1) clogging, (2) repetitive clog-and-release, and (3) random release. Each process was analyzed (Figure 10, Figure 11 and Figure 12). Figure 10 shows the clogging process that causes the flow of N87 cells to widen. The cells flowed towards the micropillar array (Figure 10a) when the cell suspension was introduced into the microchamber with the micropillar array. A central gap of the array was clogged by the first cell to reach it (Figure 10b). The following N87 cells moved around the central occupied gap and clogged other gaps around it (Figure 10c). The cells gradually dispersed owing to this circumvention of clogged gaps (Figure 10d).
Once all the gaps in the front row of the micropillar array were clogged with N87 cells, the cell suspension could flow only through narrow passes among the clogged cells and micropillars. The rate and direction of the flow from the narrow passes were random, and therefore randomly pushed the clogged cells. The cells became further clogged at such narrow passes, which then increased the pressure applied to the clogged cells. With this pressure, some clogged cells were pushed, deformed, and released from the front row of the array. The released cells moved along the random flow and became clogged at gaps in the second row (Figure 11a). The gaps in the second row were also filled by the cells released from the front row. After all gaps in the second row were occupied, the clogged cells were again released and moved toward the third row array (Figure 11b). This clog-and-release process was repeated and cascaded downstream (Figure 11c), resulting in the random motion of the cells inside the micropillar array. With this repetitive process, the cells finally went through the micropillar array (Figure 11d). The clog-and-release process at each row occurred simultaneously and a complex flow was generated.
Figure 12 shows the N87 cells released from the micropillar array. The location of the clogged cells continuously changed because of the random cell motions inside the array. Therefore, the directions and flow rates of the cells passing through the array changed. The direction of cell motion randomly varied among a flow toward the outer side (Figure 12a), a flow toward the center (Figure 12b), a flow toward upward/downward (Figure 12c), and a flow in parallel (Figure 12d). With the accumulation of these random flows, the distribution of N87 cells became uniform. The random changes in direction led to the uniform spreading of cells when enough time had elapsed.
Figure 10. Detailed observation of cell motion before micropillar array. (a) The cells flow straight toward the micropillar array. (b) When the cells reached the micropillar array, the cells became clogged at gaps between the micropillars. (c) Other cells that arrived at the micropillar array became clogged at other gaps, which again changed the flow direction. (d) The gaps at the front of the micropillar array finally became fully clogged. Yellow arrows indicate the direction of cell motion.
Micromachines 06 00409 g010
Figure 11. Detailed observation of cell motion inside micropillar array. (a) Once the clogged cells were released from the gaps, they moved along the random flow and became clogged at gaps in the second row of the micropillar array. (b) The cells were again gradually passed through the gaps and flowed toward the third row of the micropillar array. (c) This clog-and-release process was repeated. (d) The cells were released from the gaps in the last row of the micropillar array. Yellow arrows indicate the direction of cell motion.
Micromachines 06 00409 g011
Figure 12. Detailed observation of motion of cells released from micropillar array. The direction and rate of the flow changed in different ways. (a) The cells flowed toward the outer sides. (b) The cells moved toward the central area of the microchamber. (c) The cells flowed upward/downward. (d) The cells flowed in parallel. Yellow arrows indicate the direction of cell motion.
Micromachines 06 00409 g012

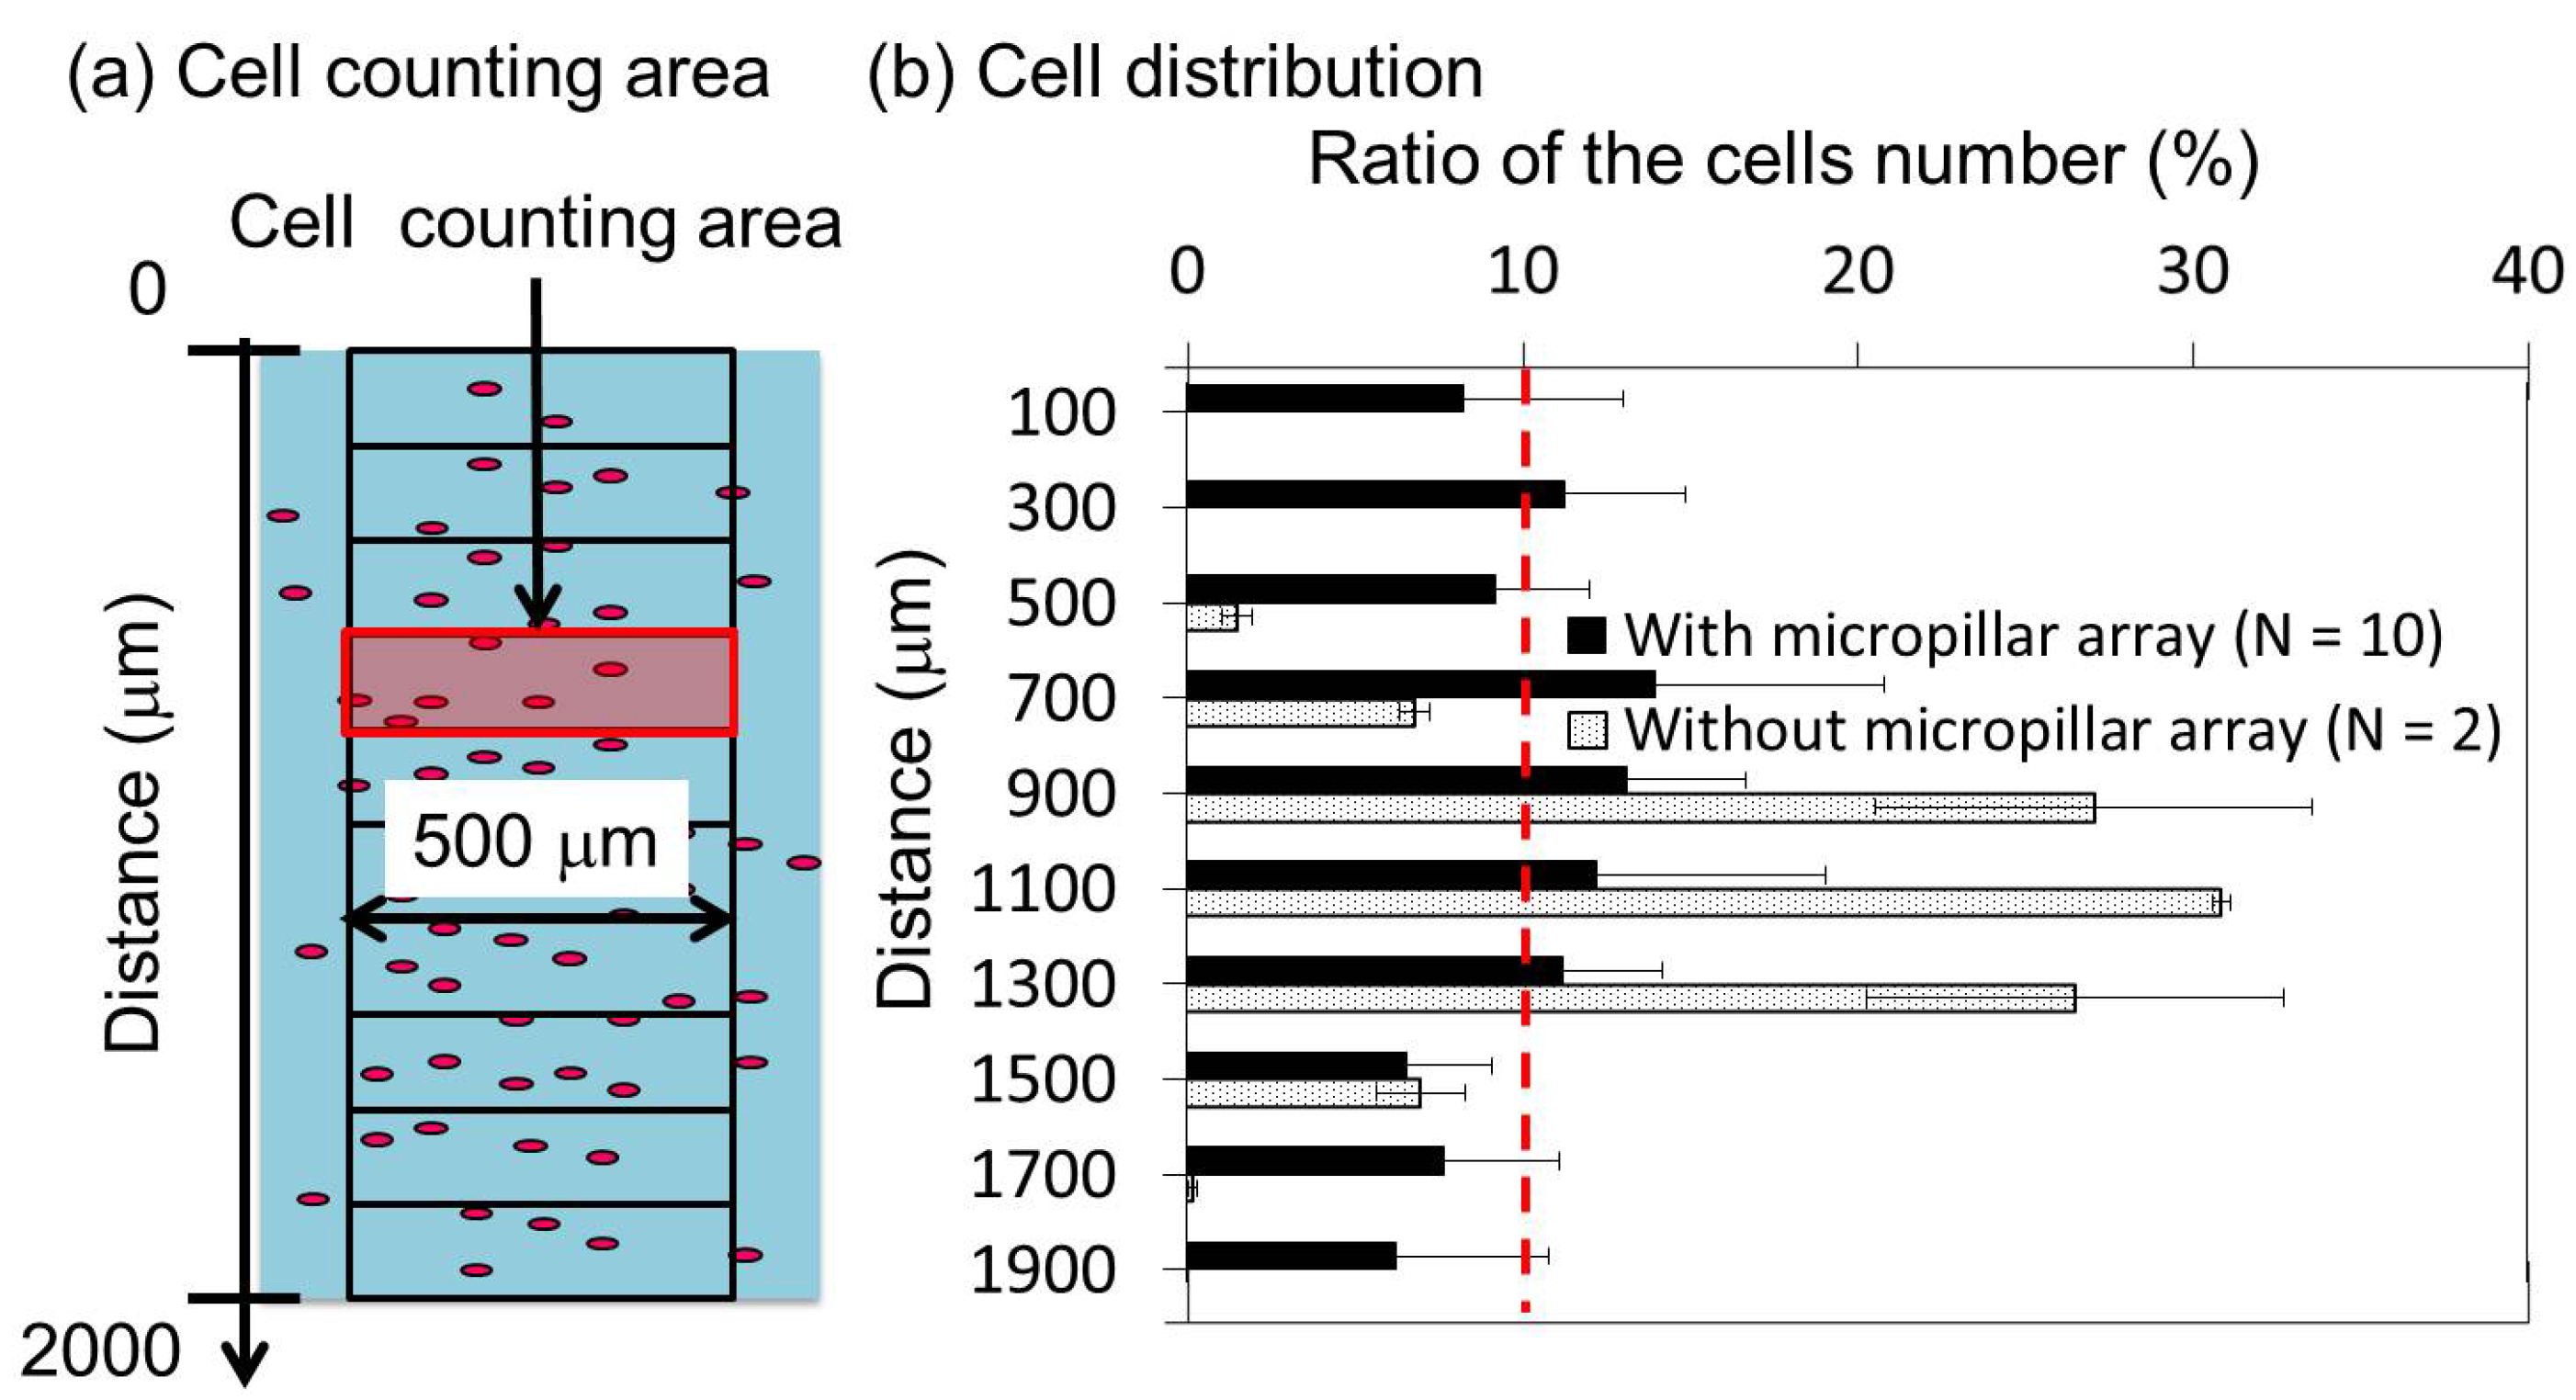
3.4. Comparison of Cell Distributions

The distributions of N87 cells in the microchambers with and without the micropillar array are shown in Figure 13a,b, respectively. The micrographs show areas (500 μm in length and 2.0 mm in width) where the cell distributions were analyzed. The area was located 3.6 mm downstream from the microchannel where the N87 cells were introduced into the microchamber. Each of these areas was horizontally divided into ten cell counting areas. Each area is marked off every 200 μm from the top of the microchamber, resulting in cell counting areas of 500 μm × 0.2 mm. The number of N87 cells was counted in each area and normalized by the total number of cells in all cell counting areas. Some N87 cells aggregated in the microchamber without the micropillar array (Figure 13a), whereas no such aggregation was observed in the microchamber with the micropillar array (Figure 13b). The aggregated cells made it more difficult to uniformly distribute the introduced cells within the microchamber.
Figure 13. Images of N87 cells introduced into microchamber. (a) Microchamber without micropillar array. The cells are concentrated in the center of the microchamber. (b) Microchamber with micropillar array. The cells are uniformly dispersed.
Micromachines 06 00409 g013
The ratios of the cell numbers in the cell counting areas are plotted in Figure 14. The distribution of cells in the microchamber with the micropillar array is uniform over all the counting area, whereas that in the microchamber without the micropillar array is centered (cells existed only in the areas from 500 μm to 1500 μm) (Figure 14b). We compared the root mean squares of the cell distribution from the ideally uniform cell distribution between the microchambers with and without the micropillar array. The ratio of cell number in each area should be 10% if the cells are ideally dispersed. The root mean square of the distribution from this value was calculated in each area. The averaged root mean square among our experiments inside the microchamber without the micropillar array was 13% (N = 2, 0.30% in standard deviation), and in the microchamber with the micropillar array, it was 4.9% (N = 10, 1.5% in standard deviation). This result shows that the micropillar array effectively achieves uniform distribution of cells inside the microchamber. The N87 cells released from the micropillar array were incubated under standard culture conditions for 50 h. Compared with the initial number of N87 cells, the normalized number of cells increased to 2.6 with a standard deviation of 0.25. This is comparable to the doubling time of 47 h [33] for normal N87 cells. This result suggests that the released N87 cells are not damaged. Furthermore, we obtained similar results in HeLa cells, which are the most common cell line, suggesting that the proposed technique is valid for all deformable cell lines (Figure S1).
Figure 14. Cell distribution in microchamber without/with the micropillar array. (a) Definition of Cell counting area. (b) Comparison of the ratios of cell number in the microchamber without/with the micropillar array. This graph shows the cell distribution tendency. Error bars show the standard deviation of the ratio of the cell number. The distribution of the cells in the microchamber with the micropillar array is uniform over the counting area, whereas that in the microchamber without the micropillar array is centered (the cells existed only in the areas from 500 μm to 1500 μm).
Micromachines 06 00409 g014

4. Conclusions

We proposed a technique to achieve uniform distribution of cells by employing the deformability of the cells in a micropillar array, and analyzed the cell motions caused by the array. The technique does not restrict the growing direction and area of cells, or limit the cell species. We checked the popular analysis of whether the cells are damaged via tests of cellular propagation and morphology. The cellular propagation rate and morphology are close to normally cultured cells without any stresses. However, our distribution method using the micropillar array could have a wide variety of applications, and therefore damage which cannot be evaluated by the two tests should be further analyzed in special applications. In addition, this method is likely to select for small and elastic cells passing through the micropillar array. Therefore, the influence of variation in cell size and elasticity should be analyzed in individual applications. We believe that this technique will be helpful to reproduce results in cellular research at the microscopic scale or those obtained by using microfluidic devices.

Acknowledgments

This work was supported by the Solutions Research Laboratory of the Tokyo Institute of Technology.

Author Contributions

Tadashi Ishida and Tetsuya Kadonosono conceived the project. Maho Kaminaga conducted the experiment. Tetsuya Kadonosono and Shinae Kizaka-Kondoh discussed the biological aspects. Toru Omata supervised the project. Maho Kaminaga, Tadashi Ishida, Toru Omata wrote the paper.

Supplementary Materials

Supplementary materials including Figure S1, Videos S1 and S2 can be accessed at: https://www.mdpi.com/2072-666X/6/4/409/s1.

Conflicts of Interest

The authors declare no conflict of interest.

References

  1. Andersson, H.; van den Berg, A. Microfluidic devices for cellomics: A review. Sens. Actuators B Chem. 2003, 92, 315–325. [Google Scholar] [CrossRef]
  2. Kim, S.M.; Lee, S.H.; Suh, K.Y. Cell research with physically modified microfluidic channels: A review. Lab Chip 2008, 8, 1015–1023. [Google Scholar] [CrossRef] [PubMed]
  3. Wang, L.; Liu, W.; Wang, Y.; Wang, J.; Tu, Q.; Liu, R.; Wang, J. Construction of oxygen and chemical concentration gradients in a single microfluidic device for studying tumor cell-drug interactions in a dynamic hypoxia microenvironment. Lab Chip 2013, 13, 695–705. [Google Scholar] [CrossRef] [PubMed]
  4. Nagrath, S.; Sequist, L.V.; Maheswaran, S.; Bell, D.W.; Irimia, D.; Ulkus, L.; Smith, M.R.; Kwak, E.L.; Digumarthy, S.; Muzikansky, A.; et al. Isolation of rare circulating tumour cells in cancer patients by microchip technology. Nature 2007, 450, 1235–1239. [Google Scholar] [CrossRef] [PubMed]
  5. Yin, H.; Marshall, D. Microfluidics for single cell analysis. Curr. Opin. Biotechnol. 2012, 23, 110–119. [Google Scholar] [CrossRef] [PubMed]
  6. Zervantonakis, I.K.; Hughes-Alford, S.K.; Charest, J.L.; Condeelis, J.S.; Gertler, F.B.; Kamm, R.D. Three-dimensional microfluidic model for tumor cell intravasation and endothelial barrier function. Proc. Natl. Acad. Sci. USA 2012, 109, 13515–13520. [Google Scholar] [CrossRef] [PubMed]
  7. Squires, T.; Quake, S. Microfluidics Fluid physics at the nanoliter scale. Rev. Mod. Phys. 2005, 77, 977–1026. [Google Scholar] [CrossRef]
  8. Lee, P.J.; Hung, P.J.; Rao, V.M.; Lee, L.P. Nanoliter scale microbioreactor array for quantitative cell biology. Biotechnol. Bioeng. 2006, 94, 5–14. [Google Scholar] [CrossRef] [PubMed]
  9. Brewer, G.J.; Torricelli, J.R.; Evege, E.K.; Price, P.J. Optimized survival of hippocampal neurons in B27-supplemented Neurobasal, a new serum-free medium combination. J. Neurosci. Res. 1993, 35, 567–576. [Google Scholar] [CrossRef] [PubMed]
  10. Hui, T.Y.; Cheung, K.M.C.; Cheung, W.L.; Chan, D.; Chan, B.P. In vitro chondrogenic differentiation of human mesenchymal stem cells in collagen microspheres: Influence of cell seeding density and collagen concentration. Biomaterials 2008, 29, 3201–3212. [Google Scholar] [CrossRef] [PubMed]
  11. Ma, Q.; Wang, Y.; Lo, A.S.-Y.; Gomes, E.M.; Junghans, R.P. Cell density plays a critical role in ex vivo expansion of T cells for adoptive immunotherapy. J. Biomed. Biotechnol. 2010, 2010, 386545. [Google Scholar] [CrossRef] [PubMed]
  12. Chen, X.; Thibeault, S. Effect of DMSO concentration, cell density and needle gauge on the viability of cryopreserved cells in three dimensional hyaluronan hydrogel. Conf. Proc. IEEE Eng. Med. Biol. Soc. 2013, 2013, 6228–6231. [Google Scholar] [PubMed]
  13. Dar, A.; Shachar, M.; Leor, J.; Cohen, S. Optimization of cardiac cell seeding and distribution in 3D porous alginate scaffolds. Biotechnol. Bioeng. 2002, 80, 305–312. [Google Scholar] [CrossRef] [PubMed]
  14. Aldridge, J.; Pye, E.K. Cell density dependence of oscillatory metabolism. Nature 1976, 259, 670–671. [Google Scholar] [CrossRef] [PubMed]
  15. Kuszynski, C.A.; Miller, K.A.; Rizzino, A. Influence of cell density and receptor number on the binding and distribution of cell surface epidermal growth factor receptors. In Vitro Cell. Dev. Biol. Anim. 1993, 29A, 708–713. [Google Scholar] [CrossRef]
  16. Basu, S.; Gerchman, Y.; Collins, C.H.; Arnold, F.H.; Weiss, R. A synthetic multicellular system for programmed pattern formation. Nature 2005, 434, 1130–1134. [Google Scholar] [CrossRef] [PubMed]
  17. Ben-Ze’ev, A.; Robinson, G.S.; Bucher, N.L.; Farmer, S.R. Cell-cell and cell-matrix interactions differentially regulate the expression of hepatic and cytoskeletal genes in primary cultures of rat hepatocytes. Proc. Natl. Acad. Sci. USA 1988, 85, 2161–2165. [Google Scholar] [CrossRef] [PubMed]
  18. Altman, G.H.; Horan, R.L.; Martin, I.; Farhadi, J.; Stark, P.R.H.; Volloch, V.; Richmond, J.C.; Vunjak-Novakovic, G.; Kaplan, D.L. Cell differentiation by mechanical stress. FASEB J. 2002, 16, 270–272. [Google Scholar] [PubMed]
  19. Vunjak-Novakovic, G.; Altman, G.; Horan, R.; Kaplan, D.L. Tissue engineering of ligaments. Annu. Rev. Biomed. Eng. 2004, 6, 131–156. [Google Scholar] [CrossRef] [PubMed]
  20. Kim, K.; Dean, D.; Mikos, A.G.; Fisher, J.P. Effect of initial cell seeding density on early osteogenic signal expression of rat bone marrow stromal cells cultured on cross-linked poly(propylene fumarate) disks. Biomacromolecules 2009, 10, 1810–1817. [Google Scholar] [CrossRef] [PubMed]
  21. Gage, B.K.; Webber, T.D.; Kieffer, T.J. Initial cell seeding density influences pancreatic endocrine development during in vitro differentiation of human embryonic stem cells. PLoS One 2013, 8, e82076. [Google Scholar] [CrossRef] [PubMed]
  22. Wang, Z.; Kim, M.-C.; Marquez, M.; Thorsen, T. High-density microfluidic arrays for cell cytotoxicity analysis. Lab Chip 2007, 7, 740–745. [Google Scholar] [CrossRef] [PubMed]
  23. Lichtner, R.B.; Schirrmacher, V. Cellular distribution and biological activity of epidermal growth factor receptors in A431 cells are influenced by cell-cell contact. J. Cell. Biochem. 1990, 144, 303–312. [Google Scholar]
  24. Melchels, F.P.W.; Barradas, A.M.C.; van Blitterswijk, C.A.; de Boer, J.; Feijen, J.; Grijpma, D.W. Effects of the architecture of tissue engineering scaffolds on cell seeding and culturing. Acta Biomater. 2010, 6, 4208–4217. [Google Scholar] [CrossRef] [PubMed] [Green Version]
  25. Gonzalez-Macia, L.; Morrin, A.; Smyth, M.R.; Killard, A.J. Advanced printing and deposition methodologies for the fabrication of biosensors and biodevices. Analyst 2010, 135, 845–867. [Google Scholar] [CrossRef] [PubMed]
  26. Khademhosseini, A.; Suh, K.Y.; Jon, S.; Eng, G.; Yeh, J.; Chen, G.J.; Langer, R. A soft lithographic approach to fabricate patterned microfluidic channels. Anal. Chem. 2004, 76, 3675–3681. [Google Scholar] [CrossRef] [PubMed]
  27. Rozkiewicz, D.I.; Kraan, Y.; Werten, M.W.T.; de Wolf, F.A.; Subramaniam, V.; Ravoo, B.J.; Reinhoudt, D.N. Covalent microcontact printing of proteins for cell patterning. Chemistry 2006, 12, 6290–6297. [Google Scholar] [CrossRef] [PubMed]
  28. Nilsson, J.; Evander, M.; Hammarström, B.; Laurell, T. Review of cell and particle trapping in microfluidic systems. Anal. Chim. Acta 2009, 649, 141–157. [Google Scholar] [CrossRef] [PubMed]
  29. Ges, I.A.; Brindley, R.L.; Currie, K.P.M.; Baudenbacher, F.J. A microfluidic platform for chemical stimulation and real time analysis of catecholamine secretion from neuroendocrine cells. Lab Chip 2013, 13, 4663–4673. [Google Scholar] [CrossRef] [PubMed]
  30. Brammer, K.S.; Choi, C.; Frandsen, C.J.; Oh, S.; Jin, S. Hydrophobic nanopillars initiate mesenchymal stem cell aggregation and osteo-differentiation. Acta Biomater. 2011, 7, 683–690. [Google Scholar] [CrossRef] [PubMed]
  31. Ross, A.M.; Jiang, Z.; Bastmeyer, M.; Lahann, J. Physical aspects of cell culture substrates: Topography, roughness, and elasticity. Small 2012, 8, 336–355. [Google Scholar] [CrossRef] [PubMed] [Green Version]
  32. Tan, W.-H.; Takeuchi, S. A trap-and-release integrated microfluidic system for dynamic microarray applications. Proc. Natl. Acad. Sci. USA 2007, 104, 1146–1151. [Google Scholar] [CrossRef] [PubMed]
  33. Park, J.G.; Frucht, H.; LaRocca, R.V.; Bliss, D.P.; Kurita, Y.; Chen, T.R.; Henslee, J.G.; Trepel, J.B.; Jensen, R.T.; Johnson, B.E. Characteristics of cell lines established from human gastric carcinoma. Cancer Res. 1990, 50, 2773–2780. [Google Scholar] [PubMed]

