Could miRNA Signatures be Useful for Predicting Uterine Sarcoma and Carcinosarcoma Prognosis and Treatment?

 ,
,
Abstract
:
1. Introduction
2. Results
3. Discussion
4. Materials and Methods
4.1. Samples
4.2. MicroRNAs Expression Profile Analysis
4.3. Statistical Analysis
5. Conclusions
Author Contributions
Funding
Conflicts of Interest
References
- Prat, J.; Nomonde, M. Uterine sarcomas. Int. J. Gynecol. Obstet. 2015, 131, S105–S110. [Google Scholar] [CrossRef] [PubMed]
- American Cancer Society. Uterine Sarcomas-UpToDate. Available online: https://www. cancer.org/cancer/uterine-sarcoma.html (accessed on 15 January 2018).
- Almeida, T.G.; Cunha, I.W.; Maciel, G.A.R.; Baracat, E.C.; Carvalho, K.C. Clinical and molecular features of uterine sarcomas. Med. Express 2014, 1, 291–297. [Google Scholar] [CrossRef]
- World Health Organization. Classification of tumours of female reproductive organs-UpToDate. Available online: http://apps.who.int (accessed on 15 January 2018).
- Desar, I.M.E.; Ottevanger, P.B.; Benson, C.; van der Graaf, W.T.A. Systemic treatment in adult uterine sarcomas. Crit. Rev. Oncol. Hematol. 2018, 122, 10–20. [Google Scholar] [CrossRef] [PubMed]
- D’Angelo, E.; Prat, J. Uterine sarcomas: A review. Gynecol. Oncol. 2010, 116, 131–139. [Google Scholar] [CrossRef] [PubMed]
- Kowalewska, M.; Danska-Bidzinska, A.; Bakula-Zalewska, E.; Bidzinski, M. Identification of suitable reference genes for gene expression measurement in uterine sarcoma and carcinosarcoma tumors. Clin. Biochem. 2012, 45, 368–371. [Google Scholar] [CrossRef] [PubMed]
- De Almeida, B.C.; Garcia, N.; Maffazioli, G.; dos Anjos, L.G.; Baracat, E.C.; Carvalho, K.C. Oncomirs expression profiling in uterine leiomyosarcoma cells. Int. J. Mol. Sci. 2018, 19, 52. [Google Scholar] [CrossRef] [PubMed]
- Chuang, T.-D.; Ho, M.; Khorram, O. The regulatory function of miR-200c on inflammatory and cell-cycle associated genes in SK-LMS-1, a leiomyosarcoma cell line. Reprod. Sci. 2015, 22, 563–571. [Google Scholar] [CrossRef] [PubMed]
- Parafioriti, A.; Bason, C.; Armiraglio, E.; Calciano, L.; Daolio, P.; Berardocco, M.; Di Bernardo, A.; Colosimo, A.; Luksch, R.; Berardi, A. Ewing’s sarcoma: an analysis of miRNA expression profiles and target genes in paraffin-embedded primary tumor tissue. Int. J. Mol. Sci. 2016, 17, 656. [Google Scholar] [CrossRef] [PubMed]
- MacFarlane, L.A.; Murphy, P.R. MicroRNA: biogenesis, function and role in cancer. Curr. Genomics 2010, 11, 537–561. [Google Scholar] [CrossRef] [PubMed]
- Georgieva, B.; Milev, I.; Minkov, I.; Dimitrova, I.; Bradford, A.P.; Baev, V. Characterization of the uterine leiomyoma microRNAome by deep sequencing. Genomics 2012, 99, 275–281. [Google Scholar] [CrossRef] [PubMed]
- Wang, H. Predicting microRNA biomarkers for cancer using phylogenetic tree and microarray analysis. Int. J. Mol. Sci. 2016, 17, 773. [Google Scholar] [CrossRef] [PubMed]
- Romero-Cordoba, S.L.; Salido-Guadarrama, I.; Rodriguez-Dorantes, M.; Hidalgo-Miranda, A. miRNA biogenesis: biological impact in the development of cancer. Cancer Biol. Ther. 2014, 15, 1444–1455. [Google Scholar] [CrossRef] [PubMed]
- Pencheva, N.; Tavazoie, S.F. Control of metastatic progression by microRNA regulatory networks. Nat. Cell Biol. 2013, 15, 546–554. [Google Scholar] [CrossRef] [PubMed] [Green Version]
- Gadducci, A.; Cosio, S.; Romanini, A.; Genazzani, A.R. The management of patients with uterine sarcoma: a debated clinical challenge. Crit. Rev. Oncol. Hematol. 2008, 65, 129–142. [Google Scholar] [CrossRef] [PubMed]
- Stofko, D.L. Undifferentiated uterine sarcoma metastatic to the brain. Surg. Neurol. Int. 2013, 4, 127. [Google Scholar] [CrossRef] [PubMed]
- Zagouri, F.; Dimopoulos, A.-M.; Fotiou, S.; Kouloulias, V.; Papadimitriou, C.A. Treatment of early uterine sarcomas: disentangling adjuvant modalities. World J. Surg. Oncol. 2009, 7, 1–10. [Google Scholar] [CrossRef] [PubMed]
- Felix, A.S.; Stone, R.A.; Bowser, R.; Chivukula, M.; Edwards, R.P.; Weissfeld, J.L.; Linkov, F. Comparison of survival outcomes between patients with malignant mixed mullerian tumors and high-grade endometrioid, clear cell, and papillary serous endometrial cancers. Int. J. Gynecol. Cancer 2011, 21, 877–884. [Google Scholar] [CrossRef] [PubMed]
- Ghaemmaghami, F.; Karimi-Zarchi, M.; Gilani, M.M.; Mousavi, A.; Behtash, N.; Ghasemi, M. Uterine sarcoma: clinicopathological characteristics, treatment and outcome in Iran. Asian Pac. J. Cancer Prev. 2008, 9, 421–426. [Google Scholar] [PubMed]
- Vrzic-Petronijevic, S.; Likic-Ladjevic, I.; Petronijevic, M.; Argirovic, R.; Ladjevic, N. Diagnosis and surgical therapy of uterine sarcoma. Acta. Chir. Iugosl. 2006, 53, 67–72. [Google Scholar] [CrossRef] [PubMed]
- Kanthan, R.; Senger, J.-L. Uterine carcinosarcomas (malignant mixed müllerian tumours): A review with special emphasis on the controversies in management. Obstet. Gynecol. Int. 2011, 2011, 1–13. [Google Scholar] [CrossRef] [PubMed]
- Reichardt, P. The treatment of uterine sarcomas. Ann. Oncol. 2012, 23, 151–157. [Google Scholar] [CrossRef] [PubMed]
- Naaman, Y.; Shveiky, D.; Ben-Shachar, I.; Shushan, A.; Mejia-Gomez, J.; Benshushan, A. Uterine sarcoma: prognostic factors and treatment evaluation. Isr. Med. Assoc. J. 2011, 13, 76–79. [Google Scholar] [PubMed]
- Tsuyoshi, H.; Yoshida, Y. Molecular biomarkers for uterine leiomyosarcoma and endometrial stromal sarcoma. Cancer Sci. 2018, 109, 1743–1752. [Google Scholar] [CrossRef] [PubMed]
- Lim, H.J.; Yang, J.-L. Regulatory roles and therapeutic potential of microRNA in sarcoma. Crit. Rev. Oncol. Hematol. 2016, 97, 118–130. [Google Scholar] [CrossRef] [PubMed]
- Torres, A.; Torres, K.; Maciejewski, R.; Harvey, W.H. MicroRNAs and their role in gynecological tumors. Med. Res. Rev. 2011, 31, 895–923. [Google Scholar] [CrossRef] [PubMed]
- Kowalewska, M.; Bakula-Zalewska, E.; Chechlinska, M.; Goryca, K.; Nasierowska-Guttmejer, A.; Danska-Bidzinska, A.; Bidzinski, M. microRNAs in uterine sarcomas and mixed epithelial-mesenchymal uterine tumors: a preliminary report. Tumour Biol. 2013, 34, 2153–2160. [Google Scholar] [CrossRef] [PubMed]
- Guijarro, M.V.; Dahiya, S.; Danielson, L.S.; Segura, M.F.; Vales-Lara, F.M.; Menendez, S.; Popiolek, D.; Mittal, K.; Wei, J.J.; Zavadil, J.; et al. Dual Pten/Tp53 suppression promotes sarcoma progression by activating Notch signaling. Am. J. Pathol. 2013, 182, 2015–2027. [Google Scholar] [CrossRef] [PubMed]
- Ravid, Y.; Formanski, M.; Smith, Y.; Reich, R.; Davidson, B. Uterine leiomyosarcoma and endometrial stromal sarcoma have unique miRNA signatures. Gynecol. Oncol. 2016, 140, 512–517. [Google Scholar] [CrossRef] [PubMed]
- Chen, B.; Liu, J.; Qu, J.; Song, Y.; Li, Y.; Pan, S. MicroRNA-25 suppresses proliferation, migration, and invasion of osteosarcoma by targeting SOX4. Tumour Biol. 2017, 39, e1010428317703841. [Google Scholar] [CrossRef] [PubMed]
- Shi, G.; Perle, M.A.; Mittal, K.; Chen, H.; Zou, X.; Narita, M.; Hernando, E.; Lee, P.; Wei, J.J. Let-7 repression leads to HMGA2 upregulation in uterine leiomyosarcoma. J. Cell Mol. Med. 2009, 13, 3898–3905. [Google Scholar] [CrossRef] [PubMed]
- Davidson, B.; Abeler, V.M.; Hellesylt, E.; Holth, A.; Shih, I.M.; Skeie-Jensen, T.; Chen, L.; Yang, Y.; Wang, T.L. Gene expression signatures differentiate uterine endometrial stromal sarcoma from leiomyosarcoma. Gynecol. Oncol. 2013, 128, 349–355. [Google Scholar] [CrossRef] [PubMed] [Green Version]
- Devor, E.J.; DE Mik, J.N.; Ramachandran, S.; Goodheart, M.J.; Leslie, K.K. Global dysregulation of the chromosome 14q32 imprinted region in uterine carcinosarcoma. Exp. Ther. Med. 2012, 3, 677–682. [Google Scholar] [CrossRef] [PubMed] [Green Version]
- Daigeler, A.; Klein-Hitpass, L.; Chromik, M.A.; Müller, O.; Hauser, J.; Homann, H.-H.; Steinau, H.-U.; Lehnhardt, M. Heterogeneous in vitro effects of doxorubicin on gene expression in primary human liposarcoma cultures. BMC Cancer 2008, 8, 313. [Google Scholar] [CrossRef] [PubMed]
- Ciarmela, P.; Islam, M.S.; Reis, F.M.; Gray, P.C.; Bloise, E.; Petraglia, F.; Vale, W.; Castellucci, M. Growth factors and myometrium: biological effects in uterine fibroid and possible clinical implications. Hum. Reprod. Update 2011, 17, 772–790. [Google Scholar] [CrossRef] [PubMed] [Green Version]
- Kumar, P.; Wood, C. Kaposi’s sarcoma-associated herpesvirus transactivator Rta induces cell cycle arrest in G0/G1 phase by stabilizing and promoting nuclear localization of p27kip. J. Virol. 2013, 87, 13226–13238. [Google Scholar] [CrossRef] [PubMed]
- Li, Y.; Nakka, M.; Kelly, A.J.; Lau, C.C.; Krailo, M.; Barkauskas, D.A.; Hicks, J.M.; Man, T.-K. p27 is a candidate prognostic biomarker and metastatic promoter in osteosarcoma. Cancer Res. 2016, 76, 4002–4011. [Google Scholar] [CrossRef] [PubMed]
- Garcia, N.; Bozzini, N.; Baiocchi, G.; da Cunha, I.W.; Maciel, G.A.; Soares, J.M.; Soares, F.A.; Baracat, E.C.; Carvalho, K.C. May Sonic Hedgehog proteins be markers for malignancy in uterine smooth muscle tumors? Hum. Pathol. 2016, 50, 43–50. [Google Scholar] [CrossRef] [PubMed]
- Gkioka, E.; Msaouel, P.; Philippou, A.; Vlaghogiannis, N.I.; Vogkou, C.T.; Margiolis, A.; Koutsilieris, M. The role of insulin-like growth factor-1 signaling pathways in uterine leiomyoma. In Vivo 2015, 29, 637–649. [Google Scholar] [PubMed]
- Berindan-Neagoe, I.; Monroig, P.D.C.; Pasculli, B.; Calin, G.A. MicroRNAome genome: A treasure for cancer diagnosis and therapy. CA Cancer J. Clin. 2014, 64, 311–336. [Google Scholar] [CrossRef] [PubMed] [Green Version]
- Mendell, J.T.; Olson, E.N. MicroRNAs in stress signaling and human disease. Cell 2013, 148, 1172–1187. [Google Scholar] [CrossRef] [PubMed]
- Prat, J. FIGO staging for uterine sarcomas. Int. J. Gynecol. Obstet. 2009, 104, 177–178. [Google Scholar] [CrossRef] [PubMed]
- Data Analysis Center-Qiagen. Available online: https://www.qiagen.com/br/shop/genes-and-pathways/ data-analysis-center-overview-page/ (accessed on 12 February 2018).
- miR TarBase: the experimentally validated microRNA-target interactions database. Available online: http://mirtarbase.mbc.nctu.edu.tw/php/index.php (accessed on 1 February 2018).


| Variables | Categories | n (%) |
|---|---|---|
| Age | >50 years | 59 (74) |
| ≤50 years | 21 (26) | |
| N. A. | 0 (0) | |
| Main complaint | Bleeding | 48 (60) |
| Pelvic Pain | 18 (23) | |
| N. A. | 14 (17) | |
| Menopause | Yes | 54 (67) |
| No | 11 (14) | |
| N. A. | 15 (19) | |
| Contraceptive | Yes | 3 (4) |
| No | 42 (52) | |
| N. A. | 35 (44) | |
| Hormone replacement therapy (HRT) | Yes | 2 (3) |
| No | 49 (61) | |
| N. A. | 29 (36) | |
| Smoking | Yes | 3 (4) |
| No | 30 (37) | |
| N. A. | 47 (59) | |
| Surgical treatment | Yes | 78 (98) |
| No | 2 (2) | |
| Follow up | Average | 36 months |
| Range | 1 to 183 months | |
| Metastasis | Yes | 52 (65) |
| No | 21 (26) | |
| N. A. | 7 (9) | |
| Death | Yes | 55 (69) |
| Alive | 15 (19) | |
| N. A. | 10 (12) |
| Variables | Categories | LMS n (%) | CS n (%) | ESS n (%) | ADS n (%) |
|---|---|---|---|---|---|
| Clinical Stage | I | 10 (27) | 4 (17.4) | 7 (38.9) | 2 (100) |
| II | 10 (27) | 2 (8.7) | 3 (16.7) | 0 (0) | |
| III | 5 (13.5) | 11 (47.8) | 7 (38.9) | 0 (0) | |
| IV | 12 (32.5) | 6 (26.1) | 1 (5.5) | 0 (0) | |
| N. A. | 0 (0) | 0 (0) | 0 (0) | 0 (0) | |
| Histological Grade | High | 27 (73) | 23 (100) | 13 (72.2) | 1 (50) |
| Low | 10 (27) | 0 (0) | 5 (27.8) | 1 (50) | |
| N. A. | 0 (0) | 0 (0) | 0 (0) | 0 (0) | |
| Recurrence | No | 6 (17) | 8 (35) | 3 (17) | 1 (50) |
| Persistence | 12 (32) | 6 (26) | 7 (39) | 0 (0) | |
| Relapse | 15 (40) | 5 (22) | 7 (39) | 0 (0) | |
| N. A. | 4 (11) | 4 (17) | 1 (5) | 1 (50) | |
| Metastasis | Locoregional | 12 (5) | 2 (9) | 3 (17) | 0 (0) |
| Distant | 15 (55) | 9 (39) | 11 (61) | 0 (0) | |
| N. A. | 10 (40) | 12 (52) | 4 (22) | 2 (100) | |
| Adjuvant Treatment | No | 10 (27) | 5 (21.7) | 5 (27.8) | 0 (0) |
| RT | 11 (29.7) | 8 (34.8) | 6 (33.3) | 2 (100) | |
| CT | 11 (29.7) | 3 (13.1) | 4 (22.2) | 0 (0) | |
| CT+RT | 5 (13.6) | 7 (30.4) | 3 (16.7) | 0 (0) | |
| N. A. | 0 (0) | 0 (0) | 0 (0) | 0 (0) | |
| Status | Alive | 7 (18.9) | 3 (13) | 4 (22.2) | 1 (50) |
| Death | 26 (70.3) | 16 (70) | 13 (72.2) | 0 (0) | |
| Loss of follow-up | 4 (10.8) | 4 (17) | 1 (5.6) | 1 (50) | |
| N. A. | 0 (0) | 0 (0) | 0 (0) | 0 (0) |
| Clinical Variable | LMS | CS | ESS | |||
|---|---|---|---|---|---|---|
| miRNA | p | miRNA | p | miRNA | p | |
| Age (over 50 years old) | 220c-3p a 29a-3p b | 0.049 0.033 | - | - | - | - |
| Main complaint—Bleeding | - | - | - | - | 142-5p a 148b-3p a 214-3p a | 0.031 0.016 0.016 |
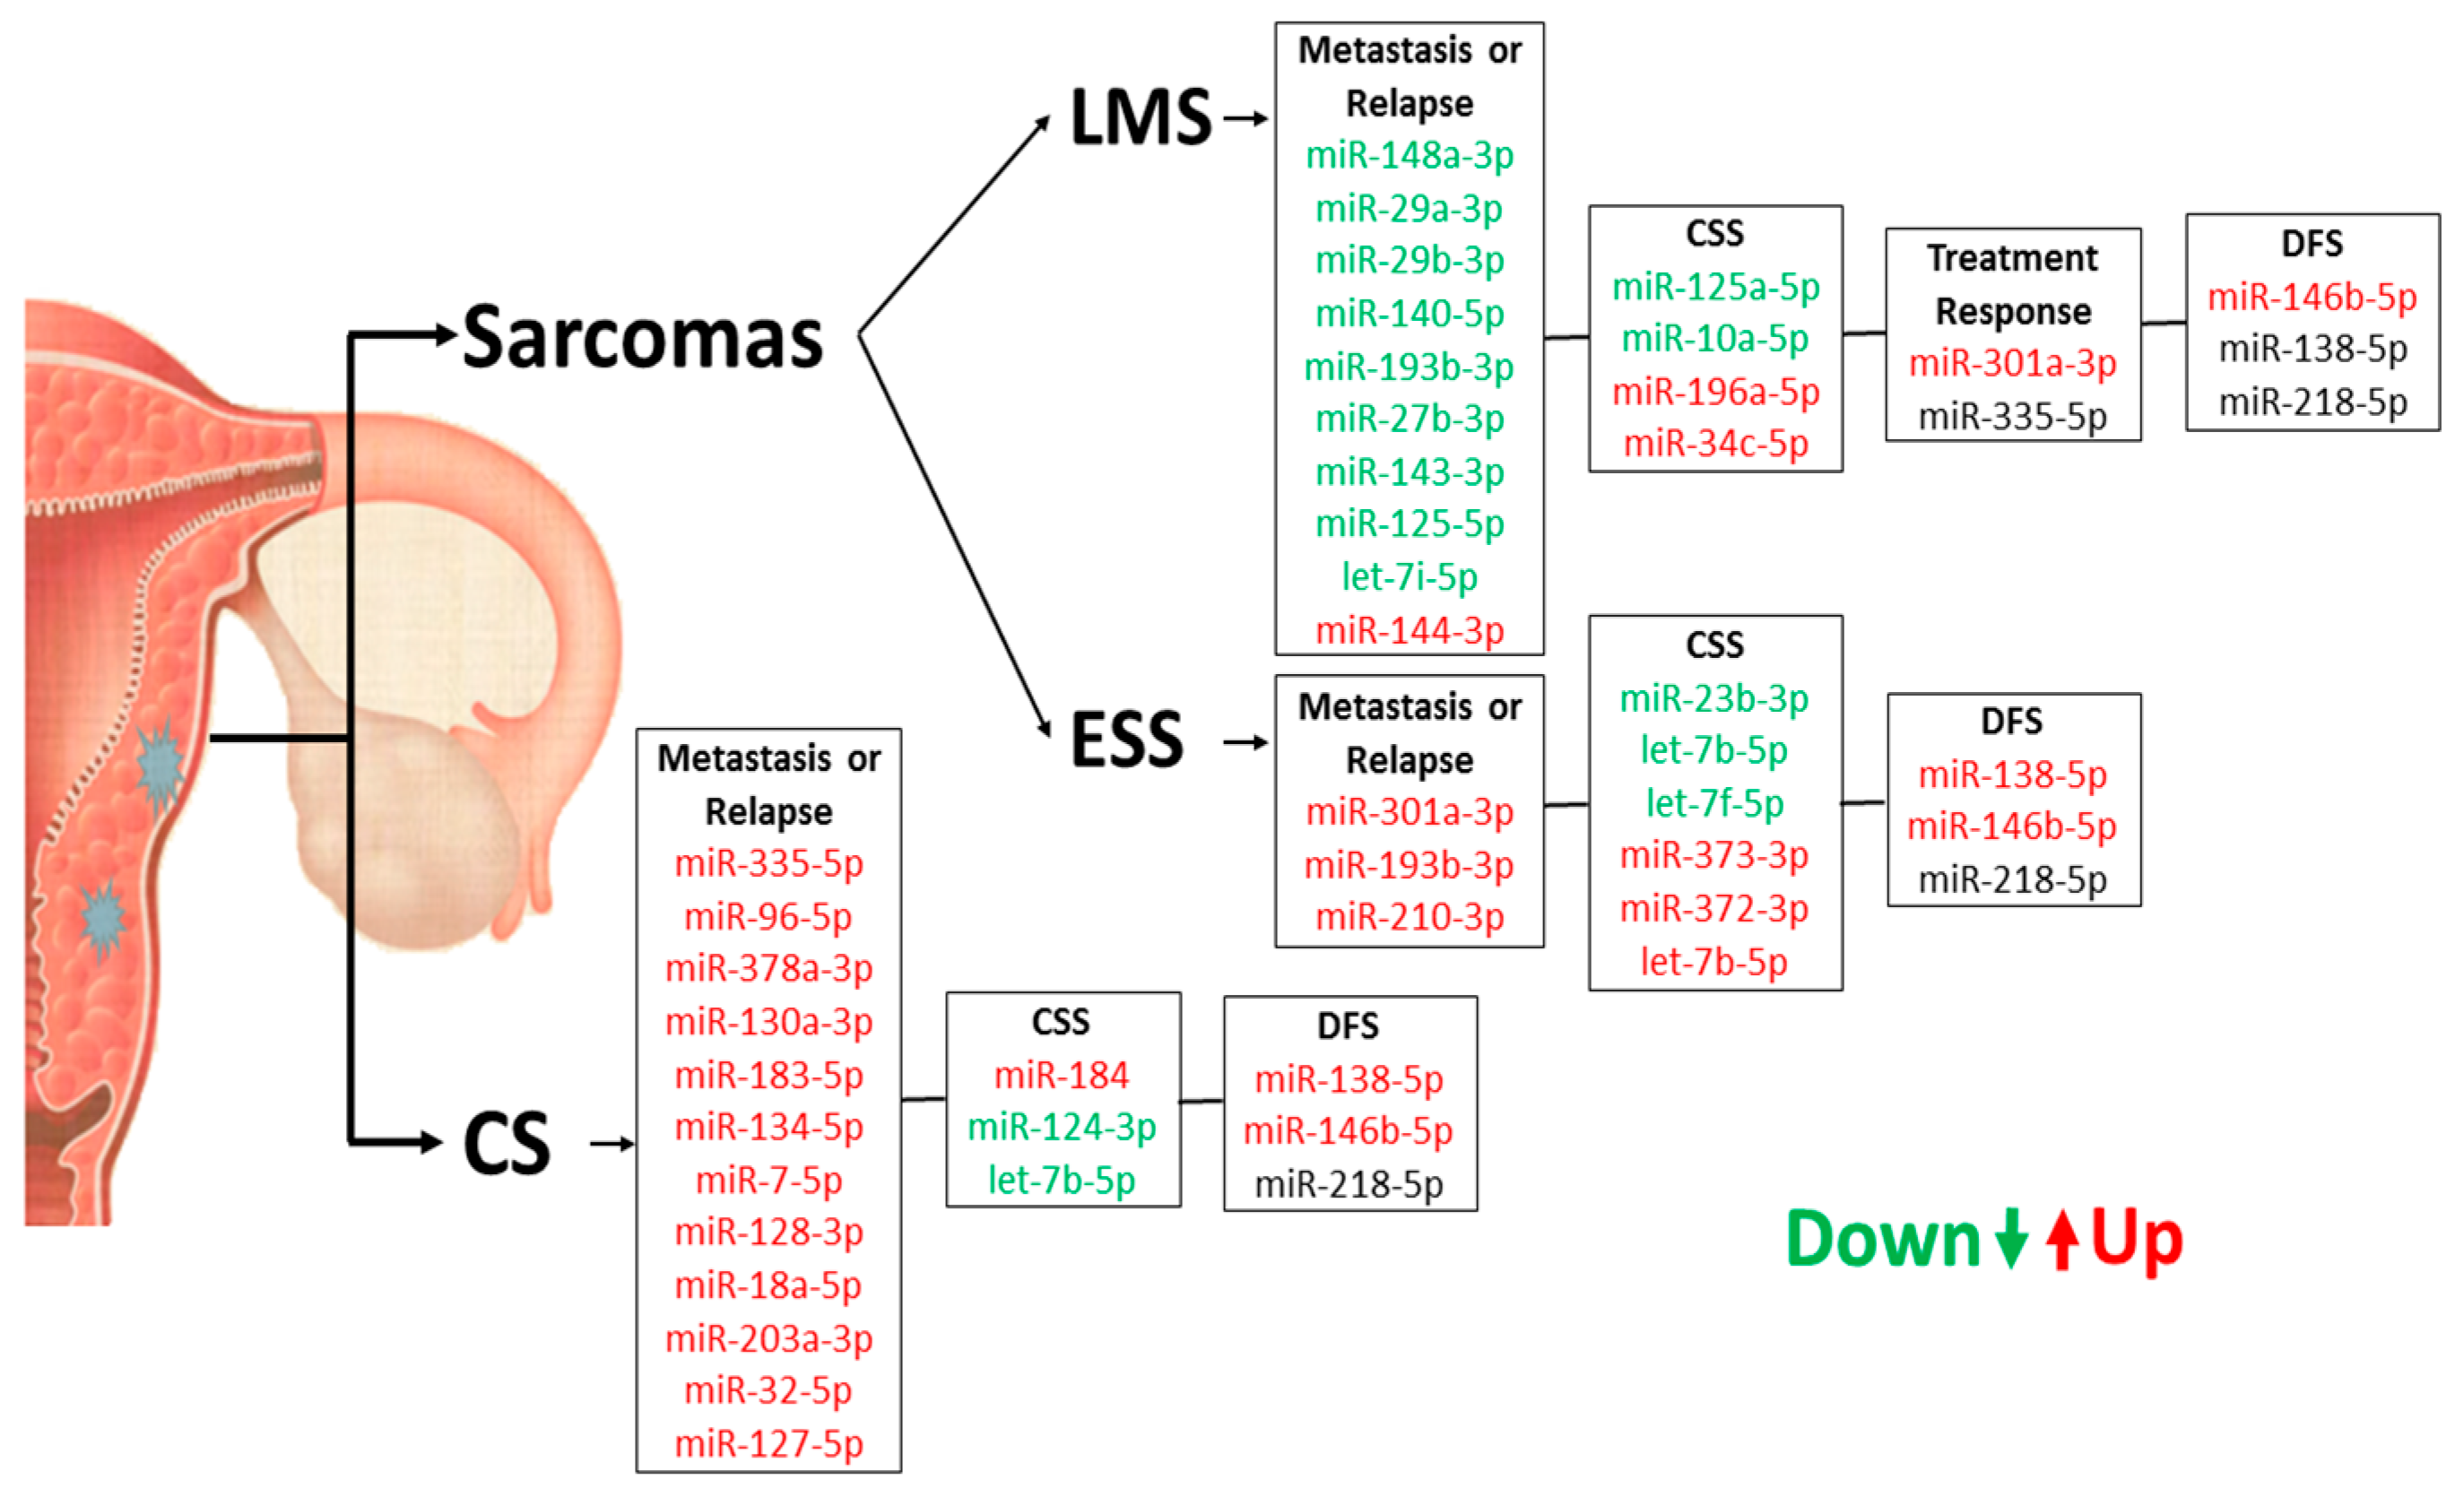
| Menopause | 148a-3p a 7-5p a 32-5p a | 0.022 0.023 0.030 | 30c-5p b,* 148a-3p b 100-5p b let-7i-5p b,* | 0.001 0.004 0.034 0.001 | 335-5p b | 0.025 |
| Oral contraceptive | - | - | - | - | 132-3p b 34c-5p b | 0.005 0.006 |
| HRT | - | - | - | - | 125a-5p b 222-3p b 205-5p b | 0.039 0.039 0.019 |
| Smoking | - | - | 125a-5p a 30c-5p a 135b-5p a let-7i-5p a 27b-3p a 29a-3p a let-7f-5p a 34a-5p a 25-3p a 125b-5p a 23b-3p a 335-5p a 21-5p a | 0.018 0.018 0.011 0.006 0.011 0.044 0.018 0.011 0.007 0.028 0.028 0.044 0.029 | 27b-3p a 143-3p a | 0.006 0.038 |
| Patients who died | 96-5p b 132-3p b 183-5p b,* 124-3p b | 0.023 0.026 0.001 0.024 | 122-5p a | 0.025 | 29b-3p b 206 b | 0.027 0.026 |
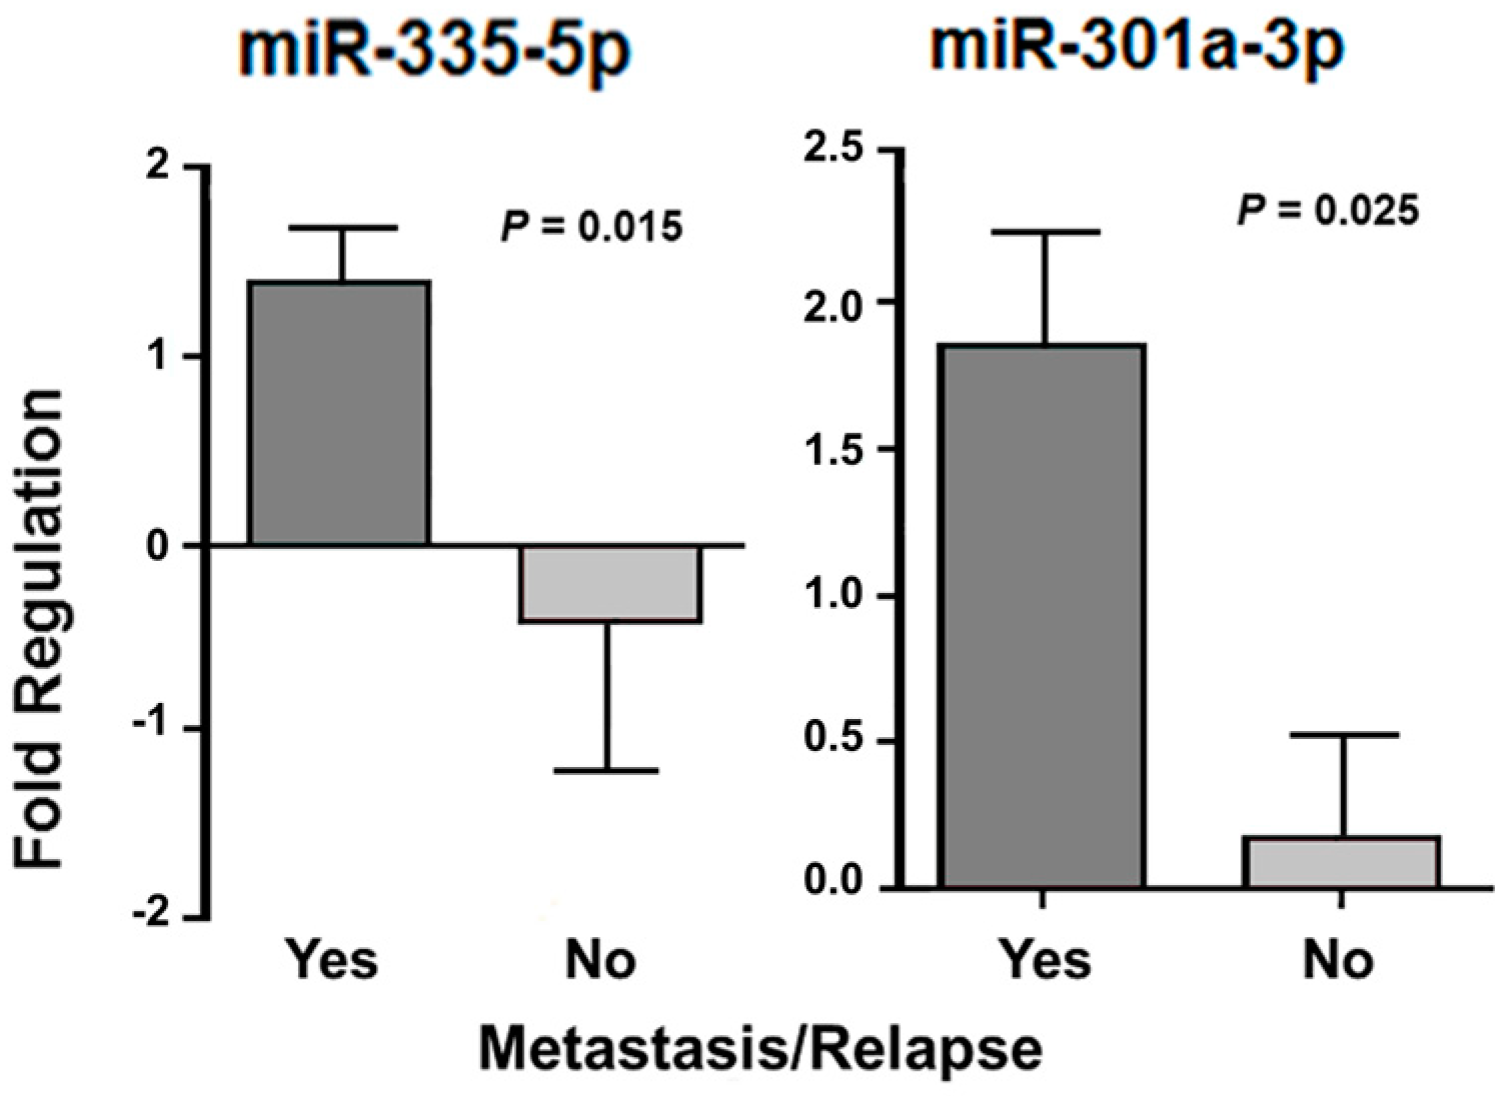
| Presence of relapse | 148a-3p a 29b-3p a 301a-3p b 29a-3p a 144-3p b | 0.021 0.008 0.027 0.040 0.020 | 335-5p b 96-5p b 378a-3p b 130a-3p b 183-5p b 134-5p b 7-5p b 128-3p b 18a-5p b 203a-3p b 32-5p b | 0.050 0.008 0.028 0.046 0.010 0.016 0.040 0.026 0.033 0.020 0.008 | 301a-3p b | 0.041 |
| 127-5p b | 0.045 | |||||
| Presence of metastasis | 140-5p a 193b-3p a let-7i-5p a 27b-3p a 143-3p a 125b-5p a | 0.002 0.002 0.034 0.029 0.004 0.025 | - | - | 193b-3p b 210-3p b | 0.015 0.044 |
| Stage I | - | - | - | - | - | - |
| Stage II | - | - | 335-5p a,* 218-5p a | 0.001 0.014 | 23b-3p a | 0.017 |
| Stage IV | - | - | - | - | 7-5p b | 0.014 |
| High histological grade | let-7a-5p a 125a-5p b 222-3p b 148b-3p b 92a-3p b let-7b-5p a 205-5p b 20a-5p b 30c-5p b let-7g-5p a let-7c-5p a let-7e-5p a let-7f-5p b 218-5p b,* 100-5p b 155-5p b 1-3p b 191-5p b let-7d-5p b 15b-5p b 98-5p b 25-3p b 128-3p b 143-3p b 19a-3p b 23b-3p b 16-5p b 17-5p b 18a-5p b 27b-3p b | 0.008 0.047 0.040 0.050 0.029 0.009 0.010 0.008 0.031 0.005 0.029 0.014 0.045 0.001 0.044 0.012 0.011 0.024 0.010 0.002 0.002 0.010 0.041 0.047 0.031 0.017 0.033 0.034 0.049 0.020 | 184 a,* | 0.001 | - | - |
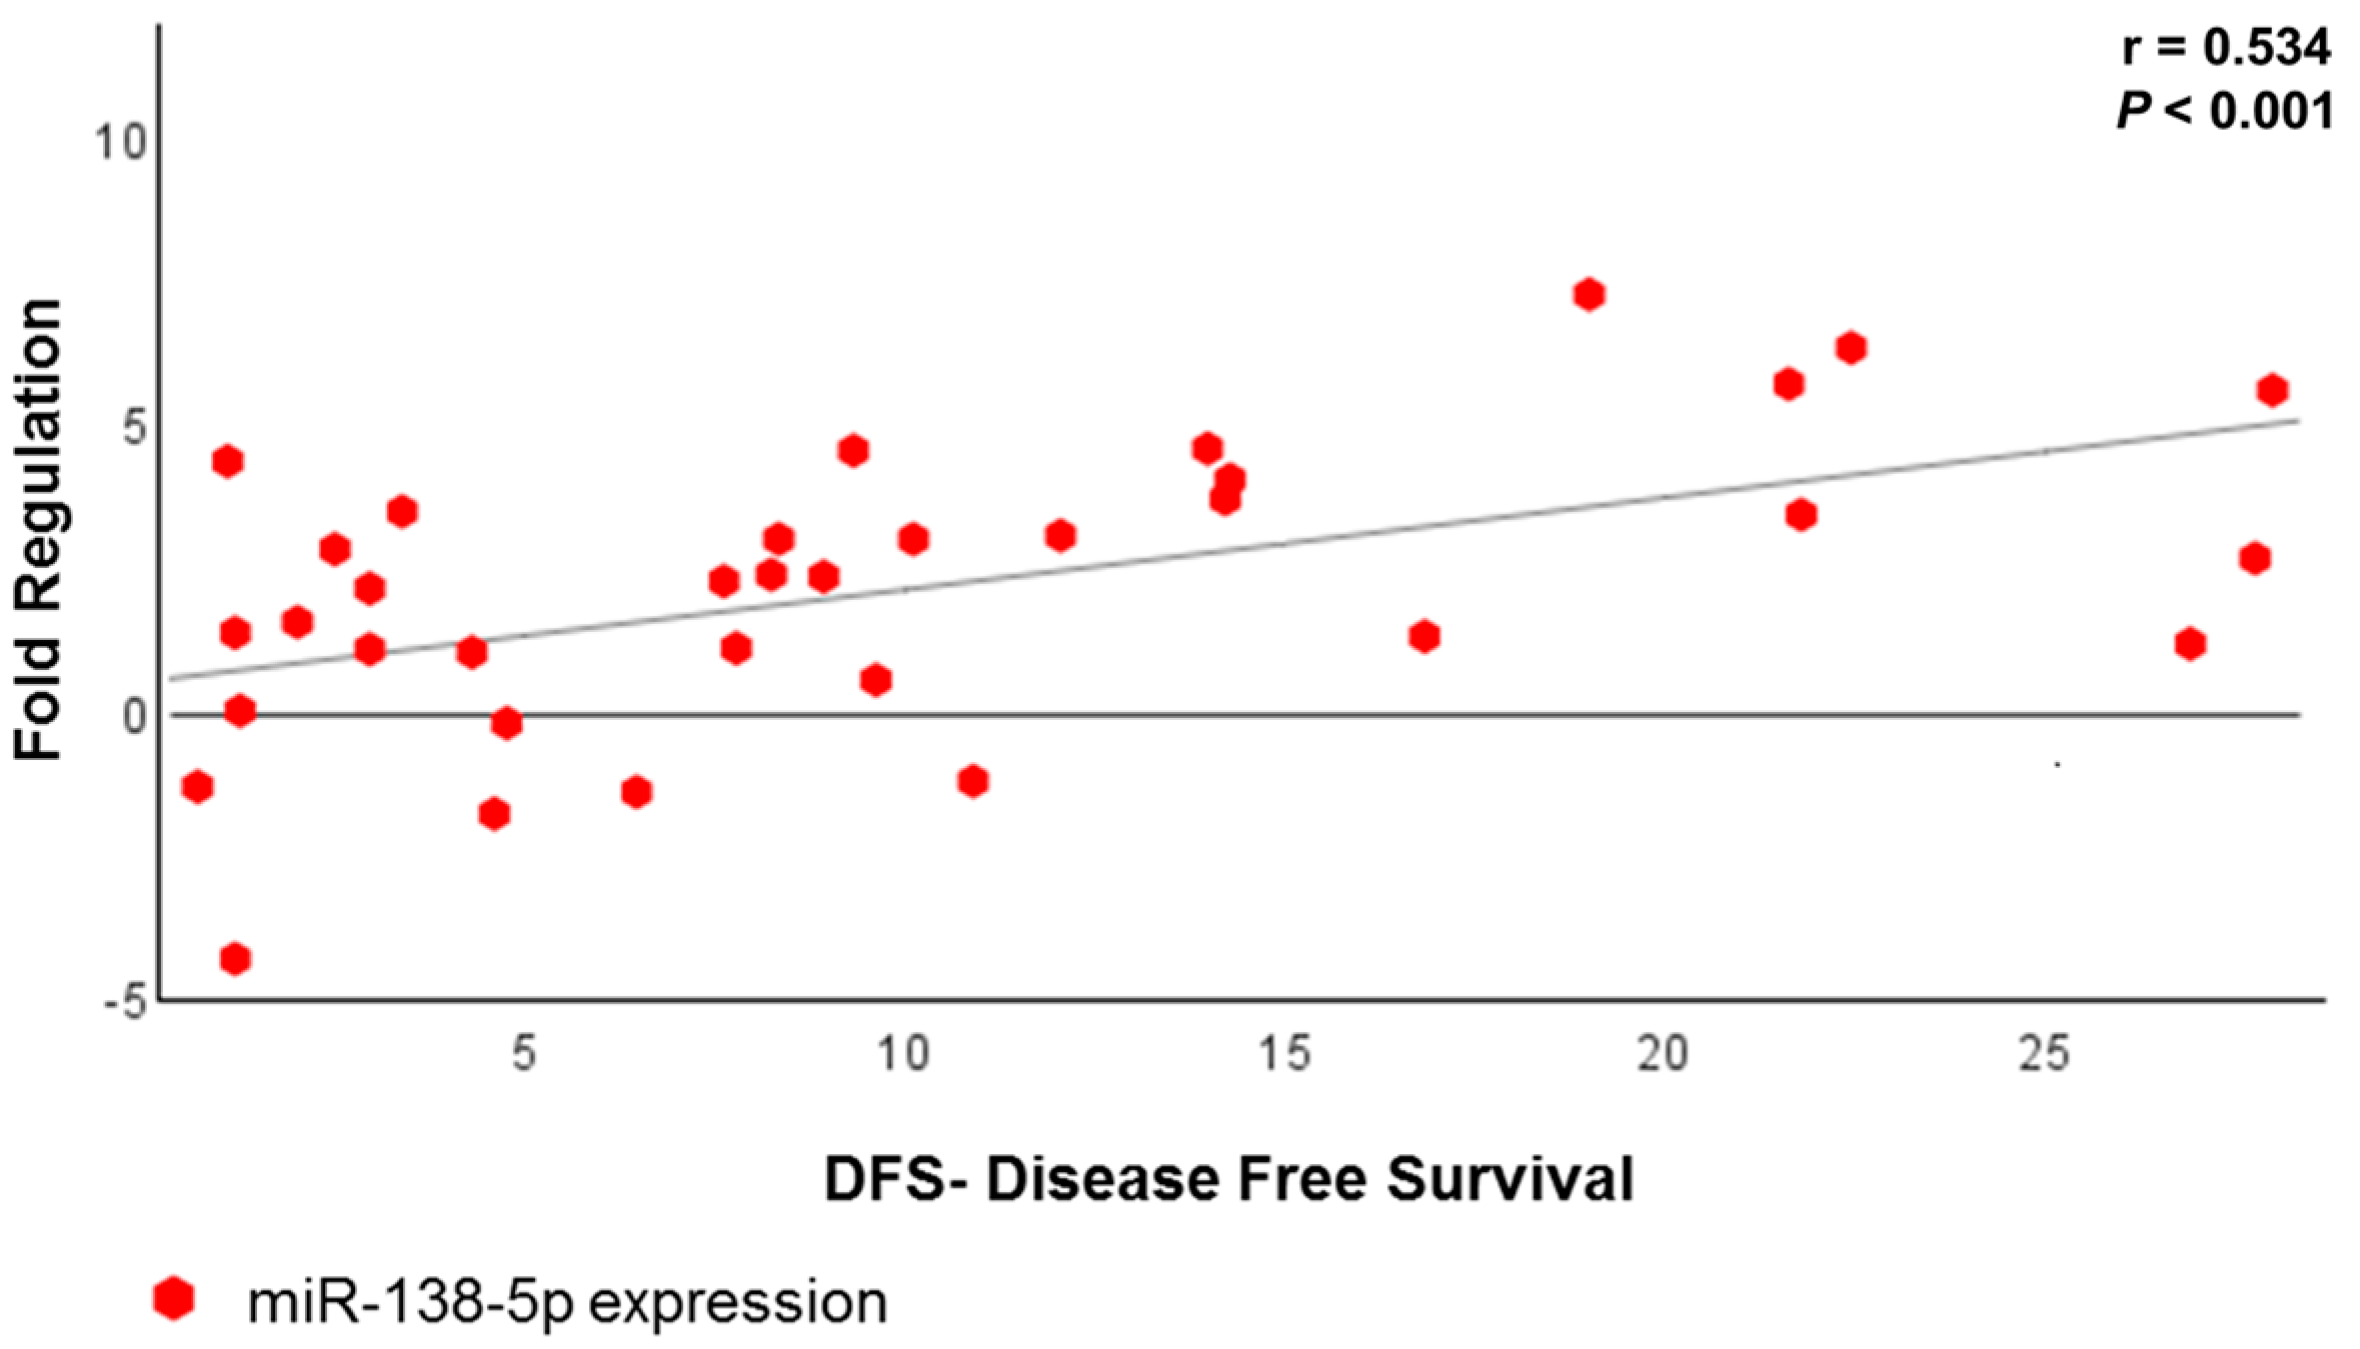
| miRNA | r * | p |
|---|---|---|
| miR-146b-5p | 0.358 | 0.032 |
| miR-218-5p | 0.331 | 0.048 |
| miR-138-5p | 0.534 | <0.001 |
© 2018 by the authors. Licensee MDPI, Basel, Switzerland. This article is an open access article distributed under the terms and conditions of the Creative Commons Attribution (CC BY) license (http://creativecommons.org/licenses/by/4.0/).
Share and Cite
Gonzalez dos Anjos, L.; De Almeida, B.C.; Gomes de Almeida, T.; Mourão Lavorato Rocha, A.; De Nardo Maffazioli, G.; Soares, F.A.; Werneck da Cunha, I.; Baracat, E.C.; Carvalho, K.C. Could miRNA Signatures be Useful for Predicting Uterine Sarcoma and Carcinosarcoma Prognosis and Treatment? Cancers 2018, 10, 315. https://doi.org/10.3390/cancers10090315
Gonzalez dos Anjos L, De Almeida BC, Gomes de Almeida T, Mourão Lavorato Rocha A, De Nardo Maffazioli G, Soares FA, Werneck da Cunha I, Baracat EC, Carvalho KC. Could miRNA Signatures be Useful for Predicting Uterine Sarcoma and Carcinosarcoma Prognosis and Treatment? Cancers. 2018; 10(9):315. https://doi.org/10.3390/cancers10090315
Chicago/Turabian StyleGonzalez dos Anjos, Laura, Bruna Cristine De Almeida, Thais Gomes de Almeida, André Mourão Lavorato Rocha, Giovana De Nardo Maffazioli, Fernando Augusto Soares, Isabela Werneck da Cunha, Edmund Chada Baracat, and Katia Candido Carvalho. 2018. "Could miRNA Signatures be Useful for Predicting Uterine Sarcoma and Carcinosarcoma Prognosis and Treatment?" Cancers 10, no. 9: 315. https://doi.org/10.3390/cancers10090315