Histone Deacetylase Inhibitors Impair Vasculogenic Mimicry from Glioblastoma Cells

 , ,
, ,  ,
,
Abstract
:
1. Introduction
2. Results
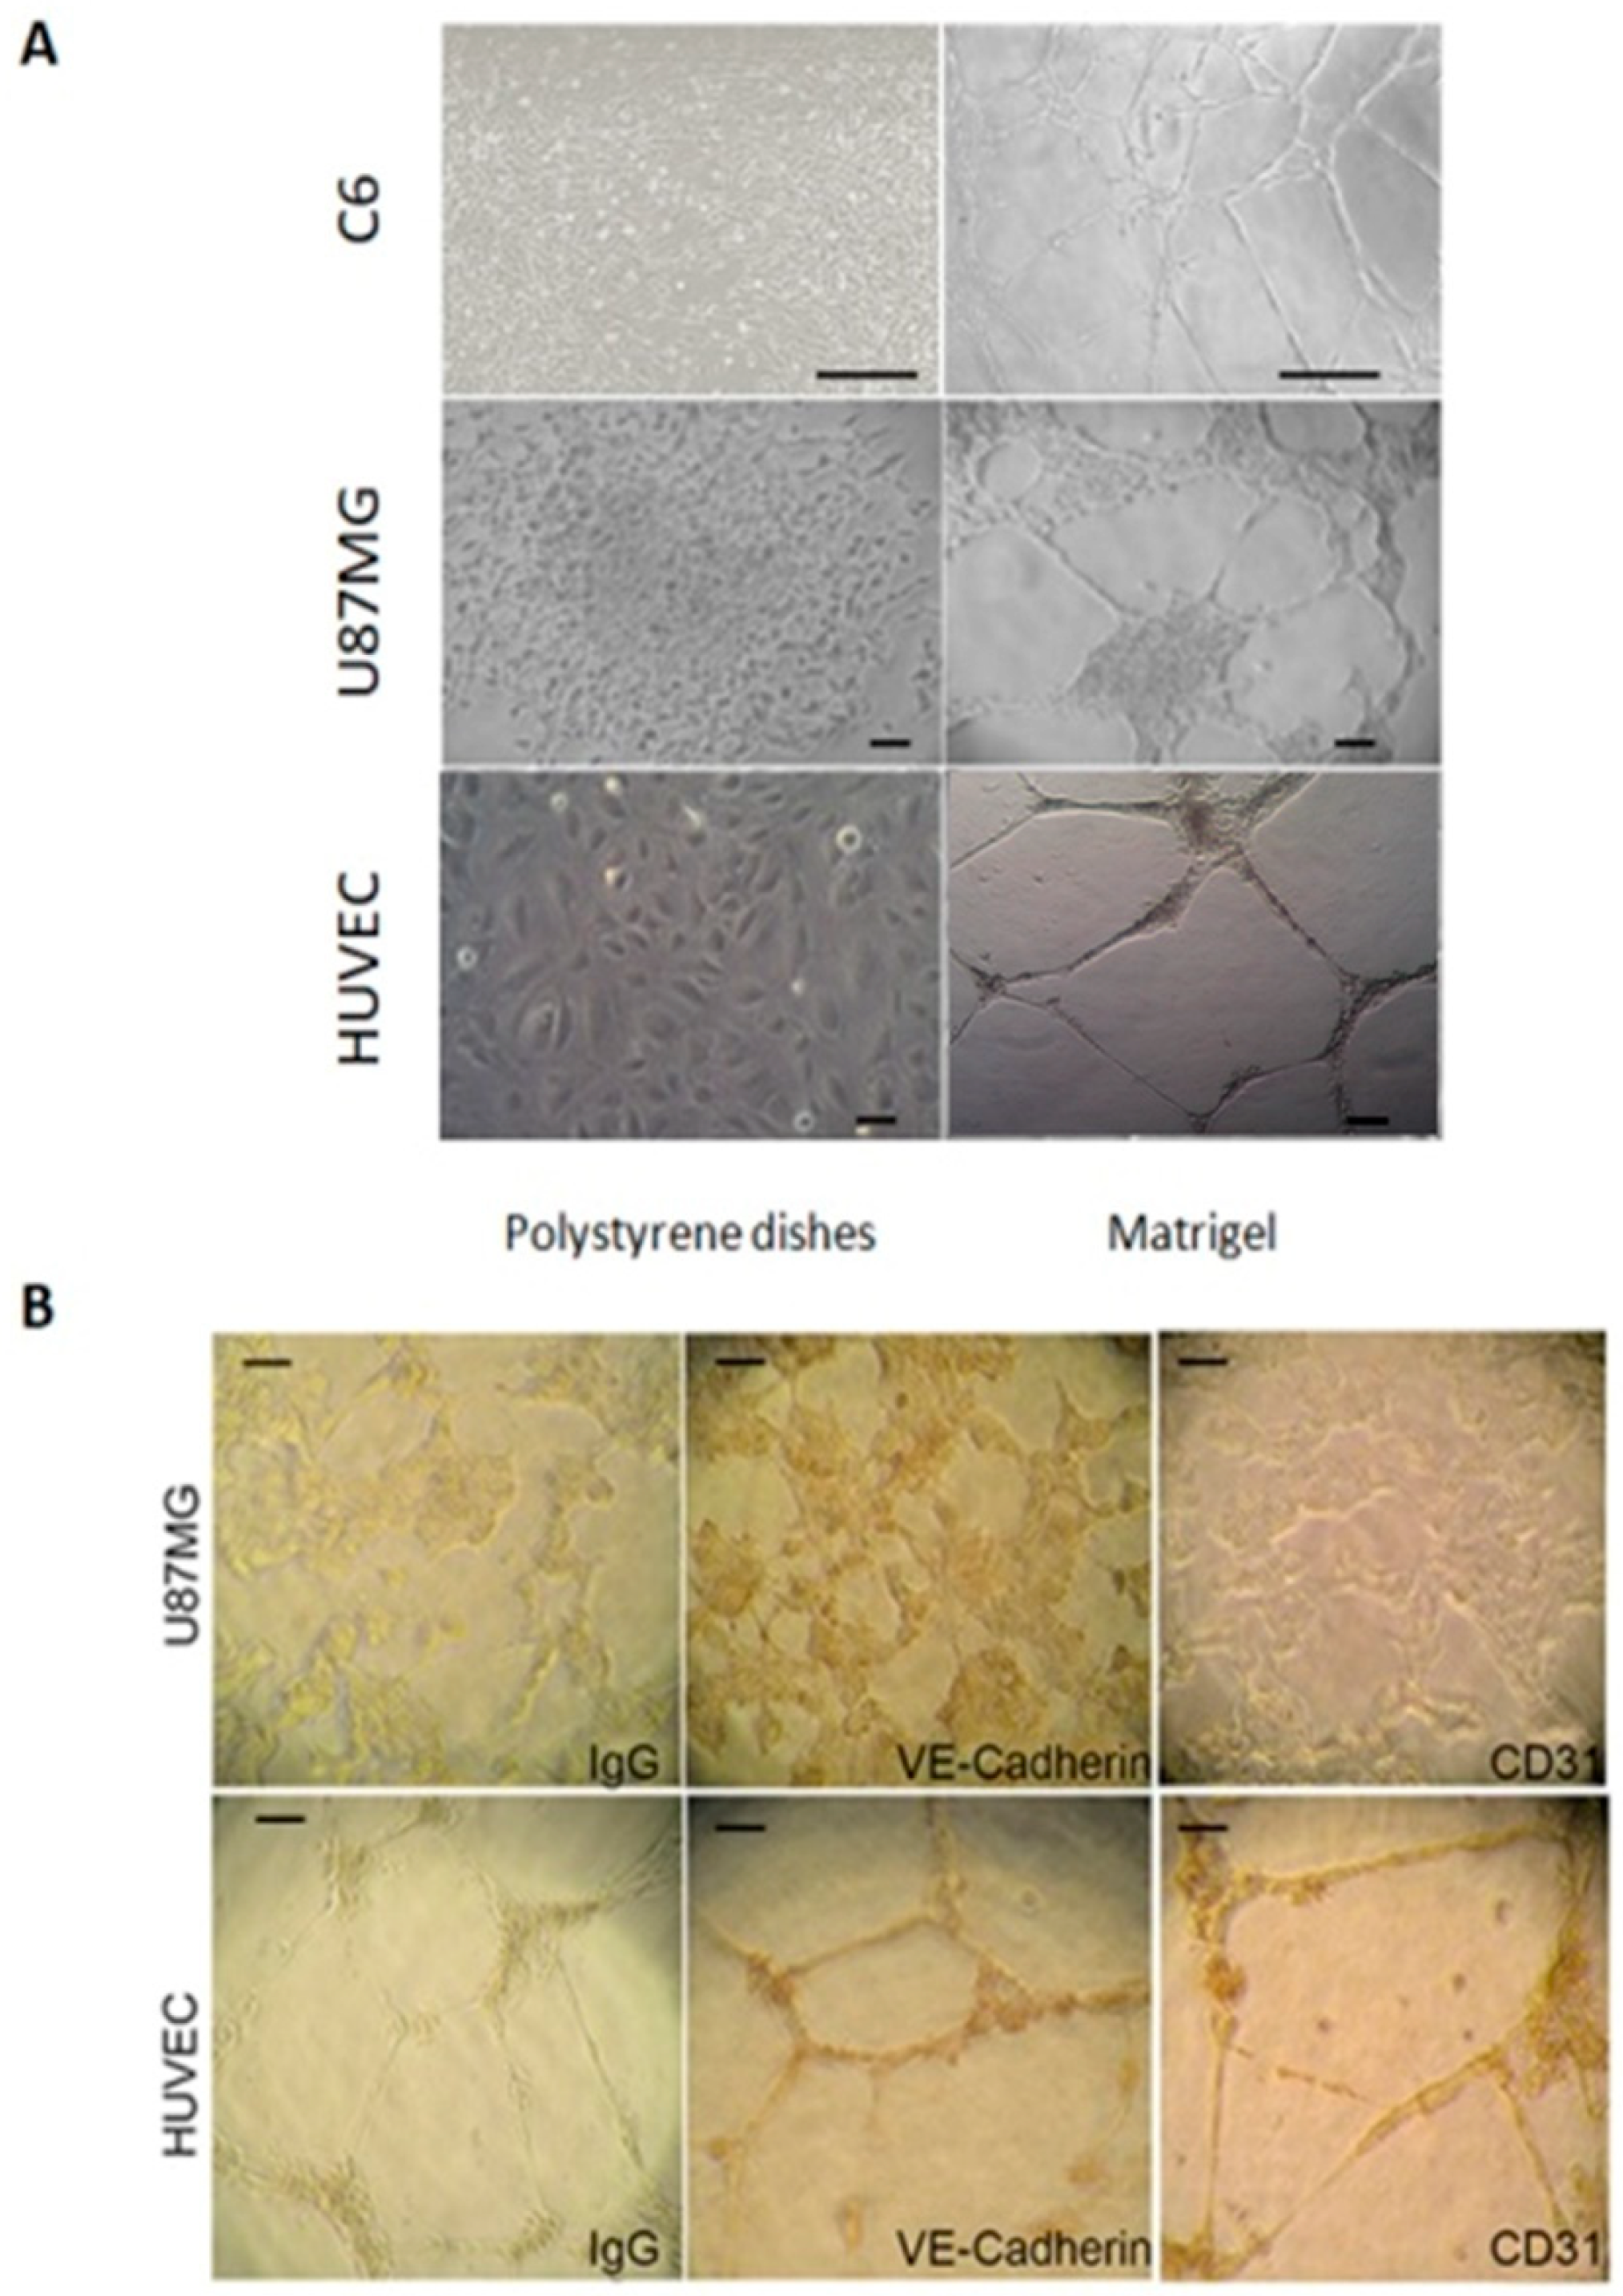
2.1. U87MG and C6 Cells Are Able to form Tube-Like Structures on Extracellular Matrix
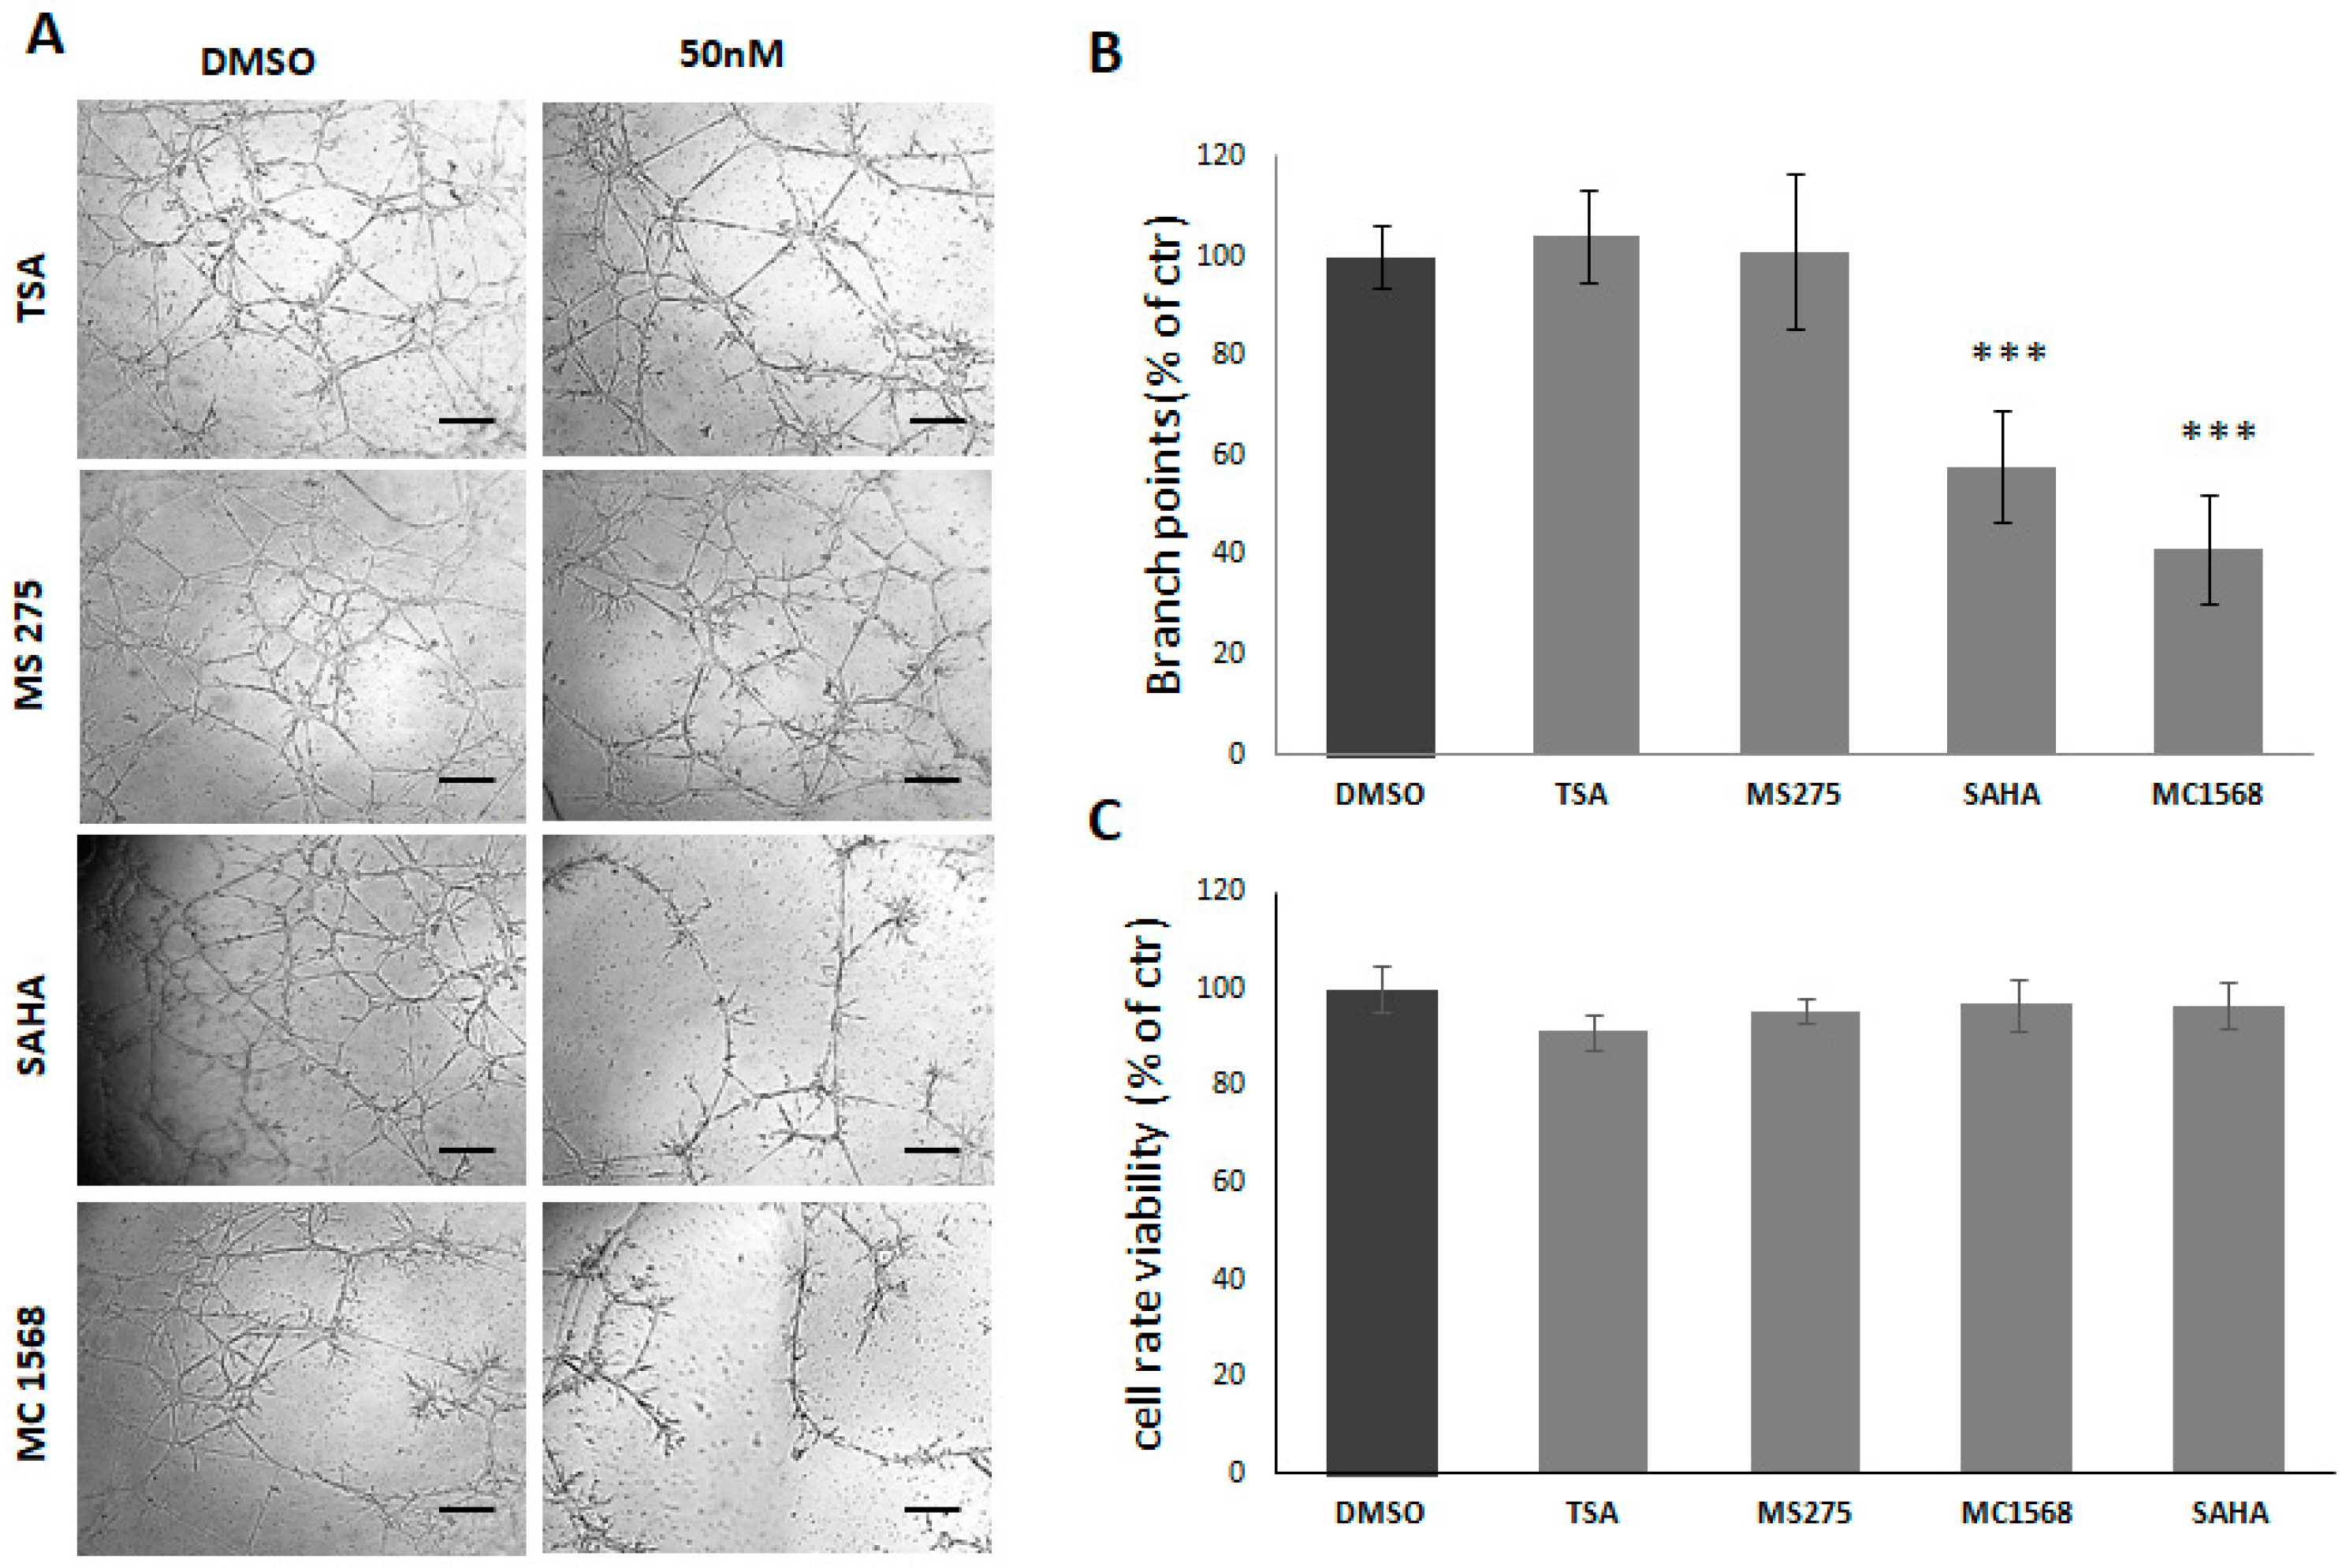
2.2. HDACi Reduce Tube Formation by C6 and U87 Glioma Cell Lines
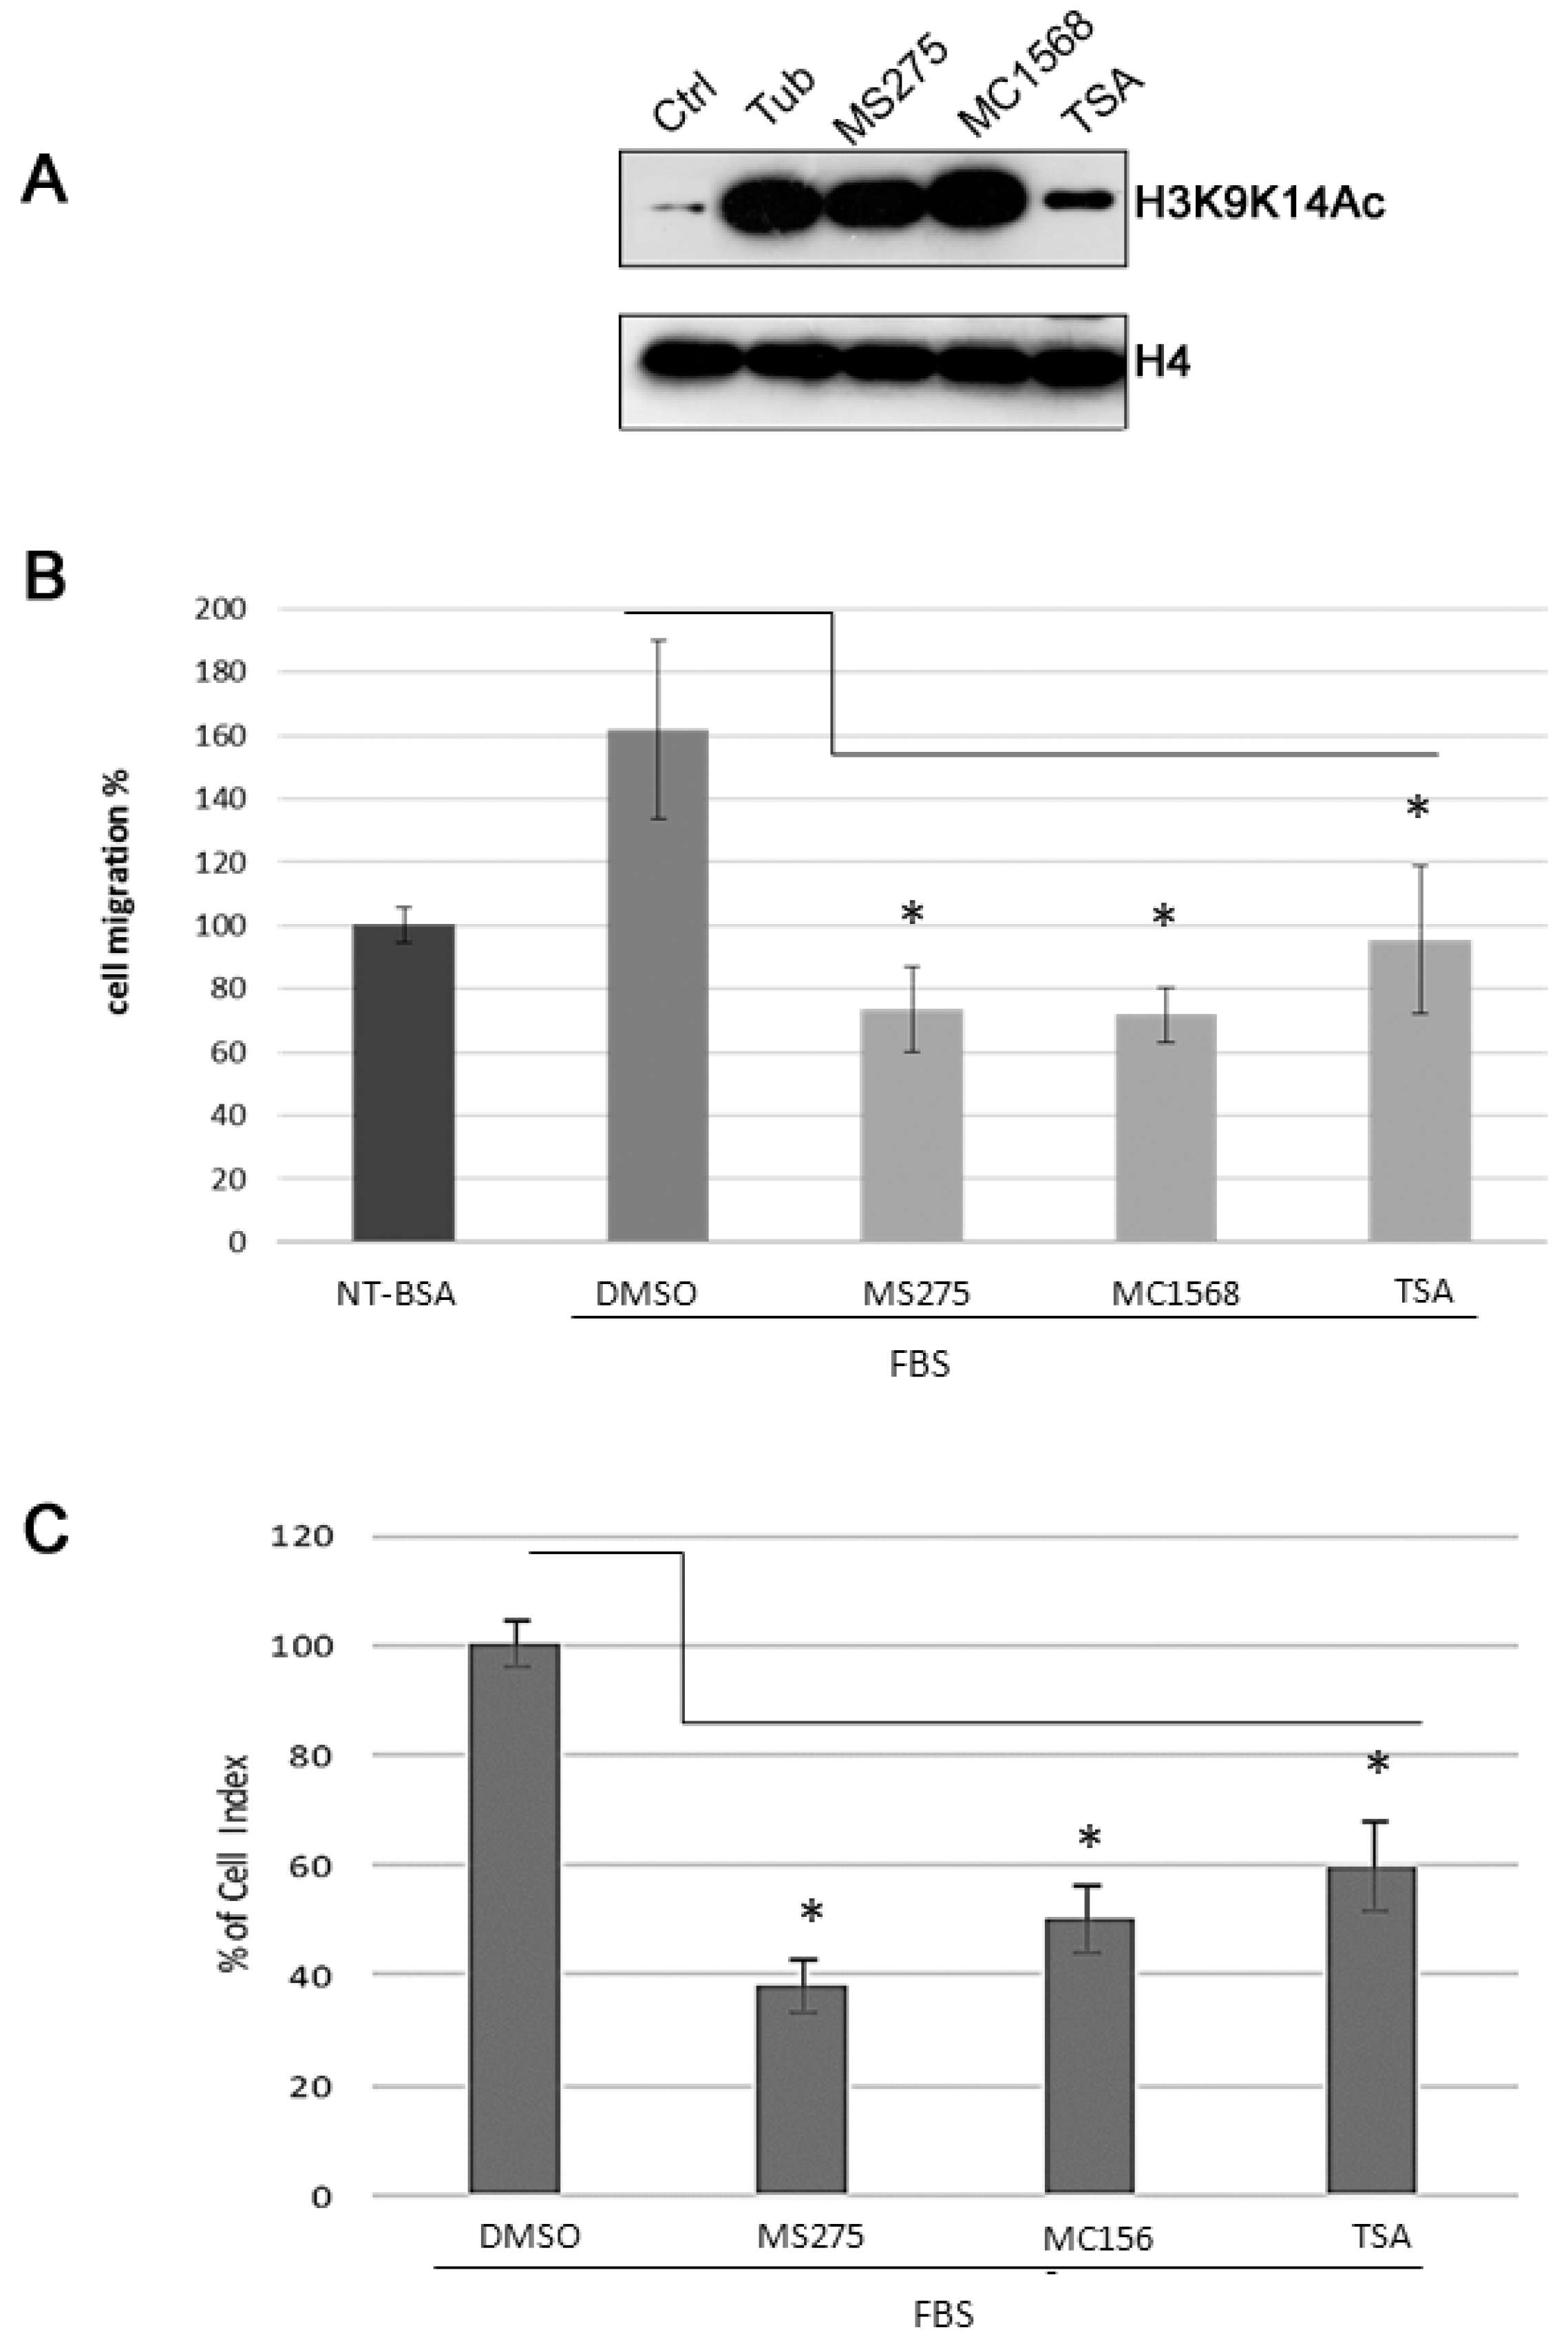
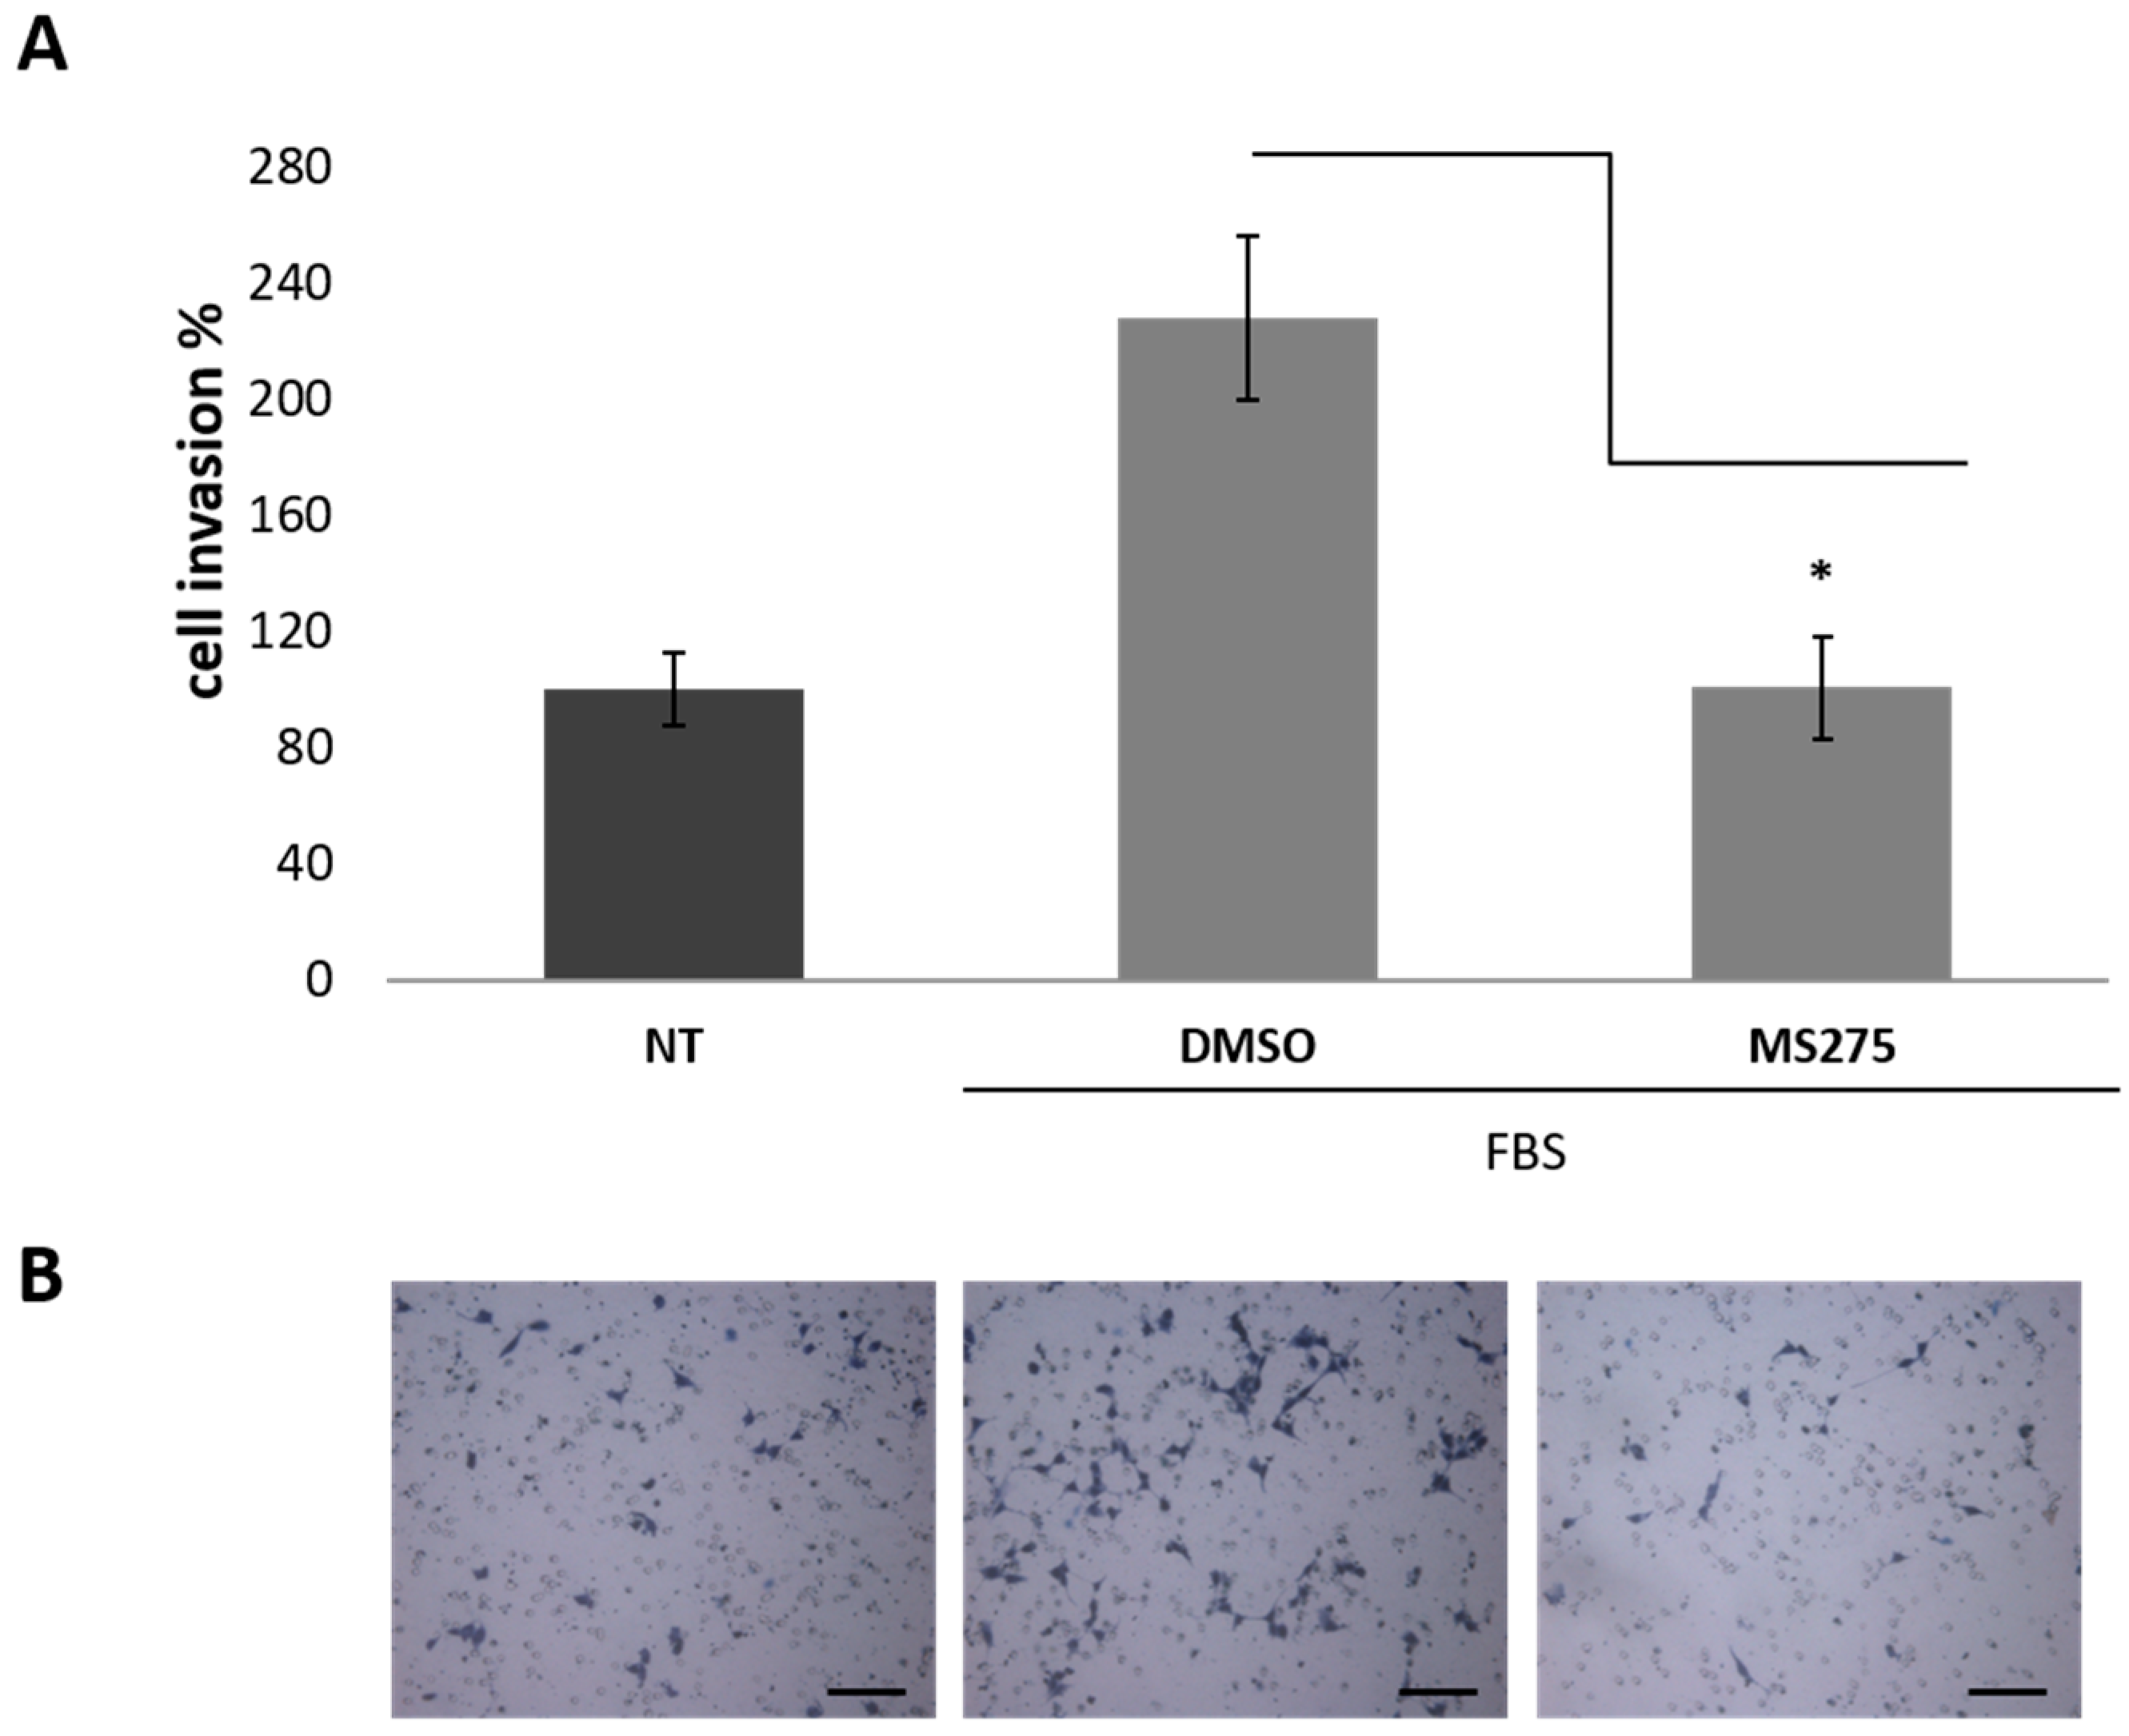
2.3. TSA, MS275, MC1568 HDAC Inhibitors Decrease Cell Motility of Human U87MG Cells
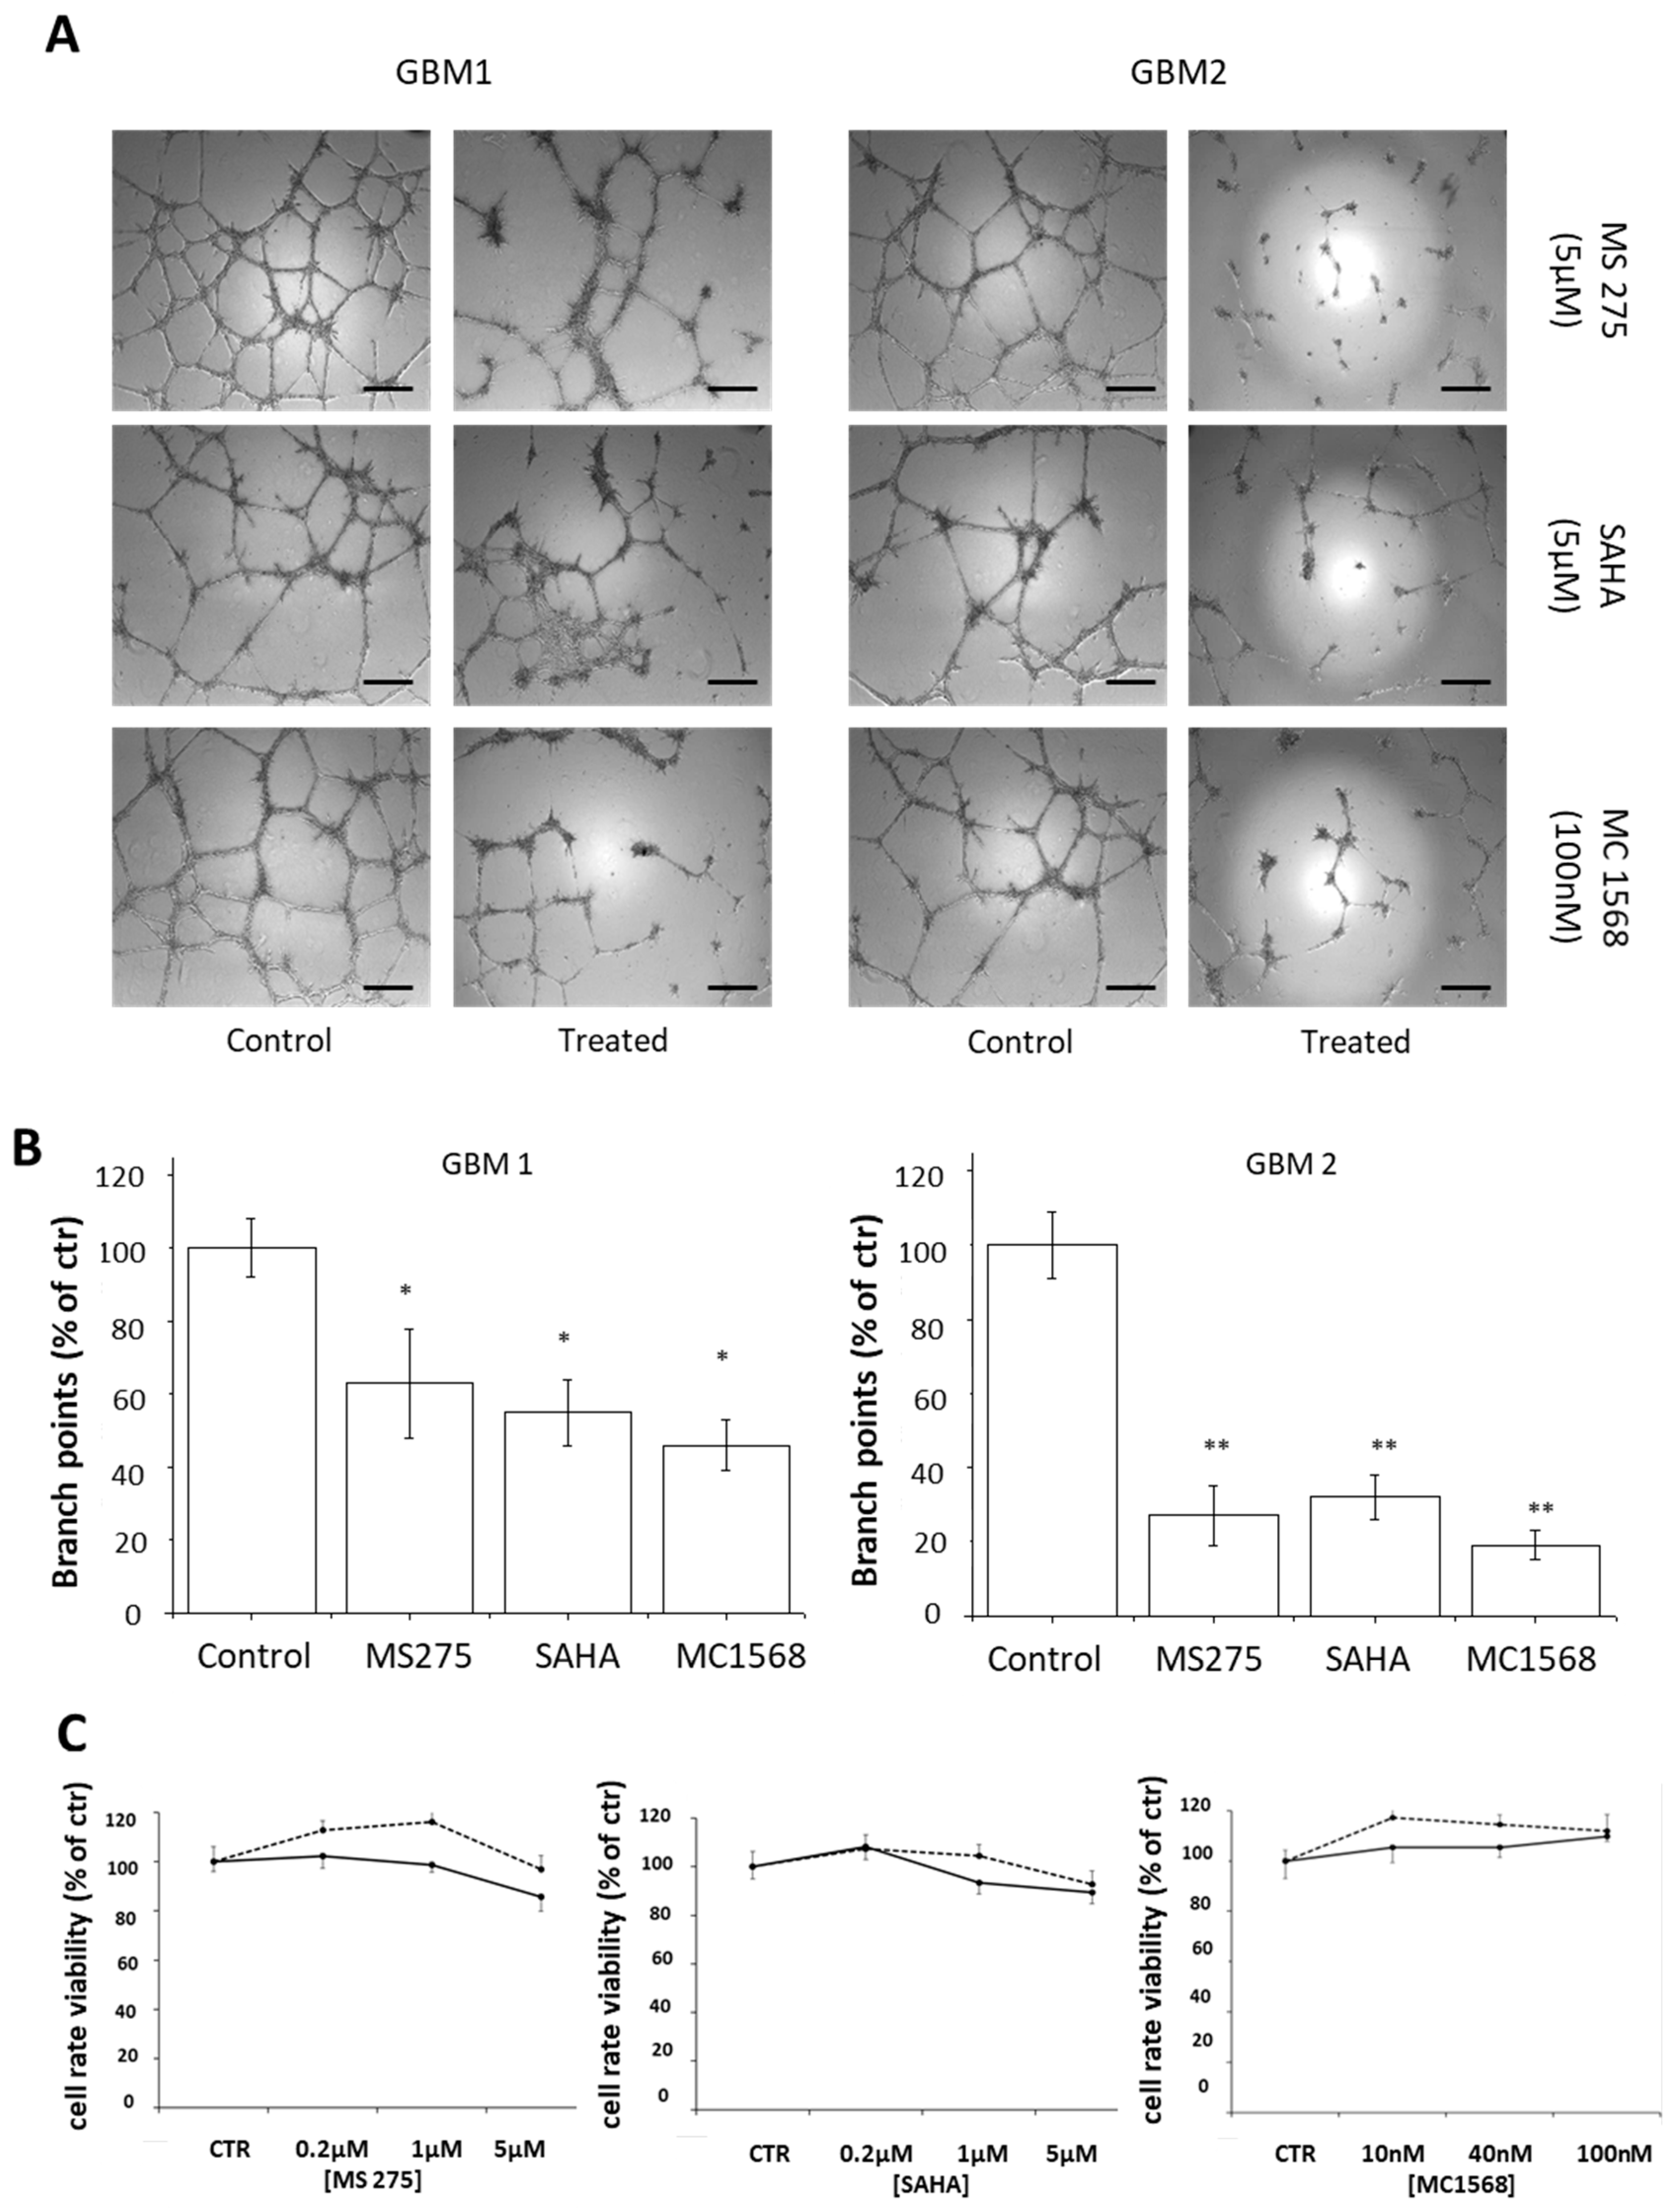
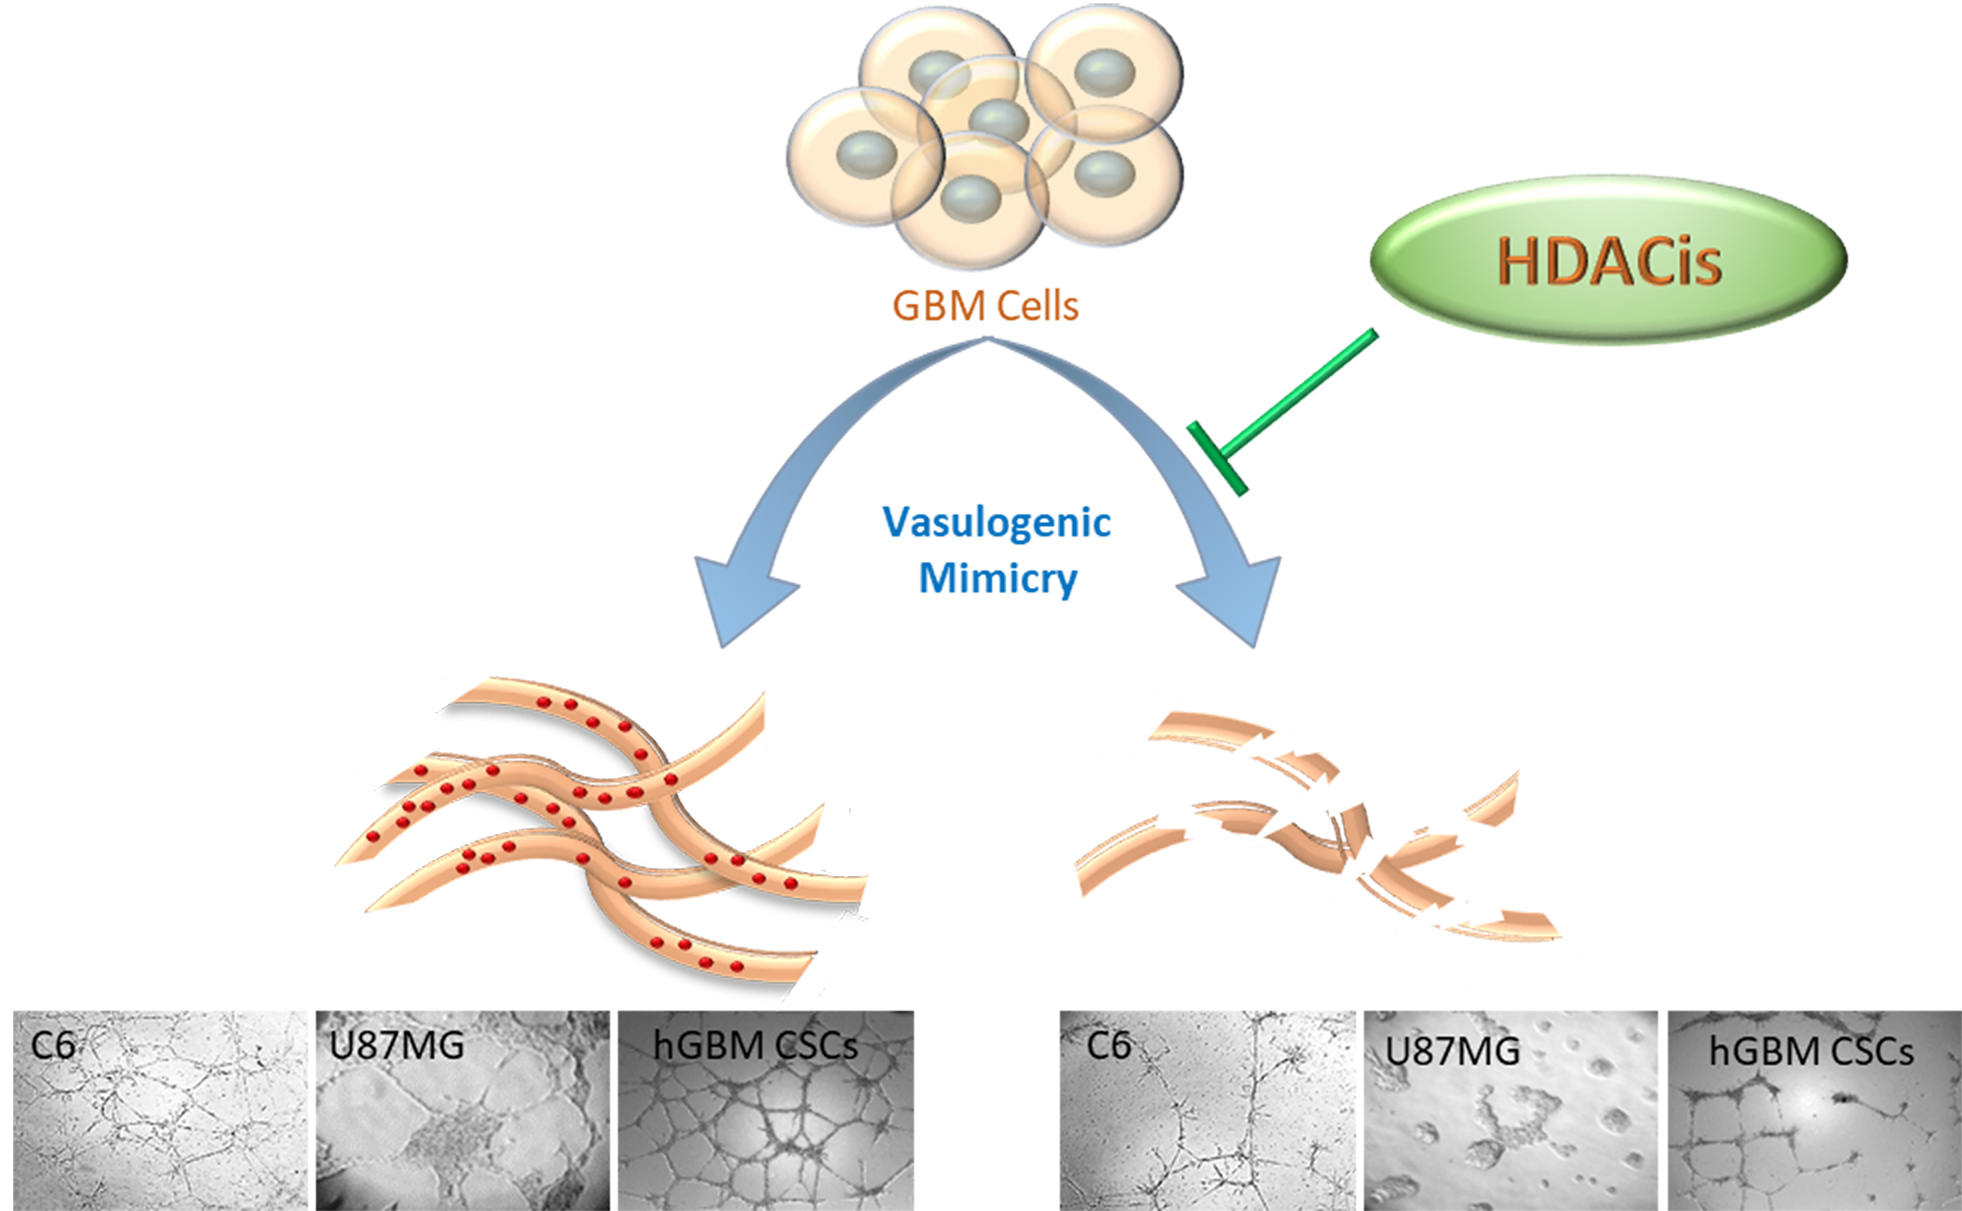
2.4. HDACis Inhibit Vasculogenic Mimicry of Human GBM CSCs
3. Discussion
4. Materials and Methods
4.1. Cell Lines Cultures
4.2. Human GBM Specimens and CSC Cultures
4.3. Drug Preparation and Cells Treatment
4.4. MTT Assay
4.5. In vitro Tube Formation Assay
4.6. Immunohistochemistry
4.7. Histone Extractin and Western blotting Analysis
4.8. Boyden Chamber Migration Assay
4.9. Real-Time Migration Monitoring
4.10. Invasion Assays
4.11. Statistical Analysis
5. Conclusions
Author Contributions
Funding
Conflicts of Interest
References
- WHO, IARC. World Cancer Report. 2008. Available online: http://publications.iarc.fr/Non-Series-Publications/World-Cancer-Reports (accessed on 10 March 2019).
- Hanif, F.; Muzaffar, K.; Perveen, K.; Malhi, S.M.; Simjee, S. Glioblastoma Multiforme: A Review of its Epidemiology and Pathogenesis through Clinical Presentation and Treatment. Asian Pac. J. Cancer Prev. 2017, 18, 3–9. [Google Scholar] [CrossRef] [PubMed]
- Louis, D.N.; Perry, A.; Reifenberger, G.; von Deimling, A.; Figarella-Branger, D.; Cavenee, W.K.; Ohgaki, H.; Wiestler, O.D.; Kleihues, P.; Ellison, D.W. The 2016 World Health Organization Classification of Tumors of the Central Nervous System: a summary. Acta Neuropathol. 2016, 131, 803–820. [Google Scholar] [CrossRef] [PubMed] [Green Version]
- Stupp, R.; Mason, W.P.; van den Bent, M.J.; Weller, M.; Fisher, B.; Taphoorn, M.J.; Belanger, K.; Brandes, A.A.; Marosi, C.; Bogdahn, U.; et al. Radiotherapy plus concomitant and adjuvant temozolomide for glioblastoma. N. Engl. J. Med. 2005, 352, 987–996. [Google Scholar] [CrossRef] [PubMed]
- Furnari, F.B.; Fenton, T.; Bachoo, R.M.; Mukasa, A.; Stommel, J.M.; Stegh, A.; Hahn, W.C.; Ligon, K.L.; Louis, D.N.; Brennan, C.; et al. Malignant astrocytic glioma: Genetics, biology, and paths to treatment. Genes Dev. 2007, 21, 2683–2710. [Google Scholar] [CrossRef] [PubMed]
- Delgado-López, P.D.; Corrales-García, E.M. Survival in glioblastoma: A review on the impact of treatment mdalities. Clin. Transl. Oncol. 2016, 18, 1062–1071. [Google Scholar] [CrossRef]
- Ruggiero, A.; Rizzo, D.; Attinà, G.; Lazzareschi, I.; Maurizi, P.; Ridola, V. Phase I study of temozolomide combined with oral etoposide in children with malignant glial tumors. J. Neurooncol. 2013, 113, 513–518. [Google Scholar] [CrossRef]
- Zustovich, F.; Lombardi, G.; Della Puppa, A.; Rotilio, A.; Scienza, R.; Pastorelli, D. A phase II study of cisplatin and temozolomide in heavily pre-treated patients with temozolomide-refractory high-grade malignant glioma. Anticancer Res. 2009, 29, 4275–4279. [Google Scholar]
- Holmes, D. Trying to unravel the mysteries of chemobrain. Lancet Neurol. 2013, 12, 533–534. [Google Scholar] [CrossRef]
- Gong, X.; Schwartz, P.H.; Linskey, M.E.; Bota, D.A. Neural stem/progenitors and glioma stem-like cells have differential sensitivity to chemotherapy. Neurology 2011, 76, 1126–1134. [Google Scholar] [CrossRef] [PubMed] [Green Version]
- Singh, S.K.; Clarke, I.D.; Terasaki, M.; Bonn, V.E.; Hawkins, C.; Squire, J.; Dirks, P.B. Identification of a cancer stem cell in human brain tumors. Cancer Res. 2003, 63, 5821–5828. [Google Scholar]
- Singh, S.K.; Hawkins, C.; Clarke, I.D.; Squire, J.A.; Bayani, J.; Hide, T.; Henkelman, R.M.; Cusimano, M.D.; Dirks, P.B. Identification of human brain tumour initiating cells. Nature 2004, 432, 396–401. [Google Scholar] [CrossRef]
- Stopschinski, B.E.; Beier, C.P.; Beier, D. Glioblastoma cancer stem cells—From concept to clinical application. Cancer Lett. 2013, 338, 32–40. [Google Scholar] [CrossRef]
- Lathia, J.D.; Mack, S.C.; Mulkearns-Hubert, E.E.; Valentim, C.L.L.; Rich, J.N. Cancer stem cells in glioblastoma. Genes Dev. 2015, 29, 1203–1217. [Google Scholar] [CrossRef] [Green Version]
- Bao, S.; Wu, Q.; Mclendon, R.E.; Hao, Y.; Shi, Q.; Shi, Q.; Hjelmeland, A.B.; Dewhirst, M.W.; Bigner, D.D.; Rich, J.N.; et al. Glioma stem cells promote radioresistance by preferential activation of the DNA damage response. Nature 2006, 444, 756–760. [Google Scholar] [CrossRef] [PubMed]
- Liu, G.; Yuan, X.; Zeng, Z.; Tunici, P.; Ng, H.; Abdulkadir, I.R.; Lu, L.; Irvin, D.; Black, K.L.; Yu, J.S. Analysis of gene expression and chemoresistance of CD133+ cancer stem cells in glioblastoma. Mol. Cancer 2006, 5, 67. [Google Scholar] [CrossRef] [PubMed]
- Eramo, A.; Ricci-Vitiani, L.; Zeuner, A.; Pallini, R.; Lotti, F.; Sette, G.; Pilozzi, E.; Larocca, L.M.; Peschle, C.; De Maria, R. Chemotherapy resistance of glioblastoma stem cells. Cell Death Differ. 2006, 13, 1238–1241. [Google Scholar] [CrossRef] [PubMed] [Green Version]
- Beier, D.; Schulz, J.B.; Beier, C.P. Chemoresistance of glioblastoma cancer stem cells—Much more complex than expected. Mol. Cancer 2011, 10, 128. [Google Scholar] [CrossRef] [PubMed]
- Hillen, F.; Griffioen, A.W. Tumour vascularization: Sprouting angiogenesis and beyond. Cancer Metastasis Rev. 2007, 26, 489–502. [Google Scholar] [CrossRef]
- Ausprunk, D.H.; Folkman, J. Migration and proliferation of endothelial cells in preformed and newly formed blood vessels during tumor angiogenesis. Microvasc. Res. 1977, 14, 53–65. [Google Scholar] [CrossRef]
- Ferrara, N.; Gerber, H.P.; LeCouter, J. The biology of VEGF and its receptors. Nat. Med. 2003, 9, 669–676. [Google Scholar] [CrossRef]
- Carmeliet, P. VEGF as a key mediator of angiogenesis in cancer. Oncology 2005, 69, 4–10. [Google Scholar] [CrossRef]
- Santarelli, J.G.; Udani, V.; Yung, Y.C.; Cheshier, S.; Wagers, A.; Brekken, R.A.; Weissman, I.; Tse, V. Incorporation of bone marrow-derived Flk-1-expressing CD34+ cells in the endothelium of tumor vessels in the mouse brain. Neurosurgery 2006, 59, 374–382. [Google Scholar] [CrossRef]
- Holash, J.; Maisonpierre, P.C.; Compton, D.; Boland, P.; Alexander, C.R.; Zagzag, D.; Yancopoulos, G.D.; Wiegand, S.J. Vessel cooption, regression, and growth in tumors mediated by angiopoietins and VEGF. Science 1999, 284, 1994–1998. [Google Scholar] [CrossRef]
- Dome, B.; Paku, S.; Somlai, B.; Timar, J. Vascularization of cutaneous melanoma involves vessel co-option and has clinical significance. J. Pathol. 2002, 197, 355–362. [Google Scholar] [CrossRef]
- Patan, S.; Munn, L.L.; Jain, R.K. Intussusceptive microvascular growth in a human colon adenocarcinoma xenograft: A novel mechanism of tumor angiogenesis. Microvasc. Res. 1996, 51, 260–272. [Google Scholar] [CrossRef]
- Burri, P.H.; Hlushchuk, R.; Djonov, V. Intussusceptive angiogenesis: Its emergence, its characteristics, and its significance. Dev. Dyn. 2004, 231, 474–488. [Google Scholar] [CrossRef]
- Maniotis, A.J.; Folberg, R.; Hess, A.; Seftor, E.A.; Gardner, L.M.; Pe’er, J.; Trent, J.M.; Meltzer, P.S.; Hendrix, M.J. Vascular channel formation by human melanoma cells in vivo and in vitro: vasculogenic mimicry. Am. J. Pathol. 1999, 155, 739–752. [Google Scholar] [CrossRef]
- Bao, S.; Wu, Q.; Sathornsumetee, S.; Hao, Y.; Li, Z.; Hjelmeland, A.B.; Shi, Q.; McLendon, R.E.; Bigner, D.D.; Rich, J.N. Stem cell-like glioma cells promote tumor angiogenesis through vascular endothelial growth factor. Cancer Res. 2006, 66, 7843–7848. [Google Scholar] [CrossRef]
- Ricci-Vitiani, L.; Pallini, R.; Biffoni, M.; Todaro, M.; Invernici, G.; Cenci, T.; Maira, G.; Parati, E.A.; Stassi, G.; Larocca, L.M.; et al. Tumor vascularization via endothelial differentiation of glioblastoma stem-like cells. Nature 2010, 468, 824–828. [Google Scholar] [CrossRef]
- Wang, R.; Chadalavada, K.; Wilshire, J.; Kowalik, U.; Hovinga, K.E.; Geber, A.; Fligelman, B.; Leversha, M.; Brennan, C.; Tabar, V. Glioblastoma stem-like cells give rise to tumour endothelium. Nature 2010, 468, 829–833. [Google Scholar] [CrossRef]
- El Hallani, S.; Boisselier, B.; Peglion, F.; Rousseau, A.; Colin, C.; Idbaih, A.; Marie, Y.; Mokhtari, K.; Thomas, J.L.; Eichmann, A.; et al. A new alternative mechanism in glioblastoma vascularization: tubular vasculogenic mimicry. Brain 2010, 133, 973–982. [Google Scholar] [CrossRef] [Green Version]
- Scully, S.; Francescone, R.; Faibish, M.; Bentley, B.; Taylor, S.L.; Oh, D.; Schapiro, R.; Moral, L.; Yan, W.; Shao, R. Transdifferentiation of glioblastoma stem-like cells into mural cells drives vasculogenic mimicry in glioblastomas. J. Neurosci. 2012, 32, 12950–12960. [Google Scholar] [CrossRef] [PubMed]
- Yao, X.H.; Ping, Y.F.; Bian, X.W. Contribution of cancer stem cells to tumor vasculogenic mimicry. Protein Cell 2011, 2, 266–272. [Google Scholar] [CrossRef] [PubMed] [Green Version]
- Angara, K.; Borin, T.F.; Arbab, A.S. Vascular Mimicry: A Novel Neovascularization Mechanism Driving Anti-Angiogenic Therapy (AAT) Resistance in Glioblastoma. Transl. Oncol. 2017, 10, 650–660. [Google Scholar] [CrossRef] [PubMed]
- Vredenburgh, J.J.; Desjardins, A.; Herndon, J.E.; Marcello, J.; Reardon, D.A.; Quinn, J.A.; Rich, J.N.; Sathornsumetee, S.; Gururangan, S.; Sampson, J.; et al. Bevacizumab plus irinotecan in recurrent glioblastoma multiform. J. Clin. Oncol. 2007, 25, 4722–4729. [Google Scholar] [CrossRef]
- Kreisl, T.N.; Kim, L.; Moore, K.; Duic, P.; Royce, C.; Quinn, J.A.; Rich, J.N.; Sathornsumetee, S.; Gururangan, S.; Sampson, J.; et al. Phase II trial of single-agent bevacizumab followed by bevacizumab plus irinotecan at tumor progression in recurrent glioblastoma. J. Clin. Oncol. 2009, 27, 740–745. [Google Scholar] [CrossRef]
- Arbab, A.S.; Jain, M.; Achyut, B.R. Vascular Mimicry: The Next Big Glioblastoma Target. Biochem. Physiol. 2015, 4, e410. [Google Scholar] [CrossRef]
- Sun, B.; Zhang, D.; Zhang, S.; Zhang, W.; Guo, H.; Zhao, X. Hypoxia influences vasculogenic mimicry channel formation and tumor invasion-related protein expression in melanoma. Cancer Lett. 2007, 249, 188–197. [Google Scholar] [CrossRef] [PubMed]
- Nagarajan, R.P.; Costello, J.F. Epigenetic mechanisms in glioblastoma multiforme. Semin. Cancer Biol. 2009, 19, 188–197. [Google Scholar] [CrossRef]
- Ropero, S.; Esteller, M. The role of histone deacetylases (HDACs) in human cancer. Mol. Oncol. 2007, 1, 19–25. [Google Scholar] [CrossRef]
- Wang, Z.; Zang, C.; Cui, K.; Schones, D.E.; Barski, A.; Peng, W.; Zhao, K. Genome-wide mapping of HATs and HDACs reveals distinct functions in active and inactive genes. Cell 2009, 138, 1019–1031. [Google Scholar] [CrossRef]
- Xu, W.S.; Parmigian, R.B.; Marks, P.A. Histone deacetylase inhibitors: Molecular mechanisms of action. Oncogene 2007, 26, 5541–5552. [Google Scholar] [CrossRef] [PubMed]
- Minucci, S.; Pelicci, P.G. Histone deacetylase inhibitors and the promise of epigenetic (and more) treatments for cancer. Nat. Rev. Cancer 2006, 6, 38–51. [Google Scholar] [CrossRef] [Green Version]
- Bezecny, P. Histone deacetylase Inhibitors in glioblastoma: pre-clinical and clinical experience. Med. Oncol. 2014, 31, 985. [Google Scholar] [CrossRef]
- Gregoretti, I.V.; Lee, Y.M.; Goodson, H.V. Molecular evolution of the histone deacetylase family: functional implications of phylogenetic analysis. J. Mol. Biol. 2004, 338, 17–31. [Google Scholar] [CrossRef]
- Didonna, A.; Opal, P. The promise and perils of HDAC inhibitors in neurodegeneration. Ann. Clin. Transl. Neurol. 2015, 2, 79–101. [Google Scholar] [CrossRef] [PubMed]
- Qiao, L.; Liang, N.; Zhang, J.; Xie, J.; Liu, F.; Xu, D.; Yu, X.; Tian, Y. Advanced research on vasculogenic mimicry in cancer. J. Cell. Mol. Med. 2015, 19, 315–326. [Google Scholar] [CrossRef] [PubMed]
- Arnaoutova, I.; Kleinman, H.K. In vitro angiogenesis: Endothelial cell tube formation on gelled basement membrane extract. Nat. Protoc. 2010, 5, 628–635. [Google Scholar] [CrossRef] [PubMed]
- Francescone, R.A.; Faibish, M.; Shao, R.A. Matrigel-based tube formation assay to assess the vasculogenic activity of tumor cells. J. Vis. Exp. 2011, 55, 3040. [Google Scholar] [CrossRef] [PubMed]
- Hendrix, M.J.; Seftor, E.A.; Meltzer, P.S.; Gardner, L.M.; Hess, A.R.; Kirschmann, D.A.; Schatteman, G.C.; Seftor, R.E. Expression and functional significance of VE-cadherin in aggressive human melanoma cells: role in vasculogenic mimicry. Proc. Natl. Acad. Sci. USA 2001, 98, 8018–8023. [Google Scholar] [CrossRef]
- Even-Ram, S.; Yamada, K.M. Cell migration in 3D matrix. Curr. Opin. Cell Biol. 2005, 17, 524–532. [Google Scholar] [CrossRef]
- Svechnikova, I.; Almqvist, P.M.; Ekström, T.J. HDAC inhibitors effectively induce cell type-specific differentiation in human glioblastoma cell lines of different origin. Int. J. Oncol. 2008, 32, 821–827. [Google Scholar] [CrossRef]
- Sun, P.; Xia, S.; Lal, B.; Eberhart, C.G.; Quinones-Hinojosa, A.; Maciaczyk, J.; Matsui, W.; Dimeco, F.; Piccirillo, S.M.; Vescovi, A.L.; et al. DNER, an epigenetically modulated gene, regulates glioblastoma-derived neurosphere cell differentiation and tumor propagation. Stem Cells (Dayton Ohio) 2009, 27, 1473–1486. [Google Scholar] [CrossRef]
- Nawa, Y.; Kaneko, H.; Oda, M.; Tsubonoya, M.; Hiroi, T.; Gentile, M.T.; Colucci-D’Amato, L.; Takahashi, R.; Matsui, H. Functional characterization of the neuron-restrictive silencer element in the human tryptophan hydroxylase 2 gene expression. J. Neurochem. 2017, 142, 827–840. [Google Scholar] [CrossRef] [PubMed] [Green Version]
- Gentile, M.T.; Nawa, Y.; Lunardi, G.; Florio, T.; Matsui, H.; Colucci-D’Amato, L. Tryptophan hydroxylase 2 (TPH2) in a neuronal cell line: modulation by cell differentiation and NRSF/rest activity. J Neurochem. 2012, 123, 963–970. [Google Scholar] [CrossRef]
- Gentile, M.T.; Ciniglia, C.; Reccia, M.G.; Volpicelli, F.; Gatti, M.; Thellung, S.; Florio, T.; Melone, M.A.; Colucci-D’Amato, L. Ruta graveolens L. induces death of glioblastoma cells and neural progenitors, but not of neurons, via ERK 1/2 and AKT activation. PLoS ONE 2015, 10, e0118864. [Google Scholar] [CrossRef]
- Griffero, F.; Daga, A.; Marubbi, D.; Capra, M.C.; Melotti, A.; Pattarozzi, A.; Gatti, M.; Bajetto, A.; Porcile, C.; Barbieri, F.; et al. Different response of human glioma tumor-initiating cells to epidermal growth factor receptor kinase inhibitors. J. Biol. Chem. 2009, 284, 7138–7148. [Google Scholar] [CrossRef]
- Bajetto, A.; Porcile, C.; Pattarozzi, A.; Aceto, A.; Scotti, L.; Daga, A.; Barbieri, F.; Florio, T. Differential role of EGF and bFGF in human GBM-TIC proliferation: Relationship to EGFR-tyrosine kinase inhibitor sensitivity. J. Biol. Regul. Homeost. Agents 2013, 27, 143–154. [Google Scholar] [PubMed]
- Gatti, M.; Pattarozzi, A.; Bajetto, A.; Würth, R.; Daga, A.; Fiaschi, P.; Zona, G.; Florio, T.; Barbieri, F. Inhibition of CXCL12/CXCR4 autocrine/paracrine loop reduces viability of human glioblastoma stem-like cells affecting self-renewal activity. Toxicology 2013, 314, 209–220. [Google Scholar] [CrossRef]
- Corsaro, A.; Bajetto, A.; Thellung, S.; Begani, G.; Villa, V.; Nizzari, M.; Pattarozzi, A.; Solari, A.; Gatti, M.; Pagano, A.; et al. Cellular prion protein controls stem cell-like properties of human glioblastoma tumor-initiating cells. Oncotarget 2016, 7, 38638–38657. [Google Scholar] [CrossRef] [PubMed]
- Gentile, M.T.; Russo, R.; Pastorino, O.; Cioffi, S.; Barbieri, F.; Illingworth, E.A.; Grieco, M.; Chambery, A.; Colucci-D’Amato, L. Ruta graveolens water extract inhibits cell-cell network formation in human umbilical endothelial cells via MEK-ERK1/2 pathway. Exp. Cell Res. 2018, 364, 50–58. [Google Scholar] [CrossRef] [PubMed]


| Group | Compound | Chemical Structure | HDAC Specificity |
|---|---|---|---|
| Hydroxamate | Vorinostat (SAHA) | 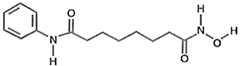 | class I and II HDACs |
| Trichostatin A (TSA) | 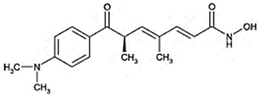 | class I and II HDACs | |
| MC1568 | 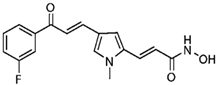 | Class II HDACs | |
| Benzamide | Entinostat (MS275) | 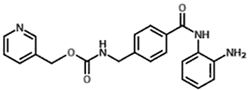 | HDAC 1 and HDAC 3 (class I HDACs members) |
| Code | Age | Sex | WHO Grade | Histo Type | IHC | MIB-Index (%) | Cerebral Hemisphere/Lobe | Localization | Meningeal Infiltration |
|---|---|---|---|---|---|---|---|---|---|
| Pt 1 | 71 | F | IV (primary, multicentric) | Neural | GFAP+ | 60 | Left/T-P-O | Cortical-subcortical | no |
| Pt 2 | 40 | F | IV (secondary, progression from oligodendroglioma) | Mesenchymal | GFAP + CD133+ | 30 | Right/F-T | Cortical-subcortical | Yes |
© 2019 by the authors. Licensee MDPI, Basel, Switzerland. This article is an open access article distributed under the terms and conditions of the Creative Commons Attribution (CC BY) license (http://creativecommons.org/licenses/by/4.0/).
Share and Cite
Pastorino, O.; Gentile, M.T.; Mancini, A.; Del Gaudio, N.; Di Costanzo, A.; Bajetto, A.; Franco, P.; Altucci, L.; Florio, T.; Stoppelli, M.P.; et al. Histone Deacetylase Inhibitors Impair Vasculogenic Mimicry from Glioblastoma Cells. Cancers 2019, 11, 747. https://doi.org/10.3390/cancers11060747
Pastorino O, Gentile MT, Mancini A, Del Gaudio N, Di Costanzo A, Bajetto A, Franco P, Altucci L, Florio T, Stoppelli MP, et al. Histone Deacetylase Inhibitors Impair Vasculogenic Mimicry from Glioblastoma Cells. Cancers. 2019; 11(6):747. https://doi.org/10.3390/cancers11060747
Chicago/Turabian StylePastorino, Olga, Maria Teresa Gentile, Alessandro Mancini, Nunzio Del Gaudio, Antonella Di Costanzo, Adriana Bajetto, Paola Franco, Lucia Altucci, Tullio Florio, Maria Patrizia Stoppelli, and et al. 2019. "Histone Deacetylase Inhibitors Impair Vasculogenic Mimicry from Glioblastoma Cells" Cancers 11, no. 6: 747. https://doi.org/10.3390/cancers11060747