
Deep Learning Based HPV Status Prediction for Oropharyngeal Cancer Patients
by
 , , , and
Daniel M. Lang
1,2,3,* ,
,
Jan C. Peeken
1,2,4,
Stephanie E. Combs
1,2,4,
Jan J. Wilkens
2,3 and
Stefan Bartzsch
1,2 1
Institute of Radiation Medicine, Helmholtz Zentrum München, 85764 Munich, Germany
2
Department of Radiation Oncology, School of Medicine and Klinikum Rechts der Isar, Technical University of Munich (TUM), 81675 Munich, Germany
3
Physics Department, Technical University of Munich, 85748 Garching, Germany
4
Deutsches Konsortium für Translationale Krebsforschung (DKTK), Partner Site, 81377 Munich, Germany
*
Author to whom correspondence should be addressed.
Cancers 2021, 13(4), 786; https://doi.org/10.3390/cancers13040786
Submission received: 28 January 2021
/
Revised: 7 February 2021
/
Accepted: 9 February 2021
/
Published: 13 February 2021
(This article belongs to the Special Issue Machine Learning Techniques in Cancer)
Abstract
:Simple Summary
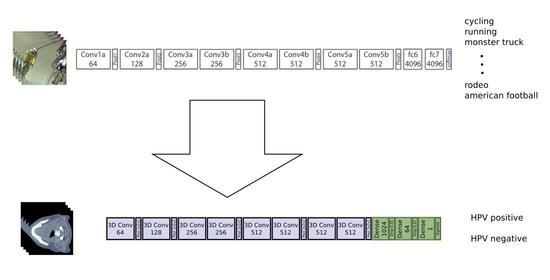
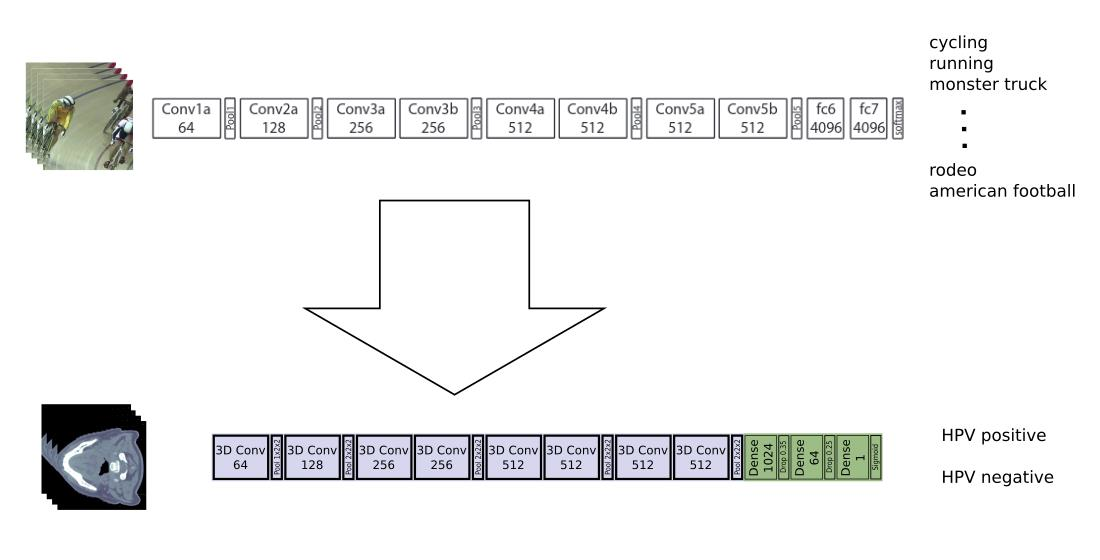
Determination of human papillomavirus (HPV) status for oropharyngeal cancer patients depicts a essential diagnostic factor and is important for treatment decisions. Current histological methods are invasive, time consuming and costly. We tested the ability of deep learning models for HPV status testing based on routinely acquired diagnostic CT images. A network trained for sports video clip classification was modified and then fine tuned for HPV status prediction. In this way, very basic information about image structures is induced into the model before training is started, while still allowing for exploitation of full 3D information in the CT images. Usage of this approach helps the network to cope with a small number of training examples and makes it more robust. For comparison, two other models were trained, one not relying on a pre-training task and another one pre-trained on 2D Data. The pre-trained video model preformed best.
Abstract
Infection with the human papillomavirus (HPV) has been identified as a major risk factor for oropharyngeal cancer (OPC). HPV-related OPCs have been shown to be more radiosensitive and to have a reduced risk for cancer related death. Hence, the histological determination of HPV status of cancer patients depicts an essential diagnostic factor. We investigated the ability of deep learning models for imaging based HPV status detection. To overcome the problem of small medical datasets, we used a transfer learning approach. A 3D convolutional network pre-trained on sports video clips was fine-tuned, such that full 3D information in the CT images could be exploited. The video pre-trained model was able to differentiate HPV-positive from HPV-negative cases, with an area under the receiver operating characteristic curve (AUC) of for an external test set. In comparison to a 3D convolutional neural network (CNN) trained from scratch and a 2D architecture pre-trained on ImageNet, the video pre-trained model performed best. Deep learning models are capable of CT image-based HPV status determination. Video based pre-training has the ability to improve training for 3D medical data, but further studies are needed for verification.
1. Introduction
Infection with the human papillomavirus (HPV) has been identified as oncogenic for several cancer sites [1] and chronic HPV infections may also lead to oropharyngeal cancer (OPC) development [2]. While smoking and alcohol consumption, two well established risk factors for OPC, have notably declined in North America and Northern Europe [3], infections with HPV have increased and lead to growing incidence rates of OPC [1]. Plummer et al. [4] estimated in 2016 that around 31% of OPC cases globally are caused by HPV. However, OPC patients with a positive HPV status show a 74% reduced risk of cancer related death [5] and HPV-positive tumors are more radiosensitive than HPV-negative tumors. Hence, determination of the HPV status has become an essential diagnostic factor, and dose de-escalation studies, such as the ECOG 1308 trial [6], seek to reduce therapy induced side effects for HPV-positive OPC patients. The detection of HPV-induced overexpression of p16INK4a by immunohistochemistry is most frequently used with a reported sensitivity of >90% and a specificity of >80% [7,8].
Machine learning techniques, in combination with high-dimensional personalized “-omics” datasets, have shown to be powerful tools for the prognostic and predictive assessment of therapeutic efficacy [9,10,11]. Radiomics refers to the extraction of information from radiological images by applying hand-crafted filters on preselected regions of interest [12]. Segal et al. [13] demonstrated that features in radiological images can be used to reconstruct the majority of the tumor genetic profile. Radiomics data successfully predicted overall survival [14,15], metastases development [16,17] or histological properties [18,19] and may be used as a decision support system in clinical practice. Radiomics approaches to determine the HPV status achieved areas under the receiver operating characteristic curve (AUC) of about 70% to 80%, when tested on external data sets [20,21].
Although radiomics has proven its potential in medical image analysis, deep learning was shown to be clearly superior in most other computer vision tasks. Deep learning features an end-to-end training without the need to design hand-crafted filters. However, training requires considerably larger patient numbers than typically available in clinical applications. One possible solution to this problem is given by transfer learning, an approach making use of large non-medical data sets in order to inject information into the network before the actual learning task is started. Fujima et al. [22] trained a 2D convolutional neuronal network (CNN) on FDG-PET images to classify HPV status in OPC patients and achieved an AUC of 83%, using a transfer learning approach based on natural images from the ImageNet database [23]. However, they did not test their data on an external cohort and excluded images containing severe motion artifacts and tumors with diameters below cm.
In this work, we investigate deep learning on diagnostic CT images as a tool to attribute oropharyngeal cancer to a human papillomavirus-driven oncogenesis.
Our study was based on four different publicly available data sets of The Cancer Imaging Archive (TCIA) [24]. Transfer learning facilitated deep learning on the relatively small data set size on a CNN derived from the C3D classification network [25], with weights pre-training on the Sports-1M data set [23]. Hussein et al. [26] used C3D to initialize a multi-task learning approach for lung nodule risk stratification. However, their network depended on additional information, such as tumor sphericity and texture, while we trained our network in a simple end-to-end fashion.
2. Material and Methods
2.1. Data
Head and neck cancer collections OPC-Radiomics [27,28], HNSCC [29,30], Head-Neck-PET-CT [31,32] and Head-Neck-Radiomics-HN1 [33,34] of the publicly accessible TCIA archive [24] were mined for appropriate cases. Inclusion criteria were: oropharyngeal subtype, existence of a pre-treatment CT image with respective segmentation of the gross tumor volume (GTV) and detected HPV status. Only the centerpoint of the available GTV was used to cut the images to smaller size, i.e., no exact delineation of the tumor was needed. For the Head-Neck-PET-CT data set, the GTV also involved delineation of lymph nodes. In total, this led to 850 individual oropharyngeal cancer patients (Table 1); example images can be seen in Figure A2 of the Appendix A.
To ensure generalizability to images from institutions and scanners not seen during training, testing on external data is inevitable in a medical setting [35]. Hence, for training, validation and testing independent data sets were employed. The OPC-Radiomics and HNSCC data sets were combined and used as a training set, since these two cohorts contained the most cases. Due to its variety in cases with data coming from 4 different institutions, Head-Neck-PET-CT was employed for validation. The validation set is used for selection of the final model weights; a versatile validation set therefore supports selection of a model applicable to a broad kind of settings. The Head-Neck-Radiomics-HN1 data set was used as a test set.
The OPC-Radiomics and Head-Neck-Radiomics-HN1 data sets provided the HPV status tested by immunohistochemical (IHC)-based p16 staining. A combination of p16 IHC and/or HPV DNA in situ hybridization was used in the HNSCC data. For Head-Neck-PET-CT, testing methods were not reported.
We resampled all CT images to an isotropic voxel size of 1 mm3. Voxel values, given in Hounsfield units, were cropped at HU and 250 HU, and linearly rescaled to integer values ranging from 0 to 255.
2.2. Deep Neural Network
Transfer learning is commonly used to overcome the problem of small data set sizes. A widely applied approach uses the ImageNet data set [23], consisting of natural images, for pre-training. However, CT images are 3 dimensional and therefore pre-training should be performed on 3 dimensional data. We tested the capability of video data based pre-training defining the time axis as the 3rd dimension.
To avoid long training times and obtain a reproducible starting point, we used the already trained video classification network C3D [25,36] as a pre-trained base line model. C3D processes video input in a simple 3D convolutional manner, i.e., all three input dimensions are handled in the same way. Convolutional layers are followed by max-pooling layers, ending with three densely connected layers and a softmax activation layer. C3D was trained to predict labels for video clips of the sport-1M data set [37], which contains 1.1 million videos of sport activities belonging to one of 487 categories. For training, 16 image frames per video clip with a size of were used, i.e., input dimension was given by .
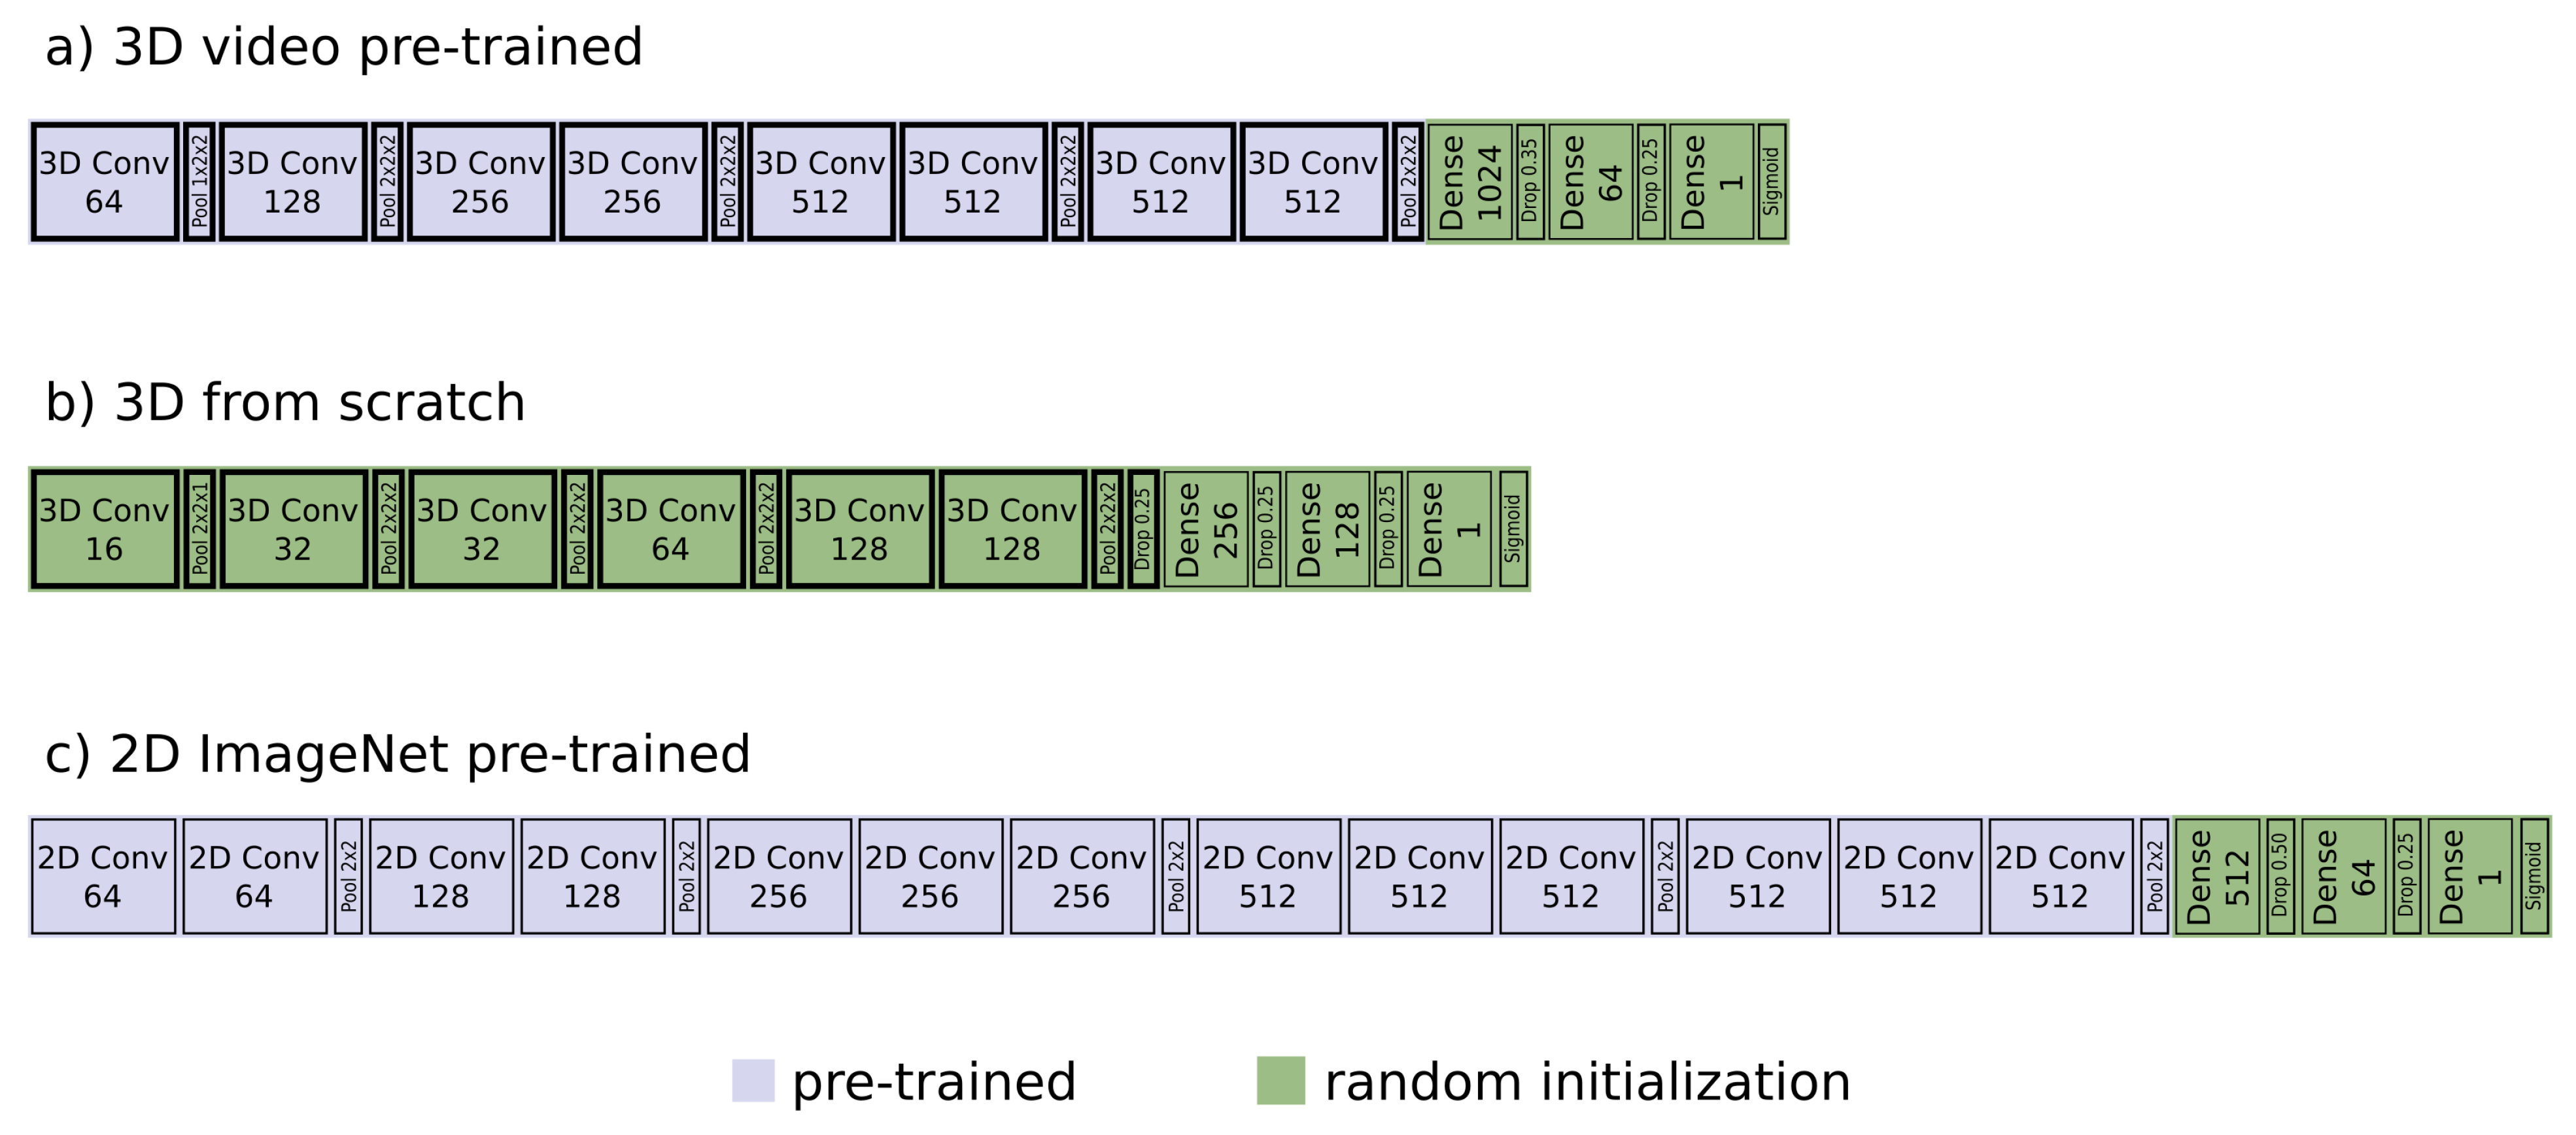
All densely connected layers were removed from the network and weights of all convolutional layers were frozen during training. New, randomly initialized, densely connected layers were then added after the last convolutional layer, resulting in a single output neuron followed by a sigmoid activation layer. All dense layers were followed by a ReLU activation layer and a dropout layer. The best model consisted of two dense layers with size 1024 and 64, with a dropout rate of and , respectively (Figure 1a).
Weighted binary cross entropy was chosen as loss function with the weights set, such that both classes contributed equally. The Adam optimizer was used with a learning rate of and the batch size was 16.
As input a single image of size was cut from each of the CT scans and then rearranged to fulfill the input requirements, i.e., 3 consecutive layers were fed to the color channels resulting in information about 16 of those combined layers in longitudinal direction. The data augmentation techniques applied included: flipping on the coronal and the sagittal plane, rotation by a multiple of and shifting of the GTV center point by a value between 0 and 7 pixels in both directions of the transverse plane.
For comparison, we also trained a 3D convolutional network from scratch, i.e., with all weights randomly initialized, and a 2D network pre-trained on ImageNet.
The general architecture of the model trained from scratch followed that of C3D net. Only the size of the network was reduced to avoid overfitting. To do so, max-pooling was applied after every convolutional layer, except for the second but last one, and dropout was also already applied in the last convolutional layer. The final model consisted of convolutional layers with feature map sizes of , followed by densely connected layers of size 256 and 128 (Figure 1b). Dropout rate for the last convolutional layer and the two dense layers was . All convolutional kernels were chosen to be of size . In order to not merge the signal in the time dimension too early, the C3D model used a kernel and stride of size in the very first max-pooling layer. We followed this approach to account for the smaller input size in longitudinal dimension. All other max-pooling kernels were of size with a stride of the same shape. Input images were cut from the CT scans in exactly the same way as before except for the rearrangement of layers, i.e., input size was . Data augmentation was applied as before and the optimizer and learning rate stayed the same.
For the 2D model, the VGG16 architecture of [38], pre-trained on ImageNet, was chosen. One image was cut from each CT scan in the exact same way as for the 3D model trained from scratch. For training, the images were split into 16 slices of size to fit the networks input dimensions, i.e., three consecutive slices were fed to the color channels of the network. During testing, the overall prediction score was constructed by averaging the prediction scores of all 16 slices. All dense layers were removed from the model and replaced by randomly initialized layers. Dense layers were again followed by ReLU activations and dropout layers to finally end in one single output neuron with a sigmoid activation function. Weights of all convolutional layers were again kept fixed. The best performing model had a size of 512 followed by 64, with a dropout rate of and , respectively (Figure 1c). Data augmentation was performed as before.
The code has been made publicly available (https://github.com/LangDaniel/hpv_status accessed on 10 February 2021).
3. Results
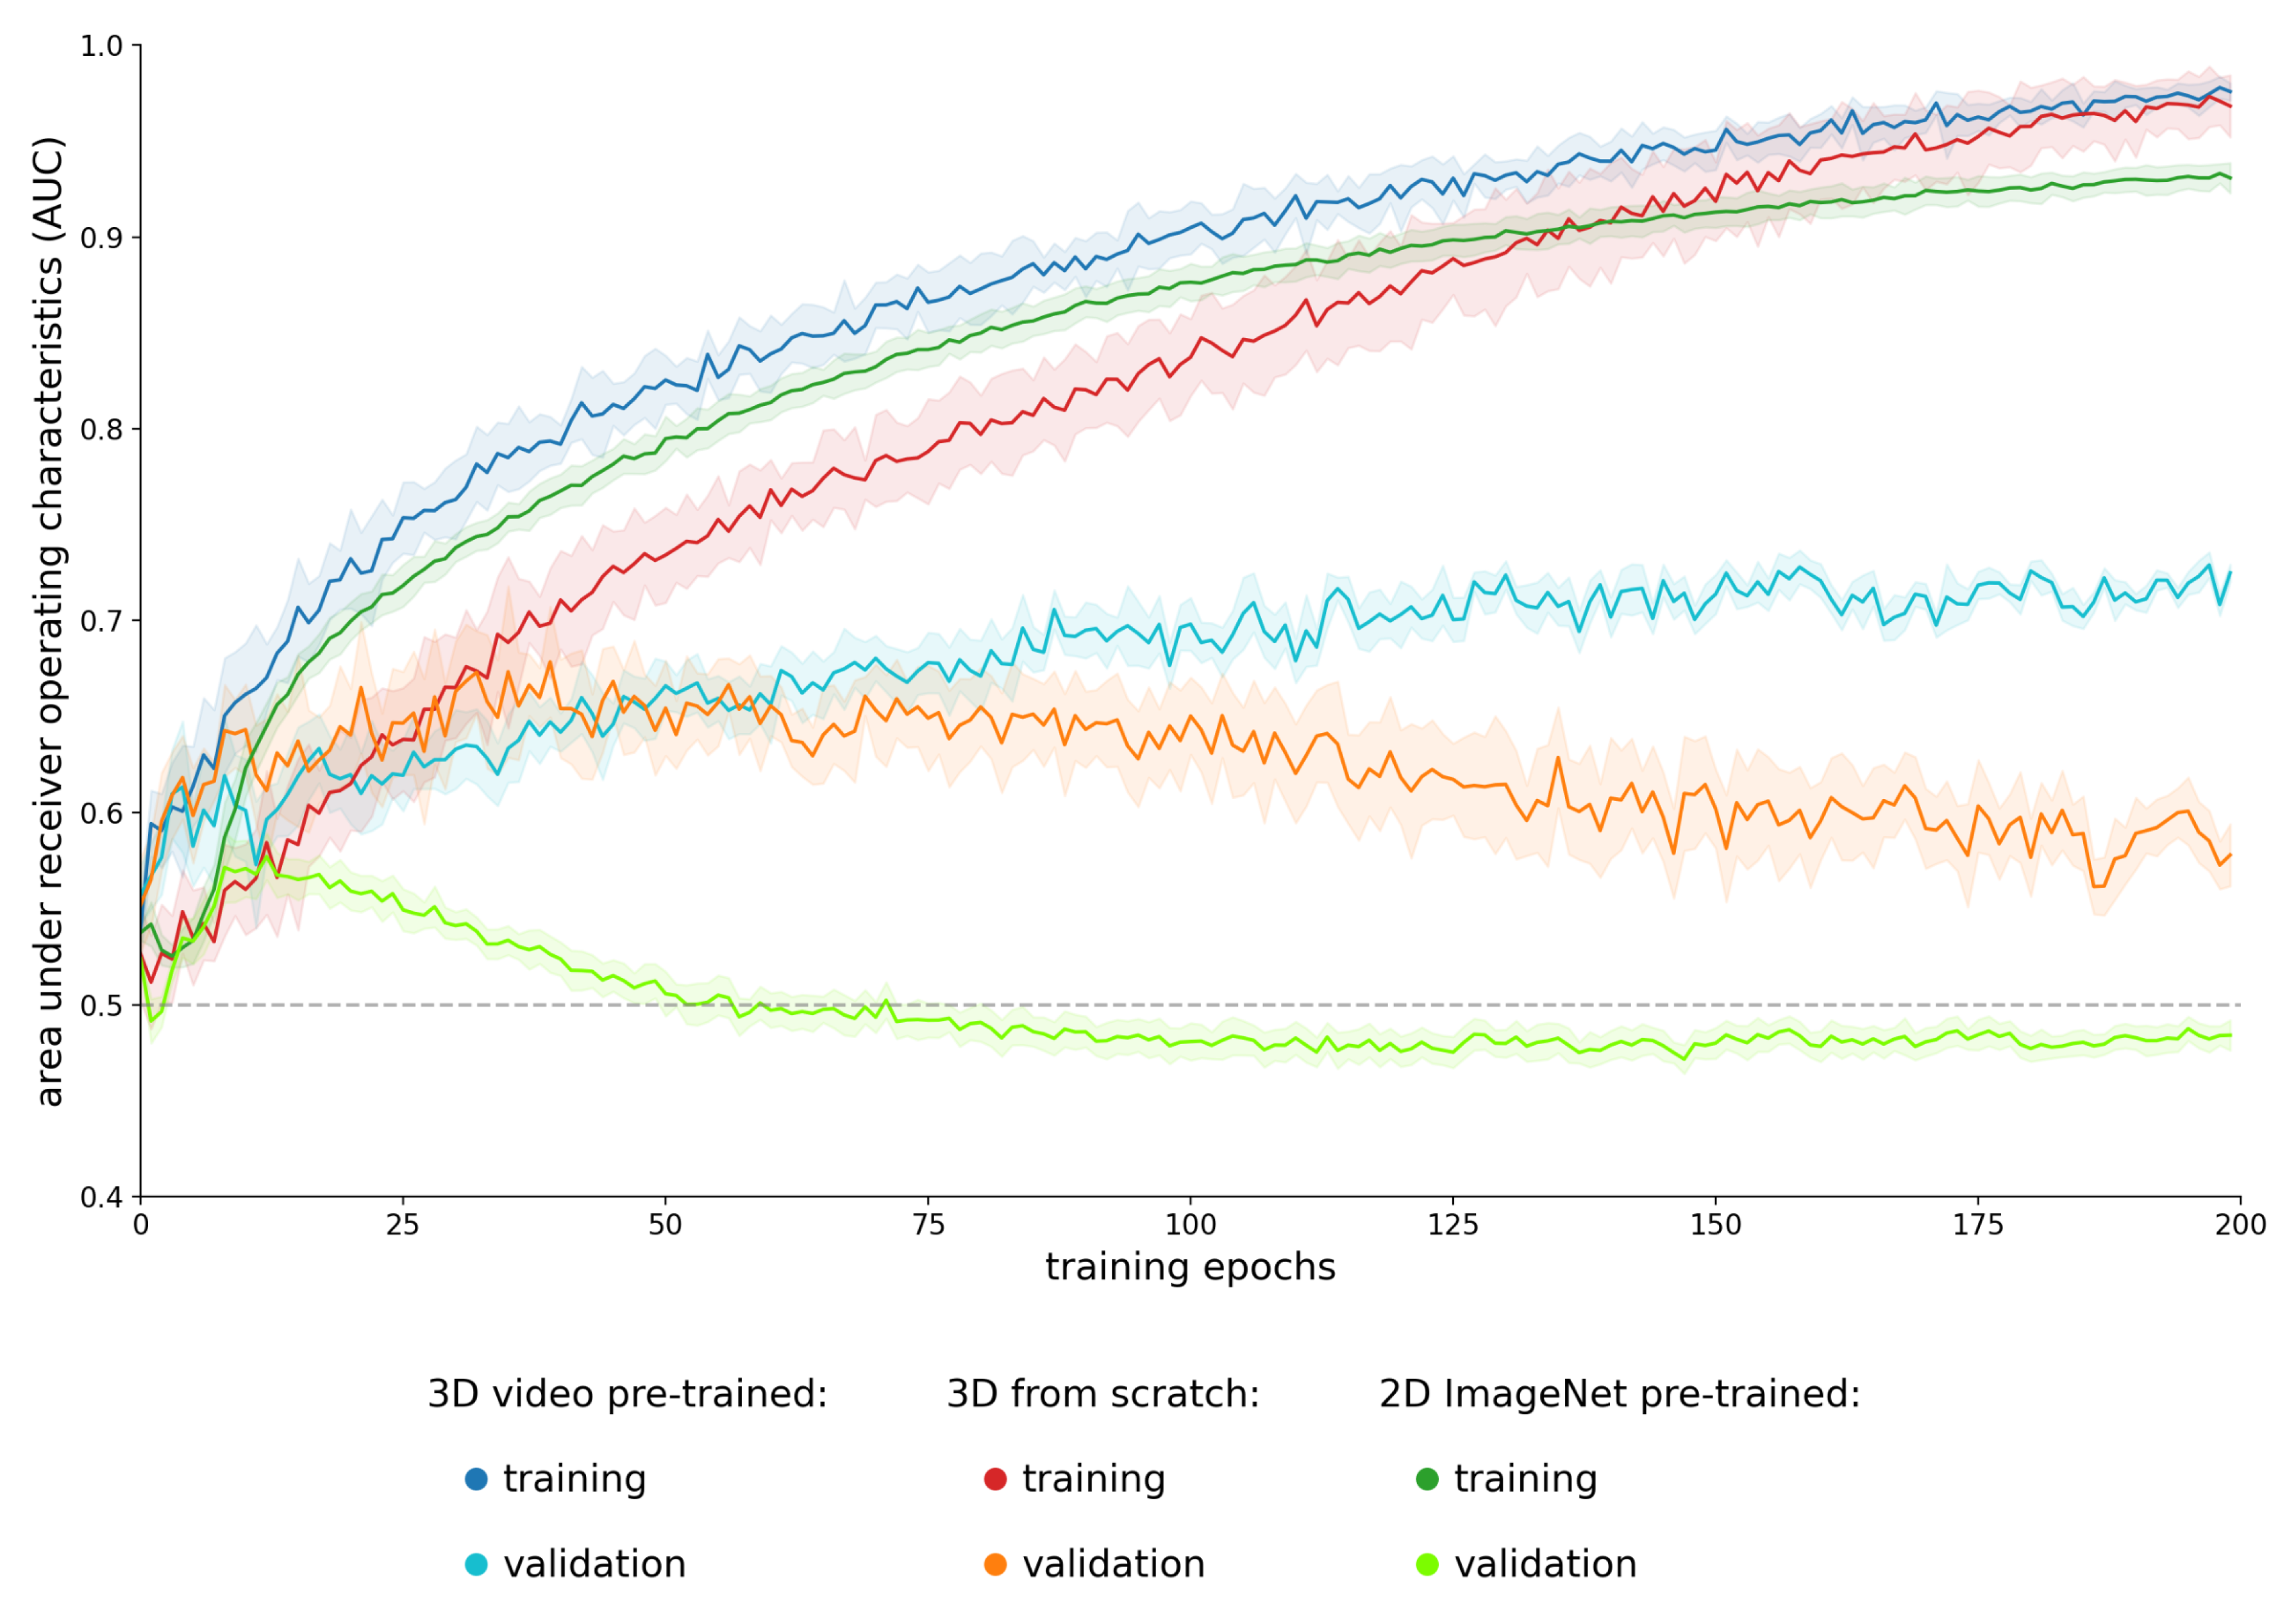
All models were trained for 200 epochs. Training performance is given in Figure A1 of the Appendix A. Weights of the epoch with the best performing loss were chosen for the respective final model. Due to the relative small size of our test and validation sets, we chose to train each model with the same hyper-parameter settings 10 times and report mean results.
The 3D video pre-trained model achieved the highest validation AUC with a mean (min, max) value of 0.73 (0.69, 0.77) and a corresponding training AUC of 0.95 (0.90, 0.98). The 3D network trained from scratch reached a slightly less validation AUC of 0.71 (0.67, 0.74), training AUC was given by 0.83 (0.66, 0.92). Results for the 2D network pre-trained on ImageNet were given by 0.62 (0.58, 0.64) for validation and 0.78 (0.76, 0.79) for training.
Receiver operating characteristics (ROC) results on the test set can be seen in Figure 2.
The test AUC for the video based network was given by 0.81 (0.77, 0.84), for the 3D network trained from scratch and the pre-trained 2D network; test AUCs were given by 0.64 (0.56, 0.70) and 0.73 (0.70, 0.75), respectively.
Sensitivity, specificity, positive and negative predicted values (PPV and NPV respectively) and the score, given by the harmonic mean of precision and recall, were computed for a threshold value of 0.50 in the output layer. Test set results are shown in Table 2.
4. Discussion
From the three networks trained, the video pre-trained C3D model performed best with a test AUC score showing clear superiority over the two other models.
We associate the success of pre-training with two factors. First of all, transfer learning is counteracting the problem of small data set sizes by injection of knowledge prior to the actual learning task. General benefit of natural imaging based pre-training for the medical domain has been challenged by Raghu et al. [39], accounting improvements only to the application of over-parametrized models. However, our training data set involved just a few hundred cases, making even the training of small networks difficult. We therefore accredit the model improvement, in our case, to actual transferred knowledge between the two domains. Second, transfer learning improves generalization. Different studies have shown that radiomic feature values are affected by CT scanners and scanning protocols [40,41,42,43]. Convolutional neural networks are sensitive to such domain shifts [44,45]. Hendrycks et al. [46] showed that transfer learning can improve model robustness, which leads to better validation and testing results.
Additionally, we recognize improved performance of the 3D approach over the 2D approach. Our results suggest that the third dimension contains essential information for HPV classification. Since the 2D case uses only small parts of the complete CT image, a 3-dimensional input volume enables a better fit to the data. The small input volume increases the probability to receive slices that lack information on patient’s HPV status and impair the training progress. Moreover, single slices can suffer from artifacts, of which Figure A2 gives an impression. Providing only three CT slices increases the impact of such artifacts and compromises training success.
When tested on an external data set, radiomic models reached AUC scores ranging between 0.70 and 0.82 [20,21]. A crucial difference between radiomics and deep learning lies within the input information. Radiomic methods apply filters on a predefined region of interest, typically the GTV, for feature generation. HPV-positive OPCs, however, are known to be associated with regions outside the tumor volume, e.g. cystic lymph nodes [47,48]. Therefore, radiomic approaches usually ignore important parts of the image. Deep learning, on the other hand, does not require the delineation of the tumor volume, leading to an advantage in HPV prediction.
Our work has proven the capability of deep learning models to predict patients’ HPV status based on CT images from different institutions, with a sensitivity and specificity of 75% and 72%, respectively. For clinical application, further studies are required. This involves the implementation of more diverse training data to investigate the impact on model generalizability. Furthermore, the effect of data quality has to be examined. Head and neck CT images are generally prone to artifacts; Leijenaar et al. [49] analyzed a subset of the OPC-Radiomics collection and found that 49% of all cases contained visible artifacts. They showed that the involvement of artifacts plays a major role for HPV status prediction, by training a radiomics model which achieved AUC scores ranging between 0.70 and 0.80 depending on the inclusion of cases with artifacts in the training and test cohorts [50]. Right now, the model is trained predominantly and tested solely on HPV cases determined by p16 IHC. For further validation, other testing methods should be included.
The 8th edition of the American Joint Committee of Cancer (AJCC) staging manual defined HPV-positive OPCs as an independent entity and recommended testing by immunohistochemical staining of p16, a surrogate marker of HPV [51]. However, p16 overexpression is not exclusively linked to an ongoing carcinogenesis caused by a HPV infection, leading to a low specificity of p16 testing with up to 20% of OPC p16-positive cases being HPV-negative [52]. Tests with higher specificity exist, but are technically challenging. The current gold standard test of E6/E7 mRNA detection by PCR remains labor-intensive and, hence, relatively expensive. [53,54]. In a North-American survey, Maniakas et al. [55] found that only about 2/3 of head and neck cancer cases were tested for HPV infection, with cost and time limits as the major reasons not to test. An imaging-based test is easily applicable, non-invasive and also features time efficiency and low cost. Our model could be used for cases where those constraints forbid histopathological testing. In order to serve as a replacement for current methods, sensitivity and specificity of the model have to be further improved. However, in its current state, the model could be used in combination with other testing methods to achieve higher total performance.
5. Conclusions
It was demonstrated that convolutional neural networks are able to classify the HPV status of oropharyngeal cancer patients, based on CT images from different cohorts. The sports video clip-based transfer learning approach performed best in comparison to two other CNN models. Video based pre-training has the potential to improve deep learning on 3D medical data, but further studies are needed for general verification.
Author Contributions
Conceptualization, D.M.L., J.C.P., S.E.C. and S.B.; methodology, D.M.L.; software, D.M.L.; validation, D.M.L., J.C.P. and S.B.; formal analysis, D.M.L. and S.B.; investigation, D.M.L. and S.B.; resources, S.E.C. and J.J.W.; data curation, D.M.L.; writing—original draft preparation, D.M.L. and S.B.; writing—review and editing, J.C.P., S.E.C. and J.J.W.; visualization, D.M.L.; supervision, S.E.C. and J.J.W.; project administration, J.C.P., S.E.C. and J.J.W.; funding acquisition, S.E.C. and J.J.W. All authors have read and agreed to the published version of the manuscript.
Funding
This research received no external funding.
Institutional Review Board Statement
Not applicable.
Informed Consent Statement
Not applicable.
Data Availability Statement
All data used in this study was taken from The Cancer Imaging Archive (TCIA) [24] and is publicly accessible.
Acknowledgments
We thank Carsten Marr (Helmholtz Center Munich) for supporting us with advice.
Conflicts of Interest
The authors declare no conflict of interest.
Abbreviations
The following abbreviations are used in this manuscript:
| HPV | human papillomavirus |
| OPC | oropharyngeal cancer |
| CT | computed tomography |
| AUC | area under the receiver operating characteristic curve |
| CNN | convolutional neural network |
| FDG-PET | fluorodeoxyglucose—positron emission tomography |
| GTV | gross tumor volume |
| IHC | immunohistochemistry |
| DNA | deoxyribonucleic acid |
| ROC | receiver operating characteristic |
| AJCC | American Joint Committee of Cancer |
Appendix A
Figure A1.
Learning curves for the different models. Values are averaged over the ten times each model was trained; shadowed area represents the standard deviation. The C3D pre-trained model performed best with no overfitting. The 3D model trained from scratch and the ImageNet pre-trained 2D model started to overfit early, at around epoch 40 and 15, respectively. The relative large difference between training and validation performance stems from application of an external validation set.

Figure A2.
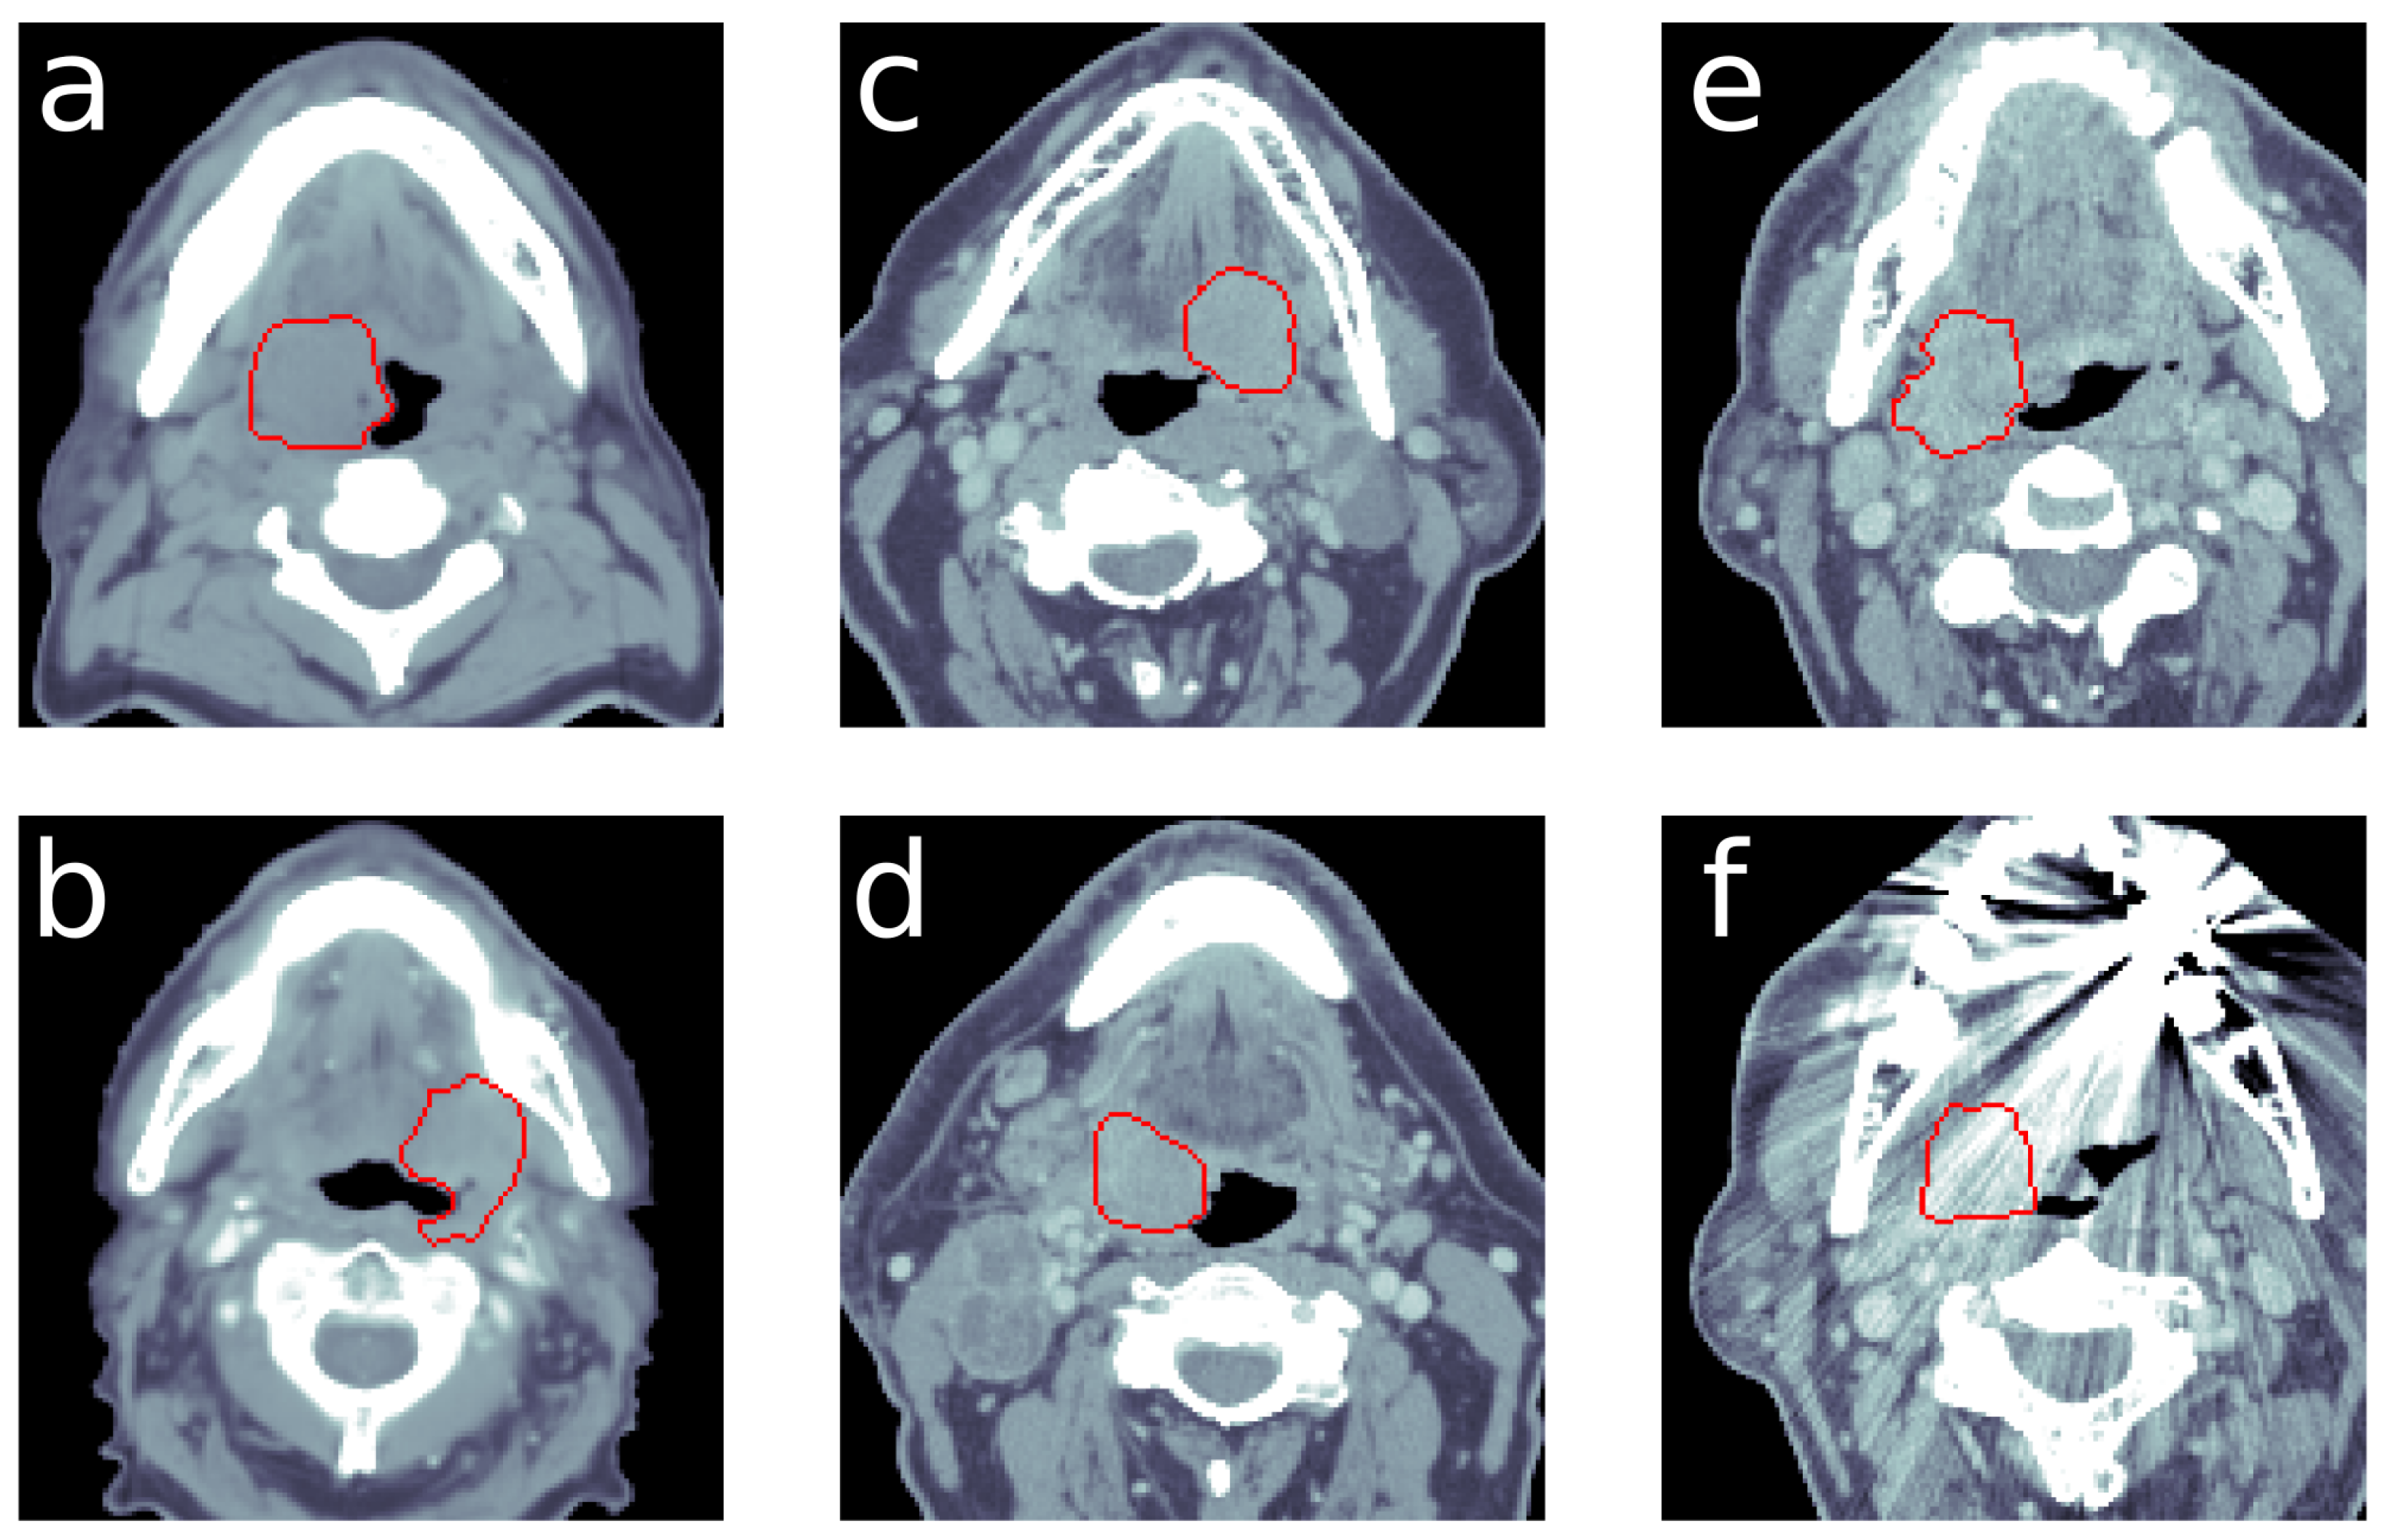
Example CT slices with: (a) HPV-positive example (OPC dataset), (b) HPV-negative example (OPC dataset), (c) HPV-positive example (HNSCC dataset) and (d) HPV-negative example (HNSCC dataset). Examples (e,f) are showing different slices of the same CT image, while (e) features normal quality (f), which suffers from artifacts. The red delineation marks the gross tumor volume. The HU window was set to range from −250 to 250.
Figure A2.
Example CT slices with: (a) HPV-positive example (OPC dataset), (b) HPV-negative example (OPC dataset), (c) HPV-positive example (HNSCC dataset) and (d) HPV-negative example (HNSCC dataset). Examples (e,f) are showing different slices of the same CT image, while (e) features normal quality (f), which suffers from artifacts. The red delineation marks the gross tumor volume. The HU window was set to range from −250 to 250.

References
- IARC Working Group. IARC Monographs on the Evaluation of Carcinogenic Risks to Humans; WHO Press: Geneva, Switzerland, 2007; Volume 90, p. 124. [Google Scholar]
- Mork, J.; Lie, A.K.; Glattre, E.; Clark, S.; Hallmans, G.; Jellum, E.; Koskela, P.; Møller, B.; Pukkala, E.; Schiller, J.T.; et al. Human papillomavirus infection as a risk factor for squamous-cell carcinoma of the head and neck. N. Engl. J. Med. 2001, 344, 1125–1131. [Google Scholar] [CrossRef] [PubMed]
- Ng, M.; Freeman, M.K.; Fleming, T.D.; Robinson, M.; Dwyer-Lindgren, L.; Thomson, B.; Wollum, A.; Sanman, E.; Wulf, S.; Lopez, A.D.; et al. Smoking prevalence and cigarette consumption in 187 countries, 1980–2012. JAMA 2014, 311, 183–192. [Google Scholar] [CrossRef] [Green Version]
- Plummer, M.; de Martel, C.; Vignat, J.; Ferlay, J.; Bray, F.; Franceschi, S. Global burden of cancers attributable to infections in 2012: A synthetic analysis. Lancet Glob. Health 2016, 4, e609–e616. [Google Scholar] [CrossRef] [Green Version]
- Gillison, M.L.; Koch, W.M.; Capone, R.B.; Spafford, M.; Westra, W.H.; Wu, L.; Zahurak, M.L.; Daniel, R.W.; Viglione, M.; Symer, D.E.; et al. Evidence for a causal association between human papillomavirus and a subset of head and neck cancers. J. Natl. Cancer Inst. 2000, 92, 709–720. [Google Scholar] [CrossRef] [PubMed]
- Marur, S.; Li, S.; Cmelak, A.J.; Gillison, M.L.; Zhao, W.J.; Ferris, R.L.; Westra, W.H.; Gilbert, J.; Bauman, J.E.; Wagner, L.I.; et al. E1308: Phase II trial of induction chemotherapy followed by reduced-dose radiation and weekly cetuximab in patients with HPV-associated resectable squamous cell carcinoma of the oropharynx—ECOG-ACRIN Cancer Research Group. J. Clin. Oncol. 2017, 35, 490. [Google Scholar] [CrossRef]
- Schache, A.G.; Liloglou, T.; Risk, J.M.; Filia, A.; Jones, T.M.; Sheard, J.; Woolgar, J.A.; Helliwell, T.R.; Triantafyllou, A.; Robinson, M.; et al. Evaluation of human papilloma virus diagnostic testing in oropharyngeal squamous cell carcinoma: Sensitivity, specificity, and prognostic discrimination. Clin. Cancer Res. 2011, 17, 6262–6271. [Google Scholar] [CrossRef] [Green Version]
- Jordan, R.C.; Lingen, M.W.; Perez-Ordonez, B.; He, X.; Pickard, R.; Koluder, M.; Jiang, B.; Wakely, P.; Xiao, W.; Gillison, M.L. Validation of methods for oropharyngeal cancer HPV status determination in United States cooperative group trials. Am. J. Surg. Pathol. 2012, 36, 945. [Google Scholar] [CrossRef]
- Coates, J.; Souhami, L.; El Naqa, I. Big data analytics for prostate radiotherapy. Front. Oncol. 2016, 6, 149. [Google Scholar] [CrossRef] [Green Version]
- El Naqa, I.; Kerns, S.L.; Coates, J.; Luo, Y.; Speers, C.; West, C.M.; Rosenstein, B.S.; Ten Haken, R.K. Radiogenomics and radiotherapy response modeling. Phys. Med. Biol. 2017, 62, R179. [Google Scholar] [CrossRef]
- Kumar, V.; Gu, Y.; Basu, S.; Berglund, A.; Eschrich, S.A.; Schabath, M.B.; Forster, K.; Aerts, H.J.; Dekker, A.; Fenstermacher, D.; et al. Radiomics: The process and the challenges. Magn. Reson. Imaging 2012, 30, 1234–1248. [Google Scholar] [CrossRef] [Green Version]
- Peeken, J.C.; Wiestler, B.; Combs, S.E. Image-Guided Radiooncology: The Potential of Radiomics in Clinical Application. In Molecular Imaging in Oncology; Springer: Berlin/Heidelberg, Germany, 2020; pp. 773–794. [Google Scholar]
- Segal, E.; Sirlin, C.B.; Ooi, C.; Adler, A.S.; Gollub, J.; Chen, X.; Chan, B.K.; Matcuk, G.R.; Barry, C.T.; Chang, H.Y.; et al. Decoding global gene expression programs in liver cancer by noninvasive imaging. Nat. Biotechnol. 2007, 25, 675–680. [Google Scholar] [CrossRef]
- Fave, X.; Zhang, L.; Yang, J.; Mackin, D.; Balter, P.; Gomez, D.; Followill, D.; Jones, A.K.; Stingo, F.; Liao, Z.; et al. Delta-radiomics features for the prediction of patient outcomes in non–small cell lung cancer. Sci. Rep. 2017, 7, 1–11. [Google Scholar] [CrossRef]
- Spraker, M.B.; Wootton, L.S.; Hippe, D.S.; Ball, K.C.; Peeken, J.C.; Macomber, M.W.; Chapman, T.R.; Hoff, M.N.; Kim, E.Y.; Pollack, S.M.; et al. MRI radiomic features are independently associated with overall survival in soft tissue sarcoma. Adv. Radiat. Oncol. 2019, 4, 413–421. [Google Scholar] [CrossRef] [PubMed] [Green Version]
- Huynh, E.; Coroller, T.P.; Narayan, V.; Agrawal, V.; Hou, Y.; Romano, J.; Franco, I.; Mak, R.H.; Aerts, H.J. CT-based radiomic analysis of stereotactic body radiation therapy patients with lung cancer. Radiother. Oncol. 2016, 120, 258–266. [Google Scholar] [CrossRef]
- Peeken, J.C.; Bernhofer, M.; Spraker, M.B.; Pfeiffer, D.; Devecka, M.; Thamer, A.; Shouman, M.A.; Ott, A.; Nüsslin, F.; Mayr, N.A.; et al. CT-based radiomic features predict tumor grading and have prognostic value in patients with soft tissue sarcomas treated with neoadjuvant radiation therapy. Radiother. Oncol. 2019, 135, 187–196. [Google Scholar] [CrossRef]
- Peeken, J.C.; Spraker, M.B.; Knebel, C.; Dapper, H.; Pfeiffer, D.; Devecka, M.; Thamer, A.; Shouman, M.A.; Ott, A.; von Eisenhart-Rothe, R.; et al. Tumor grading of soft tissue sarcomas using MRI-based radiomics. EBioMedicine 2019, 48, 332–340. [Google Scholar] [CrossRef] [Green Version]
- Peeken, J.C.; Shouman, M.A.; Kroenke, M.; Rauscher, I.; Maurer, T.; Gschwend, J.E.; Eiber, M.; Combs, S.E. A CT-based radiomics model to detect prostate cancer lymph node metastases in PSMA radioguided surgery patients. Eur. J. Nucl. Med. Mol. Imaging 2020, 47, 2968–2977. [Google Scholar] [CrossRef] [PubMed]
- Bogowicz, M.; Jochems, A.; Deist, T.M.; Tanadini-Lang, S.; Huang, S.H.; Chan, B.; Waldron, J.N.; Bratman, S.; O’Sullivan, B.; Riesterer, O.; et al. Privacy-preserving distributed learning of radiomics to predict overall survival and HPV status in head and neck cancer. Sci. Rep. 2020, 10, 1–10. [Google Scholar] [CrossRef]
- Huang, C.; Cintra, M.; Brennan, K.; Zhou, M.; Colevas, A.D.; Fischbein, N.; Zhu, S.; Gevaert, O. Development and validation of radiomic signatures of head and neck squamous cell carcinoma molecular features and subtypes. EBioMedicine 2019, 45, 70–80. [Google Scholar] [CrossRef] [Green Version]
- Fujima, N.; Andreu-Arasa, V.C.; Meibom, S.K.; Mercier, G.A.; Truong, M.T.; Sakai, O. Prediction of the human papillomavirus status in patients with oropharyngeal squamous cell carcinoma by FDG-PET imaging dataset using deep learning analysis: A hypothesis-generating study. Eur. J. Radiol. 2020, 126, 108936. [Google Scholar] [CrossRef]
- Russakovsky, O.; Deng, J.; Su, H.; Krause, J.; Satheesh, S.; Ma, S.; Huang, Z.; Karpathy, A.; Khosla, A.; Bernstein, M.; et al. ImageNet Large Scale Visual Recognition Challenge. Int. J. Comput. Vis. 2015, 115, 211–252. [Google Scholar] [CrossRef] [Green Version]
- Clark, K.; Vendt, B.; Smith, K.; Freymann, J.; Kirby, J.; Koppel, P.; Moore, S.; Phillips, S.; Maffitt, D.; Pringle, M.; et al. The Cancer Imaging Archive (TCIA): Maintaining and operating a public information repository. J. Digit. Imaging 2013, 26, 1045–1057. [Google Scholar] [CrossRef] [Green Version]
- Tran, D.; Bourdev, L.; Fergus, R.; Torresani, L.; Paluri, M. Learning Spatiotemporal Features With 3D Convolutional Networks. In Proceedings of the The IEEE International Conference on Computer Vision (ICCV), Santiago, Chile, 7–13 December 2015. [Google Scholar]
- Hussein, S.; Cao, K.; Song, Q.; Bagci, U. Risk Stratification of Lung Nodules Using 3D CNN-Based Multi-task Learning. Inf. Process. Med Imaging 2017, 249–260. [Google Scholar] [CrossRef] [Green Version]
- Kwan, J.Y.Y.; Su, J.; Huang, S.; Ghoraie, L.; Xu, W.; Chan, B.; Yip, K.; Giuliani, M.; Bayley, A.; Kim, J.; et al. Data from Radiomic Biomarkers to Refine Risk Models for Distant Metastasis in Oropharyngeal Carcinoma; The Cancer Imaging Archive: Manchester, NH, USA, 2019. [Google Scholar]
- Kwan, J.Y.Y.; Su, J.; Huang, S.H.; Ghoraie, L.S.; Xu, W.; Chan, B.; Yip, K.W.; Giuliani, M.; Bayley, A.; Kim, J.; et al. Radiomic biomarkers to refine risk models for distant metastasis in HPV-related oropharyngeal carcinoma. Int. J. Radiat. Oncol. Biol. Phys. 2018, 102, 1107–1116. [Google Scholar] [CrossRef]
- Elhalawani, H.; White, A.; Zafereo, J.; Wong, A.; Berends, J.; AboHashem, S.; Williams, B.; Aymard, J.; Kanwar, A.; Perni, S.; et al. Radiomics Outcome Prediction in Oropharyngeal Cancer [Dataset]; The Cancer Imaging Archive: Manchester, NH, USA, 2017. [Google Scholar]
- Grossberg, A.J.; Mohamed, A.S.; Elhalawani, H.; Bennett, W.C.; Smith, K.E.; Nolan, T.S.; Williams, B.; Chamchod, S.; Heukelom, J.; Kantor, M.E.; et al. Imaging and clinical data archive for head and neck squamous cell carcinoma patients treated with radiotherapy. Sci. Data 2018, 5, 180173. [Google Scholar] [CrossRef]
- Martin, V.; Emily, K.R.; Léo Jean, P.; Xavier, L.; Christophe, F.; Nader, K.; Phuc Félix, N.T.; Chang-Shu, W.; Sultanem, K. Data from Head-Neck-PET-CT; The Cancer Imaging Archive: Manchester, NH, USA, 2017. [Google Scholar]
- Vallieres, M.; Kay-Rivest, E.; Perrin, L.J.; Liem, X.; Furstoss, C.; Aerts, H.J.; Khaouam, N.; Nguyen-Tan, P.F.; Wang, C.S.; Sultanem, K.; et al. Radiomics strategies for risk assessment of tumour failure in head-and-neck cancer. Sci. Rep. 2017, 7, 1–14. [Google Scholar] [CrossRef] [Green Version]
- Wee, L.; Dekker, A. Data from Head-Neck-Radiomics-HN1; The Cancer Imaging Archive: Manchester, NH, USA, 2019. [Google Scholar]
- Aerts, H.J.; Velazquez, E.R.; Leijenaar, R.T.; Parmar, C.; Grossmann, P.; Carvalho, S.; Bussink, J.; Monshouwer, R.; Haibe-Kains, B.; Rietveld, D.; et al. Decoding tumour phenotype by noninvasive imaging using a quantitative radiomics approach. Nat. Commun. 2014, 5, 1–9. [Google Scholar] [CrossRef]
- Park, S.H.; Han, K. Methodologic guide for evaluating clinical performance and effect of artificial intelligence technology for medical diagnosis and prediction. Radiology 2018, 286, 800–809. [Google Scholar] [CrossRef]
- Tran, D.; Bourdev, L.; Fergus, R.; Torresani, L.; Paluri, M. C3D: Generic Features for Video Analysis. CoRR 2017, 2, 8. [Google Scholar]
- Karpathy, A.; Toderici, G.; Shetty, S.; Leung, T.; Sukthankar, R.; Fei-Fei, L. Large-Scale Video Classification with Convolutional Neural Networks. In Proceedings of the 2014 IEEE Conference on Computer Vision and Pattern Recognition, Columbus, OH, USA, 23–28 June 2014; pp. 1725–1732. [Google Scholar]
- Simonyan, K.; Zisserman, A. Very Deep Convolutional Networks for Large-Scale Image Recognition. arXiv 2014, arXiv:1409.1556. [Google Scholar]
- Raghu, M.; Zhang, C.; Kleinberg, J.; Bengio, S. Transfusion: Understanding transfer learning for medical imaging. arXiv 2019, arXiv:1902.07208. [Google Scholar]
- Lu, L.; Ehmke, R.C.; Schwartz, L.H.; Zhao, B. Assessing agreement between radiomic features computed for multiple CT imaging settings. PLoS ONE 2016, 11, e0166550. [Google Scholar] [CrossRef] [Green Version]
- Zhao, B.; Tan, Y.; Tsai, W.Y.; Schwartz, L.H.; Lu, L. Exploring variability in CT characterization of tumors: A preliminary phantom study. Transl. Oncol. 2014, 7, 88–93. [Google Scholar] [CrossRef] [Green Version]
- Larue, R.T.; van Timmeren, J.E.; de Jong, E.E.; Feliciani, G.; Leijenaar, R.T.; Schreurs, W.M.; Sosef, M.N.; Raat, F.H.; van der Zande, F.H.; Das, M.; et al. Influence of gray level discretization on radiomic feature stability for different CT scanners, tube currents and slice thicknesses: A comprehensive phantom study. Acta Oncol. 2017, 56, 1544–1553. [Google Scholar] [CrossRef]
- Ger, R.B.; Zhou, S.; Chi, P.C.M.; Lee, H.J.; Layman, R.R.; Jones, A.K.; Goff, D.L.; Fuller, C.D.; Howell, R.M.; Li, H.; et al. Comprehensive investigation on controlling for CT imaging variabilities in radiomics studies. Sci. Rep. 2018, 8, 1–14. [Google Scholar] [CrossRef] [Green Version]
- Hendrycks, D.; Dietterich, T. Benchmarking Neural Network Robustness to Common Corruptions and Perturbations. arXiv 2019, arXiv:1903.12261. [Google Scholar]
- Kurakin, A.; Goodfellow, I.; Bengio, S. Adversarial examples in the physical world. arXiv 2016, arXiv:1607.02533. [Google Scholar]
- Hendrycks, D.; Lee, K.; Mazeika, M. Using Pre-Training Can Improve Model Robustness and Uncertainty. Int. Conf. Mach. Learn. 2019, 97, 2712–2721. [Google Scholar]
- Goldenberg, D.; Begum, S.; Westra, W.H.; Khan, Z.; Sciubba, J.; Pai, S.I.; Califano, J.A.; Tufano, R.P.; Koch, W.M. Cystic lymph node metastasis in patients with head and neck cancer: An HPV-associated phenomenon. Head Neck J. Sci. Spec. Head Neck 2008, 30, 898–903. [Google Scholar] [CrossRef]
- Begum, S.; Gillison, M.L.; Ansari-Lari, M.A.; Shah, K.; Westra, W.H. Detection of human papillomavirus in cervical lymph nodes: A highly effective strategy for localizing site of tumor origin. Clin. Cancer Res. 2003, 9, 6469–6475. [Google Scholar] [PubMed]
- Leijenaar, R.T.; Carvalho, S.; Hoebers, F.J.; Aerts, H.J.; Van Elmpt, W.J.; Huang, S.H.; Chan, B.; Waldron, J.N.; O’sullivan, B.; Lambin, P. External validation of a prognostic CT-based radiomic signature in oropharyngeal squamous cell carcinoma. Acta Oncol. 2015, 54, 1423–1429. [Google Scholar] [CrossRef] [PubMed] [Green Version]
- Leijenaar, R.T.; Bogowicz, M.; Jochems, A.; Hoebers, F.J.; Wesseling, F.W.; Huang, S.H.; Chan, B.; Waldron, J.N.; O’Sullivan, B.; Rietveld, D.; et al. Development and validation of a radiomic signature to predict HPV (p16) status from standard CT imaging: A multicenter study. Br. J. Radiol. 2018, 91, 20170498. [Google Scholar] [CrossRef] [PubMed]
- Lydiatt, W.M.; Patel, S.G.; O’Sullivan, B.; Brandwein, M.S.; Ridge, J.A.; Migliacci, J.C.; Loomis, A.M.; Shah, J.P. Head and neck cancers—major changes in the American Joint Committee on cancer eighth edition cancer staging manual. CA A Cancer J. Clin. 2017, 67, 122–137. [Google Scholar] [CrossRef] [PubMed]
- Wasylyk, B.; Abecassis, J.; Jung, A.C. Identification of clinically relevant HPV-related HNSCC: In p16 should we trust? Oral Oncol. 2013, 49, e33–e37. [Google Scholar] [CrossRef]
- Westra, W.H. Detection of human papillomavirus (HPV) in clinical samples: Evolving methods and strategies for the accurate determination of HPV status of head and neck carcinomas. Oral Oncol. 2014, 50, 771–779. [Google Scholar] [CrossRef] [Green Version]
- Qureishi, A.; Mawby, T.; Fraser, L.; Shah, K.A.; Møller, H.; Winter, S. Current and future techniques for human papilloma virus (HPV) testing in oropharyngeal squamous cell carcinoma. Eur. Arch. Oto-Rhino 2017, 274, 2675–2683. [Google Scholar] [CrossRef]
- Maniakas, A.; Moubayed, S.P.; Ayad, T.; Guertin, L.; Nguyen-Tan, P.F.; Gologan, O.; Soulieres, D.; Christopoulos, A. North-American survey on HPV-DNA and p16 testing for head and neck squamous cell carcinoma. Oral Oncol. 2014, 50, 942–946. [Google Scholar] [CrossRef]
Figure 1.
The convolutional neural networks. With (a), the network pre-training on the video data of the 1M sports data set. All convolutional layers (Conv) were kept fix, while the fully connected layers (Dense) were replace by randomly initialized ones. (b) shows the CNN trained with all layers randomly initialized. Network size was reduced in comparison to (a), max-pooling (Pool) was applied earlier and dropout (Drop) was already used in the last convolutional layer. (c) the 2D architecture, pre-trained on ImageNet. As base line model VGG16 was used, all convolutional layers were kept fixed, dense layers were replaced and randomly initialized.

Figure 2.
Combined receiver operating characteristics (ROC) plots and AUC score box plots of the test set for the three different models. The ROC plots represent the mean curve of the ten times that models were trained, the shadowed area represents the minimal and maximal curves. Boxes represent lower and upper quartiles, whiskers minimal and maximal values. Median (min, max) AUC score for the video pre-trained model was given by 0.82 (0.77, 0.84). The 3D network trained from scratch and the 2D ImageNet pre-trained model reached an AUC score of 0.65 (0.56, 0.70) and 0.73 (0.70, 0.75), respectively.


Table 1.
Patient information for the different cohorts. Continuous variables are represented by mean values and ranges by (–), with and being the 25th and 75th percentiles, respectively.
Table 1.
Patient information for the different cohorts. Continuous variables are represented by mean values and ranges by (–), with and being the 25th and 75th percentiles, respectively.
| 2lClinical Variable | Training Set | Validation Set | Test Set | ||
|---|---|---|---|---|---|
| Cohort | OPC | HNSCC | HN PET-CT | HN1 | |
| Number of patients | 412 | 263 | 90 | 80 | |
| HPV: pos/neg | 290/122 | 223/40 | 71/19 | 23/57 | |
| HPV status | |||||
| Age | |||||
| pos | 58.81 (52.00–64.75) | 57.87 (52.00–64.00) | 62.32 (58.00–66.00) | 57.52 (52.00–62.50) | |
| neg | 64.82 (58.00–72.75) | 60.02 (54.50–67.25) | 59.11 (49.50–69.50) | 60.91 (56.00–66.00) | |
| Sex: Female/Male | |||||
| pos | 47/243 | 32/191 | 14/56 | 5/18 | |
| neg | 34/88 | 15/25 | 4/15 | 12/45 | |
| T-stage: T1/T2/T3/T4 | |||||
| pos | 46/93/94/57 | 60/93/41/29 | 10/37/15/9 | 4/8/9/8 | |
| neg | 9/35/43/35 | 6/12/12/10 | 3/4/8/4 | 9/16/9/23 | |
| N-stage: N0/N1/N2/N3 | |||||
| pos | 33/22/215/20 | 19/30/170/4 | 11/10/47/3 | 6/2/15/0 | |
| neg | 36/16/62/8 | 5/2/31/2 | 2/1/13/3 | 14/10/31/2 | |
| Tumor size [cm] | |||||
| pos | 29.35 (10.52–37.78) | 11.78 (3.94–14.04) | 34.63 (14.91–41.77) | 23.00 (10.83–34.29) | |
| neg | 36.99 (15.72–45.35) | 23.57 (5.80–22.85) | 35.09 (17.32–47.82) | 40.19 (11.77–54.42) | |
| transversal voxel spacing [mm] | 0.97 (0.98–0.98) | 0.59 (0.49–0.51) | 1.06 (0.98–1.17) | 0.98 (0.98–0.98) | |
| longitudinal voxel spacing [mm] | 2.00 (2.00–2.00) | 1.53 (1.00-2.50) | 2.89 (3.00–3.27) | 2.99 (3.00–3.00) | |
| manufacturer | |||||
| GE Med. Sys. | 272 | 238 | 45 | 0 | |
| Toshiba | 138 | 3 | 0 | 0 | |
| Philips | 2 | 12 | 45 | 0 | |
| CMS Inc. | 0 | 0 | 0 | 43 | |
| Siemens | 0 | 4 | 0 | 37 | |
| other | 0 | 6 | 0 | 0 | |
Table 2.
Test results for the three different models. Scores represent mean (std) values for the ten times each model was trained.
Table 2.
Test results for the three different models. Scores represent mean (std) values for the ten times each model was trained.
| Metric | 3D Video Pre-Trained | 3D from Scratch | 2D ImageNet Pre-Trained |
|---|---|---|---|
| AUC | 0.81 (0.02) | 0.64 (0.05) | 0.73 (0.02) |
| sensitivity | 0.75 (0.06) | 0.67 (0.12) | 0.84 (0.07) |
| specificity | 0.72 (0.09) | 0.49 (0.09) | 0.40 (0.13) |
| PPV | 0.53 (0.07) | 0.35 (0.03) | 0.37 (0.04) |
| NPV | 0.88 (0.02) | 0.79 (0.05) | 0.87 (0.03) |
| score | 0.62 (0.02) | 0.45 (0.05) | 0.51 (0.03) |
Publisher’s Note: MDPI stays neutral with regard to jurisdictional claims in published maps and institutional affiliations. |
© 2021 by the authors. Licensee MDPI, Basel, Switzerland. This article is an open access article distributed under the terms and conditions of the Creative Commons Attribution (CC BY) license (http://creativecommons.org/licenses/by/4.0/).
Share and Cite
MDPI and ACS Style
Lang, D.M.; Peeken, J.C.; Combs, S.E.; Wilkens, J.J.; Bartzsch, S. Deep Learning Based HPV Status Prediction for Oropharyngeal Cancer Patients. Cancers 2021, 13, 786. https://doi.org/10.3390/cancers13040786
AMA Style
Lang DM, Peeken JC, Combs SE, Wilkens JJ, Bartzsch S. Deep Learning Based HPV Status Prediction for Oropharyngeal Cancer Patients. Cancers. 2021; 13(4):786. https://doi.org/10.3390/cancers13040786
Chicago/Turabian StyleLang, Daniel M., Jan C. Peeken, Stephanie E. Combs, Jan J. Wilkens, and Stefan Bartzsch. 2021. "Deep Learning Based HPV Status Prediction for Oropharyngeal Cancer Patients" Cancers 13, no. 4: 786. https://doi.org/10.3390/cancers13040786
Note that from the first issue of 2016, this journal uses article numbers instead of page numbers. See further details here.