Article

The Genomic, Transcriptomic, and Immunologic Landscape of HRAS Mutations in Solid Tumors

1
Department of Graduate Medical Education, University of Miami Sylvester Comprehensive Cancer Center/Jackson Memorial Hospital, Miami, FL 33136, USA
2
Caris Life Sciences, Phoenix, AZ 85040, USA
3
Division of Medical Oncology, Department of Medicine, University of Miami Sylvester Comprehensive Cancer Center, Miami, FL 33136, USA
4
Division of Translational Molecular Medicine, St. Johns’ Cancer Institute at Providence Saint John’s Health Center, Santa Monica, CA 90404, USA
5
Department of Medicine, Lifespan Cancer Institute, Providence, RI 02903, USA
6
Division of Hematology, Oncology, and Transplantation, University of Minnesota Masonic Cancer Center, Minneapolis, MN 55455, USA
7
Division of Medical Oncology, Rutgers University, New Brunswick, NJ 08901, USA
*
Author to whom correspondence should be addressed.
These authors contributed equally to this work.
Cancers 2024, 16(8), 1572; https://doi.org/10.3390/cancers16081572
Submission received: 22 March 2024 / Revised: 15 April 2024 / Accepted: 16 April 2024 / Published: 19 April 2024
(This article belongs to the Special Issue New Findings in Targeting Cancer Proteins)

Abstract

:

Simple Summary

In the era of precision medicine, translational oncology seeks to identify new, targeted therapies for tumors with rare genetic mutations. Patients receiving targeted therapy are known to have better outcomes (i.e., live longer and better) compared to those receiving non-targeted therapies. In this analysis, we retrospectively analyzed 63,873 tumor tissues to better understand the rare HRAS mutation. We found that only 0.8% of tumors are HRAS mutant, and these tumors look different at the molecular level and behave differently on a clinical level. Targeted therapies for patients with HRAS mutations, such as tipifarnib, currently exist and are being tested in various tumor types. Our study seeks to add to the limited information currently known about this rare genetic mutation.

Abstract

Tipifarnib is the only targeted therapy breakthrough for HRAS-mutant (HRASmt) recurrent or metastatic head and neck squamous cell carcinoma (HNSCC). The molecular profiles of HRASmt cancers are difficult to explore given the low frequency of HRASmt. This study aims to understand the molecular co-alterations, immune profiles, and clinical outcomes of 524 HRASmt solid tumors including urothelial carcinoma (UC), breast cancer (BC), non-small-cell lung cancer (NSCLC), melanoma, and HNSCC. HRASmt was most common in UC (3.0%), followed by HNSCC (2.82%), melanoma (1.05%), BC (0.45%), and NSCLC (0.44%). HRASmt was absent in Her2+ BC regardless of hormone receptor status. HRASmt was more frequently associated with squamous compared to non-squamous NSCLC (60% vs. 40% in HRASwt, p = 0.002). The tumor microenvironment (TME) of HRASmt demonstrated increased M1 macrophages in triple-negative BC (TNBC), HNSCC, squamous NSCLC, and UC; increased M2 macrophages in TNBC; and increased CD8+ T-cells in HNSCC (all p < 0.05). Finally, HRASmt was associated with shorter overall survival in HNSCC (HR: 1.564, CI: 1.16–2.11, p = 0.003) but not in the other cancer types examined. In conclusion, this study provides new insights into the unique molecular profiles of HRASmt tumors that may help to identify new targets and guide future clinical trial design.

Graphical Abstract

1. Introduction

The KRAS, NRAS, and HRAS genes comprise the RAS family in humans, which encode four similar proteins: KRAS4A/B, NRAS, and HRAS [1]. RAS proteins regulate tumorigenesis [2] and, when activated, drive cellular processes such as proliferation, differentiation, cell adhesion, and cell migration via the mitogen-activated protein (MAP) kinase pathway [3]. RAS proteins are among the most frequently mutated in solid tumors [1], and targeted therapies against the activating mutation KRAS G12C are clinically active for various solid tumors including non-small-cell lung (sotorasib [4] and adagrasib [5]) and pancreatic (sotorasib [6]) cancers.
HRAS (Harvey rat sarcoma viral oncogene homolog) is a less commonly mutated RAS family member whose membrane localization and signaling are dependent on the post-translational addition of a farnesyl lipid moiety (farnesylation) [7,8]. The frequency of somatic HRAS mutations in solid tumors has been estimated to be between 1.0 and 6.9% [9,10] depending on the cohort of patients studied. Tipifarnib, a farnesyltransferase inhibitor (FTI) affecting the post-translational modification of HRAS to prevent membrane binding, demonstrated clinical activity in an open-label Phase-II study of patients with HRAS-mutated (HRASmt) head and neck cancer, with an objective response rate of 55% [11]. This agent later gained breakthrough therapy designation by the United States Food and Drug Administration (FDA) in February 2021 for patients with head and neck squamous cell carcinoma with a tumor variant allele frequency (VAF) > 20% after progression on platinum-based chemotherapy based on the clinical trial NCT02383927 [11]. As of August 2023, there are at least four active clinical trials evaluating tipifarnib in other tumor types, including non-small-cell lung cancer (NSCLC) (NCT03496766), lymphoma or histiocytic disorders (NCT04284774), urothelial carcinoma (NCT02535650), and advanced solid malignancies (NCT04284774 and NCT04865159).
Given the prevalence of HRASmt in other solid tumors, we sought to investigate the molecular characteristics and clinical outcomes of HRASmt in five solid tumor types to determine the prevalence of HRASmt, interrogate molecular co-alterations, and explore the potential role of HRASmt as a prognostic or therapeutic biomarker.

2. Materials and Methods

2.1. Cohort Information and Tumor Types

Urothelial carcinoma (N = 4605, UC), breast cancer (N = 15,834, BC), non-small-cell lung cancer (N = 34,310, NSCLC), melanoma (N = 5217), and head and neck squamous cell carcinoma (N = 3907, HNSCC) tumors that underwent comprehensive at Caris Life Sciences (Phoenix, AZ, USA) were included in this study. BC tumors were divided based on receptor subtypes (i.e., hormone receptor [HR]+, Her2+, and triple-negative breast cancer [TNBC]). NSCLC tumors were divided into adenocarcinoma, squamous cell carcinoma, and others based on histology.

2.2. Next-Generation Sequencing-592 Gene Panel (NGS-592)/Whole Exome Sequencing (WES)

NGS-592 or whole exome sequencing (WES) was performed for 191,767 solid tumors sequenced at Caris Life Sciences. These assays and their analyses were recently reported [12].
WES was performed on genomic DNA isolated from a micro-dissected, FFPE tumor sample using the Illumina NovaSeq 6000 sequencers (Illumina, Inc.; San Diego, CA, USA). A hybrid pull-down panel of baits designed to enrich for 700 clinically relevant genes at high coverage and high read-depths was used, along with another panel designed to enrich for an additional >20,000 genes at a lower depth. The performance of the WES assay was validated for sequencing variants, copy number alteration, tumor mutational burden (TMB), and microsatellite instability (MSI). The WES assay was validated to 50 ng of input and had a positive predictive value of 0.99 against a previously validated NGS assay. WES can detect variants in samples with tumor nuclei as low as 20% and detects down to a 5% variant frequency, with an average depth of at least 500×.

2.3. Identification of Genetic Variants

The genetic variants identified were interpreted by board-certified molecular geneticists and categorized as ‘pathogenic’, ‘likely pathogenic’, ‘variant of unknown significance’, ‘likely benign’, or ‘benign’, according to the American College of Medical Genetics and Genomics (ACMG) standards. When assessing mutation frequencies of individual genes, ’pathogenic’, and ‘likely pathogenic’ were counted as mutations (mt), while ‘benign’ and ‘likely benign’ variants and ‘variants of unknown significance’ (VUS) were excluded. HRAS pathogenic mutants were further divided based on the affected amino acid (Q61, G12, G13, and miscellaneous [for all the mutations that were not present in Q61, G12, or G13]) (Table A1).

2.4. Whole Transcriptome Sequencing

FFPE specimens underwent pathology review to diagnose the percentage tumor content and tumor size. A minimum of 10% of tumor content in the area for microdissection was required to enable the enrichment and extraction of tumor-specific RNA. A Qiagen RNA FFPE tissue extraction kit was used, and the RNA quality and quantity were determined using the Agilent TapeStation. Biotinylated RNA baits were hybridized to the synthesized and purified cDNA targets, and the bait–target complexes were amplified in a post-capture PCR reaction. The resultant libraries were quantified and normalized, and the pooled libraries were denatured, diluted, and sequenced. Transcriptions per million molecules (TPM) were generated using the Salmon expression pipeline for transcript counting.

2.5. Immune Signatures

Immune cell fraction was calculated via the deconvolution of WTS data using quanTIseq. QuanTIseq is an immune deconvolution algorithm that utilizes RNA transcripts known to be expressed in specific immune cell types to deconvolute bulk RNA sequencing data and predict the different immune cell fraction present in the bulk RNA sequencing data [13]. WTS data were also used to calculate a T-cell-inflamed score, as previously described [14].

2.6. Microsatellite Insability/Mismatch Repair Deficiency (MSI-h/MMR) Status

A combination of multiple test platforms was used to determine MSI-H or dMMR status of the tumors profiled, including fragment analysis (FA; Promega, Madison, WI, USA), immunohistochemistry (IHC; MLH1, M1 antibody; MSH2, G2191129 antibody; MSH6, 44 antibody; and PMS2, EPR3947 antibody [Ventana Medical Systems, Inc., Tucson, AZ, USA]), and NGS (>2800 target microsatellite loci were examined and compared to the reference genome hg19 from the University of California). The two platforms generated highly concordant results, as previously reported, and in rare cases of discordant results, the MSI-H or MMR status of the tumor was determined in the order of IHC and NGS.

2.7. Tumor Mutational Burden (TMB)

TMB was measured by counting all non-synonymous missense, nonsense, inframe insertion/deletion, and frameshift mutations found per tumor that had not been previously described as germline alterations in dbSNP151 or the Genome Aggregation Database (gnomAD) or benign variants identified by Caris’ geneticists. A cutoff point of 10 mutations (mt) per MB was used based on the KEYNOTE-158 pembrolizumab trial, which showed that patients with a TMB of ≥10 mt/MB (TMB-H) across several tumor types had higher response rates than patients with a TMB of <10 mt/MB [15,16].

2.8. Immunohistochemistry (IHC)

IHC was performed on FFPE sections of glass slides. Slides were stained using automated staining techniques, per the manufacturer’s instructions, and optimized and validated per CLIA/CAP and ISO requirements. Staining was scored for intensity (0 = no staining; 1+ = weak staining; 2+ = moderate staining; 3+ = strong staining) and percentage (0–100%). PD-L1 (SP142) positive (+) staining was defined as ≥2+ and ≥5%, and 22c3 (+) was defined as TPS ≥1%. ER or PR + was defined as ≥1+ and ≥1%. HER2/Neu + was defined as ≥3+ and >10%.

2.9. Clinical Outcomes

Real-world overall survival was obtained from insurance claims and calculated from tissue collection to last contact. This surrogate outcome has been utilized previously [17]. Kaplan–Meier estimates were calculated for molecularly defined patients.

2.10. Statistics and Reproducibility

Descriptive analyses were conducted utilizing the Mann–Whitney U (scipy V.1.9.3) and X2/Fisher Exact tests (R v.3.6.1) for continuous and categorical variables, respectively. p-values were adjusted for multiple comparisons, with p < 0.05 considered significant.

3. Results

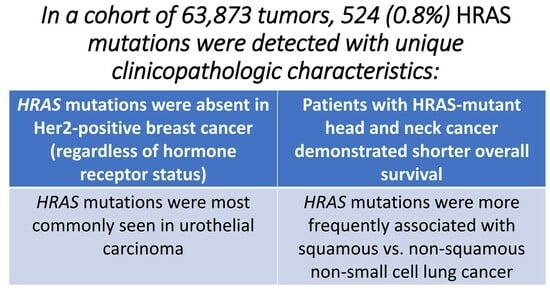
3.1. Prevlance of HRASmt and Characteristics of Cohort

The Caris Life Sciences biobank was queried for the frequency of HRASmt. Five tumor types with the highest number of HRASmt cases were chosen for a deeper analysis of their molecular and immunologic landscapes. A total of 63,873 tumor tissues were analyzed, and among the entire cohort, 0.82% of tumors were HRASmt. HRASmt (total N = 524) accounted for 3.0% of urothelial carcinomas (UC, N = 4605), 0.50% of breast cancer cases (BC, N = 15,843), 0.44% of non-small-cell lung cancer cases (NSCLC, N = 34,310), 1.05% of melanomas (N = 5217), and 2.82% of HNSCCs (N = 3907) (Table 1). The median age in years of patients at the time of specimen collection was 72 in UC, 60 in BC, 69 in NSCLC, 67 in melanoma, and 64 in HNSCC. Aside from BC, only HNSCC demonstrated significantly greater HRASmt prevalence among females (37.3% vs. 23.0%, p = 0.001). Among BC subtypes, HRASmt cancers were exclusively observed in hormone receptor-positive (HR+)/Her2- (17/8057, 0.21%,) and triple-negative (TNBC) (54/4457, 1.21%) cases. HRASmt were absent in Her2+ BC, irrespective of HR expression (0/1210, 0%). A significantly higher proportion of HRASmt cancers were squamous NSCLC (90/150, 60% total) versus non-squamous NSCLC (60/150, 40%, p = 0.002).
The distribution of HRAS codon mutations varied by cancer type, with a higher prevalence of HRAS G13 mutations in HNSCC (42/112, 37.5%), squamous NSCLC (41/90, 45.6%), and melanoma (22/55, 40%) and a higher prevalence of Q61 mutations in non-squamous NSCLC (18/34, 52.9%) compared to other mutations (Figure 1A). HRAS expression was significantly higher in HRASmt compared to HRASwt tumors (transcripts per parts million [TPM]) among all investigated tumor types (Figure 1B). Notably, there was minimal variation (not significant, p > 0.05) in HRAS expression across the investigated mutation types, except for UC, in which the G12 mutation had significantly higher expression compared to HRAS Q61 and G13 mutations (p < 0.05, Figure 1C).

3.2. HRASmt Co-Alterations and Biomarkers

TP53 mutations were significantly more prevalent in HRASwt for both TNBC and UC. RB1 mutations were more common in HRASwt UC. PIK3CA and PIK3R1 mutations were more prevalent in HRASmt TNBC only. RAF1 and BRAF mutations had a higher prevalence in HRASmt melanoma and UC, respectively, whereas NRAS mutations were more prevalent in HRASwt melanoma. Increased copy number alterations of FGF19, FGF3, FGF4, and CCND1 (all located on 11q13 amplicon) were observed in HRASwt HNSCC. HNSCC HRASmt had an increased prevalence of the TERT promoter, FAT1, NOTCH1, CASP8, and CTCF mutations (Figure 2, p < 0.05 for all). The prevalence of KRAS mutation was not significantly different between HRASmt and HRASwt tumors across all investigated tumor types. However, significant differences in the prevalence of KRASmt G12C were observed in HRASmt vs. HRASwt in HR+/HER2- BC (5.9 vs. 0.1%), HNSCC (2.7 vs. 0.1%), squamous NSCLC (8.9 vs. 2.6%), and UC (5.8 vs. 0.4%) (all p < 0.05).
No significant difference in the prevalence of PD-L1-positive tumors was observed via IHC between HRASmt and HRASwt tumors (Figure 3A, p > 0.05). Additionally, there was no significant difference in the prevalence of mismatch repair deficiency/high microsatellite instability (dMMR/MSI-H) (Figure 3B, p > 0.05) or high tumor mutational burden (TMB-H) (Figure 3C, p > 0.05) among HRASmt compared to HRASwt tumors.

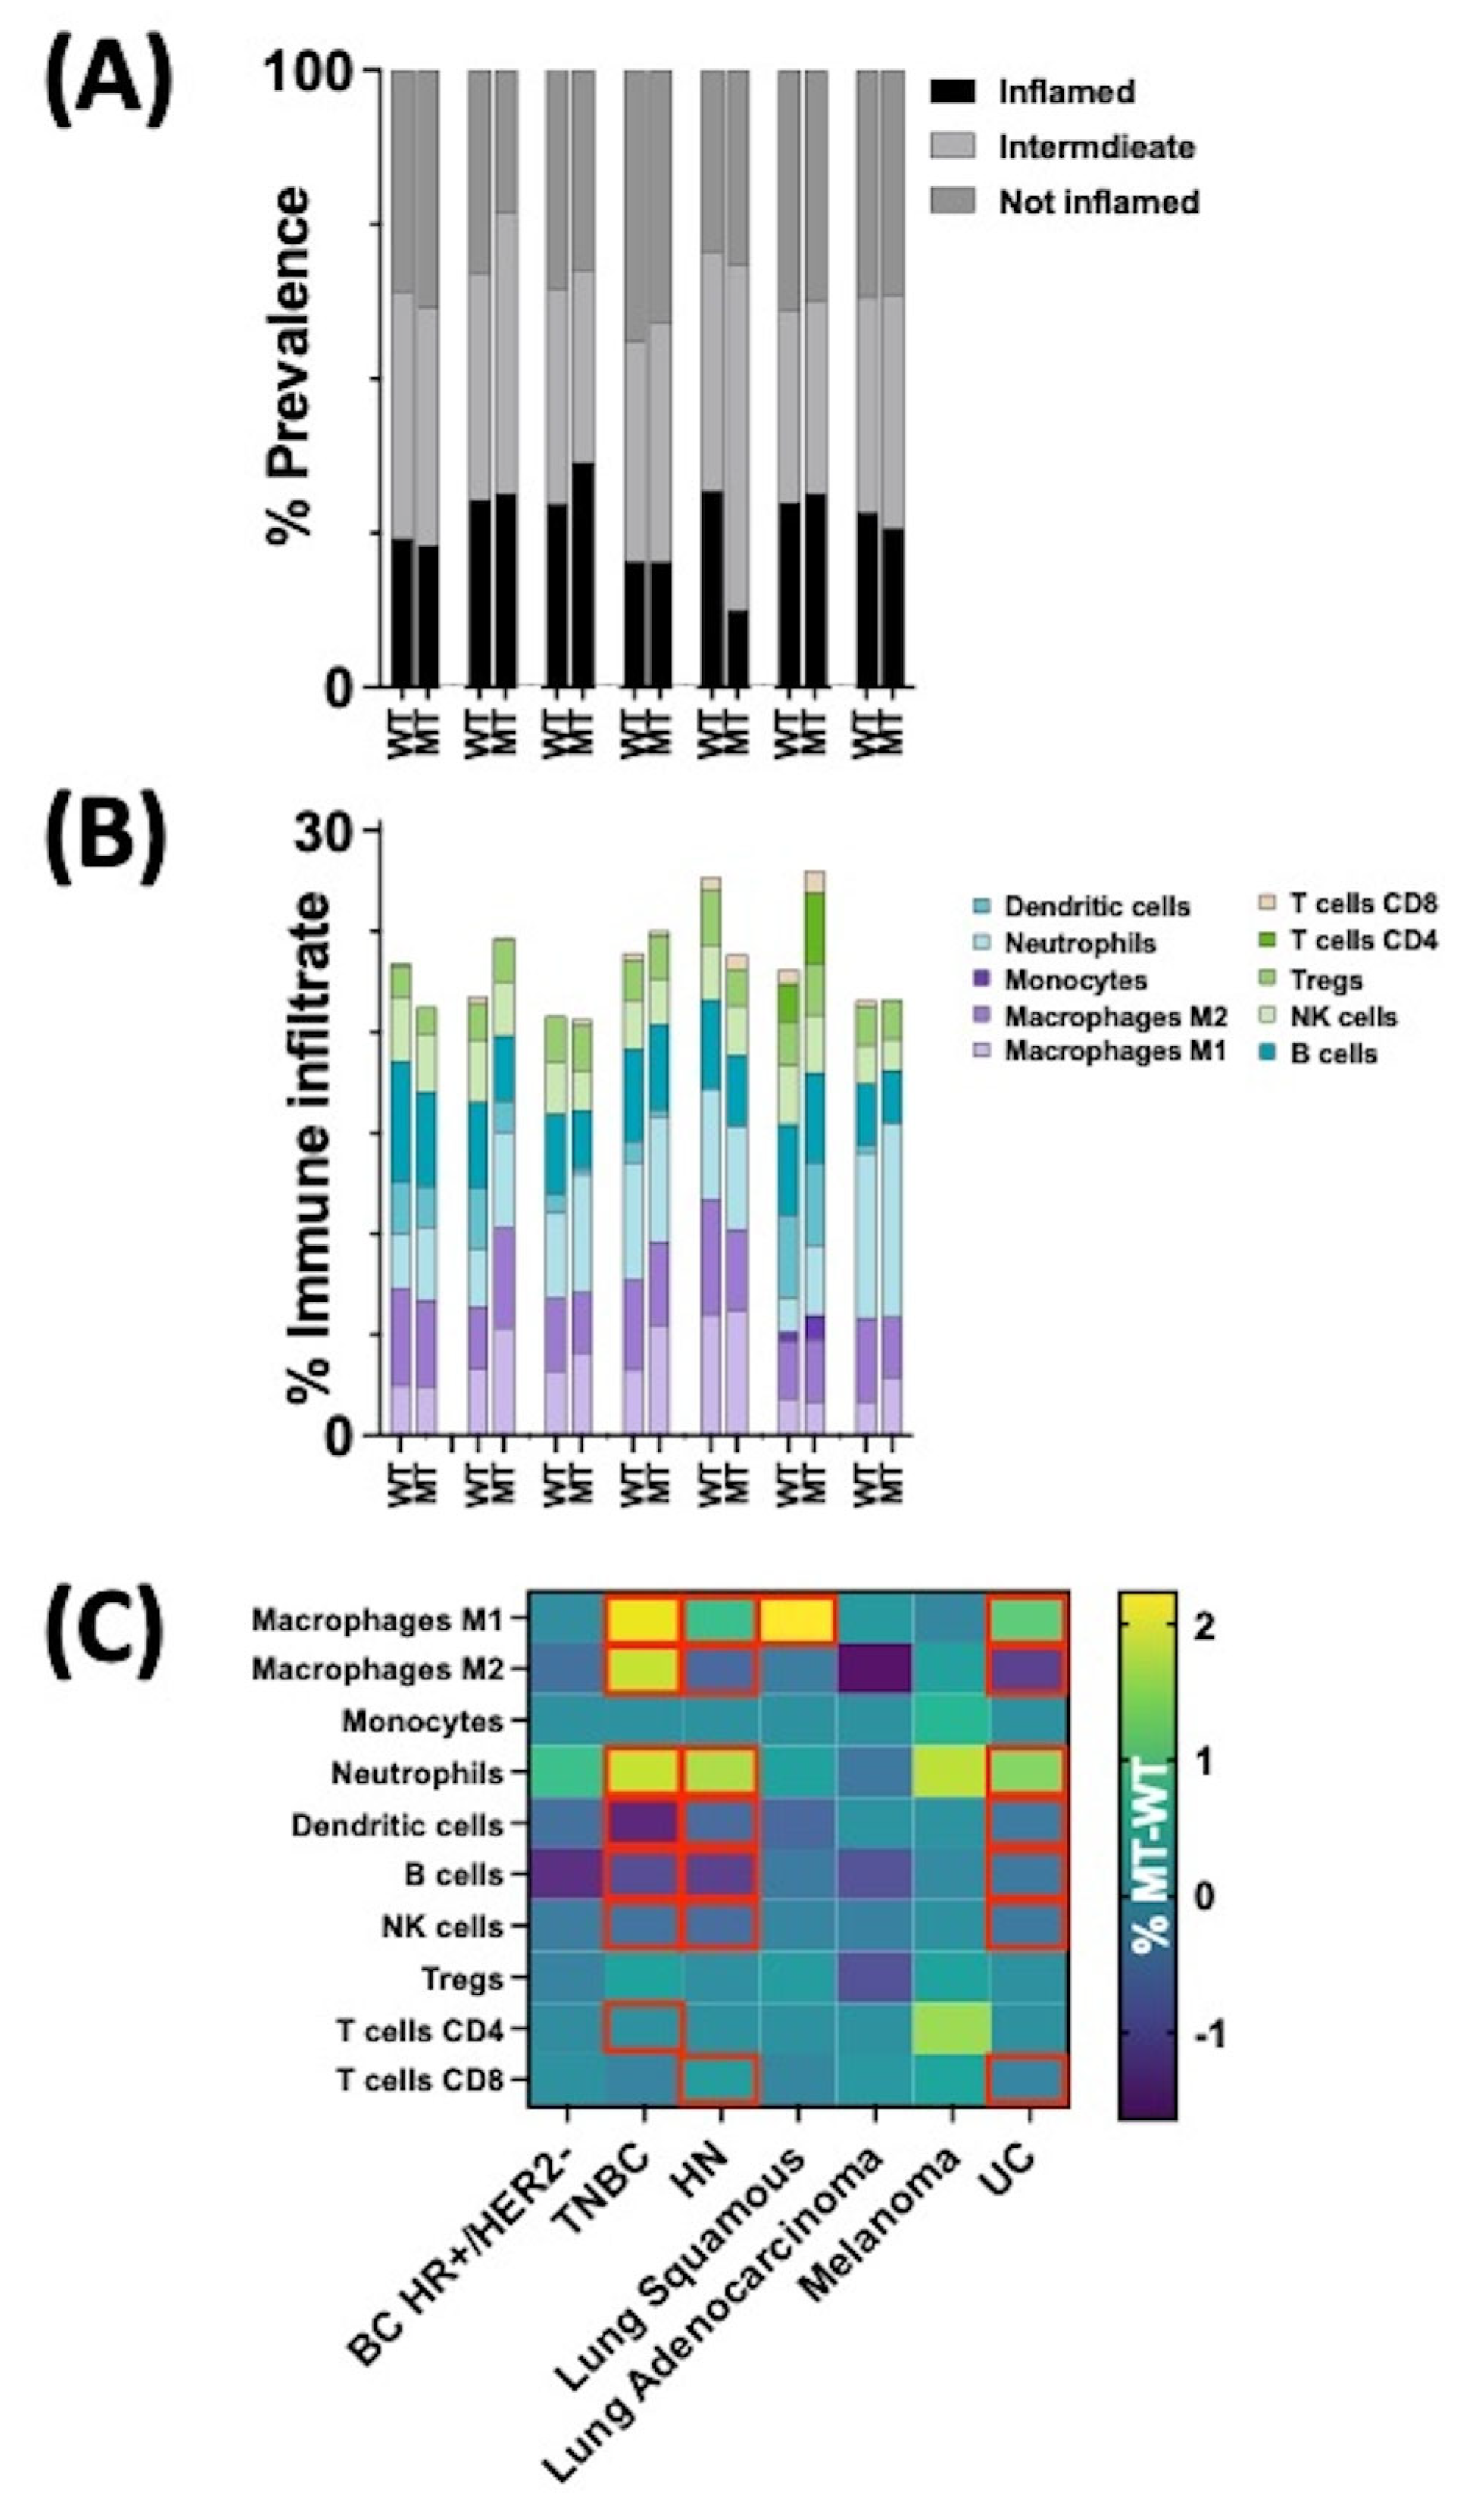
3.3. Tumor Microenvironment (TME) of HRASmt

No statistically significant difference in the prevalence of T-cell-inflamed tumors between HRASmt and HRASwt tumors was observed (Figure 4A, p > 0.05). TNBC, HNSCC, and UC tumors had distinct tumor microenvironments (TMEs) between HRASmt and HRASwt tumors. Using quanTIseq immune deconvolution to infer the prevalence of immune infiltrates, M1 macrophage immune infiltrates were significantly higher in HRASmt versus HRASwt tumors for TNBC, HNSCC, squamous NSCLC, and UC. M2 macrophage immune infiltrates were more prevalent in HRASmt TNBC tumors but were less prevalent in HNSCC and UC tumors. Neutrophil infiltrates were more prevalent in HRASmt TNBC, HNSCC, and UC tumors. Conversely, in the TME of HRASwt TNBC, HNSCC, and UC, dendritic cell infiltrates, B cells, and NK cells were more prevalent. Finally, CD8+ T-cell infiltrates were more prevalent in HRASmt HNSCC but less common in HRASmt UC (p < 0.05 for all described, Figure 4B,C).

3.4. Clinical Outcomes

Overall survival (OS) was significantly shorter for HRASmt versus HRASwt HNSCC (HR: 1.564, CI: 1.16–2.11, p = 0.003) (Figure 5B). Shorter OS in HRASmt was not associated with any specific HRAS codon mutations in HNSCC (Figure A1). Shorter OS in HRASmt was demonstrated regardless of exposure to cetuximab (no cetuximab HR: 1.515; cetuximab HR: 2.084) or immune checkpoint inhibitors (ICI) (no ICI HR 1.455; ICI HR 1.961) (all p < 0.05) (Figure A2). Worse outcomes were also observed with HRASmt HNSCC treated with chemotherapy (HR 1.909, p = 0.004); this trend was not seen for samples without chemotherapy exposure (HR 1.407, p = 0.097) (Figure A2). No significant differences in OS were seen in the other tumor types studied when comparing HRASmt with HRASwt (Figure 5A, Table 2, and Figure A1).

4. Discussion

We highlighted the prevalence, characteristics, and outcomes of HRASmt tumors. Among the entire cohort, 0.82% of tumors were HRASmt. This estimate is slightly lower than previously described [9]. However, the disease-specific prevalences reported in this study of 3.0% in UC, 2.82% in HNSCC, and 1.05% in melanoma mirror the literature [18,19,20,21].
Various HRAS codon mutations have been investigated for molecular targeting. For example, HRAS Q61L has been considered as a possible target in NSCLC [22] given the particularly poor prognosis and clinical features described in the literature. This target has also been previously described as a candidate for treatment in rare BC histologies [23]. Within all BCs, HRASmt BCs were mutually exclusive with the Her2+ subtype. This is in line with the biology of Her2+ BC, which is primarily driven by the activation of c-Src and not the MAP kinase pathway [24]. However, Her2+ BC may be under-represented in this dataset. Our analysis included 8.8% Her2+ BC, lower than the 15–20% prevalence of Her2+ BC typically reported. This discrepancy may reflect patterns of genomic profiling utilization in clinical practice [25]. Conversely, rarer BC subtypes, such as malignant breast adenomyoepithelioma, are known to be driven by the MAP kinase pathway alterations, such as HRAS Q61 recurrent hotspot mutations [26]. Next, there was a statistically higher prevalence of HRASmt in squamous compared to non-squamous NSCLC. In contrast to our cohort, previous studies suggested that HRASmt was more prevalent in non-squamous (i.e., adenocarcinoma) NSCLC, likely due to a lower sample size in this prior publication (N = 39 vs. the current study, N = 34,310 [27]. Given these findings, HRASmt may represent a key therapeutic target in HR+ BC, TNBC, and squamous NSCLC.
There was a significant association between TP53mt and HRASwt in TNBC and UC. In line with this observation, a tendency towards mutual exclusivity between TP53mt and HRASmt in UC has been previously reported in the literature [28]. With inhibitors for TP53wt HRASmt UC under development [29], our results provide further evidence for targeting HRASmt UC. Finally, the alterations observed in our HNSCC cohort echo a previously reported dataset in which CASP8, TERT, and NOTCH1 were also frequent co-mutations in HRASmt HNSCC, while CCND1 had higher amplification in HRASwt compared to HRASmt [20] (Figure 2). However, we also report a significantly increased co-occurrence of HRASmt with CTCF and FAT1 mutations (Figure 2). Finally, past work has suggested that RAS family mutations are mutually exclusive [30] or preferentially enriched for concomitant downstream RAS mutations (e.g., BRAF) [31]. However, the mutual exclusivity of RAS family mutations has come into question, especially given the prevalence of concomitant mutations in solid tumors such as colorectal cancer [32]. Our results confirm the presence of multiple isoforms of RAS mutations (i.e., KRASmt) within our cohort of HRASmt solid tumors, thereby refuting previous observations that RAS family mutations are mutually exclusive in solid tumors such as urothelial carcinoma [33].
While smaller cohorts of other tumors, such as medullary thyroid carcinoma [34], have reported significant associations with PD-L1 positivity and TMB and HRASmt status, our cohort clarifies that there was no statistical relationship demonstrated between these biomarkers and the investigated cancer types according to HRASmt status. Additionally, a relatively immunologically “cold” TME in HRASmt TNBC and UC was observed, as demonstrated by decreased CD4+ and CD8+ T cells in each cancer type, although none of these differences reached statistical significance. This observation suggests that certain ICIs, such as monotherapy with PD-(L)1 inhibitors, are unlikely to play a role in these HRASmt tumors. This is in contrast to a small cohort of HRASmt HCSCC that noted an increase in CD8+ T cells within the tumor microenvironment (TME), analyzed using the ESTIMATE immune score [35]. However, it is worth noting that the small cohort of HRASmt HNSCCs reporting these TME discrepancies with our study was treated with immune checkpoint inhibitors, including anti-PD-(L)1 and -CTLA-4 agents, prior to data acquisition [35,36].
HRASmt status was associated with poorer clinical outcomes in HNSCC, and no difference in OS was observed between the different HRAS codon mutations. Similar findings were recently reported for 249 HRASmt HNSCC samples with median disease-free survival (DFS) of 4.0 months and OS between 15 and 25.5 months [20], which were slightly longer than those observed in our cohort. This confirms the aggressive clinical nature of HRASmt HNSCC, as has been observed previously [37]. Moreover, there were poorer OS outcomes demonstrated for HRASmt HNSCC with (mOS 9.9 months, p = 0.028) or without (mOS 11.5 months, p = 0.015) exposure to cetuximab. This component of the EXTREME regimen [38] is typically reserved for second-line therapies and beyond and may be associated with other factors secondary to this subset of aggressive disease biology. A similar trend was seen with exposure to ICIs, again possibly reflecting acquired disease resistance.
Our findings support several therapeutic hypotheses and approaches. Tipifarnib initially demonstrated clinical activity in recurrent, metastatic HRASmt salivary gland cancer, paving the way for accelerated FDA approval for FTI [37]. Based on this success, FTIs have been touted as novel therapeutic approaches in other HRASmt cancers, such as rhabdomyosarcoma [39], UC [40], anaplastic [41] and dedifferentiated thyroid cancers [42], and salivary duct carcinoma [43]. It is important to note that FTIs act on farnesyl transferase (FT) and, therefore, have the potential for off-target toxicity, whereas other RAS-targeting inhibitors (e.g., sotorasib and adagrasib) bind directly to the mutated protein without similar side effects. Sotorasib and adagrasib have similar mechanisms of action through covalent binding of the cysteine 12 site within the KRAS G12C protein, rendering KRAS inactive and preventing cell proliferation, effectively halting cancer cell progression [44,45]. Because of the specific G12C biding activity, there is a marked reduction in off-target binding both in vitro and in vivo [45,46,47,48,49]. FTIs, however, may cause the displacement of HRASwt from cell membranes via the inhibition of FT, causing the destabilization of non-malignant cells [50]. Additionally, these more targeted agents have demonstrated clinical activity across a broader range of tumors compared to FTIs. In addition to the aforementioned studies in NSCLC (NCT03496766), lymphoma or histiocytic disorders (NCT04284774), UC (NCT02535650), and advanced solid malignancies (NCT04284774 and NCT04865159), our observations may guide additional investigation into the use of FTIs in HRASmt TNBC, HR+ BC, and squamous NSCLC.
Additional therapeutic targets and pathways might also be studied. HRASmt cancers have been posited as novel targets in vitro for MEK and mTOR inhibitors. The murine Ba/F3 cell line has demonstrated the increased sensitivity of both classes of drugs towards the HRAS isoforms Q16L, Q16R, and G12V [51]. Murine models have demonstrated activity of MEK inhibition alone in other HRASmt diseases, such as Costello syndrome [52]. Finally, mTOR inhibitors combined with ERK inhibition demonstrated activity against HRASmt G12V-driven autochthonous sarcoma [53]. Given the current approval of everolimus in the advanced/metastatic HR+ BC setting [54], future analyses may consider determining if HRASmt cancers serve as a predictor of response.
The limitations of our study include its retrospective analysis and use of surrogate measures (e.g., insurance claims) for outcomes. Furthermore, the five tumor types represented here may not represent the histologies with the highest absolute percentages of HRASmt. For example, pheochromocytomas demonstrate HRASmt at levels as high as 12.35% in publicly available datasets [55], though the absolute number of cases in our biobank limited this tumor’s inclusion. Moreover, our cohort lacks racial and ethnic data. HRASmt cancers are known to be more prevalent in Hispanic White and African American patients with HNSCC [56], for example, and our cohort cannot speculate on the racial or ethnic characteristics of the samples analyzed. Finally, the dataset utilized may under-represent Her2+ BC, as previously mentioned. This limitation may be ameliorated with future analyses given that standard-of-care molecular testing has now widely entered oncology practice. Future studies ought to consider prospective design, include demographic data, and propose solutions to ameliorate barriers to molecular testing.

5. Conclusions

To the best of our knowledge, our findings represent the largest cohort to date reporting on the genomic, transcriptomic, and immunologic landscapes of HRASmt solid tumors. The unique genomic and immunologic profiles of HRASmt tumors may guide researchers in identifying and trialing new targeted agents in this subset of molecularly driven cancers.

Author Contributions

S.A.K. and A.T. are co-first authors and major contributors to the manuscript. H.B.K. analyzed and interpreted the patient data, prepared Figures and Tables, and contributed to the manuscript. T.S., A.E., E.R., C.O., D.C.W., M.A.B., D.S.B.H., S.L.G., E.S.A., S.G., G.S. and G.L. interpreted data and contributed to the manuscript. G.L. oversaw the project in its entirety. All authors have read and agreed to the published version of the manuscript.

Funding

D.C.W. received funding from the National Cancer Institute (K99CA277242). E.S.A. is partially supported by NCI Cancer Center Support Grant P30 CA077598 and DOD grant W81XWH-22-2-0025.

Institutional Review Board Statement

This study was conducted in accordance with the Declaration of Helsinki and approved by the Institutional Review Board of the University of Miami Miller School of Medicine (protocol code 20170427 approved in April 2017).

Informed Consent Statement

Patient consent was waived due to the retrospective nature of this analysis, as approved by the IRB detailed above.

Data Availability Statement

The data used in this study are not publicly available but can be made available to investigators upon reasonable request.

Conflicts of Interest

SAK reports consultancy for Pathway Medical, honoraria from MJH Life Sciences, the Academy for Continued Healthcare Education, Integrity Continuing Education, Healthcourse Inc., Precisca, and Research to Practice; the speaker’s bureau of i3 Health; and travel from FLASCO and IASLC. ESA has served as a paid consultant/advisor for Sanofi, Dendreon, Janssen Biotech, ESSA, Merck, AstraZeneca, Clovis Oncology, Lilly, and Bayer and received honoraria from Sanofi, Dendreon, Janssen Biotech, ESSA, Astellas Pharma, Merck, AstraZeneca, and Clovis Oncology; ESA has also received research funding from Janssen Biotech, Johnson and Johnson, Sanofi, Dendreon, Genentech, Novartis, Astellas Pharma, Merck, AstraZeneca, Clovis Oncology, and Constellation Pharmaceuticals, as well as travel accommodations from Sanofi, and Dendreon, and is a coinventor of a technology licensed to Qiagen. SLG reports stock ownership (Current, Self) in HCA Healthcare; employment (Current, Self); honoraria for the Advisory Boards (All Relationships Ended, Self) of Pfizer, SeaGen, AstraZeneca, Daiichi Sankyo, Gilead Sciences, Menarini Stemline, Genentech, Novartis, and Lilly/Loxo@Lilly; and research funding (all funds to institution) from AstraZeneca/Daiichi Sankyo, Novartis, and Daiichi Sankyo.

Appendix A

Figure A1. Overall survival (biopsy to last contact) of patients with HRASmt vs. HRASwt tumors, or for different HRAS mutations, according to tumor histology.
Cancers 16 01572 g0a1
Figure A2. Overall survival (biopsy to last contact) of patients with HNSCC HRASmt vs. HRASwt tumors who did or did not receive (A) cetuximab, (B) immune checkpoint inhibitors (ICI), or (C) chemotherapy.
Cancers 16 01572 g0a2
Table A1. List of HRAS protein changes.
A18V, A59T, E143K, G12A, G12C, G12D, G12N, G12R, G12S, G12V, G13C, G13D, G13K, G13N, G13R, G13V, G60D, I55M, K117N, Q150, Q61H, Q61K, Q61L, Q61R, R149fs, S189C, T2M, T50M, T58I, V45A
Table A2. Mutation frequency by tumor type.
Q61G12G13MiscN of MutationsN of Mutant Tumors
UC6334374138138
BC HR+/HER2-95121717
TNBC24151325454
NSCLC Squamous232341390157
NSCLC Adenocarcinoma1831213450
Melanoma16102275555
HNSCC2541423112110

References

  1. Marín-Ramos, N.I.; Ortega-Gutiérrez, S.; López-Rodríguez, M.L. Blocking Ras Inhibition as an Antitumor Strategy. Semin. Cancer Biol. 2019, 54, 91–100. [Google Scholar] [CrossRef] [PubMed]
  2. Pylayeva-Gupta, Y.; Grabocka, E.; Bar-Sagi, D. RAS Oncogenes: Weaving a Tumorigenic Web. Nat. Rev. Cancer 2011, 11, 761–774. [Google Scholar] [CrossRef] [PubMed]
  3. Mukhopadhyay, S.; Vander Heiden, M.G.; McCormick, F. The Metabolic Landscape of RAS-Driven Cancers from Biology to Therapy. Nat. Cancer 2021, 2, 271–283. [Google Scholar] [CrossRef] [PubMed]
  4. De Langen, A.J.; Johnson, M.L.; Mazieres, J.; Dingemans, A.-M.C.; Mountzios, G.; Pless, M.; Wolf, J.; Schuler, M.; Lena, H.; Skoulidis, F.; et al. Sotorasib versus Docetaxel for Previously Treated Non-Small-Cell Lung Cancer with KRASG12C Mutation: A Randomised, Open-Label, Phase 3 Trial. Lancet 2023, 401, 733–746. [Google Scholar] [CrossRef] [PubMed]
  5. Jänne, P.A.; Riely, G.J.; Gadgeel, S.M.; Heist, R.S.; Ou, S.-H.I.; Pacheco, J.M.; Johnson, M.L.; Sabari, J.K.; Leventakos, K.; Yau, E.; et al. Adagrasib in Non–Small-Cell Lung Cancer Harboring a KRASG12C Mutation. N. Engl. J. Med. 2022, 387, 120–131. [Google Scholar] [CrossRef]
  6. Strickler, J.H.; Satake, H.; George, T.J.; Yaeger, R.; Hollebecque, A.; Garrido-Laguna, I.; Schuler, M.; Burns, T.F.; Coveler, A.L.; Falchook, G.S.; et al. Sotorasib in KRAS p.G12C–Mutated Advanced Pancreatic Cancer. N. Engl. J. Med. 2023, 388, 33–43. [Google Scholar] [CrossRef]
  7. Sebti, S.M.; Der, C.J. Searching for the Elusive Targets of Farnesyltransferase Inhibitors. Nat. Rev. Cancer 2003, 3, 945–951. [Google Scholar] [CrossRef] [PubMed]
  8. Whyte, D.B.; Kirschmeier, P.; Hockenberry, T.N.; Nunez-Oliva, I.; James, L.; Catino, J.J.; Bishop, W.R.; Pai, J.K. K- and N-Ras Are Geranylgeranylated in Cells Treated with Farnesyl Protein Transferase Inhibitors. J. Biol. Chem. 1997, 272, 14459–14464. [Google Scholar] [CrossRef] [PubMed]
  9. Kodaz, H. Frequency of RAS Mutations (KRAS, NRAS, HRAS) in Human Solid Cancer. Eurasian J. Med. Oncol. 2017, 7, 22931. [Google Scholar] [CrossRef]
  10. Crona, J.; Delgado Verdugo, A.; Maharjan, R.; Stålberg, P.; Granberg, D.; Hellman, P.; Björklund, P. Somatic Mutations in H-RAS in Sporadic Pheochromocytoma and Paraganglioma Identified by Exome Sequencing. J. Clin. Endocrinol. Metab. 2013, 98, E1266–E1271. [Google Scholar] [CrossRef] [PubMed]
  11. Ho, A.L.; Brana, I.; Haddad, R.; Bauman, J.; Bible, K.; Oosting, S.; Wong, D.J.; Ahn, M.-J.; Boni, V.; Even, C.; et al. Tipifarnib in Head and Neck Squamous Cell Carcinoma with HRAS Mutations. J. Clin. Oncol. Off. J. Am. Soc. Clin. Oncol. 2021, 39, 1856–1864. [Google Scholar] [CrossRef]
  12. Wei, S.; Krause, H.B.; Geynisman, D.M.; Elliott, A.; Kutikov, A.; Uzzo, R.G.; Pei, J.; Barata, P.; Carneiro, B.; Heath, E.; et al. Molecular Characterization of TFE3-Rearranged Renal Cell Carcinoma: A Comparative Study With Papillary and Clear Cell Renal Cell Carcinomas. Mod. Pathol. 2024, 37, 100404. [Google Scholar] [CrossRef]
  13. Finotello, F.; Mayer, C.; Plattner, C.; Laschober, G.; Rieder, D.; Hackl, H.; Krogsdam, A.; Loncova, Z.; Posch, W.; Wilflingseder, D.; et al. Molecular and Pharmacological Modulators of the Tumor Immune Contexture Revealed by Deconvolution of RNA-Seq Data. Genome Med. 2019, 11, 34. [Google Scholar] [CrossRef] [PubMed]
  14. Bao, R.; Stapor, D.; Luke, J.J. Molecular Correlates and Therapeutic Targets in T Cell-Inflamed versus Non-T Cell-Inflamed Tumors across Cancer Types. Genome Med. 2020, 12, 90. [Google Scholar] [CrossRef]
  15. Marabelle, A.; Fakih, M.; Lopez, J.; Shah, M.; Shapira-Frommer, R.; Nakagawa, K.; Chung, H.C.; Kindler, H.L.; Lopez-Martin, J.A.; Miller, W.H.; et al. Association of Tumour Mutational Burden with Outcomes in Patients with Advanced Solid Tumours Treated with Pembrolizumab: Prospective Biomarker Analysis of the Multicohort, Open-Label, Phase 2 KEYNOTE-158 Study. Lancet Oncol. 2020, 21, 1353–1365. [Google Scholar] [CrossRef]
  16. Merino, D.M.; McShane, L.M.; Fabrizio, D.; Funari, V.; Chen, S.-J.; White, J.R.; Wenz, P.; Baden, J.; Barrett, J.C.; Chaudhary, R.; et al. Establishing Guidelines to Harmonize Tumor Mutational Burden (TMB): In Silico Assessment of Variation in TMB Quantification across Diagnostic Platforms: Phase I of the Friends of Cancer Research TMB Harmonization Project. J. Immunother. Cancer 2020, 8, e000147. [Google Scholar] [CrossRef]
  17. Zimmer, K.; Kocher, F.; Untergasser, G.; Kircher, B.; Amann, A.; Baca, Y.; Xiu, J.; Korn, W.M.; Berger, M.D.; Lenz, H.-J.; et al. PBRM1 Mutations Might Render a Subtype of Biliary Tract Cancers Sensitive to Drugs Targeting the DNA Damage Repair System. NPJ Precis. Oncol. 2023, 7, 64. [Google Scholar] [CrossRef] [PubMed]
  18. Necchi, A.; Madison, R.; Pal, S.K.; Ross, J.S.; Agarwal, N.; Sonpavde, G.; Joshi, M.; Yin, M.; Miller, V.A.; Grivas, P.; et al. Comprehensive Genomic Profiling of Upper-Tract and Bladder Urothelial Carcinoma. Eur. Urol. Focus 2021, 7, 1339–1346. [Google Scholar] [CrossRef]
  19. The Cancer Genome Atlas Network Genome Sequencing Centre. Comprehensive Genomic Characterization of Head and Neck Squamous Cell Carcinomas. Nature 2015, 517, 576–582. [Google Scholar] [CrossRef] [PubMed]
  20. Coleman, N.; Marcelo, K.L.; Hopkins, J.F.; Khan, N.I.; Du, R.; Hong, L.; Park, E.; Balsara, B.; Leoni, M.; Pickering, C.; et al. HRAS Mutations Define a Distinct Subgroup in Head and Neck Squamous Cell Carcinoma. JCO Precis. Oncol. 2023, 7, e2200211. [Google Scholar] [CrossRef]
  21. Wan, X.; Liu, R.; Li, Z. The Prognostic Value of HRAS mRNA Expression in Cutaneous Melanoma. BioMed Res. Int. 2017, 2017, 5356737. [Google Scholar] [CrossRef]
  22. Mathiot, L.; Herbreteau, G.; Robin, S.; Fenat, C.; Bennouna, J.; Blanquart, C.; Denis, M.; Pons-Tostivint, E. HRAS Q61L Mutation as a Possible Target for Non-Small Cell Lung Cancer: Case Series and Review of Literature. Curr. Oncol. 2022, 29, 3748–3758. [Google Scholar] [CrossRef] [PubMed]
  23. Pareja, F.; Toss, M.S.; Geyer, F.C.; da Silva, E.M.; Vahdatinia, M.; Sebastiao, A.P.M.; Selenica, P.; Szatrowski, A.; Edelweiss, M.; Wen, H.Y.; et al. Immunohistochemical Assessment of HRAS Q61R Mutations in Breast Adenomyoepitheliomas. Histopathology 2020, 76, 865–874. [Google Scholar] [CrossRef] [PubMed]
  24. Sheffield, L.G. C-Src Activation by ErbB2 Leads to Attachment-Independent Growth of Human Breast Epithelial Cells. Biochem. Biophys. Res. Commun. 1998, 250, 27–31. [Google Scholar] [CrossRef] [PubMed]
  25. Graff, S.L.; Yan, F.; Abdou, Y. Newly Approved and Emerging Agents in HER2-Positive Metastatic Breast Cancer. Clin. Breast Cancer 2023, 23, e380–e393. [Google Scholar] [CrossRef] [PubMed]
  26. Bièche, I.; Coussy, F.; El-Botty, R.; Vacher, S.; Château-Joubert, S.; Dahmani, A.; Montaudon, E.; Reyes, C.; Gentien, D.; Reyal, F.; et al. HRAS Is a Therapeutic Target in Malignant Chemo-Resistant Adenomyoepithelioma of the Breast. J. Hematol. Oncol. 2021, 14, 143. [Google Scholar] [CrossRef] [PubMed]
  27. Pązik, M.; Michalska, K.; Żebrowska-Nawrocka, M.; Zawadzka, I.; Łochowski, M.; Balcerczak, E. Clinical Significance of HRAS and KRAS Genes Expression in Patients with Non-Small-Cell Lung Cancer—Preliminary Findings. BMC Cancer 2021, 21, 130. [Google Scholar] [CrossRef] [PubMed]
  28. Sfakianos, J.P.; Cha, E.K.; Iyer, G.; Scott, S.N.; Zabor, E.C.; Shah, R.H.; Ren, Q.; Bagrodia, A.; Kim, P.H.; Hakimi, A.A.; et al. Genomic Characterization of Upper Tract Urothelial Carcinoma. Eur. Urol. 2015, 68, 970–977. [Google Scholar] [CrossRef]
  29. Jung, J.; Liao, H.; Coker, S.A.; Liang, H.; Hancock, J.F.; Denicourt, C.; Venkatachalam, K. P53 Mitigates the Effects of Oncogenic HRAS in Urothelial Cells via the Repression of MCOLN1. iScience 2021, 24, 102701. [Google Scholar] [CrossRef]
  30. Scheffler, M.; Ihle, M.A.; Hein, R.; Merkelbach-Bruse, S.; Scheel, A.H.; Siemanowski, J.; Brägelmann, J.; Kron, A.; Abedpour, N.; Ueckeroth, F.; et al. K-Ras Mutation Subtypes in NSCLC and Associated Co-Occuring Mutations in Other Oncogenic Pathways. J. Thorac. Oncol. Off. Publ. Int. Assoc. Study Lung Cancer 2019, 14, 606–616. [Google Scholar] [CrossRef]
  31. Sanchez-Vega, F.; Mina, M.; Armenia, J.; Chatila, W.K.; Luna, A.; La, K.C.; Dimitriadoy, S.; Liu, D.L.; Kantheti, H.S.; Saghafinia, S.; et al. Oncogenic Signaling Pathways in The Cancer Genome Atlas. Cell 2018, 173, 321–337.e10. [Google Scholar] [CrossRef]
  32. Isnaldi, E.; Garuti, A.; Cirmena, G.; Scabini, S.; Rimini, E.; Ferrando, L.; Lia, M.; Murialdo, R.; Tixi, L.; Carminati, E.; et al. Clinico-Pathological Associations and Concomitant Mutations of the RAS/RAF Pathway in Metastatic Colorectal Cancer. J. Transl. Med. 2019, 17, 137. [Google Scholar] [CrossRef]
  33. Boulalas, I.; Zaravinos, A.; Karyotis, I.; Delakas, D.; Spandidos, D.A. Activation of RAS Family Genes in Urothelial Carcinoma. J. Urol. 2009, 181, 2312–2319. [Google Scholar] [CrossRef] [PubMed]
  34. Bai, Y.; Guo, T.; Niu, D.; Zhu, Y.; Ren, W.; Yao, Q.; Huang, X.; Feng, Q.; Wang, T.; Ma, X.; et al. Clinical Significance and Interrelations of PD-L1 Expression, Ki-67 Index, and Molecular Alterations in Sporadic Medullary Thyroid Carcinoma from a Chinese Population. Virchows Arch. 2022, 481, 903–911. [Google Scholar] [CrossRef] [PubMed]
  35. Lyu, H.; Li, M.; Jiang, Z.; Liu, Z.; Wang, X. Correlate the TP53 Mutation and the HRAS Mutation with Immune Signatures in Head and Neck Squamous Cell Cancer. Comput. Struct. Biotechnol. J. 2019, 17, 1020–1030. [Google Scholar] [CrossRef] [PubMed]
  36. Samstein, R.M.; Lee, C.-H.; Shoushtari, A.N.; Hellmann, M.D.; Shen, R.; Janjigian, Y.Y.; Barron, D.A.; Zehir, A.; Jordan, E.J.; Omuro, A.; et al. Tumor Mutational Load Predicts Survival after Immunotherapy across Multiple Cancer Types. Nat. Genet. 2019, 51, 202–206. [Google Scholar] [CrossRef] [PubMed]
  37. Hanna, G.J.; Guenette, J.P.; Chau, N.G.; Sayehli, C.M.; Wilhelm, C.; Metcalf, R.; Wong, D.J.; Brose, M.; Razaq, M.; Pérez-Ruiz, E.; et al. Tipifarnib in Recurrent, Metastatic HRAS-mutant Salivary Gland Cancer. Cancer 2020, 126, 3972–3981. [Google Scholar] [CrossRef] [PubMed]
  38. Vermorken, J.B.; Mesia, R.; Rivera, F.; Remenar, E.; Kawecki, A.; Rottey, S.; Erfan, J.; Zabolotnyy, D.; Kienzer, H.-R.; Cupissol, D.; et al. Platinum-Based Chemotherapy plus Cetuximab in Head and Neck Cancer. N. Engl. J. Med. 2008, 359, 1116–1127. [Google Scholar] [CrossRef] [PubMed]
  39. Odeniyide, P.; Yohe, M.E.; Pollard, K.; Vaseva, A.V.; Calizo, A.; Zhang, L.; Rodriguez, F.J.; Gross, J.M.; Allen, A.N.; Wan, X.; et al. Targeting Farnesylation as a Novel Therapeutic Approach in HRAS-Mutant Rhabdomyosarcoma. Oncogene 2022, 41, 2973–2983. [Google Scholar] [CrossRef] [PubMed]
  40. Lee, H.W.; Chung, W.; Lee, H.-O.; Jeong, D.E.; Jo, A.; Lim, J.E.; Hong, J.H.; Nam, D.-H.; Jeong, B.C.; Park, S.H.; et al. Single-Cell RNA Sequencing Reveals the Tumor Microenvironment and Facilitates Strategic Choices to Circumvent Treatment Failure in a Chemorefractory Bladder Cancer Patient. Genome Med. 2020, 12, 47. [Google Scholar] [CrossRef]
  41. Lopes-Ventura, S.; Pojo, M.; Matias, A.T.; Moura, M.M.; Marques, I.J.; Leite, V.; Cavaco, B.M. The Efficacy of HRAS and CDK4/6 Inhibitors in Anaplastic Thyroid Cancer Cell Lines. J. Endocrinol. Investig. 2019, 42, 527–540. [Google Scholar] [CrossRef]
  42. Untch, B.R.; Dos Anjos, V.; Garcia-Rendueles, M.E.R.; Knauf, J.A.; Krishnamoorthy, G.P.; Saqcena, M.; Bhanot, U.K.; Socci, N.D.; Ho, A.L.; Ghossein, R.; et al. Tipifarnib Inhibits HRAS-Driven Dedifferentiated Thyroid Cancers. Cancer Res. 2018, 78, 4642–4657. [Google Scholar] [CrossRef]
  43. Rieke, D.T.; Schröder, S.; Schafhausen, P.; Blanc, E.; Zuljan, E.; von der Emde, B.; Beule, D.; Keller, U.; Keilholz, U.; Klinghammer, K. Targeted Treatment in a Case Series of AR+, HRAS/PIK3CA Co-Mutated Salivary Duct Carcinoma. Front. Oncol. 2023, 13, 1107134. [Google Scholar] [CrossRef] [PubMed]
  44. Zhang, S.S.; Nagasaka, M. Spotlight on Sotorasib (AMG 510) for KRASG12C Positive Non-Small Cell Lung Cancer. Lung Cancer Targets Ther. 2021, 12, 115–122. [Google Scholar] [CrossRef]
  45. Liu, J.; Kang, R.; Tang, D. The KRAS-G12C Inhibitor: Activity and Resistance. Cancer Gene Ther. 2022, 29, 875–878. [Google Scholar] [CrossRef]
  46. Lito, P.; Solomon, M.; Li, L.-S.; Hansen, R.; Rosen, N. Allele-Specific Inhibitors Inactivate Mutant KRAS G12C by a Trapping Mechanism. Science 2016, 351, 604–608. [Google Scholar] [CrossRef]
  47. Janes, M.R.; Zhang, J.; Li, L.-S.; Hansen, R.; Peters, U.; Guo, X.; Chen, Y.; Babbar, A.; Firdaus, S.J.; Darjania, L.; et al. Targeting KRAS Mutant Cancers with a Covalent G12C-Specific Inhibitor. Cell 2018, 172, 578–589.e17. [Google Scholar] [CrossRef]
  48. Canon, J.; Rex, K.; Saiki, A.Y.; Mohr, C.; Cooke, K.; Bagal, D.; Gaida, K.; Holt, T.; Knutson, C.G.; Koppada, N.; et al. The Clinical KRAS(G12C) Inhibitor AMG 510 Drives Anti-Tumour Immunity. Nature 2019, 575, 217–223. [Google Scholar] [CrossRef] [PubMed]
  49. Hallin, J.; Engstrom, L.D.; Hargis, L.; Calinisan, A.; Aranda, R.; Briere, D.M.; Sudhakar, N.; Bowcut, V.; Baer, B.R.; Ballard, J.A.; et al. The KRASG12C Inhibitor MRTX849 Provides Insight toward Therapeutic Susceptibility of KRAS-Mutant Cancers in Mouse Models and Patients. Cancer Discov. 2020, 10, 54–71. [Google Scholar] [CrossRef]
  50. Gilardi, M.; Wang, Z.; Proietto, M.; Chillà, A.; Calleja-Valera, J.L.; Goto, Y.; Vanoni, M.; Janes, M.R.; Mikulski, Z.; Gualberto, A.; et al. Tipifarnib as a Precision Therapy for HRAS-Mutant Head and Neck Squamous Cell Carcinomas. Mol. Cancer Ther. 2020, 19, 1784–1796. [Google Scholar] [CrossRef] [PubMed]
  51. Kiessling, M.K.; Curioni-Fontecedro, A.; Samaras, P.; Atrott, K.; Cosin-Roger, J.; Lang, S.; Scharl, M.; Rogler, G. Mutant HRAS as Novel Target for MEK and mTOR Inhibitors. Oncotarget 2015, 6, 42183–42196. [Google Scholar] [CrossRef]
  52. Tidyman, W.E.; Goodwin, A.F.; Maeda, Y.; Klein, O.D.; Rauen, K.A. MEK-Inhibitor-Mediated Rescue of Skeletal Myopathy Caused by Activating Hras Mutation in a Costello Syndrome Mouse Model. Dis. Model. Mech. 2022, 15, dmm049166. [Google Scholar] [CrossRef]
  53. Catalano, A.; Adlesic, M.; Kaltenbacher, T.; Klar, R.F.U.; Albers, J.; Seidel, P.; Brandt, L.P.; Hejhal, T.; Busenhart, P.; Röhner, N.; et al. Sensitivity and Resistance of Oncogenic RAS-Driven Tumors to Dual MEK and ERK Inhibition. Cancers 2021, 13, 1852. [Google Scholar] [CrossRef]
  54. Baselga, J.; Campone, M.; Piccart, M.; Burris, H.A.; Rugo, H.S.; Sahmoud, T.; Noguchi, S.; Gnant, M.; Pritchard, K.I.; Lebrun, F.; et al. Everolimus in Postmenopausal Hormone-Receptor-Positive Advanced Breast Cancer. N. Engl. J. Med. 2012, 366, 520–529. [Google Scholar] [CrossRef] [PubMed]
  55. Cerami, E.; Gao, J.; Dogrusoz, U.; Gross, B.E.; Sumer, S.O.; Aksoy, B.A.; Jacobsen, A.; Byrne, C.J.; Heuer, M.L.; Larsson, E.; et al. The cBio Cancer Genomics Portal: An Open Platform for Exploring Multidimensional Cancer Genomics Data. Cancer Discov. 2012, 2, 401–404. [Google Scholar] [CrossRef] [PubMed]
  56. Wu, X.Y.; Liu, W.T.; Wu, Z.F.; Chen, C.; Liu, J.Y.; Wu, G.N.; Yao, X.Q.; Liu, F.K.; Li, G. Identification of HRAS as Cancer-Promoting Gene in Gastric Carcinoma Cell Aggressiveness. Am. J. Cancer Res. 2016, 6, 1935–1948. [Google Scholar] [PubMed]
Figure 1. (A) Frequency of different HRAS mutations across investigated solid tumors. Q61: 182A>G, 182A>T, 181C>A, and 180-182del_insTCT. G12: 34G>A, 34G>T, 35G>A, 35G>T, and 35G>C. G13: 37G>C, 38G>T, and 38G>A. Misc is defined as all other pathogenic HRAS mutations. (B) HRAS expression between HRAS mutant (MT) and wild-type (WT) tumors. (C) HRAS expression across different HRAS mutations (red asterisk [*] or black bars indicate p < 0.05).
Cancers 16 01572 g001
Figure 2. Prevalence of genomic alteration in HRAS MT–WT tumors (genes shown had a statistically significant difference in mutation prevalence for at least one of the investigated cancer types). Red box indicates statistical significance (p < 0.05).
Cancers 16 01572 g002
Figure 3. (AC) Prevalence of (A) PD-L1 IHC (clone 22c3 for all except HN, which used the SP142 clone), (B) MMRd/MSI-H, and (C) TMB–high positive tumors (comparing MT to WT, no statistically significant differences were observed; p > 0.05).
Cancers 16 01572 g003
Figure 4. (A) Prevalence of T-cell-inflamed tumors across HRAS WT and MT tumors (p > 0.05, not statistically significant for all). (B) Immune cell infiltrates for HRAS WT and MT tumors. (C) Difference in immune infiltrate percentage between HRAS WT and MT tumors (grey box indicates difference is statistically significant (p < 0.05).
Cancers 16 01572 g004
Figure 5. (A) Summary of hazard ratio for OS (biopsy to last contact) for investigated solid tumors. (B) Kaplan–Meier curve for HNSCC MT vs. WT tumors. A red asterisk [*] indicates statistical significance.
Cancers 16 01572 g005
Table 1. Demographic information.
UCHRASmtHRASwtp-Value
Count (N)1384467NA
Median Age
[range]
70
[32–>89]
72
[18–>89]
0.001
Male66.6%
(92/138)
72.2%
(3223/4467)
0.158
Female33.3%
(46/138)
27.8%
(1244/4467)
BC
Count (N)8015763NA
Median Age
[range]
68
[41–>89]
60
[19–>89]
0.000
Male1.3%
(1/80)
1.2%
(191/15,763)
0.624
Female98.8%
(79/80)
98.8%
(15,572/15,763)
HR+/HER2-178057<0.001
TNBC544403
HR+/HER2+0688
HR-/HER2+0522
NSCLC
Count (N)15034,160NA
Median Age
[range]
72
[46–>89] (150)
69
[0–>89] (34,160)
0.004
Male46%
(69/150)
50.0%
(17,107/34,160)
0.319
Female54.0%
(81/150)
49.9%
(17,053/34,160)
Adenocarcinoma22.7%
(34/150)
57.1%
(19,513/34,160)
0.002
Squamous60.0%
(90/150)
22.0%
(7505/34,160)
Other17.3%
(26/150)
20.9%
(7142/34,160)
Melanoma
Count (N)555162NA
Median Age
[range]
71
[39–>89] (55)
67
[0–>89] (5162)
0.043
Male71%
(39/55)
62%
(3211/5162)
0.231
Female29.1%
(16/55)
37.8%
(1951/5162)
HNSCC
Count (N)1103797
Median Age
[range]
69
[33–>89] (110)
64
[15–>89] (3797)
0.001
Male62.7%
(69/110)
77%
(2922/3797)
0.001
Female37.3%
(41/110)
23.0%
(875/3797)
Table 2. Summary of hazard ratio (biopsy to last contact) for investigated solid tumors.
HRCICIpN HRASWTN HRASMT
BC
HR+/HER2-
1.4170.5893.4070.43453537
TNBC0.9030.5931.3740.632323035
HN1.5641.1582.110.003233056
Lung Squamous0.9710.7311.2910.842589365
Lung Adenocarcinoma1.1210.7151.7590.61815,45126
Melanoma0.9590.6361.4470.842399042
UC1.1430.9171.4240.2343598117
Disclaimer/Publisher’s Note: The statements, opinions and data contained in all publications are solely those of the individual author(s) and contributor(s) and not of MDPI and/or the editor(s). MDPI and/or the editor(s) disclaim responsibility for any injury to people or property resulting from any ideas, methods, instructions or products referred to in the content.

