Article

A Comparison of Singlet Oxygen Explicit Dosimetry (SOED) and Singlet Oxygen Luminescence Dosimetry (SOLD) for Photofrin-Mediated Photodynamic Therapy

1
Department of Radiation Oncology, University of Pennsylvania, Philadelphia, PA 19104, USA
2
Department of Physics and Astronomy, University of Pennsylvania, Philadelphia, PA 19104, USA
3
Department of Electronic and Nanoscale Engineering, University of Glasgow, Glasgow G12 8LT, UK
4
Princess Margaret Cancer Centre, University of Toronto, ON M5G 1L7, Canada
5
Institute of Photonics and Quantum Sciences, Heriot-Watt University, Edinburgh EH14 4AS, UK
*
Author to whom correspondence should be addressed.
Cancers 2016, 8(12), 109; https://doi.org/10.3390/cancers8120109
Submission received: 3 September 2016 / Revised: 14 November 2016 / Accepted: 28 November 2016 / Published: 6 December 2016
(This article belongs to the Special Issue Photodynamic Cancer Therapy)

Abstract

:
Accurate photodynamic therapy (PDT) dosimetry is critical for the use of PDT in the treatment of malignant and nonmalignant localized diseases. A singlet oxygen explicit dosimetry (SOED) model has been developed for in vivo purposes. It involves the measurement of the key components in PDT—light fluence (rate), photosensitizer concentration, and ground-state oxygen concentration ([3O2])—to calculate the amount of reacted singlet oxygen ([1O2]rx), the main cytotoxic component in type II PDT. Experiments were performed in phantoms with the photosensitizer Photofrin and in solution using phosphorescence-based singlet oxygen luminescence dosimetry (SOLD) to validate the SOED model. Oxygen concentration and photosensitizer photobleaching versus time were measured during PDT, along with direct SOLD measurements of singlet oxygen and triplet state lifetime (τΔ and τt), for various photosensitizer concentrations to determine necessary photophysical parameters. SOLD-determined cumulative [1O2]rx was compared to SOED-calculated [1O2]rx for various photosensitizer concentrations to show a clear correlation between the two methods. This illustrates that explicit dosimetry can be used when phosphorescence-based dosimetry is not feasible. Using SOED modeling, we have also shown evidence that SOLD-measured [1O2]rx using a 523 nm pulsed laser can be used to correlate to singlet oxygen generated by a 630 nm laser during a clinical malignant pleural mesothelioma (MPM) PDT protocol by using a conversion formula.

Graphical Abstract

1. Introduction

Photodynamic therapy (PDT) is an evolving treatment modality for many cancers such as microinvasive lung cancer, obstructing lung cancer, and obstructing esophageal cancer, for premalignant diseases such as actinic keratosis, and non-oncologic conditions such as age-related macular degeneration [1,2,3]. PDT is advantageous for its low systemic toxicity, lack of induced resistance, repeatability, and preservation of normal tissue structure. Widespread use of PDT has been restricted by the difficulty in accurately quantifying the effective treatment dose. PDT is dynamic and multifaceted, with complex and dynamic interactions between treatment light at a particular wavelength, photosensitizer (PS), and tissue oxygen ([3O2]) [3]. In a typical photodynamic process, the photosensitizer is excited by the treatment light and enters the excited singlet state. This singlet state undergoes intersystem crossing to the triplet state. This triplet state can react directly with molecular substrates or transfer a hydrogen atom or an electron to 3O2 to produce radicals or radical ions in a type I process [4]. Most clinically relevant photosensitizers undergo type II processes in which the triplet state transfers energy to ground-state oxygen, 3O2, to produce singlet oxygen, 1O2 [4], which is the main photocytotoxic agent leading to cell death and therapeutic response [5,6].
PDT dosimetry has so far involved the prescription of an administered drug dose and a light fluence (energy per unit area). This is often inadequate due to the variation in photosensitizer localization from patient to patient as well as within the tumor environment [7,8]. Furthermore, tissue and blood oxygenation are key components for PDT and will affect not only the production of 1O2 but also the tissue optical properties [9,10]. In turn, the penetration of light is dependent on the tissue optical properties [11]. Simplistically, PDT dose may be defined as the time integral of the photosensitizer concentration and the light fluence. However, this does not take into account the effect of tissue hypoxia. In a hypoxic environment, the production of 1O2 will be lower than expected and treatment outcome will not be predictable [7,8].
For these compelling reasons, the use of singlet oxygen concentration, [1O2] as the dosimetric measure has been suggested. Direct measurement of 1O2 by its near-infrared luminescence emission is technically challenging in vivo due to the weakness of the signal and the short lifetime of 1O2, ~30–180 ns [12,13]. Hence, a macroscopic singlet oxygen explicit dosimetry (SOED) model has been previously developed and studied for various sensitizers in vivo [8,14,15,16]. In the present work, SOED was compared in solutions to direct singlet oxygen luminescence dosimetry (SOLD) [17,18]. The relevant photophysical parameters for the macroscopic model were verified by performing explicit dosimetry of oxygen concentration and photosensitizer concentration. In performing a direct comparison between SOED- and SOLD-measured 1O2, the use of SOED in scenarios where direct luminescence detection is difficult is validated. Furthermore, an analysis is provided to show that SOLD measured using a 523 nm pulsed laser (currently required by the availability of lasers with suitable pulse length, repetition frequency, and energy) is well-correlated to singlet oxygen generated by Photofrin by a CW 630 nm laser during PDT, by correcting for the tissue optical properties at the two wavelengths.

2. Materials and Methods

2.1. SOED Model In Vitro and In Vivo

Singlet oxygen produced during illumination was calculated using an explicit dosimetry model. Based on type II processes modeled, a set of coupled differential equations has been established for the photophysical reactions [8,16,19].
A set of simplified differential equations that are valid over time scales of a few seconds to hours can be used to describe the interactions of singlet oxygen concentration, [1O2], photosensitizer concentration, [S0], the ground-state oxygen concentration, [3O2], and the reacted singlet oxygen concentration, [1O2]rx for the in vitro scenario with parameters (and ki) defined in Table 1 (and its footnote) [19]:
[ O 2 1 ] = ξ τ Δ [ O 2 3 ] [ O 2 3 ] + β ϕ [ S 0 ] 1 ( σ ( [ S 0 ] + δ ) + 1 )
d [ S 0 ] d t = ξ [ O 2 3 ] [ O 2 3 ] + β ϕ [ S 0 ] ( σ ( [ S 0 ] + δ ) ( σ ( [ S 0 ] + δ ) + 1 ) )
d [ O 2 3 ] d t = ξ [ O 2 3 ] [ O 2 3 ] + β ϕ [ S 0 ] ( σ ( [ S 0 ] + δ ) + k 7 [ A ] τ Δ ( σ ( [ S 0 ] + δ ) + 1 ) )
[ O 2 1 ] r x = ξ [ O 2 3 ] [ O 2 3 ] + β ϕ [ S 0 ] 1 ( σ ( [ S 0 ] + δ ) + 1 ) d t
where σ = k1/(k6 + k7[A]), ξ = ΦΔ(ε/), τΔ−1 = k6 + k7[A], and β = k4/k2. Here, ΦΔ is the singlet oxygen quantum yield in the aqueous Intralipid medium. The parameters used for the calculation for each phantom are summarized in Table 1. For studies without NaN3, the 1O2 quencher used in solutions, [A] = 0. For the in vivo scenario, Equations (2) and (3) can be rewritten as [8,14,15,16,20]:
d [ S 0 ] d t = ξ [ O 2 3 ] [ O 2 3 ] + β ϕ [ S 0 ] σ ( [ S 0 ] + δ )
d [ O 2 3 ] d t = ( ξ ϕ [ S 0 ] [ O 2 3 ] + β ) [ O 2 3 ] + g ( 1 [ O 2 3 ] [ O 2 3 ] ( t = 0 ) )
where we assumed that σ([S0] + δ) << 1. Here we have added an oxygen perfusion term to account for vasculature in vivo, and the value of g = 0.7 μM/s for Photofrin.
Equation (5) can be rewritten as the following:
d [ S 0 ] d t / ϕ [ S 0 ] [ O 2 3 ] [ O 2 3 ] + β = ξ σ ( [ S 0 ] + δ )
The left-hand side of Equation (7) versus [S0](t) gives the values of δ and σ used in Table 1. The photobleaching rate (−d[S0]/dt) was determined at each time point, along with the values of φ, [3O2], [S0], and β for the calculation of the left-hand side of Equation (7). A linear fit to the data yields a value for the intercept and slope, and the intercept divided by the slope gives δ and the slope divided by ξ gives σ. A recent review lists known values for in vivo photophysical parameters for many photosensitizers used clinically [19]. The SOED-calculated solutions were compared with the oxygen and [S0](t) concentrations. All calculations were performed using Matlab 2014b (MathWorks, Natick, MA, USA).

2.2. SOLD Instrumentation

Singlet oxygen luminescence dosimetry (SOLD) was performed using a compact, fiberoptic near-infrared probe-based system [21,22]. The probe was coupled to a compact InGaAs/InP single photon avalanche diode (SPAD) detector (Micro Photon Devices, Bolzano Italy). Samples were illuminated with a 523 nm wavelength pulsed laser (QL-523-200-S, CrystaLaser, Reno, NV, USA) coupled into the delivery fiber via a collimation package. Patterned time gating was used to limit the unwanted dark counts and eliminate the strong photosensitizer luminescence background. The luminescence signal from singlet oxygen at 1270 nm was confirmed through spectral filtering and lifetime fitting for Photofrin.
Figure 1 shows a photograph and schematic of the experimental setup. The pulsed laser was coupled into the delivery fiber. The laser also outputs an electrical signal that is sent to a programmable pulse pattern generator (PPG) (Agilent 81110A, Keysight Technologies, Inc., Santa Rosa, CA, USA). Each pulse generates outputs on two separate channels, each with pulse shape designed to match the intended input. The first output is a single pulse sent to the “start” channel of the time-correlated single-photon counting (TCSPC) module (HydraHarp, PicoQuant GmbH, Berlin, Germany), while the second is a pattern of pulses sent to the SPAD control module. The SPAD is turned on for a preassigned time, only when the control module receives a pulse from the PPG.
The TCSPC module generates a timing histogram of photon counts versus time. The background was removed by subtracting the histogram taken through a 1210 nm filter from that through the 1270 nm filter. Equation (8) describes the [1O2] signal as a function of time following a short illumination pulse.
[ O 2 1 ] ( t ) = N σ A [ S 0 ] Φ Δ τ Δ τ t τ Δ ( e t / τ t e t / τ Δ )
The cumulative SOLD singlet oxygen count can be calculated as the integral of Equation (8) per τR [23].
0 1 τ R [ O 2 1 ] ( t ) d t = N σ A [ S 0 ] Φ Δ τ Δ τ R
where N is the number of photons in the illumination pulse, σA is the PS absorption cross-section (σA = (ε/NA) × 109), NA is Avogadro’s constant (6.022 × 10²³), ε is the extinction coefficient, and τR is the 1O2 phosphorescence lifetime (k6−1). A fit of the background-subtracted histograms was performed to Equation (8) (with a y-axis offset as a free parameter to account for any change in the background level) using Origin software with a Levenberg–Marquardt algorithm to iterate the parameter values.

2.3. Measurements in Tissue-Simulating Phantoms

Explicit dosimetry of phantom studies was performed using tissue-simulating liquid phantoms. A lipoprotein colloidal suspension, Intralipid (Fresenius Kabi, Uppsala, Sweden) was added to solutions to provide optical scattering. A broad beam (0.4 cm radius) was produced by a fiber with a microlens attachment (Pioneer Optics Company, Bloomfield, CT, USA) onto the side of cuvette phantoms. Oxygen measurements were made with a bare-fiber OxyLite probe (Oxford Optronix, Oxford, UK) on the side closest to beam entry at the center of the field. In the in vitro setup, there is very little oxygen diffusion at the point of measurement, so that oxygen measurements were performed with brief interruptions of the excitation laser at 1–30 s intervals. The oxygen partial pressure was measured in mmHg and converted to μM by using a factor of α = 1.3 [14,24]. PS concentration was determined by obtaining fluorescence spectra produced by Photofrin excited by the treatment light. Spectral analysis was performed using single value decomposition fitting of the characteristic Photofrin peak [25].

2.4. Comparison of 630 nm and 523 nm SOED

Optical properties from multiple sites of several different patients undergoing treatment for pleural-PDT were determined from absorption spectra using a white light source (Avantes, Little Rock, AK, USA) connected to a multifiber contact probe, as described elsewhere [26,27]. The multifiber probe has a source fiber attached to a halogen white light source. This was used to obtain broadband reflectance at multiple source-detector separations. The diffusion equation was used to determine the solution for diffuse reflectance for a semi-infinite medium with steady-state excitation. The longitudinal distribution of φ for different tissue optical properties was determined using an analytical formula [28] based on Monte Carlo simulations [29,30,31,32]. To obtain the corresponding temporal changes of [S0] and [3O2], the information of φ distribution, the magnitude of the Photofrin-specific reaction-rate parameters, and the measured photosensitizer concentrations [33] were passed to the time (t)-dependent differential Equations (5) and (6) for a given treatment time point, which were then used to calculate [1O2]rx using Equation (4).

3. Results

3.1. SOED Photophysical Parameters

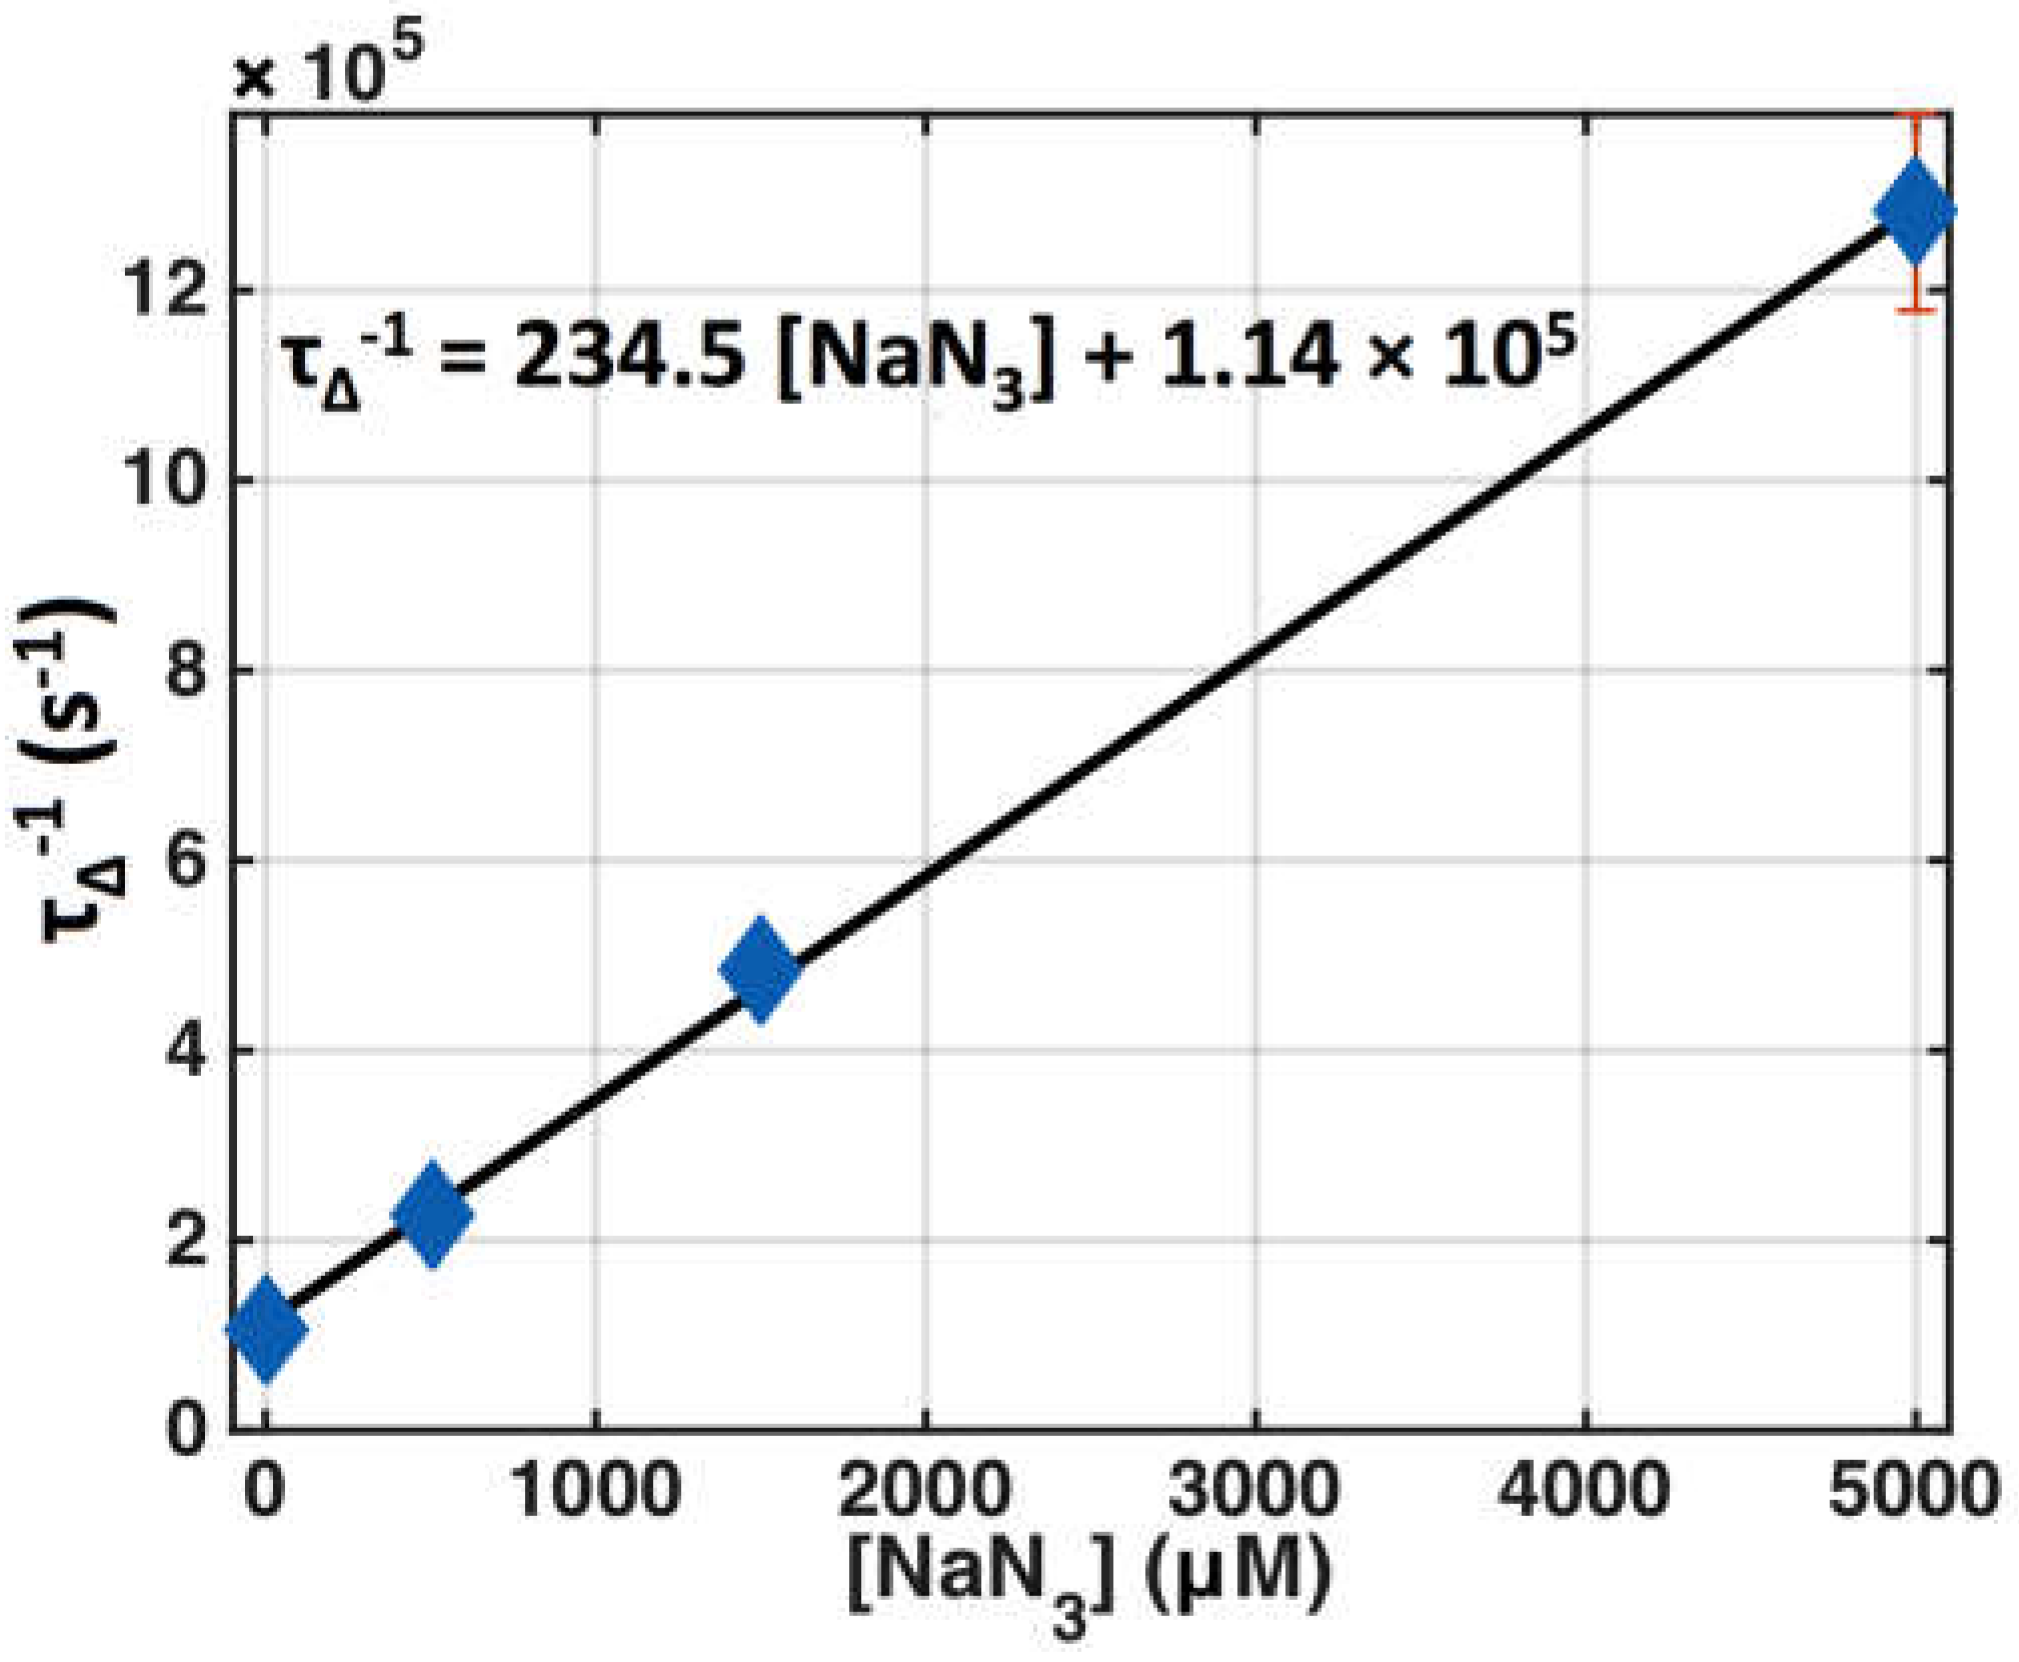
Photophysical parameter values for Photofrin were determined for in vitro macroscopic modeling from the literature as well as measurements to be used in the calculation of [1O2]rx. These parameters are listed in Table 1. Figure 2 shows the SOLD measurement of singlet oxygen lifetime as a function of the concentration of added sodium azide (NaN3), which is a potent singlet oxygen-specific quencher, for Photofrin in MeOH solution. The intercept of the linear fit (solid line in Figure 2) corresponds to k6 and the slope corresponds to the value for k7.

3.2. SOED in Phantom

Photofrin phantoms with Intralipid as optical scatterer and absorption due to both the photosensitizer and water (or Intralipid) were used to measure the time dependence of [3O2] and PS concentration, [S0], under CW 630 nm laser excitation. [3O2](t) was measured using an oxygen phosphorescence probe and the photophysical parameters taken from Table 1.
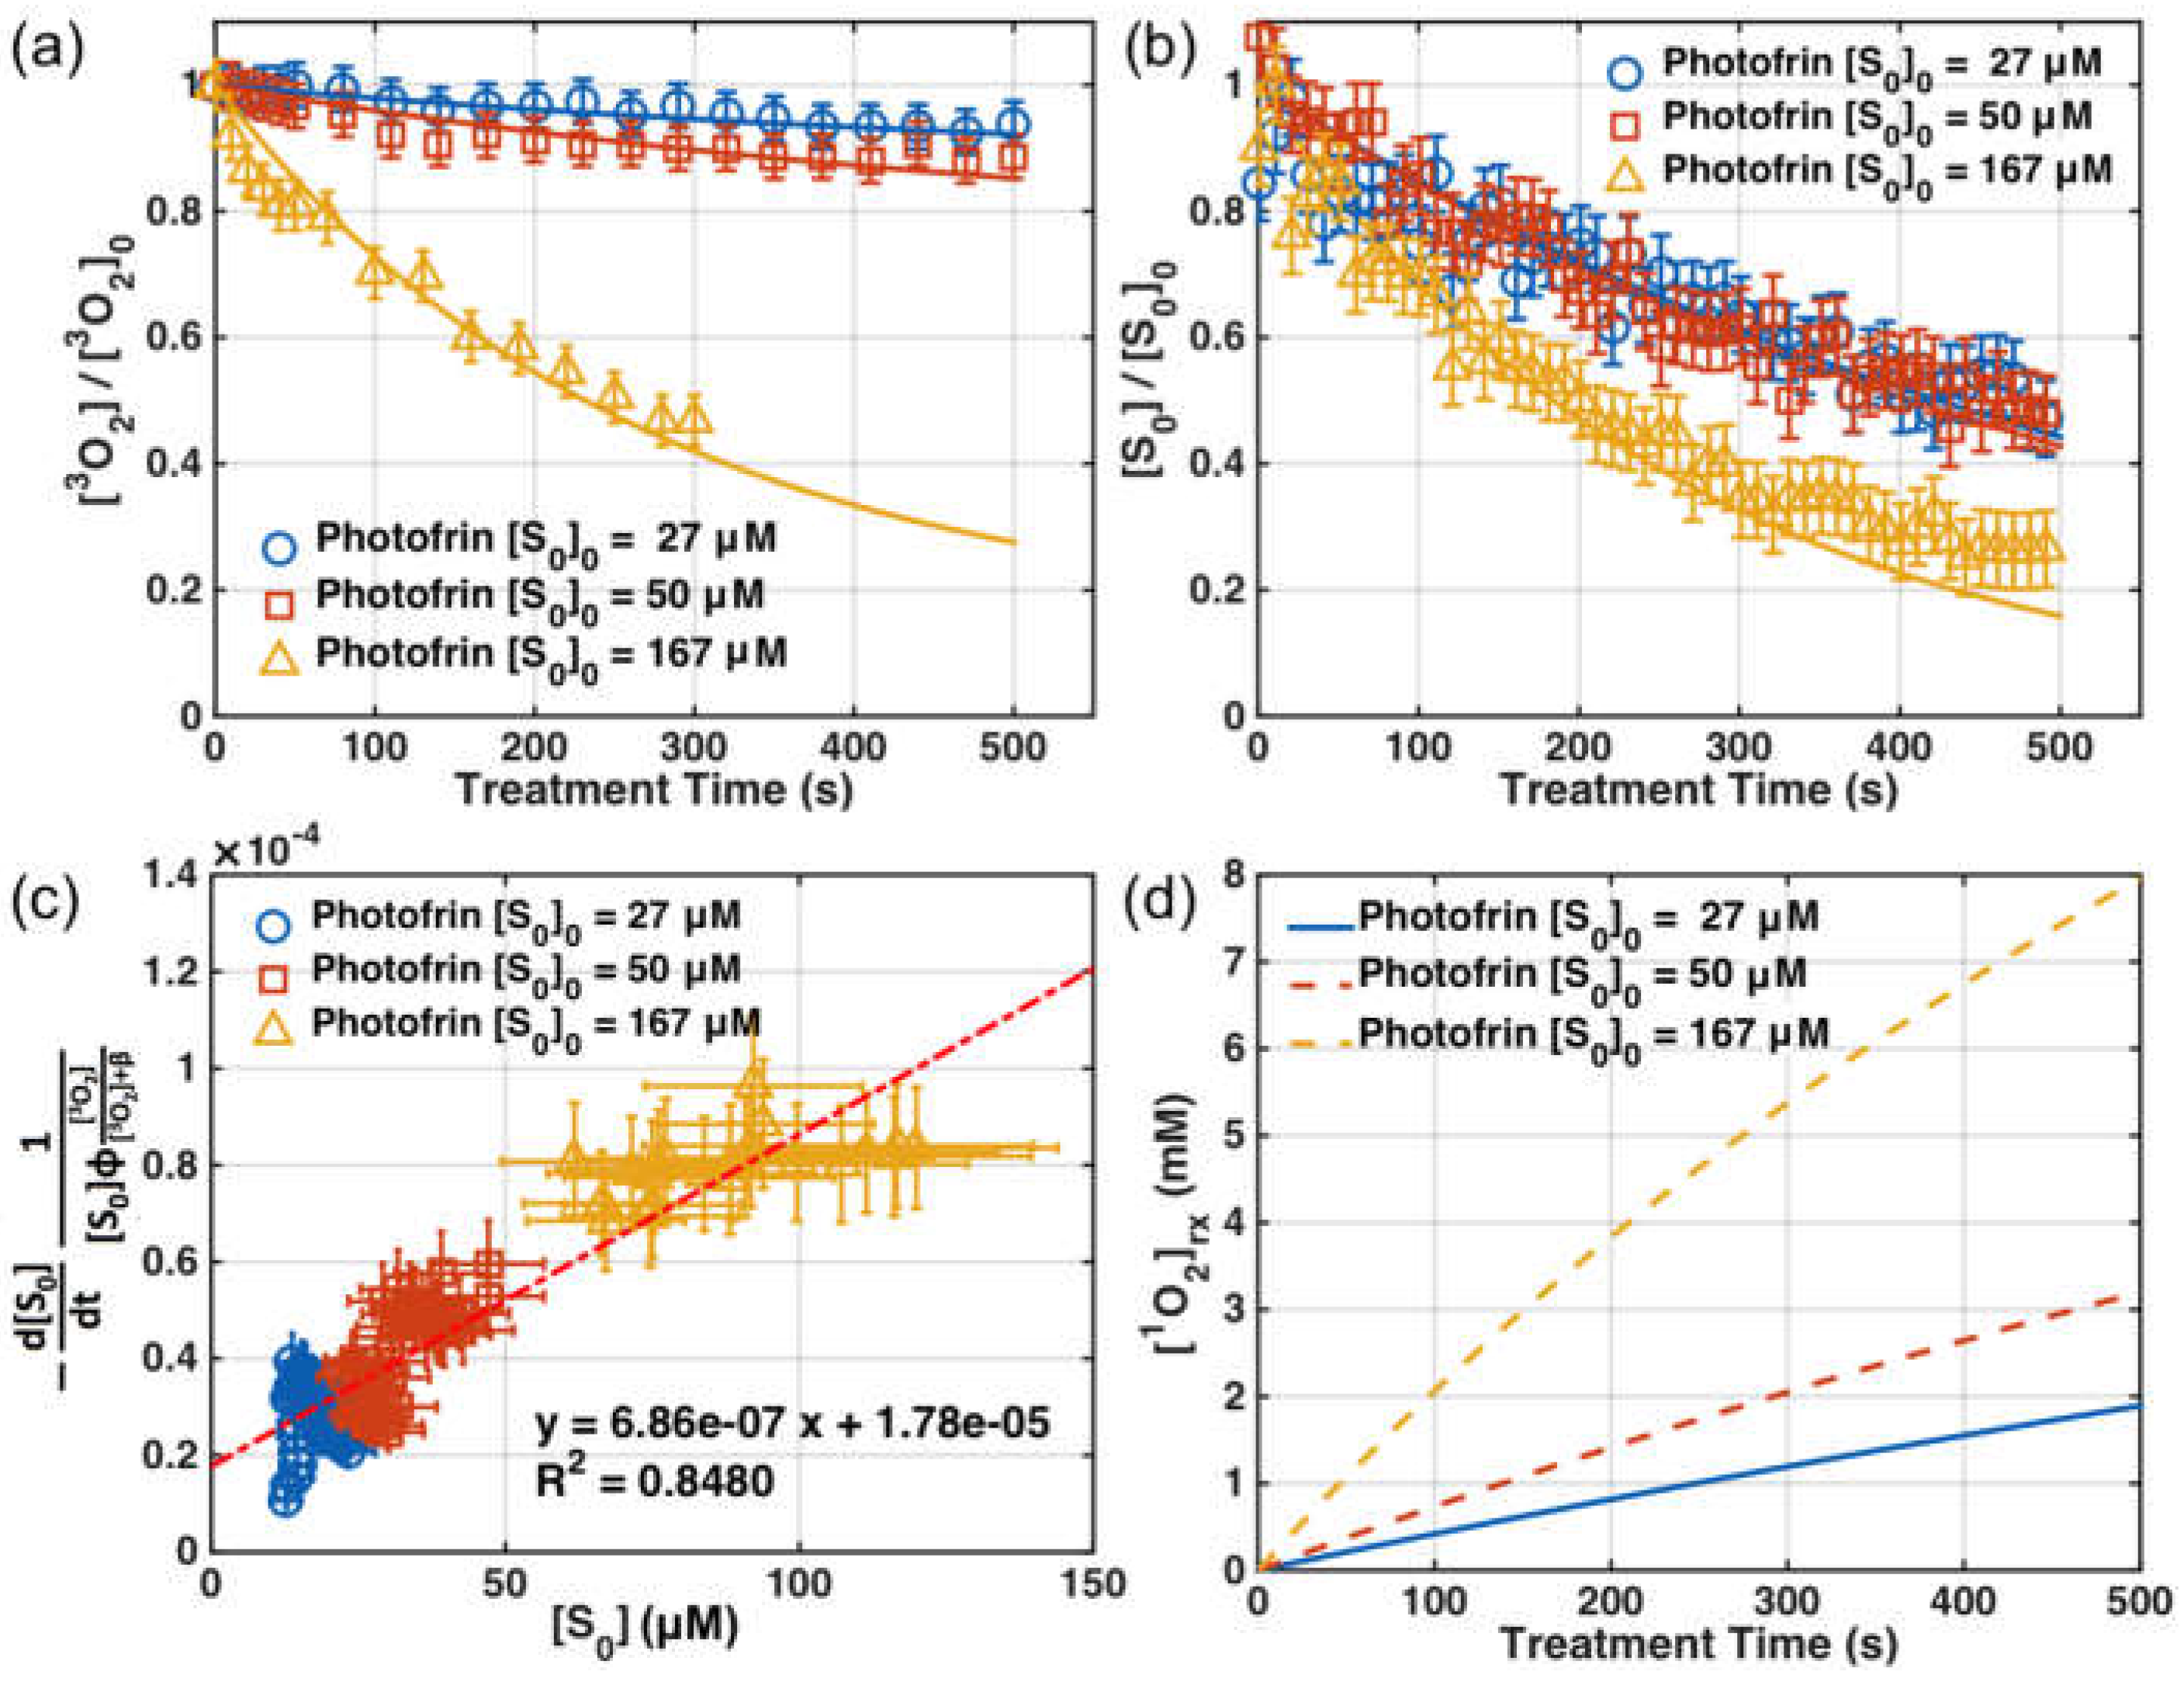
Figure 3a,b show the measured [3O2] and [S0] at just below the surface (d = 0) versus time in an Intralipid phantom (with μs = 0.2 cm−1) for three different initial Photofrin concentrations (27, 50, 167 mM). The symbols are measured values and the lines are SOED-calculated results. Figure 3c shows the PS photobleaching rate per PDT dose, d [ S 0 ] d t 1 [ S 0 ] ϕ [ O 2 3 ] / ( [ O 2 3 ] + β ) versus [S0]. The symbols are calculated values using Equation (7), and the line is the best linear fit. Figure 3d shows the expected SOED-calculated cumulative reacted singlet oxygen concentration, [1O2]rx, during illumination.

3.3. SOED/SOLD Comparison in Solution

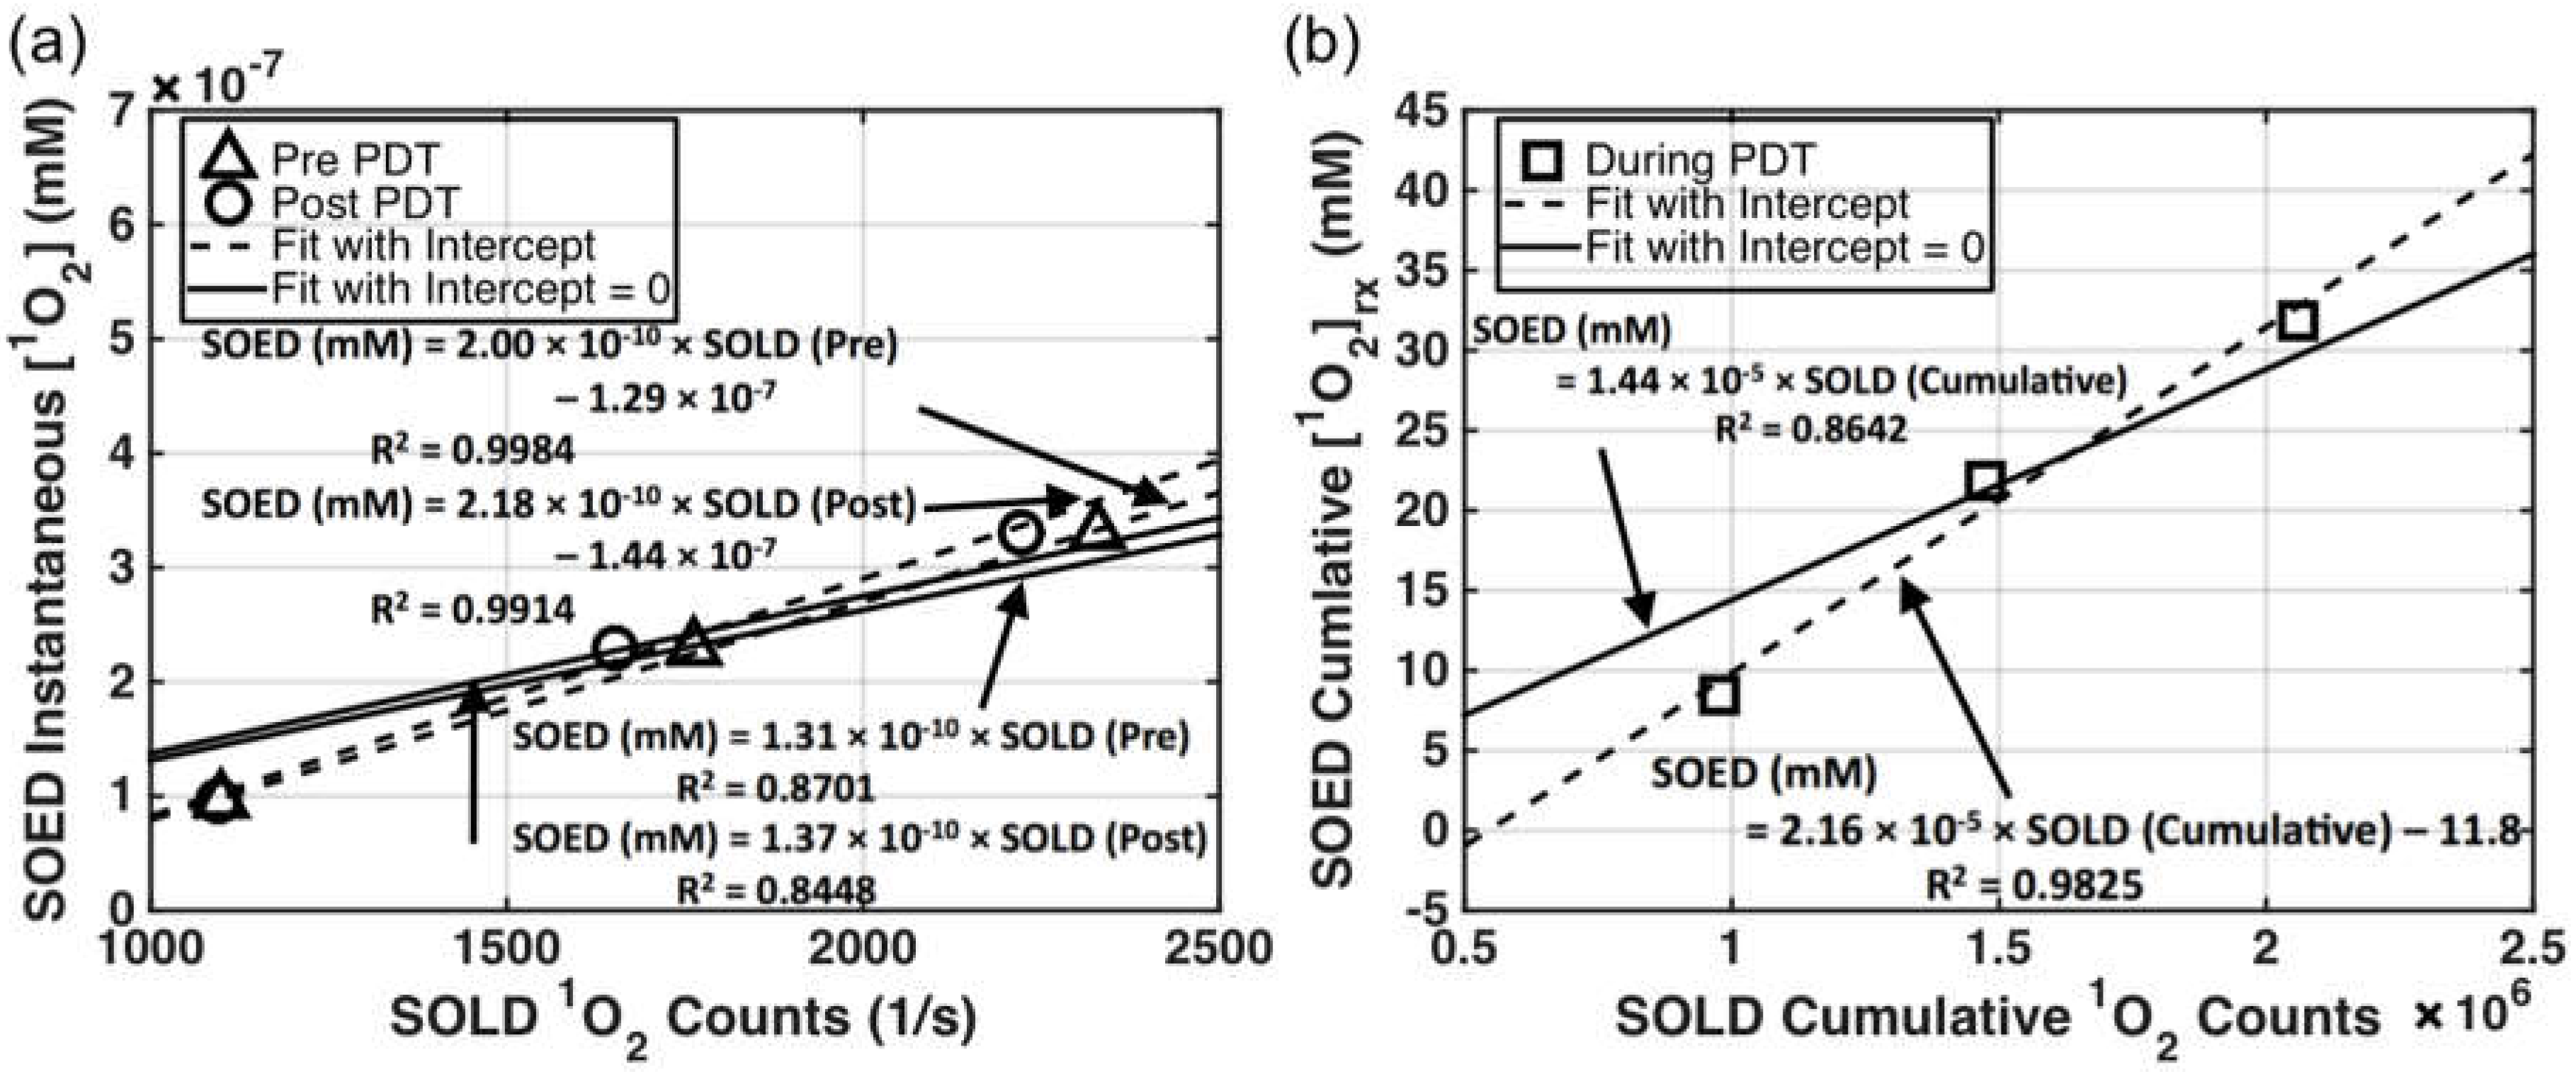
The singlet oxygen generated in Photofrin-containing solutions was calculated using SOED and the results were compared to SOLD-determined luminescence counts of 1O2. The latter was correlated with the amount of 1O2 produced instantaneously and cumulatively. Instantaneous [1O2] accounts for the singlet oxygen generated for each pulse of laser excitation, while cumulative [1O2]rx is the integral of all singlet oxygen produced during the entire illumination time over the entire illumination volume. The agreement between the two methods (SOED and SOLD) is shown in Figure 4: (a) shows SOLD counts per accumulation time (in seconds, t = 300 s before and after PDT) and (b) shows cumulative SOLD counts over the entire treatment time of 900 s. Photofrin was dissolved in MeOH solution.

4. Discussion

4.1. SOED and SOLD Intercomparison

The SOED calculated [1O2] value in solution in Figure 4a corresponded to the volumetric averaged instantaneous singlet oxygen concentration over a volume of 1 cm depth and 1 cm2 area. SOED-calculated [1O2]rx in Figure 4b corresponded to the volumetric average reacted singlet oxygen concentration of the same 1 cm3 volume. In these solutions, the light fluence was calculated by introducing attenuation that was only due to the photosensitizer absorption, since no scatterer was added and solutions were of pure Photofrin: φ = φ0 exp(−μa × d), where φ0 is the light fluence rate (mW/cm2) measured directly in the back of the front wall of the solution facing the laser. Absorption coefficients (μa) were 0.15, 0.45, and 0.74 cm−1 for Photofrin concentrations of 17, 50, and 83 mM, respectively, at 523 nm.
In order to experimentally determine the photophysical parameters of the spontaneous phosphorescence rate of 1O2 to 3O2 (k6) and the bimolecular reaction rate of 1O2 with the substrate (k7) in Photofrin phantoms, photosensitizer triplet-state and singlet oxygen lifetime measurements were obtained using the SOLD system. Varying amounts of the singlet oxygen quencher, sodium azide (NaN3), were added to the Photofrin–MeOH solutions. The resulting fits to obtain k6 and k7 are shown in Figure 2. For Photofrin with NaN3, k6 was found to be 1.14 × 10⁵ s−1 (the intercept of the line of best fit in Figure 2) and k7 was found to be 235 μM−1·s−1 (the slope of the line of best fit in Figure 2). k7 is pH-dependent, but is in the range of the reported value of 300–400 μM−1·s−1 for the quenching rate constant in water [38]. These values were used to calculate τ for the in vitro condition (without NaN3) and the in vivo condition (taken from the literature for biological tissue [34]). Assuming that k7 for NaN3 is greater than or equal to that of in vivo conditions (assuming biological tissue is less efficient than NaN3 in quenching 1O2), it can be estimated that in vivo acceptor concentration [A] ≥ 107 (s−1)/235 mM−1·s−1 = 42 mM. This value is much higher than [A] = 0.83 mM in the literature [10], but we feel that it is more reasonable since the singlet oxygen lifetime in vivo, τ, does not change for reacted singlet oxygen concentrations [1O2]rx as high as 12 mM [16], indicating there are still plenty of acceptors in vivo at this level.
The light fluence rate distribution in a semi-infinite medium as a function of distance (d) was calculated by a Monte Carlo (MC) simulation [39] of a circular parallel beam (diameter 0.8 cm, Figure 5a) and broad beam (diameter 16 cm, Figure 5b) for absorption coefficient (μa) of 0.09, 0.18, and 0.58 cm−1, and reduced scattering coefficient (μs) of 0.2 cm−1. The resulting φ/φ0 is shown in Figure 5 along with an exponential fit based on μa. For the tissue-simulating phantoms with Photofrin shown in Figure 3, φ0 is the measured local fluence rate at the front inner surface of the phantom facing the laser and d is the depth from surface. At 630 nm, μa = 0.09, 0.18, and 0.58 cm−1 for Photofrin concentrations of 27, 50, and 167 mM, respectively. It is clear that the function e−μad, while working well for the broad beam, does not work very well for the 0.8 cm diameter beam at the deepest depths investigated. As a result, MC-generated light fluence rate φ/φ0 was used directly for the SOED calculations in phantom.
SOED calculations of singlet oxygen concentration are highly dependent on the photophysical parameters used as input (Table 1). In turn, these parameters depend on the photosensitizer used, as well as the treatment environment. The necessary parameters for Photofrin-mediated PDT for in vitro studies were validated with explicit measurements of the [3O2] and [S0]. In particular, the consumption rate of [S0] per PDT dose was used to determine a more accurate value of σ (slope/ξ) and δ (intercept/slope) for the experimental setup used (Figure 3c and Equation (7)). This was used to determine δ and σ using a method from Reference [40] that is also described in Section 2.1. Photosensitizer concentration was measured over time to determine the photobleaching rate (−d[S0]/dt) and [S0]. Along with the measured [3O2], the PS photobleaching rate per PDT dose can be calculated and plotted as in Figure 3c. The slope and intercept of the fit to the data are used to calculate δ and σ. The value for ξ in vitro was calculated by the definition of ξ provided in Table 1. The resulting values were δ = 25 ± 4.3 μM and σ = (6.6 ± 7) × 10−5 μM−1. The value of β was set to be 11.9 μM for this set of experiments [34]. Figure 3a,b show the SOED calculations using Equations (2) and (3), which agree with [3O2](t) and [S0](t) measurements at surface (d = 0 cm) of the Intralipid phantom. Figure 3d shows the magnitude of SOED-calculated [1O2]rx using Equation (4) for Photofrin to be in the mM range.
It can be concluded from the intercomparison of SOED and SOLD in Photofrin solutions (Figure 5b) that the cumulative SOLD [1O2] counts, [SOLD], and SOED-calculated [1O2]rx values track each other very well (R2 = 0.98) for Photofrin, with a conversion factor of the following form:
[ O 2 1 ] r x ( m M ) = ( 2.16 × 10 5 ) × [ S O L D ] 11.8
The ratio of slopes between the two panels ((a) and (b)) in Figure 4 is 9.6 × 10⁻⁶ s, which is consistent with the value of τΔ obtained (9.4 × 10⁻⁶ s). The reason for the intercept is not known, and a linear fit without intercept reduces the correlation (R2 = 0.86). The good correlation of SOED-calculated [1O2] and [SOLD] demonstrates that SOED can be utilized in scenarios where direct phosphorescence measurement of 1O2 is difficult.

4.2. Feasibility of Using SOLD at 523 nm for Predicting [1O2]rx at 630 nm

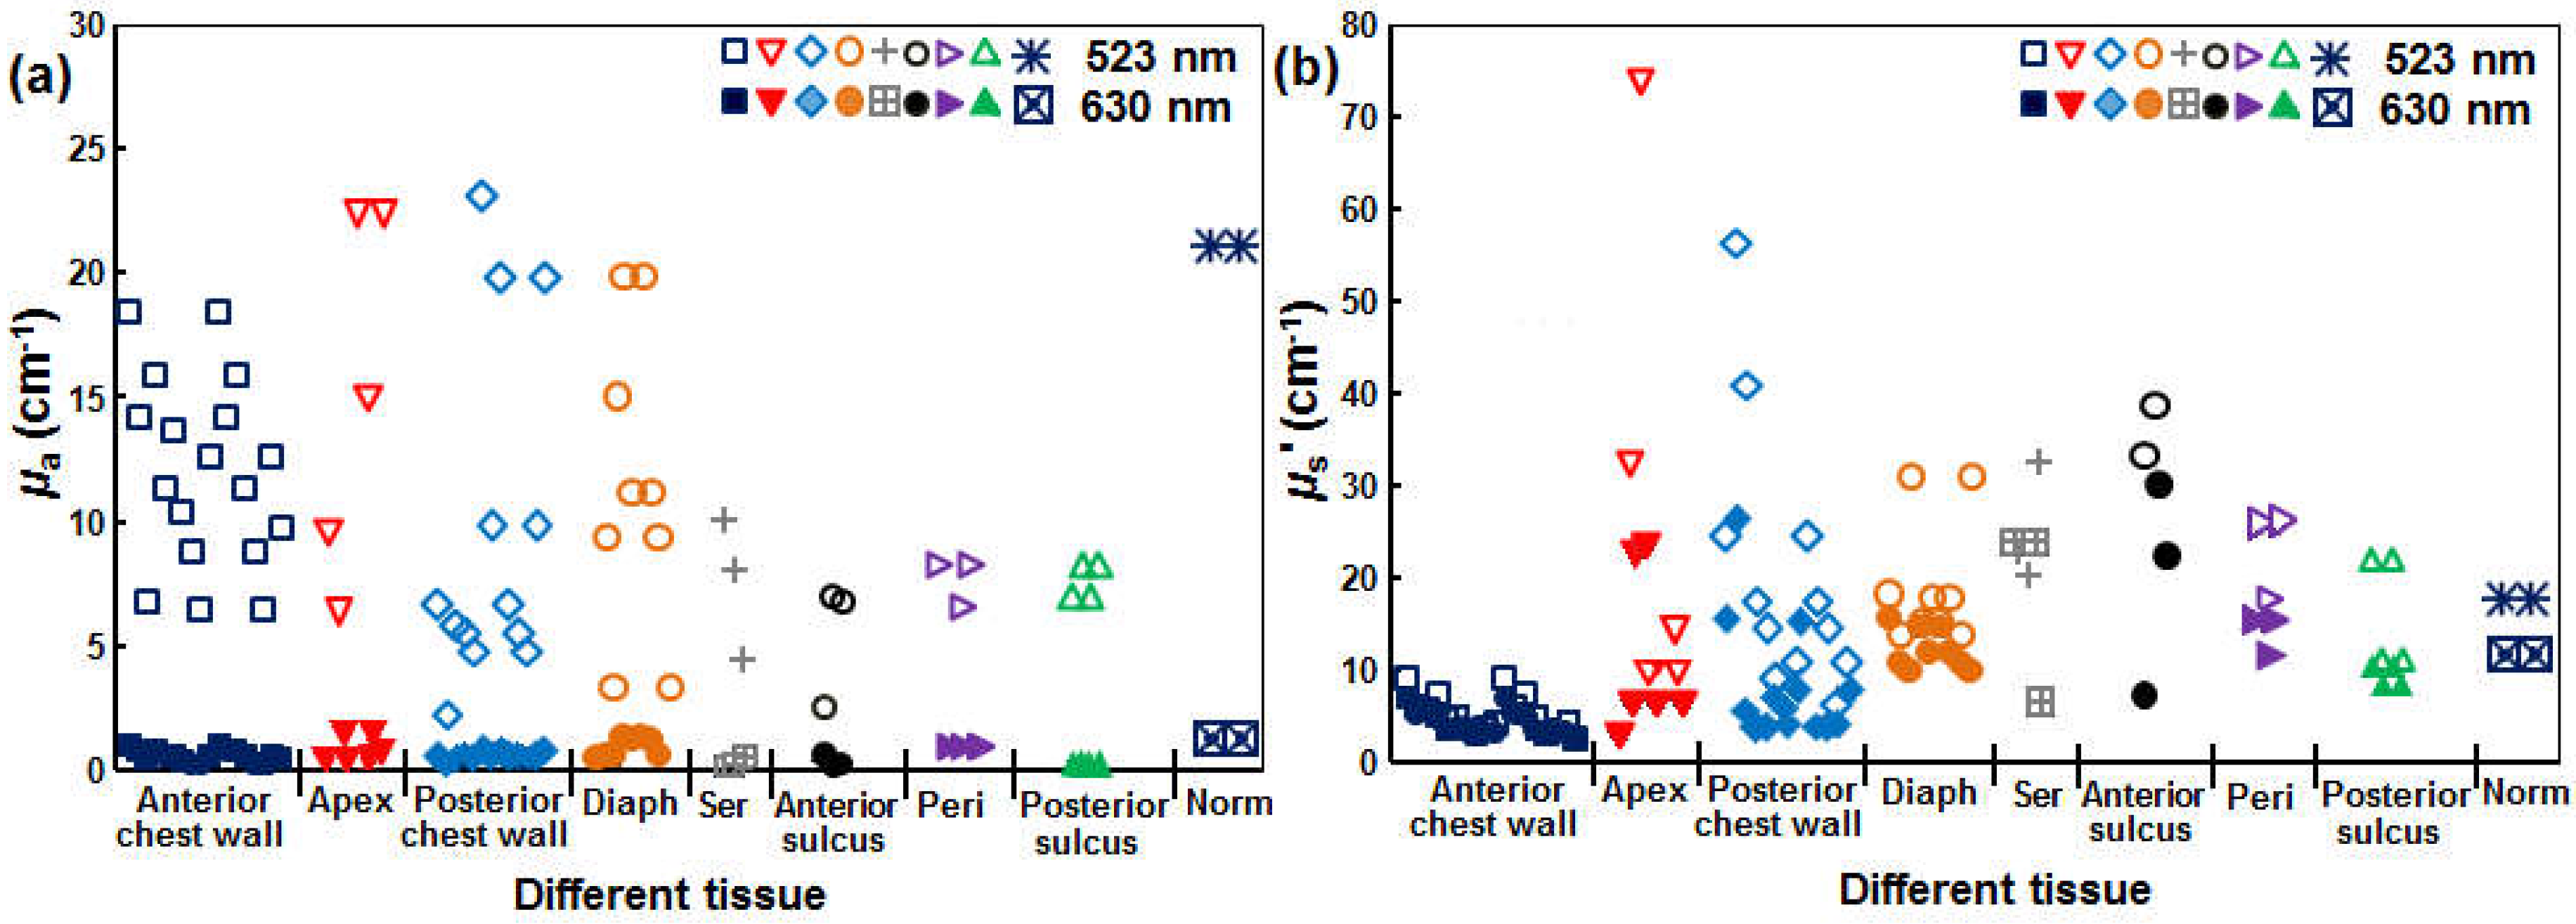
Currently, the only available pulsed laser suitable for the SOLD application (CrystaLaser, QL-523-200-S, CrystaLaser, Reno, NV, USA) is at 523 nm. As a result, the effective tissue-sampling depth for [1O2] is not the same as that of the 630 nm treatment light used clinically with Photofrin. Figure 6 shows the measured values μa and μs’ in various sites measured in vivo in patients, including the anterior chest wall, apex of the heart (apex), posterior chest wall, diaphragm (diaph), serratus (ser), anterior sulcus, posterior sulcus, pericardium (peri), and normal (norm) tissue. Patients were undergoing an institutional review board (IRB)-approved pleural mesothelioma Photofrin-PDT clinical protocol at the University of Pennsylvania. These optical properties were measured using a custom-built multifiber contact probe for absorption spectroscopy [27]. The measured optical properties include μa and μs’ for tissue as well as Photofrin.
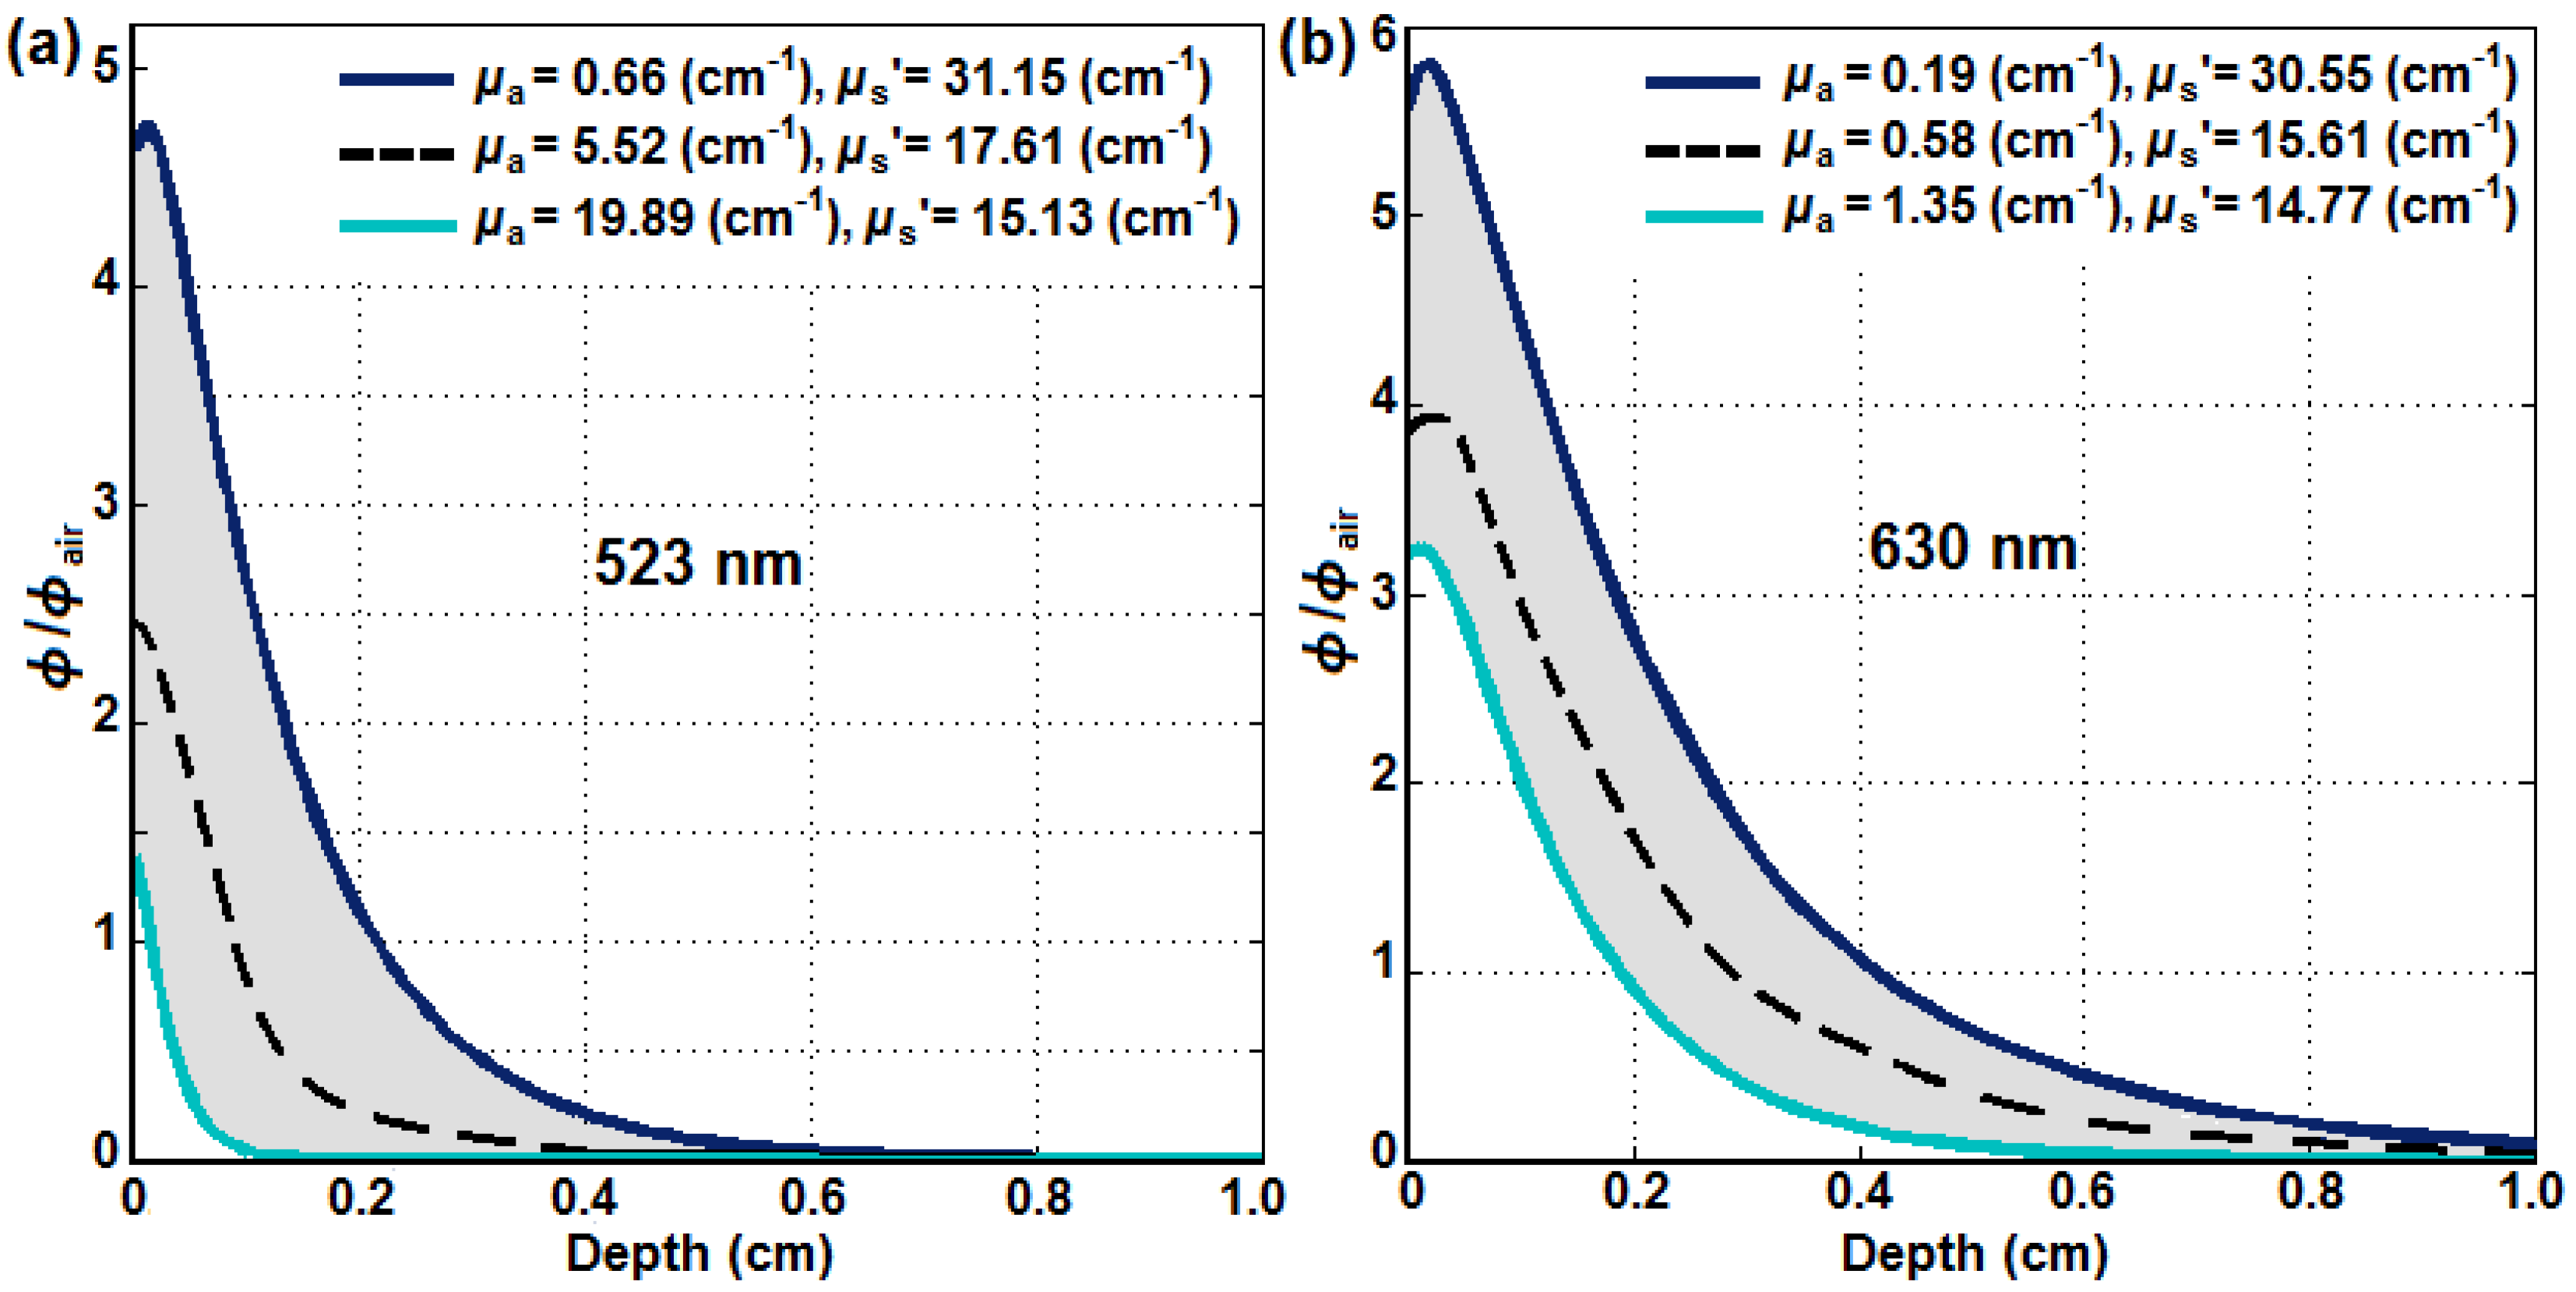
Using an analytical fit [28] to MC simulations [29,30,31,32], the longitudinal distribution of φ in tissue with different optical properties was calculated. Figure 7 shows the ratio of φ and in-air fluence rate (φair) versus tumor depth for (a) 523 nm and (b) 630 nm. The gray area shows the region of φ/φair with the upper and lower bounds of the tissue optical properties obtained in vivo as dark blue and light blue, respectively. The dashed black lines show the calculated light fluence distribution using the mean optical properties of μa = 5.52 cm−1 and μs = 17.61 cm−1 for 523 nm and μa = 0.58 cm−1 and μs = 15.61 cm−1 for 630 nm. As expected, the optical penetration is much deeper at 630 nm than at 523 nm in in vivo malignant pleural mesothelioma (MPM) patients.
The φ distributions were then used to calculate the reacted singlet oxygen concentration for the two wavelengths, in order to study whether SOLD signals measured at 523 nm can be used to monitor [1O2]rx at 630 nm. MPM PDT is currently performed at 630 nm. Correlation between the calculated [1O2]rx for 630 and 523 nm is shown in Figure 8. μa ranges from 0.66 to 23.1 cm−1 at 523 nm and 0.17 to 1.35 cm−1 at 630 nm, while μs ranges from 2.80 to 73.7 cm−1 at 523 nm and 2.55 to 30.5 cm−1 at 630 nm (Figure 6). In order to investigate the effects of different φ on the [1O2]rx, the SOED calculations were repeated for φ = 5, 25, 50, 75, and 150 mW/cm2. Different colors of symbols represent different φ. The black solid lines are the best fits in Figure 8b. At 523 nm, the range of [1O2]rx changed from 0–0.1, 0–0.63, and 0–5.6 mM for PS concentrations of 0.21, 2.1, and 21 µM, respectively, while the range of [1O2]rx at 630 nm changed from 0–0.25, 0–2.5, and 0–20 mM, respectively, for the same PS concentrations.
The resulting correspondence for a range of PS concentrations (c) of 0.21, 2.1, and 20.1 mM (based on the average Photofrin concentration obtained in patients) and light fluence of 10–120 J/cm2 [33] can be expressed as:
[ O 2 1 ] r x ( 630 n m ) = a ( c ) [ O 2 1 ] r x ( 523 n m ) + b ( c , ϕ )
where
a ( c ) = 0.05814 c + 1.922
and
b ( c , ϕ ) = ( 0.000618 c 0.000033 ) ϕ
where c is the PS concentration (in μM) and φ is the light fluence (in J/cm2). We thus conclude that SOLD measurement at 532 nm can be used to monitor [1O2]rx at 630 nm if a conversion formula (Equations (11)–(13)) is used to convert the measured SOLD signal.
When SOLD signal from patients are used to determine the generation of singlet oxygen, it is important to develop a tissue optical properties correction factor to account for the absorption and scattering of luminescence by tissue, similar to the optical properties correction factor needed for using fluorescence to determine the PS concentration [14]. This is beyond the scope of this paper.

5. Conclusions

Direct singlet oxygen luminescence dosimetry (SOLD) measurements were compared with singlet oxygen explicit dosimetry (SOED) calculations for phantoms using Photofrin. Oxygen and PS concentration measurements were compared with SOED predictions to validate the SOED model and to obtain the photophysical parameters (Table 1, δ = 25 ± 4.3 μM and σ = (6.6 ± 7) × 10−5 μM−1 in vitro). Using lifetime measurements obtained with the SOLD system, photophysical parameters k6 (1.14 × 10⁻⁵ s−1) and k7 (235 μM−1·s−1) were found for in vitro solutions with NaN3. A linear relationship between SOLD singlet oxygen photon counts at 1270 nm and SOED-calculated reacted singlet oxygen (Equation (10)) was established for Photofrin for 523 nm light excitation. Based on our SOED calculations, a formula (Equations (11)–(13)) for converting cumulative SOLD signal measured at 523 nm to the corresponding [1O2]rx at 630 nm was established using the optical properties at the two wavelengths in an ongoing MPM clinical protocol.
These results indicate that, with suitable correction for the tissue optical properties at the two wavelengths, there is excellent correlation between the direct (SOLD) and indirect (SOED) estimates of the singlet oxygen generated during PDT. Since, at the present time, the SOED approach is technically simpler and the instrumentation is significantly less expensive, this validation supports its use in clinical dosimetry. It should be noted, however, that the SOLD technique is intrinsically more robust in that no simplifying assumptions are required as in SOED. Hence, care must be taken in applying SOED to ensure that the treatment parameters lie within the range of validity of these assumptions. Furthermore, the validation of SOED must be carried out for each photosensitizer and set of clinical conditions. In the future, with developments such as our recent report of fiberoptic-coupled SOLD techniques based on novel superconducting nanowire single-photon detector technologies of direct SOLD, which currently can be considered as the laboratory Gold Standard for PDT dosimetry, may accelerate movement towards clinical utilization of SOLD alongside SOED. For type I PDT with photosensitizers, where a reactive oxygen species (e.g., oxygen radicals) other than singlet oxygen is the main cytotoxic agent, it is still possible to model the photophysical process using SOED, as described in a recent review [19]. However, it remains a challenge to find the value of photophysical parameters needed to describe the type I interactions for those photosensitizers.

Acknowledgments

We thank Jarod C. Finlay for providing absorption spectroscopy data for obtaining the tissue optical properties for the MPM clinical protocol. This work is supported by grants from the National Institute of Health (NIH) R01 CA154562 and P01 CA87971 (Timothy C. Zhu, Michele M. Kim) and the Princess Margaret Cancer Foundation (Brian C. Wilson, Israel Veilleux). Robert H. Hadfield acknowledges support from the European Research Council via Consolidator Grant IRIS. Robert H. Hadfield and Gerald S. Buller acknowledge support from the UK Engineering and Physical Sciences Research Council grant EP/K015338/1, and the UK Quantum Technology Hub in Quantum Enhanced Imaging, QuantIC, EP/M01326X/1.

Author Contributions

Michele M. Kim, Rozhin Penjweini, Nathan R. Gemmell, Israel Veilleux, Aongus McCarthy, Gerald S. Buller, Robert H. Hadfield, Brian C. Wilson and Timothy C. Zhu contributed to the study design and analysis and the writing of the report. All authors provided approval of the final draft of the report.

Conflicts of Interest

The authors declare no conflict of interest.

Abbreviations

The following abbreviations are used in this manuscript:
PSPhotosensitizer
SOEDSinglet Oxygen Explicit Dosimetry
SOLDSinglet Oxygen Luminescence Dosimetry

References

  1. Zhu, T.C.; Finlay, J.C. The role of photodynamic therapy (PDT) Physics. Med. Phys. 2008, 35, 3127–3136. [Google Scholar] [CrossRef] [PubMed]
  2. Wilson, B.C.; Patterson, M.S. The physics, Biophysics, and technology of photodynamic therapy. Phys. Med. Biol. 2008, 53, R61–R109. [Google Scholar] [CrossRef] [PubMed]
  3. Dougherty, T.J. Photodynamic Therapy. Photochem. Photobiol. 1993, 58, 896–900. [Google Scholar] [CrossRef]
  4. Foote, C.S. Definition of type I and type II photosensitized oxidation. Photochem. Photobiol. 1991. [Google Scholar] [CrossRef]
  5. Foote, C.S. Photosensitized Oxidation and Singlet Oxygen: Consequences in Biological Systems. In Free Radicals in Biology; Pryor, W.A., Ed.; Academic Press: New York, NY, USA, 1976; pp. 85–133. [Google Scholar]
  6. Weishaupt, K.R.; Gomer, C.J.; Dougherty, T.J. Identification of singlet oxygen as the cytotoxic agent in photo-activation of a murine tumor. Can. Res. 1976, 36, 2326–2392. [Google Scholar]
  7. Zhou, X.; Pogue, B.W.; Chen, B.; Demidenko, E.; Joshi, R.; Hoopes, J.; Hasan, T. Pretreatment photosensitizer dosimetry reduces variation in tumor response. IJROBP 2006, 64, 1211–1220. [Google Scholar] [CrossRef] [PubMed]
  8. Wang, K.K.; Finlay, J.C.; Busch, T.M.; Hahn, S.M.; Zhu, T.C. Explicit dosimetry for photodynamic therapy: Macroscopic singlet oxygen modeling. J. Biophotonics 2010, 3, 304–318. [Google Scholar] [CrossRef] [PubMed]
  9. Foster, T.H.; Murant, R.S.; Bryant, R.G.; Knox, R.S.; Gibson, S.L.; Hilf, R. Oxygen Consumption and Diffusion Effects in Photodynamic Therapy. Radiat. Res. 1991, 126, 296–303. [Google Scholar] [CrossRef] [PubMed]
  10. Hu, X.-H.; Feng, Y.; Lu, J.Q.; Allison, R.R.; Cuenca, R.E.; Downie, G.H.; Sibata, C.H. Modeling of a Type II Photofrin-mediated Photodynamic Therapy Process in a Heterogeneous Tissue Phantom. Photochem. Photobiol. 2005, 81, 1460–1468. [Google Scholar] [CrossRef] [PubMed]
  11. Sandell, J.L.; Zhu, T.C. A review of in vivo optical properties of human tissues and its impact on PDT. J. Biophoton. 2011, 4, 773–787. [Google Scholar] [CrossRef]
  12. Finlay, J.C.; Mitra, S.; Patterson, M.S.; Foster, T.H. Photobleaching kinetics of Photofrin in vivo and in multicell tumour spheroids indicate two simultaneous bleaching mechanisms. Phys. Med. Biol. 2004, 49, 4837–4860. [Google Scholar] [CrossRef] [PubMed]
  13. Moan, J.; Berg, K. The photodegradation of porphyrins in cells can be used to estimate the lifetime of singlet oxygen. Photochem. Photobiol. 1991, 53, 549–553. [Google Scholar] [CrossRef] [PubMed]
  14. Penjweini, R.; Liu, B.; Kim, M.M.; Zhu, T.C. Explicit dosimetry for 2-(1-Hexyloxyethyl)-2-devinyl pyropheophorbide-a (HPPH) mediated photodynamic therapy: Macroscopic singlet oxygen modeling. J. Biomed. Opt. 2015. [Google Scholar] [CrossRef] [PubMed]
  15. Qiu, H.; Kim, M.M.; Penjweini, R.; Zhu, T.C. Macroscopic singlet oxygen modeling for dosimetry of Photofrin-mediated photodynamic therapy: An in vivo study. J. Biomed. Opt. 2016. [Google Scholar] [CrossRef] [PubMed]
  16. Zhu, T.C.; Kim, M.M.; Liang, X.; Finlay, J.C.; Busch, T.M. In vivo singlet oxygen threshold doses for PDT. Photon Lasers Med. 2015, 4, 59–71. [Google Scholar] [CrossRef] [PubMed]
  17. Jarvi, M.T.; Niedre, M.J.; Patterson, M.S.; Wilson, B.C. Singlet Oxygen Luminescence Dosimetry (SOLD) for Photodynamic Therapy: Current Status, Challenges and Future Prospects. Photochem. Photobiol. 2006, 82, 1198–1210. [Google Scholar] [CrossRef] [PubMed]
  18. Niedre, M.J.; Yu, C.S.; Patterson, M.S.; Wilson, B.C. Singlet oxygen luminescence as an in vivo photodynamic therapy dose metric: Validation in normal mouse skin with topical amino-levulinic acid. Br. J. Cancer 2005, 92, 298–304. [Google Scholar] [CrossRef] [PubMed]
  19. Kim, M.M.; Ghogare, A.A.; Greer, A.; Zhu, T.C. On the in vivo photocheical rate parameters for PDT reactive oxygen species modeling. Phys. Med. Biol. 2016, in press. [Google Scholar]
  20. Wang, H.W.; Putt, M.E.; Emanuele, M.J.; Shin, D.B.; Glatstein, E.; Yodh, A.G.; Busch, T.M. Treatment-induced changes in tumor oxygenation predict photodynamic therapy outcome. Can. Res. 2004, 64, 7553–7561. [Google Scholar] [CrossRef] [PubMed]
  21. Gemmell, N.R.; McCarthy, A.; Kim, M.M.; Veilleux, I.; Zhu, T.C.; Buller, G.S.; Wilson, B.C.; Hadfield, R.H. A compact fiber-optic probe-based singlet oxygen luminescence detection system. J. Biophotonics 2016. [Google Scholar] [CrossRef] [PubMed]
  22. Gemmell, N.R.; McCarthy, A.; Liu, B.; Tanner, M.G.; Dorenbos, S.N.; Zwiller, V.; Patterson, M.S.; Buller, G.S.; Wilson, B.C.; Hadfield, R.H. Singlet oxygen luminescence detection with a fiber-coupled superconducting nanowire single-photon detector. Opt. Express 2013, 21, 5005–5013. [Google Scholar] [CrossRef] [PubMed]
  23. Jarvi, M.T.; Niedre, M.J.; Patterson, M.S.; Wilson, B.C. The influences of oxygen depletion and photosensitizer triplet-state dynamic during photodynamic therapy on accurate singlet oxygen luminescence monitoring and analysis of treatment dose response. Photochem. Photobiol. 2011, 87, 223–234. [Google Scholar] [CrossRef] [PubMed]
  24. Zhu, T.C.; Liu, B.; Penjweini, R. Study of tissue oxygen supply rate in a macroscopic photodynamic therapy singlet oxygen model. J. Biomed. Opt. 2015. [Google Scholar] [CrossRef] [PubMed]
  25. Finlay, J.C.; Conover, D.L.; Hull, E.L.; Foster, T.H. Porphyrin bleaching and PDT-induced spectral changes are irradiance dependent in ALA-sensitized normal rat skin in vivo. Photochem. Photobiol. 2001, 73, 54–63. [Google Scholar] [CrossRef]
  26. Gallagher-Colombo, S.M.; Quon, H.; Malloy, K.M.; Ahn, P.H.; Cengel, K.C.; Simone, C.B.; Chalian, A.A.; O’Malley, B.W.; Weinstein, G.S.; Zhu, T.C.; et al. Measuring the physiologic properties of oral lesions receiving fractionated photodynamic therapy. Photochem. Photobiol. 2015, 91, 1210–1218. [Google Scholar] [CrossRef] [PubMed]
  27. Wang, H.-W.; Zhu, T.C.; Putt, M.E.; Solonenko, M.; Metz, J.; Dimofte, A.; Miles, J.; Fraker, D.L.; Glatstein, E.; Hahn, S.M.; et al. Broadband reflectance measurements of light penetration, blood oxygenation, hemoglobin concentration, and drug concentration in human intraperitoneal tissues before and after photodynamic therapy. J. Biomed. Opt. 2005. [Google Scholar] [CrossRef] [PubMed]
  28. Ong, Y.H.; Zhu, T.C. An analytic function for predicting light fluence rate of circular fields on a semi-infinite turbid medium. Opt. Express 2016, 24, 26261–26281. [Google Scholar] [CrossRef] [PubMed]
  29. Wang, L.; Jacques, S.L.; Zheng, L. MCML-Monte Carlo modeling of light transport in multi-layered tissues. Comput. Methods Programs Biomed. 1995, 47, 131–146. [Google Scholar] [CrossRef]
  30. Jacques, S.L.; Wang, L. Monte Carlo modeling of light transport in tissues. In Optical-Thermal Response of Laser-Irradiated Tissue; Welch, A.J., van Gemert, M.J.C., Eds.; Springer: Plenum, NY, USA, 1995; pp. 73–100. [Google Scholar]
  31. Prahl, S.A.; Keijzer, M.; Jacques, S.L.; Welch, A.J. A Monte Carlo model of light propagation in tissue. SPIE Inst. Ser. 1989, 5, 102–111. [Google Scholar]
  32. Wilson, B.C.; Adam, G. A Monte Carlo model for the absorption and flux distributions of light in tissue. Med. Phys. 1983, 10, 824–830. [Google Scholar] [CrossRef] [PubMed]
  33. Hahn, S.M.; Putt, M.E.; Metz, J.; Shin, D.B.; Rickter, E.; Menon, C.; Smith, D.; Glatstein, E.; Fraker, D.L.; Busch, T.M. Photofrin uptake in the tumor and normal tissues of patients receiving intraperitoneal photodynamic therapy. Clin. Cancer Res. 2006, 12, 5464–5470. [Google Scholar] [CrossRef] [PubMed]
  34. Georgakoudi, I.; Nichols, M.G.; Foster, T.H. The mechanism of photofrin photobleaching and its consequences for photodynamic dosimetry. Photochem. Photobiol. 1997, 65, 135–144. [Google Scholar] [CrossRef] [PubMed]
  35. Dysart, J.S.; Singh, G.; Patterson, M.S. Calculation of singlet oxygen dose from photosensitizer fluorescence and photobleaching during mTHPC photodynamic therapy of MLL cells. Photochem. Photobiol. 2005, 81, 196–205. [Google Scholar] [CrossRef] [PubMed]
  36. Lovell, J.F.; Liu, T.W.; Chen, J.; Zheng, G. Activatable Photosensitizers for imaging and therapy. Chem. Rev. 2010, 110, 2839–2857. [Google Scholar] [CrossRef] [PubMed]
  37. Mitra, S.; Foster, T.H. Photophysical parameters, photosensitizer retention and tissue optical properties completely account for the higher photodynamic efficacy of meso-tetra-hydroxyphenyl-chlorin vs. photofrin. Photochem. Photobiol. 2005, 81, 849–859. [Google Scholar] [CrossRef] [PubMed]
  38. Wilkinson, F.; Helman, W.P.; Ross, A.B. Rate constants for the decay and reactions of the lowest electronically excited singlet state of molecular oxygen in solution. An expanded and revised compilation. J. Phys. Chem. Ref. Data 1995, 24, 663–667. [Google Scholar] [CrossRef]
  39. Zhu, T.C.; Dimofte, A.; Hahn, S.M.; Lustig, R.A. Light dosimetry at tissue surfaces for small circular fields. Proc. SPIE 2003, 4952, 56–67. [Google Scholar]
  40. Weston, M.A.; Patterson, M.S. Calculation of singlet oxygen dose using explicit and implicit dose metrics during benzoporphyrin derivative monoacid ring A (BPD-MA)-PDT in vitro and correlation with MLL cell survival. Photochem. Photobiol. 2011, 87, 1129–1137. [Google Scholar] [CrossRef] [PubMed]
Figure 1. Singlet oxygen luminescence dosimetry (SOLD) instrumentation setup (a) on an optical bench; and (b) schematic diagram of the experimental arrangement. PPG—pulse pattern generator; SPAD—single photon avalanche diode; TCSPC—time-correlated single-photon counting.
Cancers 08 00109 g001
Figure 2. Singlet oxygen lifetime (τΔ) changes due to quenching with various concentrations of sodium azide (NaN3) for Photofrin (50 μM) in MeOH, τΔ−1 = k6 + k7[A]. Symbols represent measured data and the solid line is the best linear fit.
Cancers 08 00109 g002
Figure 3. Comparison of measured and singlet oxygen explicit dosimetry (SOED)-calculated values of (a) [3O2](t) and (b) [S0](t) at d = 0 for three initial photosensitizer concentrations, [S0]0 = 27, 50, 167 μM. Measurements of ground-state oxygen were made at 5–30 s intervals, while photosensitizer spectra were obtained every 10 s. The average initial [3O2]0 value was 160.4 μM. (c) The left-hand side of Equation (7) versus the Photofrin concentration, with the line of best fit. The slope of the fit was (6.86 ± 0.6) × 10−7 mM·s−1·mW−1·cm2 and the intercept was (1.78 ± 0.25) × 10−5 s−1·mW−1·cm2, resulting in a value of δ = 25 ± 4.3 μM. (d) Calculated volume-averaged [1O2]rx over time. The light fluence rates used in the experiment were φ0 = 45, 38, and 42 mW/cm2 for each sensitizer concentration. The symbols are measured values in Figure 3a,b and are calculated values using Equation (7) for Figure 3c. The lines are SOED-calculated results for Figure 3a,b,d, and the line of best fit for Figure 3c.
Cancers 08 00109 g003
Figure 4. (a) Comparison of SOLD-obtained 1O2 counts (Equation (8)) per accumulation time (in seconds) at 523 nm and SOED-calculated instantaneous [1O2] (Equation (1)) for Photofrin concentrations in MeOH of 17, 50, and 83 μM, and light fluence φ0 = 30 mW/cm2. The initial oxygen concentration was measured as 175 ± 6 μM. (b) Comparison of SOLD cumulative 1O2 counts (Equation (9)) and reacted singlet oxygen concentration ([1O2]rx) calculated with SOED (Equation (4)) for Photofrin concentration of 17, 50, and 83 μM. PDT was performed with 523 nm light at φ0 = 30 mW/cm2 for 900 s.
Cancers 08 00109 g004
Figure 5. Monte Carlo (MC) simulation of fluence rate distribution by a circular beam of radius (a) 0.4 cm and (b) 8 cm incident on a semi-infinite liquid surface as a function of depth (d) for μa = 0.09, 0.18, and 0.58 cm−1 and μs’ = 0.2 cm−1. Fits of exponential forms are shown along with the MC data. The exponential form of e−μad fits the simulation well up to a depth of 0.4 cm, while overestimating φ/φ0 at larger depths. Broad-beam simulations agree with the simple exponential form up to a depth of 1.3 cm.
Cancers 08 00109 g005
Figure 6. (a) Tissue μa’ and (b) μs’ at 523 (hollow symbols) and 630 (filled symbols) nm measured in vivo in malignant pleural mesothelioma (MPM) patients.
Cancers 08 00109 g006
Figure 7. The ratio of φ and in-air fluence rate (φair) versus tumor depth for (a) 523 nm and (b) 630 nm optically broad laser beams on an air–tissue interface using an analytical formula that fits MC simulation [29,30,31,32] and optical properties obtained in in vivo MPM patients (Figure 4).
Cancers 08 00109 g007
Figure 8. (a) [1O2]rx calculated at 630 nm and 523 nm for different total fluence (φ = 10, 60, 120 J/cm2) for mean Photofrin concentrations (c) of (from left to right) 0.21, 2.1, and 21 μM. Absorption and scattering coefficients were obtained at the two wavelengths from Figure 6. SOED calculation of [1O2]rx used Equations (5) and (6) and averaged over a 1 cm depth and 1 cm3 volume using photophysical parameters listed in Table 1 for the in vivo conditions; (b) Slope and intercept of the correlation of [1O2]rx at 630 nm and 523 nm as a function of fluence and PS concentration.
Cancers 08 00109 g008
Table 1. Summary of photophysical parameters for Photofrin in vitro and in vivo.
ParameterDefinitionIn VitroIn Vivo
ε (cm−1·μM−1)Photosensitizer extinction coefficient0.0035 at 632 nm (1)
0.0089 at 523 nm (1)
β (μM)Oxygen-quenching threshold concentration k 4 k 2 *11.9 [34]
δ (μM)Low-concentration correction25 ± 4.3 (2)33 [15]
ξ (cm2·mW−1·s−1)Specific oxygen consumption rate ξ = Φ Δ ε h ν 10.3 × 10⁻³ (3)
at 632 nm
24.8 × 10⁻³ (4)
at 523 nm
3.7 × 10⁻³ [34]
at 632 nm
8.99 × 10⁻³ (5)
at 523 nm
σ (μM−1)Specific photobleaching ratio where σ = k1τΔ *(6.6 ± 7) × 10−5 (2)7.6 × 10⁻⁵ [8,34]
τΔ (s)Singlet oxygen lifetime 1 k 6 + k 7 [ A ] *(9.4 ± 0.2) × 10−6 (6)1.6 × 10⁻⁷ [35]
τt (s)Triplet state lifetime 1 k 4 + k 2 [ O 2 3 ] *(0.43 ± 0.03) × 10−6 (7)1.5 × 10⁻⁶ (7)
ΦΔSinglet oxygen quantum yield0.56 [36,37]0.20 [19]
(1) Measured from absorption spectroscopy; (2) Obtained from fitting shown in Figure 3c using Equation (7); (3) Calculated using ΦΔ = 0.56 in water, ε = 0.0035 cm−1·μM−1, and = 3.2 × 10⁻¹⁶ mWs at 632 nm; (4) Calculated using ΦΔ = 0.64 in MeOH, ε = 0.0089 cm−1·μM−1, and = 3.8 × 10⁻¹⁶ mWs at 523 nm; (5) Scaled in vivo value at 632 nm by ε(at 523 nm)/ε(at 632 nm); (6) Measured values from SOLD experiment when [A] = 0 (i.e., without NaN3 in MeOH solution); (7) Calculated from measured data using [3O2] = 40 μM for in vivo conditions and [3O2] = 169 μM for in vitro conditions. Thereby, τt in vivo was estimated by determining k2 in vitro (1.3 × 10⁴ μM−1·s−1) and using β = k4/k2 = 11.9 μM and 1/τt = k2(β + [3O2]); * The definition of the photophysical parameters are [19]: k1 = rate of photosensitizer (PS) photobleaching; k2 = rate of triplet PS quenching by 3O2; k4 = decay rate of triplet PS without 3O2; k6 = rate of 1O2 phosphorescence decay; k7 = rate of 1O2 quenching by substrate.