
Meta Deep Learn Leaf Disease Identification Model for Cotton Crop


1
Department of Computer Systems Engineering, Quaid-e-Awam, University of Engineering, Science & Technology, Nawabshah 6748, Pakistan
2
Department of Software Engineering, Quaid-e-Awam, University of Engineering, Science & Technology, Nawabshah 6748, Pakistan
3
Department of Computer Engineering, Bahria University, Karachi Campus, Karachi 75260, Pakistan
*
Author to whom correspondence should be addressed.
Computers 2022, 11(7), 102; https://doi.org/10.3390/computers11070102
Submission received: 14 May 2022
/
Revised: 16 June 2022
/
Accepted: 18 June 2022
/
Published: 22 June 2022
Abstract
:Agriculture is essential to the growth of every country. Cotton and other major crops fall into the cash crops. Cotton is affected by most of the diseases that cause significant crop damage. Many diseases affect yield through the leaf. Detecting disease early saves crop from further damage. Cotton is susceptible to several diseases, including leaf spot, target spot, bacterial blight, nutrient deficiency, powdery mildew, leaf curl, etc. Accurate disease identification is important for taking effective measures. Deep learning in the identification of plant disease plays an important role. The proposed model based on meta Deep Learning is used to identify several cotton leaf diseases accurately. We gathered cotton leaf images from the field for this study. The dataset contains 2385 images of healthy and diseased leaves. The size of the dataset was increased with the help of the data augmentation approach. The dataset was trained on Custom CNN, VGG16 Transfer Learning, ResNet50, and our proposed model: the meta deep learn leaf disease identification model. A meta learning technique has been proposed and implemented to provide a good accuracy and generalization. The proposed model has outperformed the Cotton Dataset with an accuracy of 98.53%.
1. Introduction
The agriculture industry plays an important role in generating revenue and meeting the food demand of the people [1]. Agriculture is under severe strain because of rising food demand. A country with good agricultural land has a significant advantage in meeting its food requirement and in contributing to the economy by exporting agricultural products to other countries. As the world’s population grows, so does the demand for food. Crop disease is an essential issue in agriculture, as it causes significant crop damage. Crop disease [2] is the most serious hazard to agriculture, resulting in low yields and lowering food quality and quantity. Cotton [3] is an essential cash crop that helps produce natural fiber. The significant contribution of the cotton crop is making cloths. It enables the textile industry to grow. Besides other factors, plant protection [4] is essential in cotton production. Often a country is unable to supply enough food to meet demand due to disease in the agriculture sector. The traditional method of identifying crop diseases is challenging for reliable crop evaluation. The traditional approach to identifying crop diseases begins with the employment of a domain specialist who visits the site and observes the crop using optical inspection. This is a time-consuming and labor-intensive technique. It also necessitates constant crop monitoring. Farmers in some areas do not have access to experts, which is another major issue. Optical tracking is not always reliable for detecting crop diseases. Using traditional methods to diagnose the disease in the crop will not provide an accurate assessment. Plant diseases [4] produce both qualitative and quantitative losses. Researchers have recently focused their attention on the agriculture industry to discover crop diseases using automated methods. Deep Learning [5] and Computer Vision are two examples of current technologies that assist in the autonomous detection of agricultural diseases without human interaction. A computerized approach for identifying plant disease [6] would be more accurate, less costly, and faster. Plant diseases cost the agriculture industry a lot of money worldwide [7]. Crop disease management is essential for ensuring food quality and quantity. To reduce disease spread and improve efficient treatment measures, plant diseases [8] must be diagnosed early. Evaluating plant disease health, which includes forecasting approaches and treatment implementation models, is critical to effective crop management. The computational method for detecting and diagnosing plant diseases aids the agronomist. Old techniques allow for a subjective approach to determining the disease. On the other hand, new technologies provide an objective method for identifying plant diseases. Automated solutions, such as Deep Learning [9], aid in the accurate and reliable identification of crop diseases, saving time and money. Because of the disease and the dynamic environment, early and accurate identification of diseased plant leaves is a critical problem in Computer Vision. The leaf image with a busy background, angle, and extremely minute symptoms contribute to the complexity. Visual symptoms [10] aid in the diagnosis of the condition. The image with a complicated background, on the other hand, is a challenging assignment. The main goal of this study is to propose and develop a generalized model for identifying leaf disease accurately. This study aims to provide a model based on meta Deep Learning that can provide generalizations. Some of the diseases we focus on are leafspot, bacterial blight, target spot, powdery mildew, leaf curl, nutrient deficit, and verticillium wilt.
1.1. Crop Health Assessment Using Deep Learning Techniques
Deep learning (DL) is a highly specialized field. It is a machine learning subfield that has become increasingly popular in recent years due to its capacity to handle large datasets like images, texts, and audio [11]. DL has been successfully applied in plant science to evaluate the diagnosis of plant diseases [12] based on leaf images [13]. One of the many benefits of Deep Learning is feature extraction learning. The automated feature extraction procedure aids in the extraction of useful information. DL can handle complicated problems more quickly and efficiently because it uses sophisticated models. The complex models utilized in DL may help to enhance accuracy and reduce error in traditional methods. The conventional neural network architecture for disease classification is shown in Figure 1.
1.2. Convolution Neural Network
Convolutional Neural Networks (CNNs) [14,15] are among the most effective learning algorithms for comprehending visual content, with excellent image classification, object detection, segmentation, and retrieval results. A typical CNN architecture for recognizing Foliar Leaf Spot is shown in Figure 2.
1.3. Transfer Learning
2. Related Work
Plant disease identification using Deep Learning helps identify diseases accurately. However, identifying leaf diseases with background information is challenging. In [1], the author proposeda Plain CNN called PCNN and Deep Residual Neural Network called DRNN to find various disease of cassava plant. The obtained a dataset from a Kaggle. Author achieved an accuracy of 96.75% with DRNN. On a publicly available dataset for plant disease classification, [17] the author used CNN on plant leaf images to identify healthy and unhealthy leaf images. The findings included image segmentation, LBP, and grab cut approaches, among other image processing techniques. To segregate the affected part, the approaches used to real-world images. On the other hand, the proposed research does not offer a remedy for infected plants, such as leaf curl virus, shaded images, or semi-shaded images. Only vine leaves were used in the test. A generic solution should be provided to validate the accuracy of the model. The author used three learning algorithms and several state-of-the-art CNN architectures to reach 99.76% accuracy [18]. The author suggests using saliency maps as a visualization technique to better comprehend and interpret the CNN classification. This aids in boosting the transparency of Deep Learning, according to the author. The author in [19] proposed a genetic algorithm to detect and classify leaf disease. The author applied various image processing techniques on the leaf collected using a camera in the study. The image processing techniques include removing undesired distortion by using a smoothing filter, thresholding for green pixels, and removing masked cells. The population applies to the samples, and the best samples are selected in each round. Furthermore, the clustering technique is used, and after that, various features are extracted from the image, including color and texture. On the feature dataset, the SVM classifier is applied. The accuracy of the proposed scheme reached 97.6%. The author of [20] used the EVI time series to create deep neural networks with different architectures to classify summer crops. In [21], the author has used thermal imaging technology to identify crop disease. According to the author, thermal imaging technology has several advantages, including fast dynamic reaction, intuitive visuals, a wide detection range, and excellent precision. The author has explored and proposed methods for the detection of crop disease. In [22] the author has proposed an algorithm named LTSRG, which used the seed region growing method and local threshold method to identify diseases in the corn. In [23], agriculture, plants, and pest infestation directly affected the income of the smallholder farmers. The author proposed a CNN used for image classification as a system for identifying plant diseases. The author in [24] has proposed an image processing algorithm to detect healthy and unhealthy leaves of wheat crops. Image segmentation, feature extraction, texture features, shape features, and color features are among the image processing techniques employed by the author. The author has used two algorithms to classify healthy and unhealthy leaves: Neural Networks and the SVM. The author says the SVM has produced more accurate results than CNN. In [25], the author has applied image recognition based on an SVM based on an RBF kernel to identify disease in cucumbers. The leaf spots were taken as a sample instead of a leaf as a sample to increase experimental samples. In [26] the author has used a deep residual network that uses a residual map to identify the pest, including improved computational frameworks, specifically Graphical Processing Units (GPU) embedded processors. The author used Deep Learning to identify plant diseases. A deep convolutional neural network was used in this research. CNN, RNN, and GAN are the most common Deep Learning algorithms. Subcategory DL algorithms include VGGNet, ConvNets, LSTM, and DCGAN [27]. In [28], Deep Learning was used by the author to identify plant diseases based on vein patterns. The author has not considered the shape and color of the image. The author said that the standard CNN performed better with an expected machine vision pipeline. The standard visualization model helped find the plant disease patterns from the leaf veins. In [29], to detect paddy pests and diseases, the author used Deep Learning. The author gathered diverse crop photos from sources other than the public datasets on the internet, such as plant village and the ImageNet dataset. The author employed the CaffeNet architecture and attained an accuracy of 80%. The author proposed a CNN-based classifier for cucumber diseases in [30]. For training and validation, they used two datasets. In addition to the safety class, these datasets include seven distinct types of diseases. In [31] the author extracted color features of veins and disease spots using YCbCr, HSI, and CIELAB. The author used SVM, which is used to define boundaries helping in separating data, and the K-Nearest Neighbor (KNN) for classifying objects and Neural Networks (NN). The author [32] claims the work is a generalized approach for detecting every disease while no evidence is provided. The author [33] has used two-stage segmentation to extract lesions from leafspot. Two-stage segmentation was implemented using GrabCut with the SVM method. Various features were extracted, such as Color, Texture, and border. Data Augmentation was done using AR-GAN to generate more images. The suggested study has a 96.11% average accuracy. The limitation of the work is that the experiment was performed on 600 images, and the model was not tested on other plants to judge the accuracy of the model for generalization. In [34], the author presented a GAN-based data augmentation technique to increase the size of the dataset. The dataset was trained on a variety of CNN architectures, including (AlexNet, VGG16, DenseNet, Xception, RestNet, ResNext, SEResNet, and EfficientNet). The proposed model was 98.70% accurate. The author has not tested the model outside of the Grape dataset to generalize the model. Only leaf images with no background are included in the Grape Dataset. The model’s performance on real-world images will suffer due to this method. To detect different diseases in cucumber, the author [35] presented a Deep CNN. The proposed work was carried out on 1184 original pictures. The initial dataset was increased to 14,208 rows using data augmentation. The author claims an accuracy of 93.4%. The proposed model has lower accuracy, and it was not trained on other benchmark datasets, which is the limitation of the proposed work. The author [36] in the study proposed Mask R-CNN to detect various Grape varieties by using instance segmentation. The limitation of the work is the proposed method will only work with Grape because of the annotated Dataset of Grape to detect instances. Deep learning-based plant disease identification aids in the accurate identification of illnesses. Identifying leaf diseases using only background knowledge, on the other hand, is difficult. The author of [1] proposed a genetic approach to disease detection. The proposed approach is based on population. The same remedy was offered to a fresh population as the prior one. The study’s author employed an image segmentation method based on a clustering algorithm. Before masking the green region, the study’s author removed unwanted noise from the photos. The recovered features were recorded in a feature dataset, and an SVM classifier was used to classify the infected region. The study supplied a dataset with roughly 15 photos for training and 10 images for testing for each class. The proposed model was tested on a small dataset of fewer than 100 photos. The author [17] used EfficientB0 and DenseNet121 to find out the disease in corn. The author combined the features of EfficientB0 and DenseNet121 to find out the complex feature of the infected corn leaf images. Author compared the results with CNN and different pre-trained models which include ResNet152 and Inception V3. The proposed model showed an accuracy of 98.56% on 15408 images of corn. To achieve a 99.76% accuracy, the author used three learning algorithms and several state-of-the-art Convolutional Neural Network (CNN) architectures [18]. To better understand and interpret the CNN classification, the author advises employing saliency maps as a visualization tool. According to the author, it helps to increase the transparency of Deep Learning. In his paper [19], the author proposed a genetic algorithm for detecting and classifying leaf illness. The author used various image processing algorithms on the leaf acquired using a camera in the study. The image processing techniques include employing a smoothing filter to remove unwanted distortion, thresholding for green pixels, and eliminating masked cells. The population is applied to the samples, and in each round, the best samples are chosen. Following that, the clustering technique is utilized to extract numerous features from the image, such as color and texture. The SVM classifier is used on the feature dataset. The proposed strategy had a 97.6 percent accuracy rate. To categorize summer crops, the author of [20] used the EVI time data to develop deep neural networks with various architectures. The author used thermal imaging technology to detect crop disease in [21]. The author argued that thermal imaging technology offered various advantages, including quick dynamic response, intuitive graphics, a large detection range, and high precision. The author has investigated and developed approaches for agricultural disease detection. The author of [22] introduced the LTSRG algorithm, which employed the seed region growing method and the local threshold method to identify disease in maize. Agriculture, plants, and insect infestation all directly affect the revenue of smallholder farmers, according to [23]. The author presented CNN for image classification as a strategy for identifying plant diseases. In [24], the author suggested an image processing technique for detecting good and diseased wheat crop leaves. The author uses image processing techniques such as picture segmentation, feature extraction, texture features, shape features, and color features. The author employed two methods to classify healthy and ill leaves: neural networks and SVM. According to the author, the SVM produces more accurate results than CNN. To diagnose the disease in cucumbers, the author used image recognition based on SVM based on RBF kernel in [25]. To enhance the number of experimental samples, leaf spots were used instead of leaves. The author has employed a variety of approaches, including image processing and computer learning, to detect agricultural diseases. To identify the pest, the author employed a deep residual network with a residual map in [26]. This included the use of embedded processors with better computational frameworks, particularly graphical processing units (GPUs). To identify plant diseases, the author employed Deep Learning. In this study, a deep convolutional neural network was deployed. The most prevalent Deep Learning algorithms are CNN, RNN, and GAN. VGGNet, ConvNets, LSTM, and DCGAN are examples of subcategories of DL algorithms. The author of [28] employed Deep Learning to identify plant diseases based on vein patterns. The author had not examined the image’s form or color. According to the author, the typical CNN fared better, with an expected machine vision pipeline. The conventional visualization model assisted in detecting plant disease patterns in the veins of the leaves. The author of [29] employed Deep Learning to detect paddy pests and diseases. The author gathered varied crop photographs from sources other than public datasets on the internet, such as plant village and the ImageNet dataset. The author used the CaffeNet architecture and achieved an accuracy of 80%. The author suggested a CNN-based classifier to classify cucumber illnesses. They used two datasets for training and validation. These datasets comprised seven different types of disorders and the safety class. Using YCbCr, HSI, and CIELAB, the author of [31] retrieved color features of veins and illness spots. The author [30] employed SVM to construct boundaries for data separation, K-Nearest Neighbor (KNN) for object classification, and neural networks for object classification (NN). While no data is offered, the author [32] asserts that the work is a generalized strategy for detecting all diseases. The author employed a two-stage segmentation method to extract lesions from the leafspot. GrabCut was used in conjunction with the SVM approach to accomplish a two-stage segmentation. Color, texture, and border were among the features extracted. To produce new images, AR-GAN was used to augment the data. The accuracy of the proposed study is 96.11% on average. The disadvantage of the study is that the experiment was limited to 600 images, and the model was not tested on additional plants to determine its generalization accuracy. The author of [34] presented a GAN-based data augmentation strategy for increasing the dataset size. A variety of CNN architectures were used to train the dataset, including (AlexNet, VGG16, DenseNet, Xception, RestNet, ResNext, SEResNet, and EfficientNet). The proposed model had a precision of 98.70%. The model was not tested outside of the Grape dataset to generalize it. The Grape Dataset only contains leaf images with no background. Because of this strategy, the performance of the model on real field images will degrade. The author [35] presented a transfer learning approach to detect various diseases. The author used a VGG transfer learning, AlexNet, CNN RNN. The training model achieved an accuracy of 99.80 on plantvillage dataset. Mask R-CNN was proposed by the author [36] in the study to detect diverse grape types via instance segmentation. The proposed method will only operate with grape due to the annotated Grape Dataset used to detect instances, which is a limitation of the work.
3. Materials & Methods
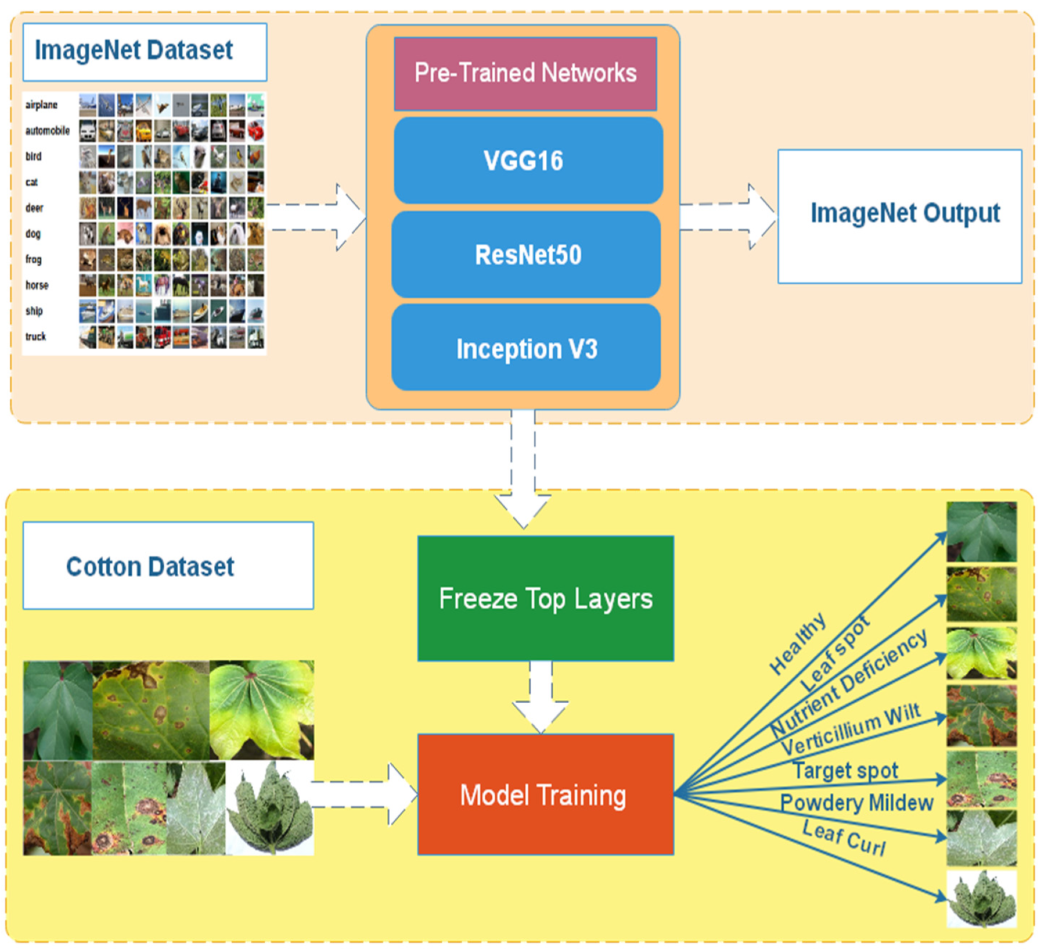
Our suggested method minimizes the parameters and achieves good accuracy. The Custom CNN, VGG16, ResNet50, and the meta learning algorithm were used to train the cotton dataset. The CNN model comprises five convolutional layers, a dropout layer, and a max-pooling layer. To diagnose leaf disease, the SoftMax layer has 7 classes. It took 1 h 34 min and 56 s to train the model on CNN. In CNN, the total number of parameters was 9,185,606, resulting in an accuracy of 95.37%. VGG 16 is a well-known pre-trained model. It was initially used on the ILSVRC in 2014. It was the winner of an ILSVRC challenge. VGG16 is an easy-to-implement pre-trained network. It has a total of 16 layers. By freezing the top layers of the VGG16 pre-trained model, we were able to conduct our research. On a cotton dataset, the model took 54 min and 3 s to run with 14,878,982 parameters and obtained an accuracy of 98.10%. The model was trained on fewer parameters with considerably higher accuracy than custom CNN. ResNet50 is a pre-trained machine learning model. Initially, the model was trained on the ImageNet dataset. The top layers of ResNet50 were frozen to implement it. The accuracy of the model was 98.32%. The proposed model, based on a meta Deep Learning algorithm, significantly improved the results, and achieved an accuracy of 98.53%. We trained multiple models on our dataset. First the CNN model was trained, and pre-trained models such as VGG16, ResNet50 and Inception V3 were trained. At the end, multiple models were combined together using the ensemble approach. The final model was again trained on the cotton dataset. The workflow of the model is shown in Figure 4. The data was collected first, and then the undesired noise was eliminated from the photos. The annotating procedure is shown in the next step. Agriculture experts completed the annotating procedure. After annotation, the data augmentation procedure was employed to enhance the dataset’s size.
Figure 5 shows the methodology of our proposed work. The proposed model learns from multiple models, including custom CNN, VGG16, and ResNet50. The meta deep model learns from different models using the ensemble method to combine all models and produce a final model. The proposed model was implemented through training multiple models like custom CNN, VGG16, and ResNet50 on our cotton dataset. After training different models, the models were combined together using stacked ensemble learning and a final model was implemented. The stacked model improved the classification accuracy.
Dataset
Our dataset contains 2384 images of cotton leaves separated into seven classes (Healthy, Leafspot, Nutrient Deficiency, Powdery mildew, Target spot, Verticillium Wilt, and Leaf curl). The images were taken in the Pakistani city of Matiari, located in Sindh Province. The images were captured at different timings i-e. morning, noon, and evening. To create a dataset, background noise was added to images of cotton leaves taken with a mobile camera at a resolution of 3120 × 4160 pixels. For capturing leaf images, a vivo V21 mobile was used. The original size of the images was 3120 × 4160. The real field contained multiple leaves along with some background noise such as weeds. The image was cropped manually to extract a leaf. The images were rotated at 30°, and horizontal and vertical flip was used. After gathering the images, the following step was to remove any unwanted noise. To finish the dataset, this operation was done manually. To generate a final dataset, image pre-processing techniques were used, which include rescaling, image enhancement, and contrast enhancement. The dataset was annotated by agriculture professionals, who labeled each image according to the disease it contains. Finally, the dataset was divided into training and test sets for model training. We only used 20% of the data for the test set. Different classes of diseases are shown in Figure 6, which include Healthy, Leafspot, Nutrient Deficiency, Powdery mildew, Target spot, Verticillium Wilt, and Leaf curl. Figure 6 shows various leaf diseases. In Figure 6a shows Healthy image, Figure 6b shows Leaf spot, Figure 6c shows Nutrient Deficiency, Figure 6d shows Powdery Mildew, Figure 6e shows Target spot, Figure 6f shows Verticillium Wilt, Figure 6g shows Leaf curl.
Table 1 describes the different models, number of parameters for training, total training time and the floating point operations (FLOPs) of each model. The proposed model uses a smaller number of parameters as compared to other models.
The dataset consisted of a total of 2385 images, of which 1910 were used for training and 475 were used for testing. The dataset contained seven disease classes, which included, for example, (nutrient deficiency, healthy, leafspot, powdery mildew, target spot, verticillium, and leaf curl). Table 2 shows the total number of classes, the number of images for training, and the number of images for the test.
Figure 7 shows the number of parameters of each model. Our proposed model contains very a smaller number of parameters.
Figure 8 shows the detailed illustration of dataset. It shows the images for train and test of each diseased class.
Table 3 shows the disease classes and the total training images and the test images.
There are 11 convolution layers in the CNN model. A total of 9,185,606 parameters were used to train the model. The entire training time was 1 h 34 min 56 s on the GPU. The hyperparameters utilized for training models are listed in Table 4. A total of 100 epochs were used for training a CNN with the Adam optimizer and a learning rate of 0.0001, a batch size of 32, and an input shape of 224*224. VGG16 was trained over 100 epochs using the Adam optimizer, with the learning rate set to 0.001, dropout set to 0.5, batch size set to 32, and input shape set to 224*224. The proposed model was trained on 100 epochs with fewer parameters and resulted in good accuracy. Figure 9 depicts a variety of leaf images with various diseases.
4. Performance Matrix
To measure the performance of each model, various parameters were considered such as accuracy, sensitivity, specificity, precision and F1 score. Equation (1) is used to calculate the accuracy of the model.
The number of correctly recognized healthy leaf images (TP) is equal to the number of correctly recognized unhealthy leaf images (TN). The misidentified healthy and unhealthy leaf images are referred to as false positive (FP) and false negative (FN), respectively. The confidence interval for classification accuracy is found by the percentage of correct predictions from total predictions. In addition to this we also use other parameters to measure the performance of the model, which include f1 score, precision, and recall.
Figure 10 shows the correctly predicted images.
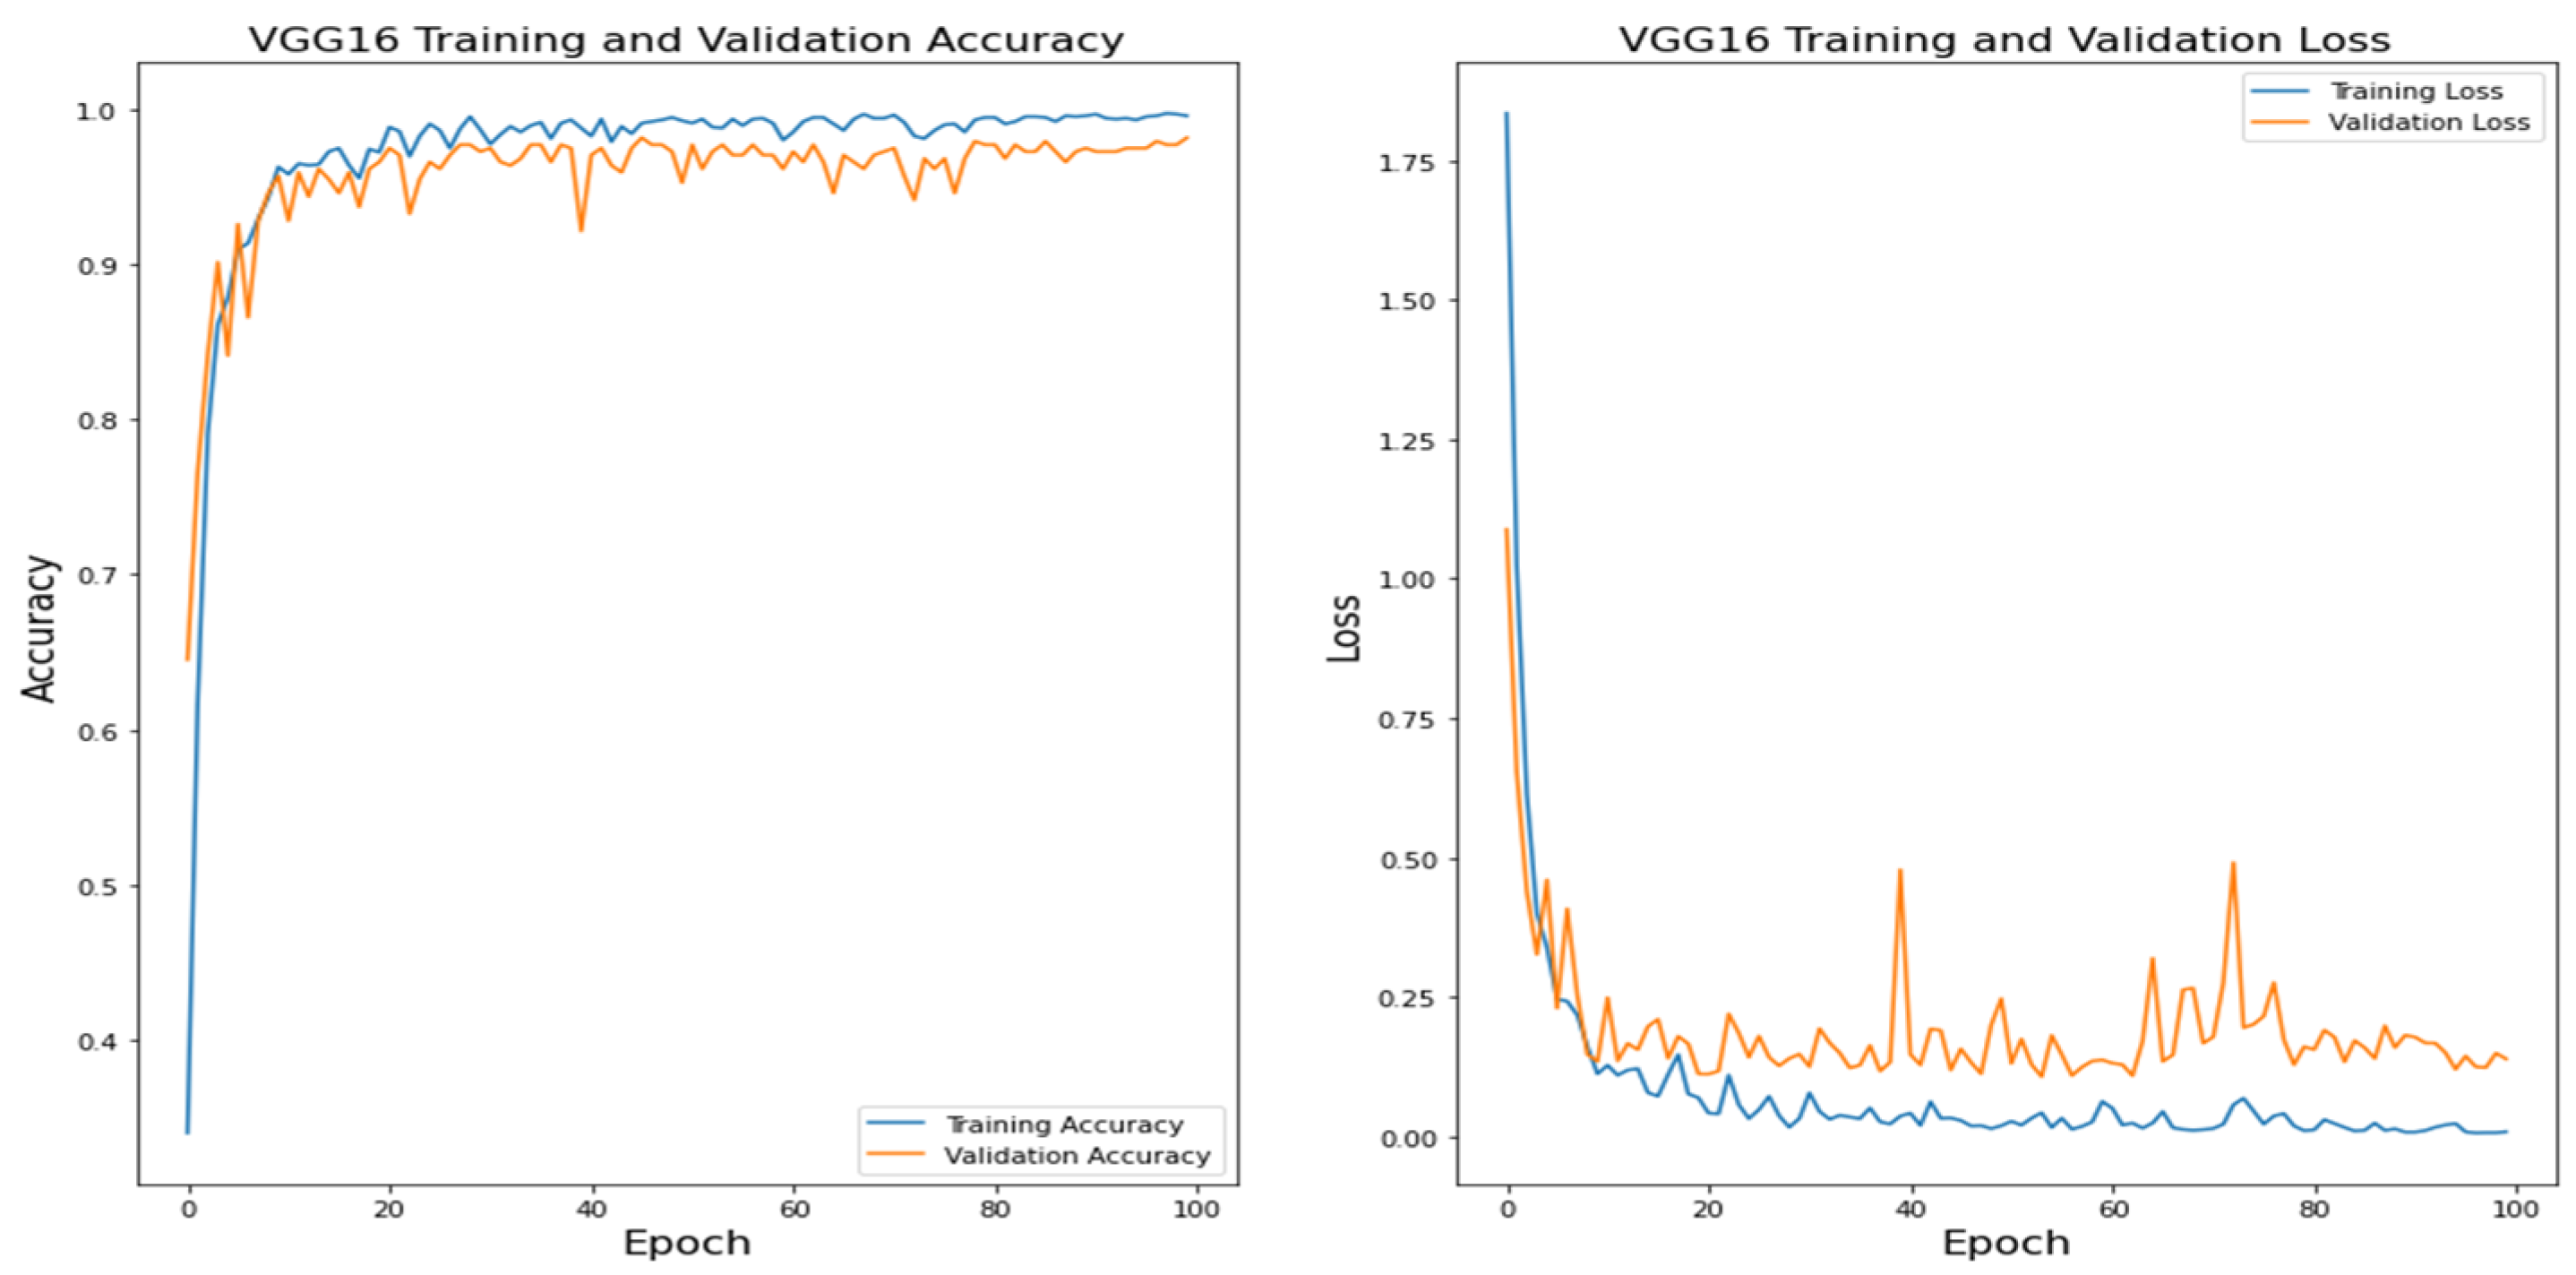
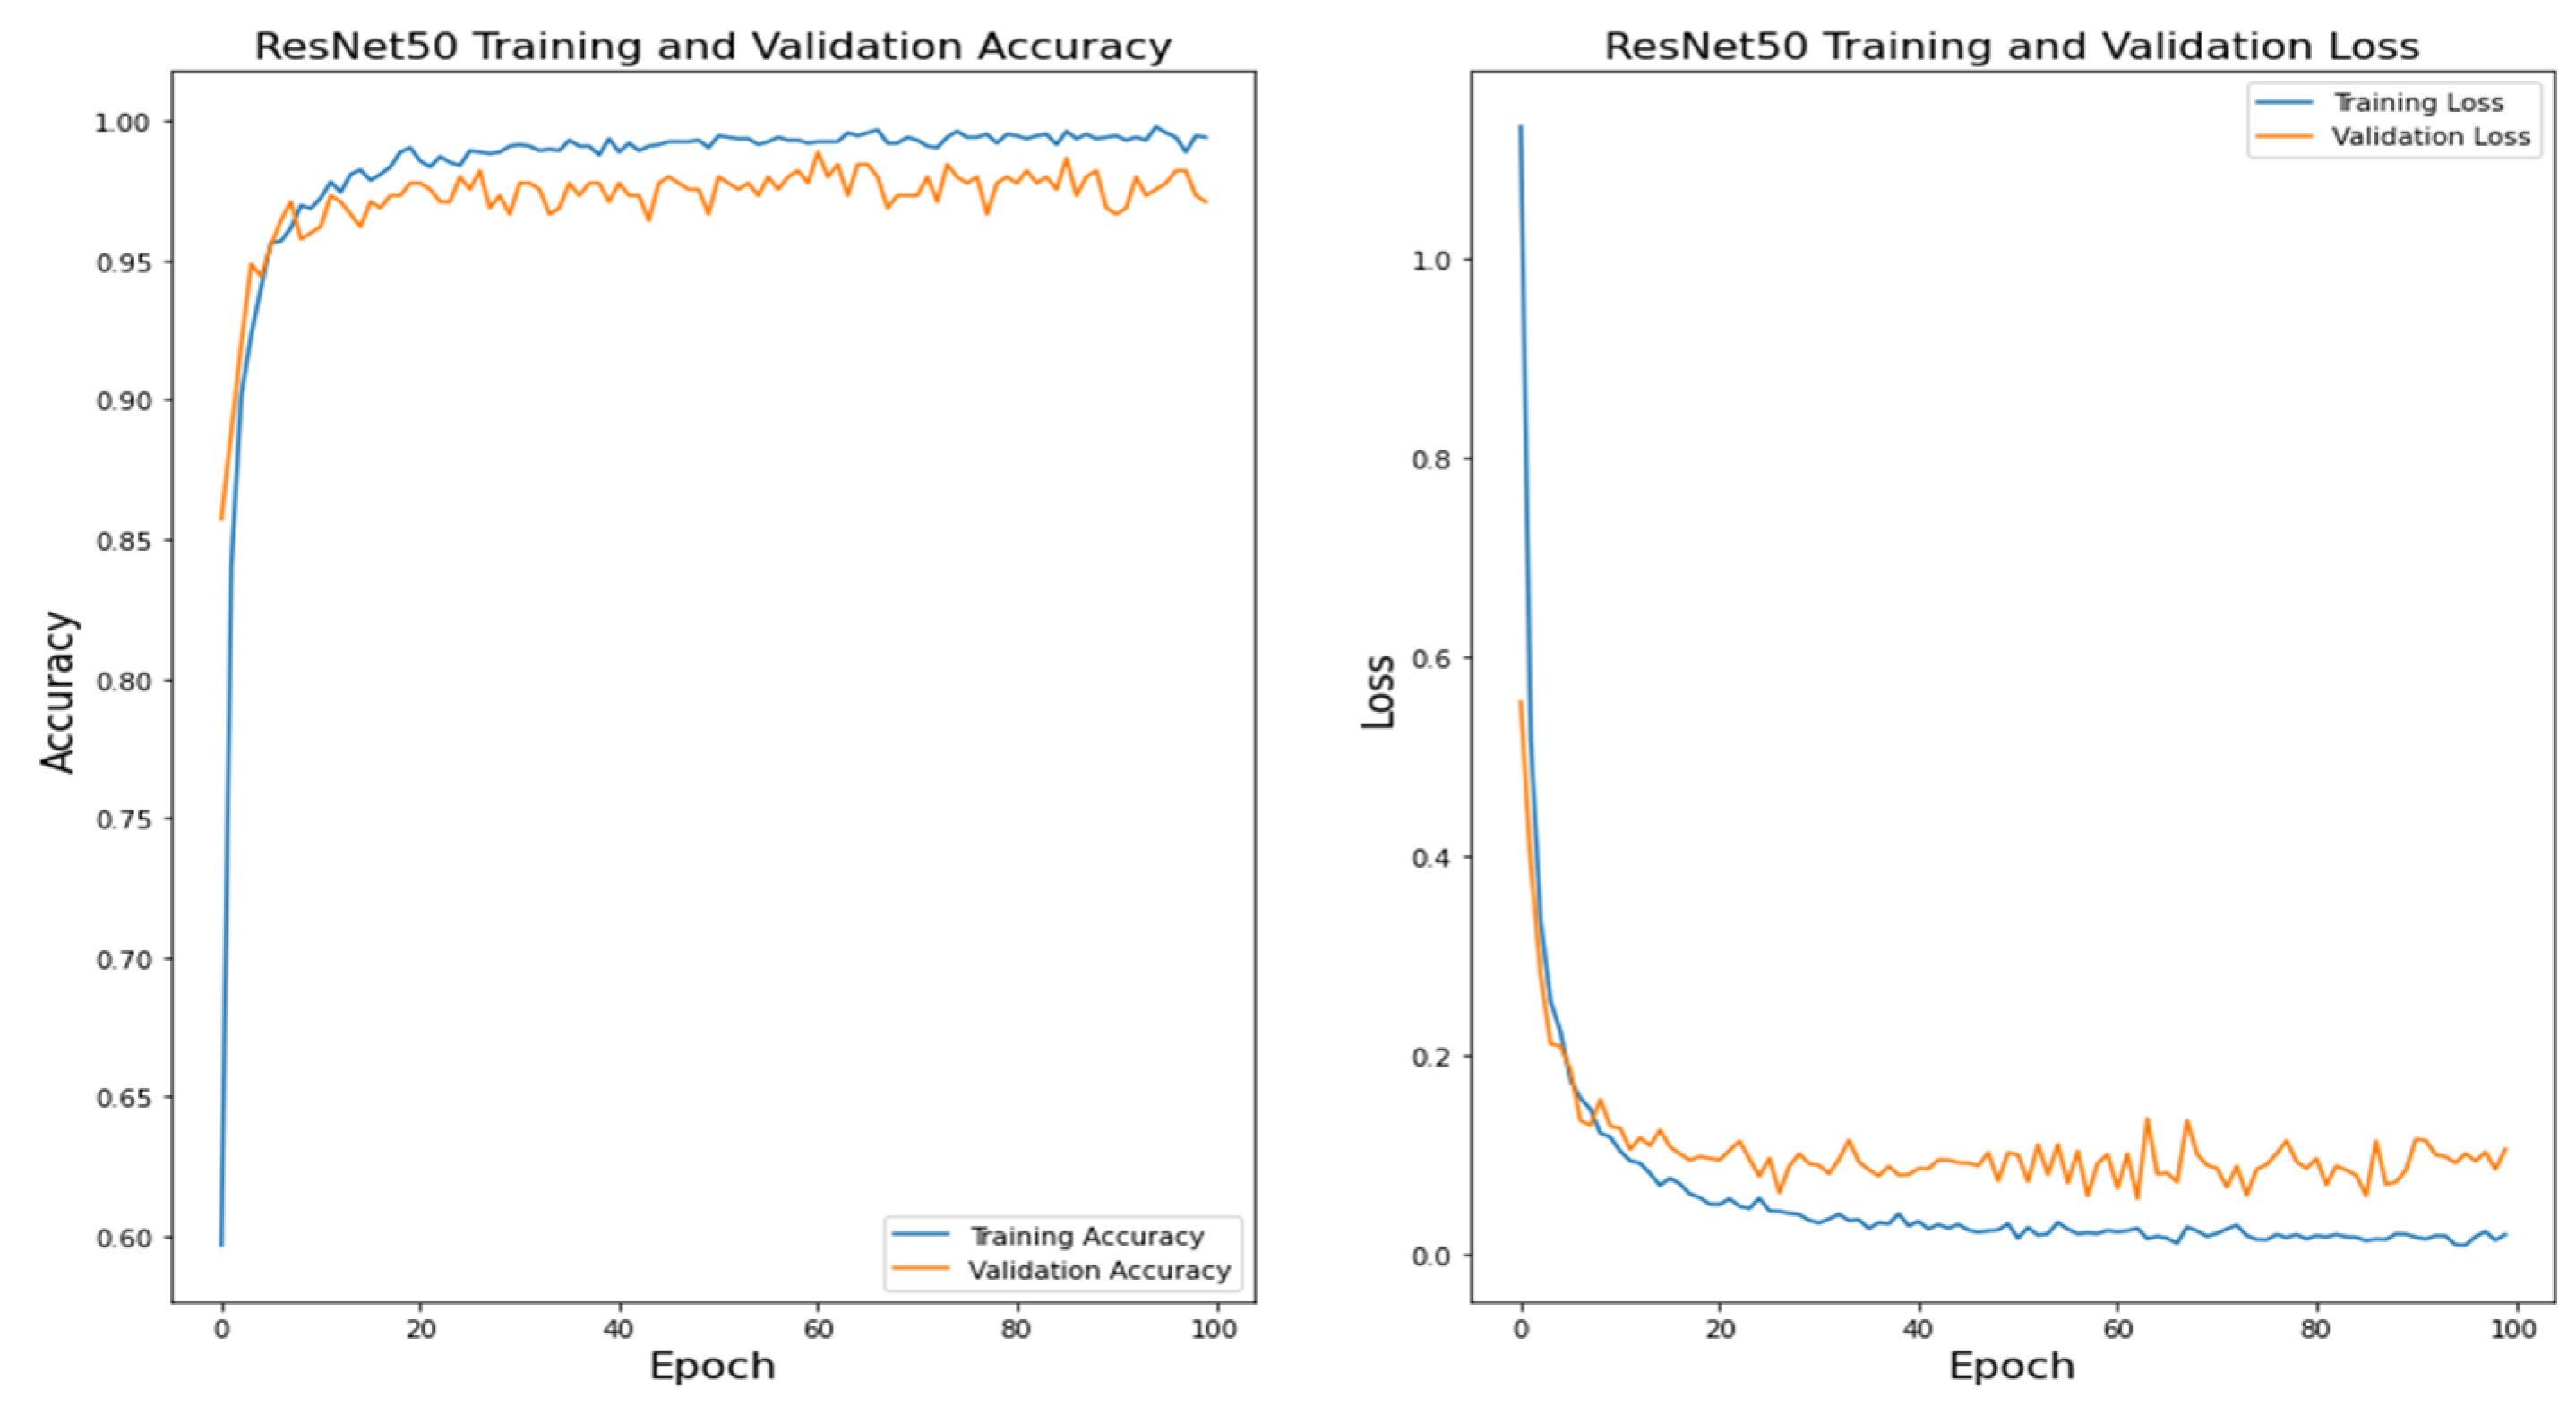
Figure 11 shows the CNN training accuracy and loss. Figure 12 shows the VGG16 training accuracy and loss. Figure 13 shows ResNet50 training accuracy and loss. Figure 14 shows the training accuracy and loss of the proposed model.
In Table 5 the details of the CNN score are given. The score shows the precision, recall, and F score.
Table 6 shows precision, recall, and F score of VGG16.
Table 7 shows precision, recall, and F scores of ResNet50.
Table 8 shows precision, recall, and F score of Proposed model.
Figure 15 visualizes the F-Score of various diseases on different models.
The Figure 16 shows the confusion matrix of the CNN model. It shows the total correct predictions of the model from total test images. The model correctly predicted 453 images out of 475.
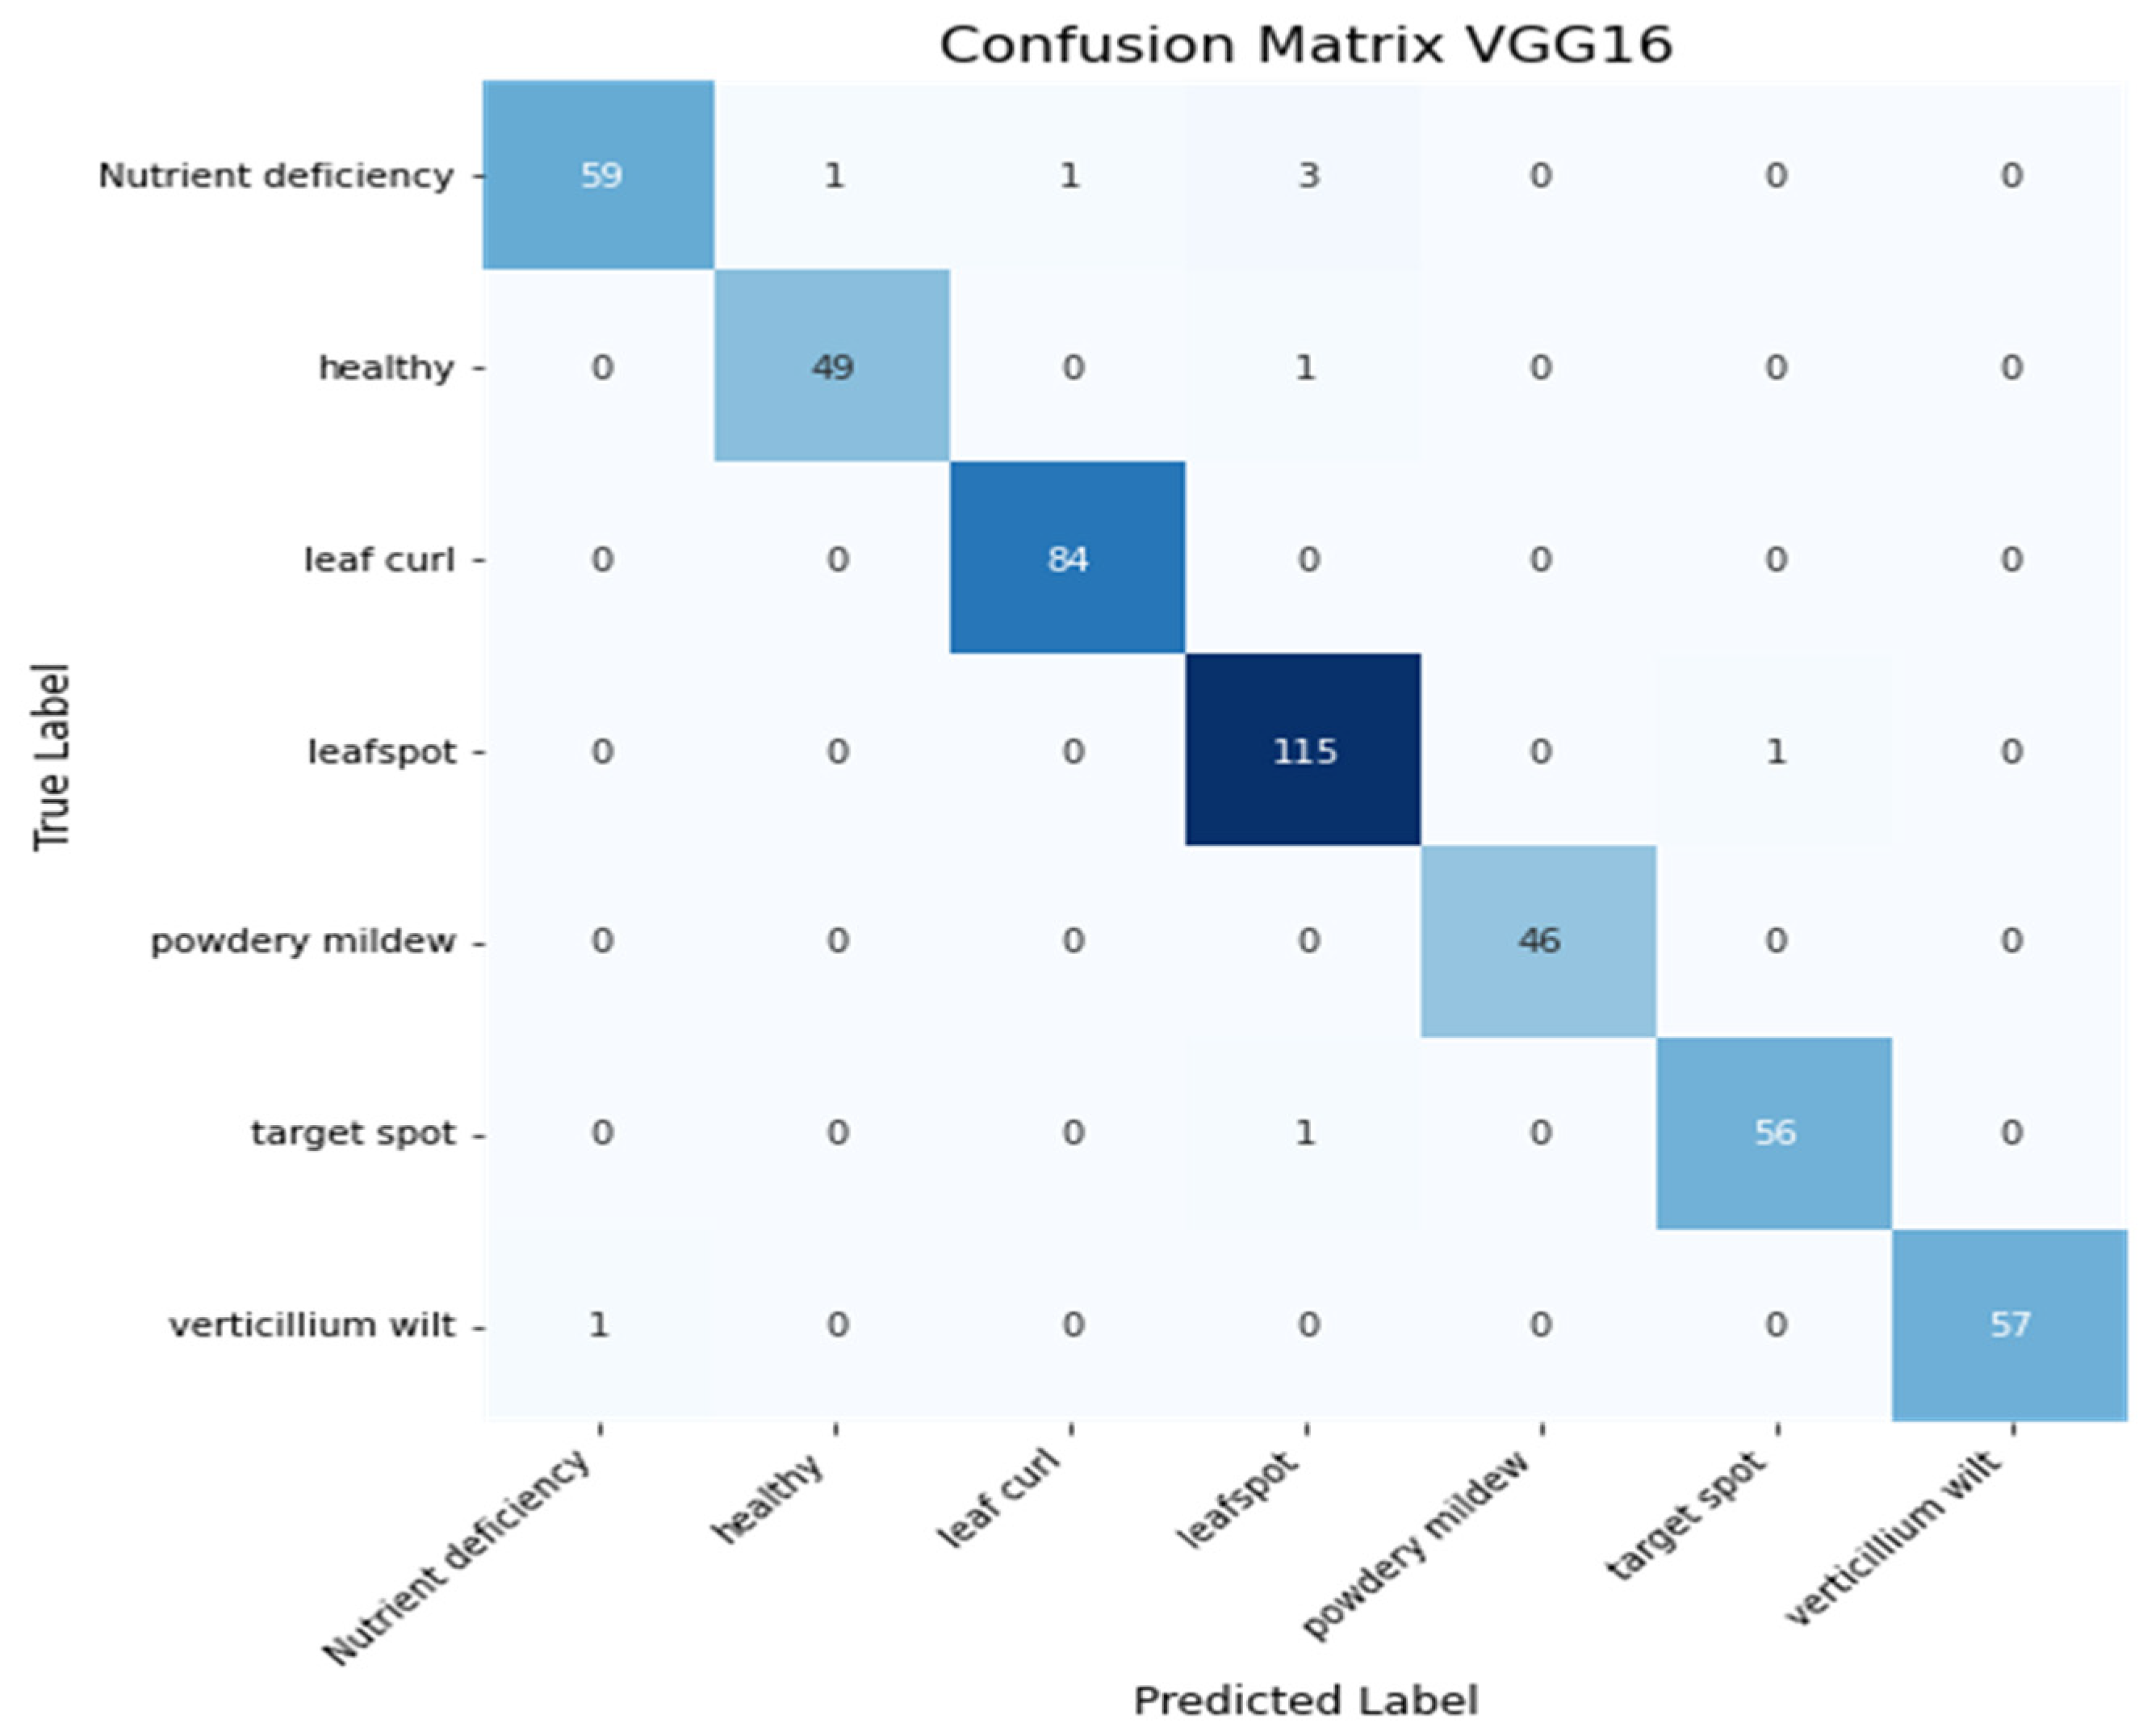
Figure 17 shows the confusion matrix of the VGG16 model. The model correctly predicted 466 images out of 475.
Figure 18 shows the confusion matrix of the ResNet50 model. The model correctly predicted 467 images out of 475.
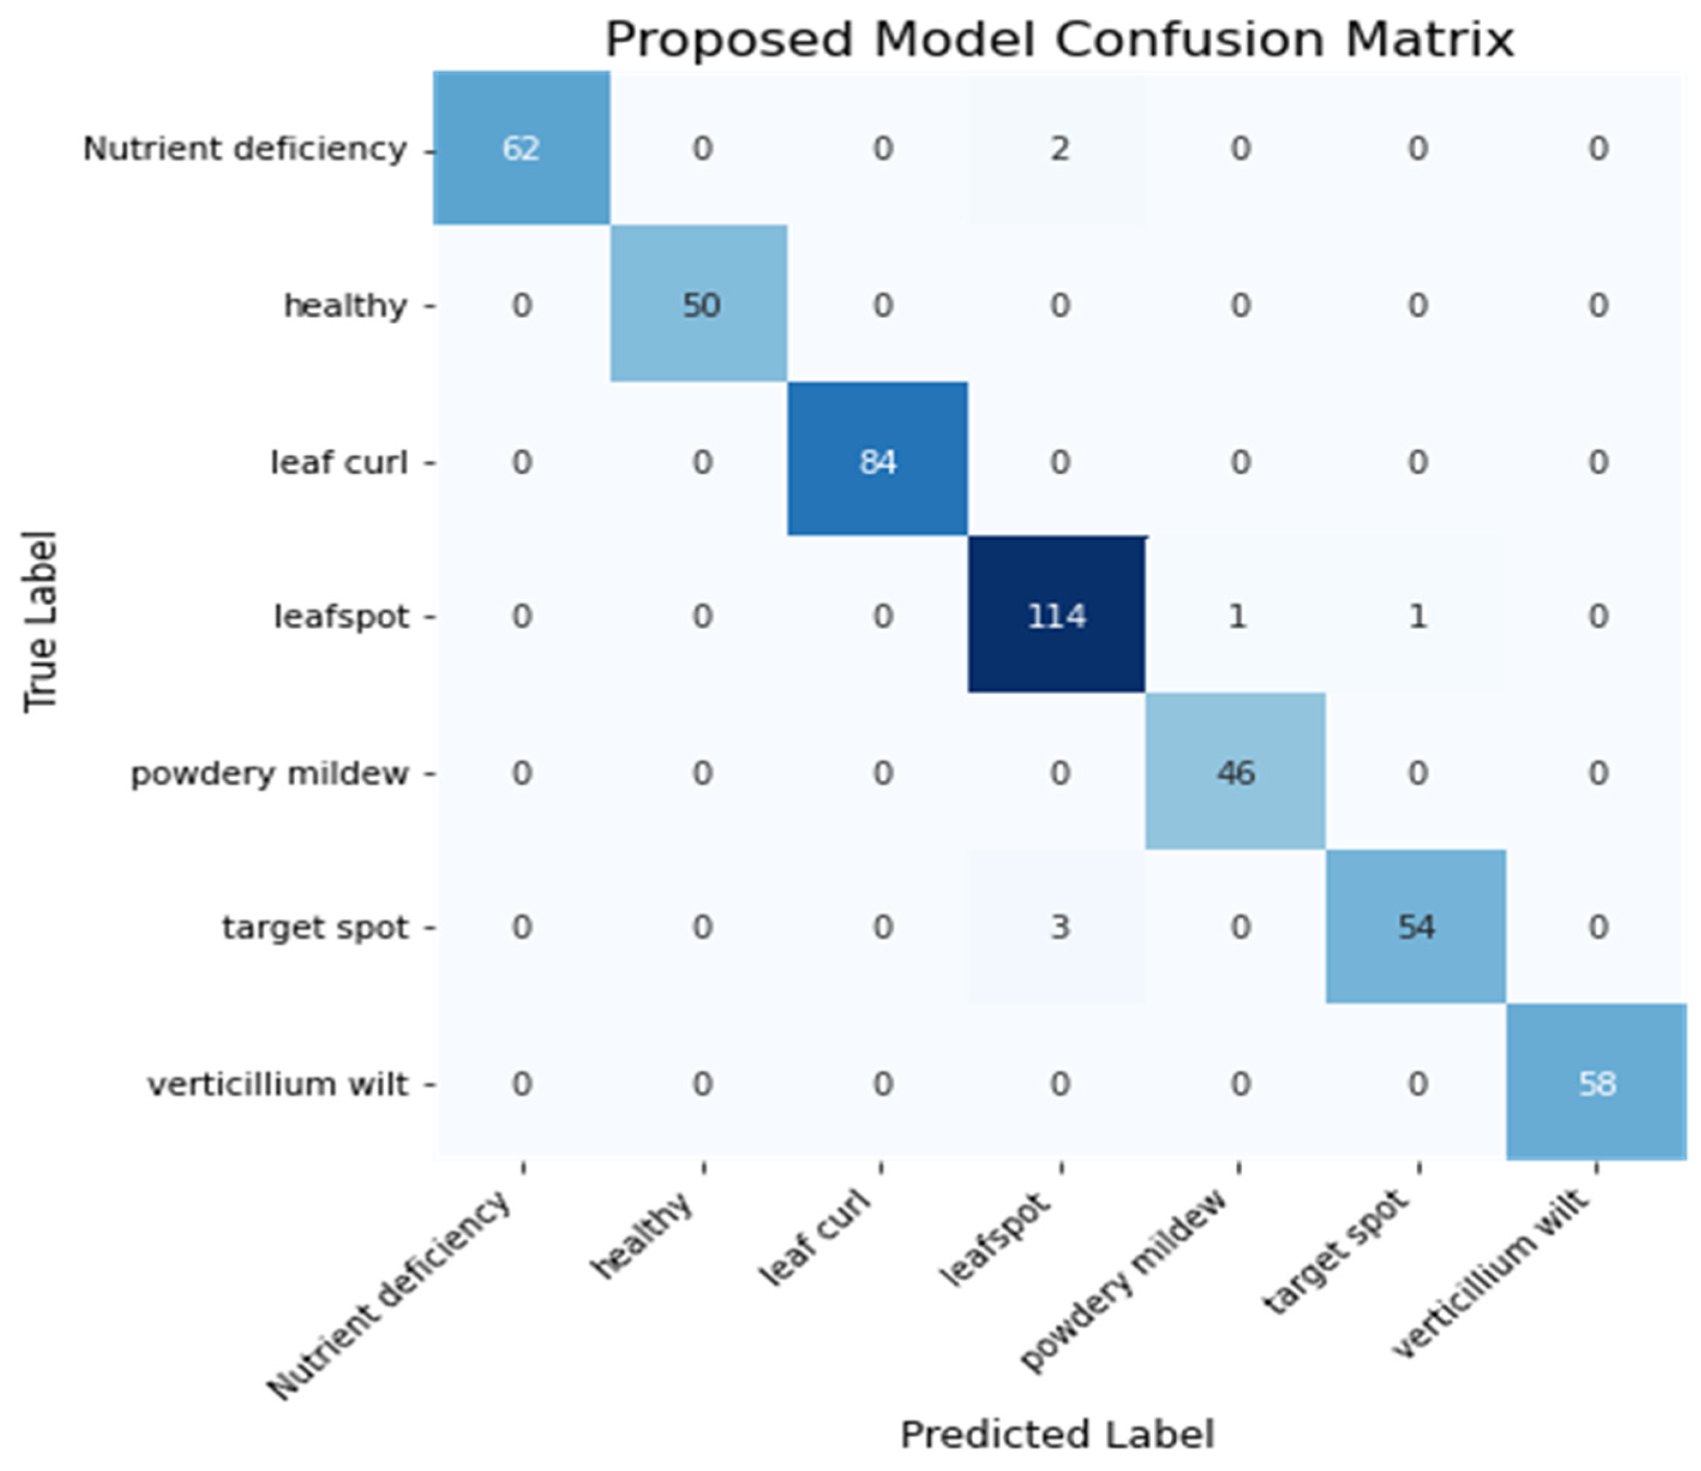
Figure 19 shows the confusion matrix of the Proposed model. The model correctly predicted 468 images out of 475.
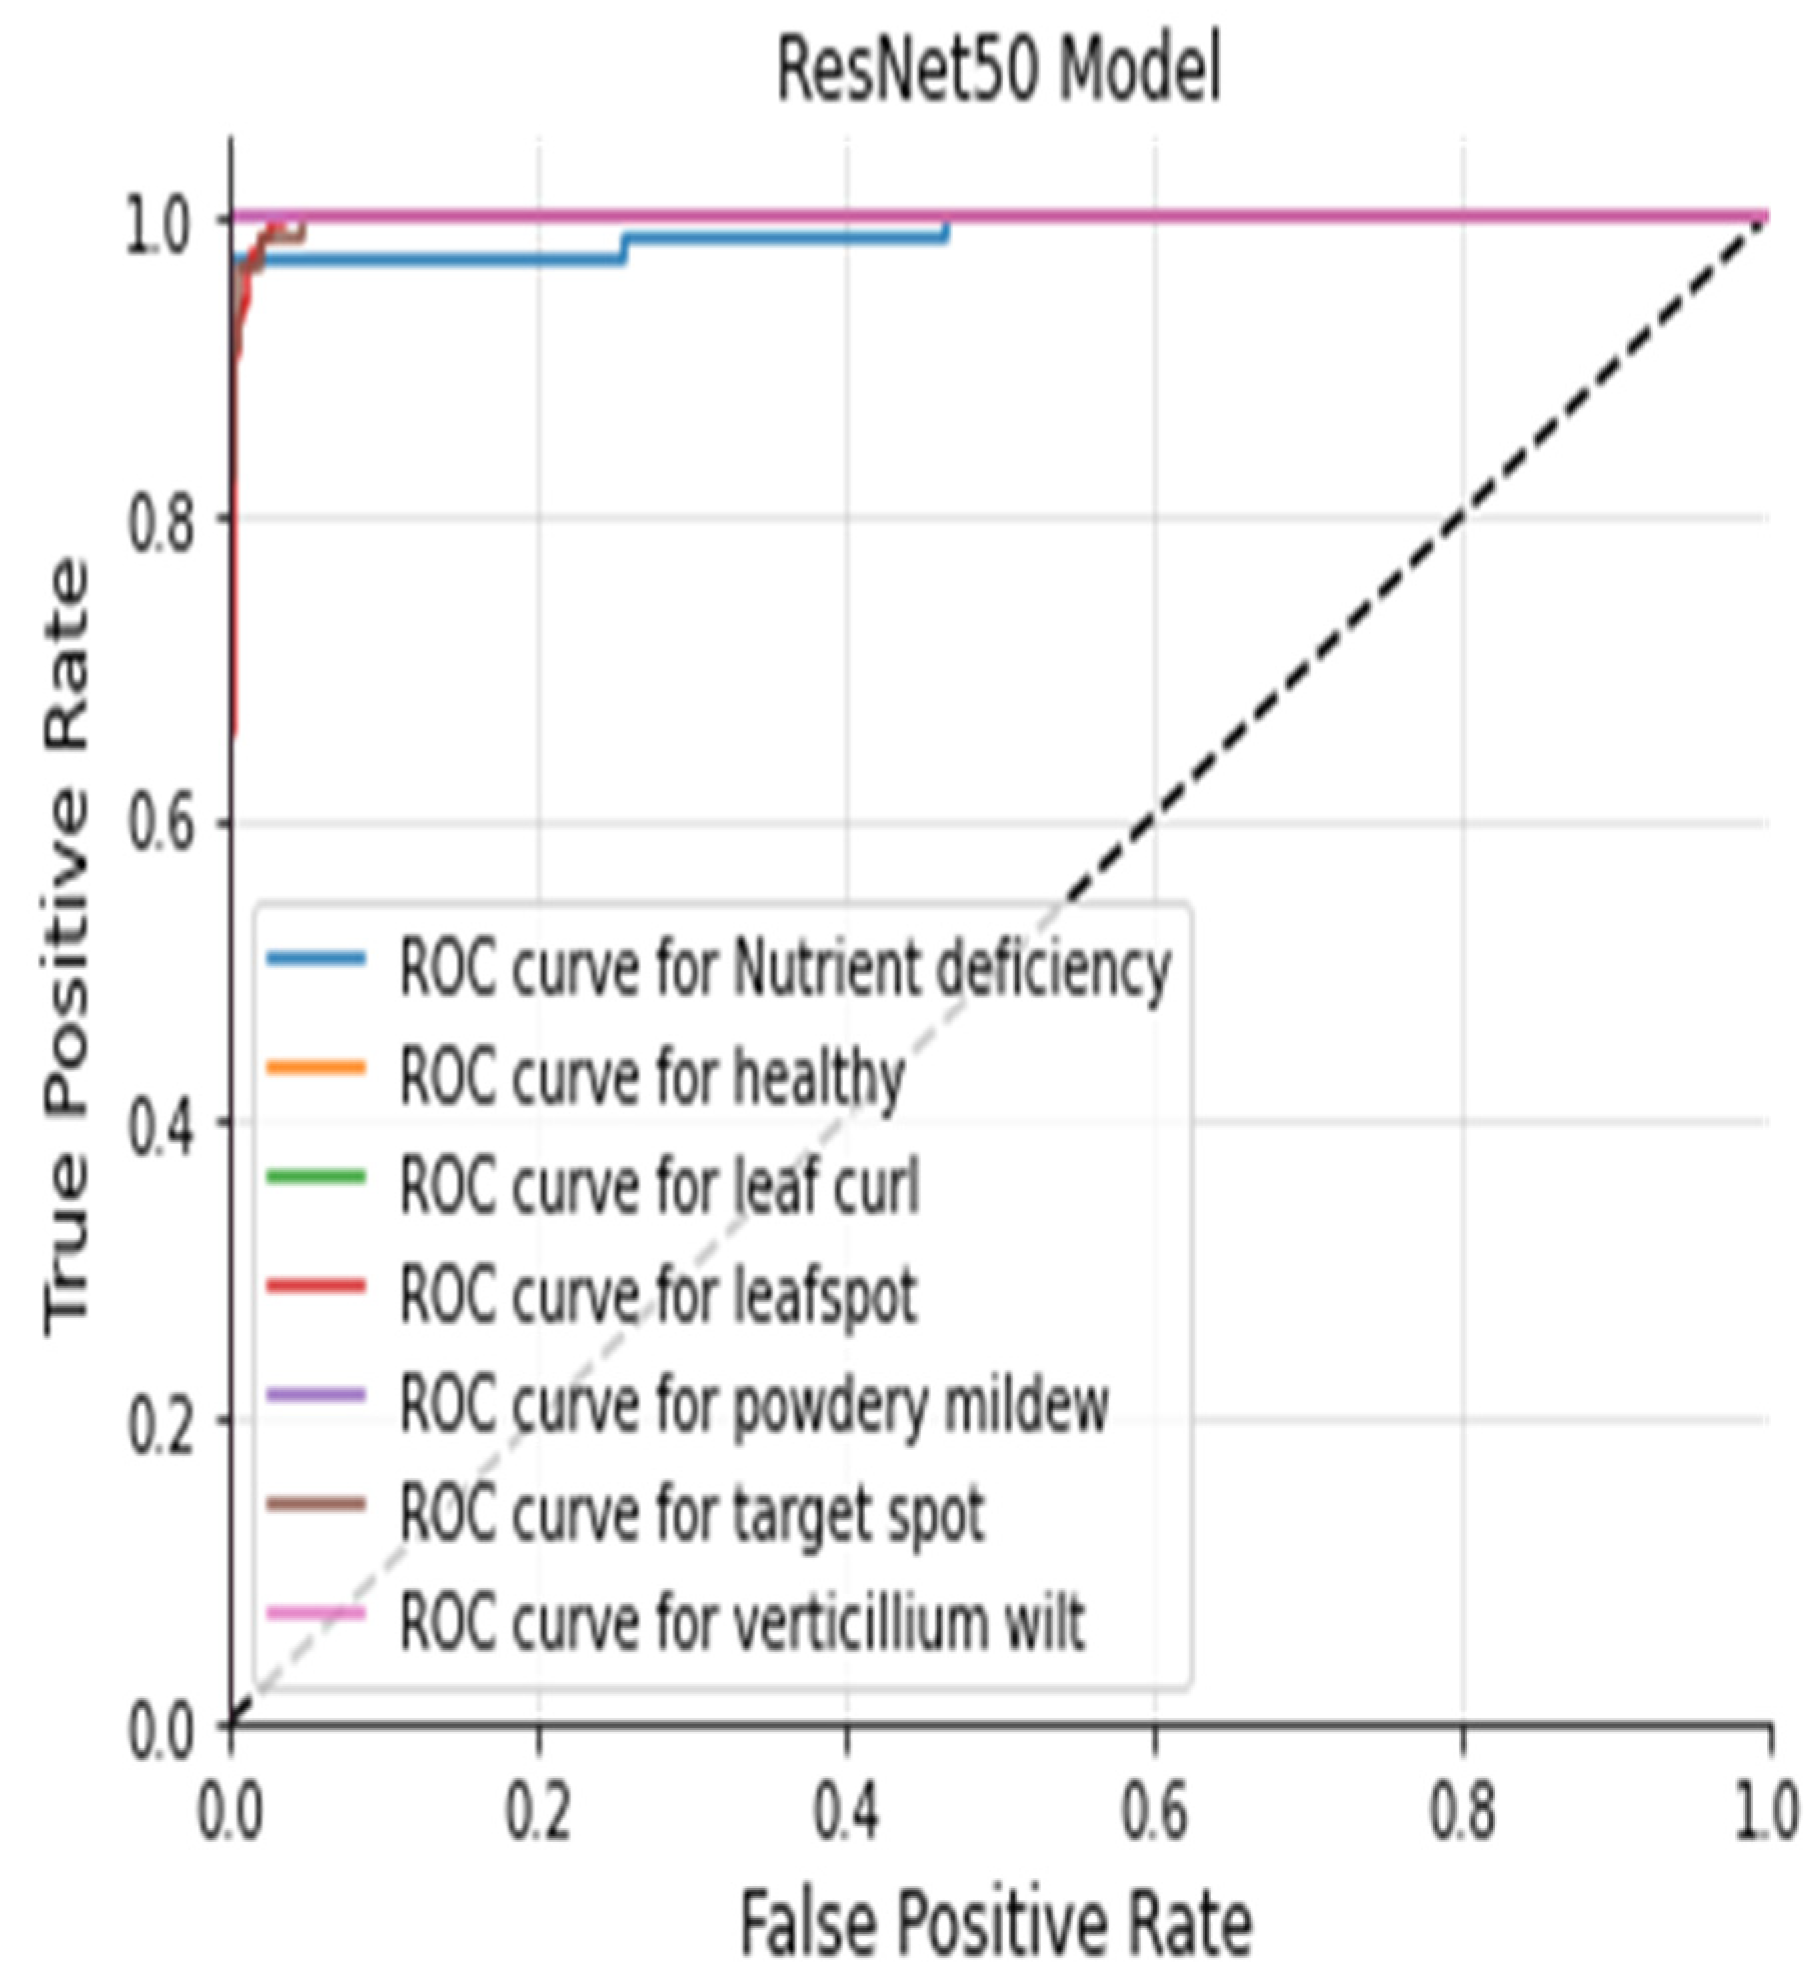
The Figure 20, Figure 21, Figure 22 and Figure 23 shows the receiver operating characteristic (ROC) of various models to evaluate classifier quality.
Table 9 shows the accuracy of the different models. The proposed model achieves good accuracy compared with other models. The proposed model achieves 98.53% accuracy and also improves the f1 score of various disease classes.
5. Discussion
Many Deep Learning schemes such as scratch models using custom CNN, pre-trained networks such as AlexNet, VGG16, VGG19, ResNet50, ResNet101, InceptionV3, DenseNet, Mobile Net, etc. have been proposed so far to find various leaf diseases. These different approaches include Machine Learning models, Deep Learning models and image processing techniques. Many pre-trained models used the Transfer Learning approach, and include VGG16, VGG19, ResNet50, ResNet101, InceptionV3, DenseNet, and MobileNet, which have been trained on plantvillage dataset. There is significantly less work done on cotton crops because of the unavailability of the public dataset. Our contribution is that we have collected a cotton dataset from a real field. The performance of pre-trained models varies because of the top-five accuracy on the imagenet dataset. Pre-trained models like VGG16, ResNet50, and Inception V3 are helpful for the feature extraction process. However, the performance of the different pre-trained models [41] differs in terms of the number of layers and the accuracy. Accurate plant leaf disease identification is one of the challenging problems when the leaf has a complex structure. In previous works, many researchers worked on a plantvillage, which is a publicly available dataset. The plant village dataset does not include cotton crop, and it also includes images with ideal conditions. We have collected cotton images from a real field. Figure 7 shows various leaf images with different diseases. Leaf disease identification on real field images is a need of modern agriculture management. Meta deep learn leaf disease identification is novel approach that does not depend on one model; rather, the models are trained independently and later on all the models are combined to form a final model for a better classification accuracy. The combination of multiple models provides an opportunity to extract more leaf features compared to relying on a single model. Our proposed approach uses different models like custom CNN, VGG16, ResNet50 and the Meta deep learn model that helps extract various leaf features. In the proposed approach, we first trained different models on our cotton dataset using custom CNN, VGG16 and ResNet50, and in the end the models were combined to extract various leaf features from the final model. The models were combined by stacked ensemble learning. In our proposed approach we identified various cotton leaf diseases which include Healthy, Leafspot, Nutrient Deficiency, Powdery mildew, Target spot, Verticillium Wilt, and Leaf curl. First, we collected cotton leaf images from a real field. After collecting the images, the leaf images were cropped. The annotation process was then undertaken to divide the dataset in multiple classes based on the disease they contain. After the annotation process the augmentation technique was used to increase the size of the dataset. In the data augmentation technique we used rotation, horizontal shift, vertical shift, and zooming. After data augmentation we trained a dataset on custom CNN, VGG16, and ResNet50, and proposed a scheme of Meta deep learn leaf disease identification. On our cotton dataset we achieved an accuracy of 95.37% on CNN; on VGG16 we achieved 98.10%; on ResNet50 we achieved an accuracy of 98.32%; and on the proposed model an accuracy of 98.53% was achieved. We used various evaluation metrics such as accuracy, precision, recall, f1 score, heatmap and receiver operating characteristic curve (ROC) to evaluate model performance. The proposed model in Figure 24 shows a significant improvement of ROC over other models. Meta deep learn leaf disease identification provides an opportunity to implement a reliable model that gives good accuracy across multiple crops to identify different types of leaf diseases at an early stage. The proposed model also provides the opportunity to identify leaf diseases at an early stage of a crop because of the diverse leaf features extracted from multiple models. The combination of multiple models helped to improve the overall model accuracy and f1 score. The proposed approach is a good one to provide generalization.
Figure 24 shows the accuracy of various models on our cotton dataset. It is shows that our proposed model has achieved a high accuracy of 98.53.
6. Conclusions
Plant disease is a significant hazard to agriculture around the world. To prevent additional damage to crops, accurate leaf disease detection is critical. This paper offers a new strategy for improving the Deep Learning model’s effectiveness. We have implemented our own dataset for cotton crop. The dataset is also trained on a variety of models, including custom CNN, VGG16, ResNet50, and our own proposed model, the Meta Deep Learning model. In this study, we discovered a variety of cotton diseases, including healthy, leafspot, verticillium wilt, target spot, powdery mildew, nutrient deficiency, and leaf curl. The suggested model performed remarkably well on the cotton dataset, with an accuracy of 98.53%. Distinct models improve different feature extractions in Deep Learning. The identification of leaf diseases is a significant challenge that must be handled. The suggested model will provide a method for identifying the diseases in all important crops using a generalization technique. The proposed model employs a Meta Deep Learning strategy. This method allows for disease detection across a variety of crops. For effective diagnosis, a generalized approach is a good idea. One limitation of the proposed model is its deployment on mobile devices. In the future, the model can be further improved with regard to processing low resolution images and by reducing the size of the model. This will help with deploying the model on mobile devices.
Author Contributions
Conceptualization, M.S.M. and P.K.; methodology, M.S.M.; software, M.S.M.; validation, M.S.M.; formal analysis, M.S.M.; investigation, M.S.M. and P.K.; resources, M.S.M.; data curation, M.S.M.; writing—original draft preparation, M.S.M.; review, P.K., editing, R.I. All authors have read and agreed to the published version of the manuscript.
Funding
This research received no external funding.
Institutional Review Board Statement
Not applicable.
Informed Consent Statement
Not applicable.
Data Availability Statement
Data is available on request.
Conflicts of Interest
The authors declare that they have no conflicts of interest.
References
- Pantazi, X.; Moshou, D.; Tamouridou, A. Automated leaf disease detection in different crop species through image features analysis and One Class Classifiers. Comput. Electron. Agric. 2018, 156, 96–104. [Google Scholar] [CrossRef]
- Toda, Y.; Okura, F. How convolutional neural networks diagnose plant disease. Plant Phenomics 2019, 2019, 9237136. [Google Scholar] [CrossRef] [PubMed]
- Dunne, R.; Desai, D.; Sadiku, R.; Jayaramudu, J. A review of natural fibres, their sustainability and automotive applications. J. Reinf. Plast. Compos. 2016, 35, 1041–1050. [Google Scholar] [CrossRef]
- Pham, T.N.; Van Tran, L.; Dao, S.V.T. Early disease classification of mango leaves using feed-forward neural network and hybrid metaheuristic feature selection. IEEE Access 2020, 8, 189960–189973. [Google Scholar] [CrossRef]
- Zhou, C.; Zhou, S.; Xing, J.; Song, J. Tomato leaf disease identification by restructured deep residual dense network. IEEE Access 2021, 9, 28822–28831. [Google Scholar] [CrossRef]
- Iqbal, Z.; Khan, M.A.; Sharif, M.; Shah, J.H.; ur Rehman, M.H.; Javed, K. An automated detection and classification of citrus plant diseases using image processing techniques: A review. Comput. Electron. Agric. 2018, 153, 12–32. [Google Scholar] [CrossRef]
- Wang, G.; Sun, Y.; Wang, J. Automatic Image-Based Plant Disease Severity Estimation Using Deep Learning. Comput. Intell. Neurosci. 2017, 2017, 2917536. [Google Scholar] [CrossRef] [Green Version]
- Saleem, M.H.; Potgieter, J.; Arif, K.M. Plant disease classification: A comparative evaluation of convolutional neural networks and deep learning optimizers. Plants 2020, 9, 1319. [Google Scholar] [CrossRef]
- Yan, Q.; Yang, B.; Wang, W.; Wang, B.; Chen, P.; Zhang, J. Apple leaf diseases recognition based on an improved convolutional neural network. Sensors 2020, 20, 3535. [Google Scholar] [CrossRef]
- Khan, M.A.; Akram, T.; Sharif, M.; Awais, M.; Javed, K.; Ali, H.; Saba, T. CCDF: Automatic system for segmentation and recognition of fruit crops diseases based on correlation coefficient and deep CNN features. Comput. Electron. Agric. 2018, 155, 220–236. [Google Scholar] [CrossRef]
- Hughes, D.P.; Salathe, M. An Open Access Repository of Images on Plant Health to Enable the Development of Mobile Disease Diagnostics. 2015. Available online: http://arxiv.org/abs/1511.08060 (accessed on 15 November 2021).
- Liakos, K.G.; Busato, P.; Moshou, D.; Pearson, S.; Bochtis, D. Machine learning in agriculture: A review. Sensors 2018, 18, 2674. [Google Scholar] [CrossRef] [Green Version]
- Lin, K.; Gong, L.; Huang, Y.; Liu, C.; Pan, J. Deep learning-based segmentation and quantification of cucumber powdery mildew using convolutional neural network. Front. Plant Sci. 2019, 10, 155. [Google Scholar] [CrossRef] [Green Version]
- Liu, X.; Deng, Z.; Yang, Y. Recent progress in semantic image segmentation. Artif. Intell. Rev. 2018, 52, 1089–1106. [Google Scholar] [CrossRef] [Green Version]
- Karlekar, A.; Seal, A. SoyNet: Soybean leaf diseases classification. Comput. Electron. Agric. 2020, 172, 105342. [Google Scholar] [CrossRef]
- Chen, J.; Chen, J.; Zhang, D.; Sun, Y.; Nanehkaran, Y. Using deep transfer learning for image-based plant disease identification. Comput. Electron. Agric. 2020, 173, 105393. [Google Scholar] [CrossRef]
- Amin, H.; Darwish, A.; Hassanien, A.E.; Soliman, M. End-to-End Deep Learning Model for Corn Leaf Disease Classification. IEEE Access 2022, 10, 31103–31115. [Google Scholar] [CrossRef]
- Mohanty, S.P.; Hughes, D.P.; Salathé, M. Using deep learning for image-based plant disease detection. Front. Plant Sci. 2016, 7, 1419. [Google Scholar] [CrossRef] [Green Version]
- Singh, V.; Misra, A. Detection of plant leaf diseases using image segmentation and soft computing techniques. Inf. Process. Agric. 2017, 4, 41–49. [Google Scholar] [CrossRef] [Green Version]
- Wang, D.; Khosla, A.; Gargeya, R.; Irshad, H.; Beck, A.H. Deep Learning for Identifying Metastatic Breast Cancer. 2016. Available online: http://arxiv.org/abs/1606.05718 (accessed on 12 September 2021).
- Zhu, W.; Chen, H.; Ciechanowska, I.; Spaner, D. Application of infrared thermal imaging for the rapid diagnosis of crop disease. IFAC-PapersOnLine 2018, 51, 424–430. [Google Scholar] [CrossRef]
- Pang, J.; Bai, Z.-Y.; Lai, J.-C.; Li, S.-K. Automatic segmentation of crop leaf spot disease images by integrating local threshold and seeded region growing. In Proceedings of the 2011 International Conference on Image Analysis and Signal Processing (IASP 2011), Hubei, China, 21–23 October 2011; pp. 590–594. [Google Scholar] [CrossRef]
- Zhang, J.-H.; Kong, F.-T.; Wu, J.-Z.; Han, S.-Q.; Zhai, Z.-F. Automatic image segmentation method for cotton leaves with disease under natural environment. J. Integr. Agric. 2018, 17, 1800–1814. [Google Scholar] [CrossRef]
- Kumar, M.; Hazra, T.; Tripathy, S.S. Wheat Leaf Disease Detection Using Image Processing. Int. J. Latest Technol. Eng. Manag. Appl. Sci. 2017, 6, 73–76. [Google Scholar]
- Jian, Z.; Wei, Z. Support vector machine for recognition of cucumber leaf diseases. In Proceedings of the 2010 2nd International Conference on Advanced Computer Control, Shenyang, China, 27–29 March 2010; Volume 5, pp. 264–266. [Google Scholar] [CrossRef]
- Cheng, X.; Zhang, Y.; Chen, Y.; Wu, Y.; Yue, Y. Pest identification via deep residual learning in complex background. Comput. Electron. Agric. 2017, 141, 351–356. [Google Scholar] [CrossRef]
- Nachtigall, L.G.; Araujo, R.M.; Nachtigall, G.R. Classification of Apple Tree Disorders Using Convolutional Neural Networks. In Proceedings of the 2016 IEEE 28th International Conference on Tools with Artificial Intelligence (ICTAI), San Jose, CA, USA, 6–8 November 2016; pp. 472–476. [Google Scholar] [CrossRef] [Green Version]
- Grinblat, G.L.; Uzal, L.C.; Larese, M.G.; Granitto, P.M. Deep learning for plant identification using vein morphological patterns. Comput. Electron. Agric. 2016, 127, 418–424. [Google Scholar] [CrossRef] [Green Version]
- Alfarisy, A.A.; Chen, Q.; Guo, M. Deep learning based classification for paddy pests & diseases recognition. In Proceedings of the 2018 International Conference on Mathematics and Artificial Intelligence, Chengdu, China, 20 April 2018; pp. 21–25. [Google Scholar] [CrossRef]
- Fujita, E.; Kawasaki, Y.; Uga, H.; Kagiwada, S.; Iyatomi, H. Basic investigation on a robust and practical plant diagnostic system. In Proceedings of the 2016 15th IEEE International Conference on Machine Learning and Applications (ICMLA), Anaheim, CA, USA, 18–20 December 2016. [Google Scholar] [CrossRef]
- Chaudhary, P.; Chaudhari, A.K.; Cheeran, A.N.; Godara, S. Color transform based approach for disease spot detection on plant leaf. Int. J. Comput. Sci. Telecommun. 2012, 3, 4–9. [Google Scholar]
- Parikh, A.; Raval, M.S.; Parmar, C.; Chaudhary, S. Disease Detection and Severity Estimation in Cotton Plant from Unconstrained Images. In Proceedings of the 2016 IEEE International Conference on Data Science and Advanced Analytics (DSAA), Montreal, QC, Canada, 17–19 October 2016; pp. 594–601. [Google Scholar] [CrossRef]
- Zhang, J.; Rao, Y.; Man, C.; Jiang, Z.; Li, S. Identification of cucumber leaf diseases using deep learning and small sample size for agricultural Internet of Things. Int. J. Distrib. Sens. Netw. 2021, 17. [Google Scholar] [CrossRef]
- Liu, B.; Tan, C.; Li, S.; He, J.; Wang, H. A data augmentation method based on generative adversarial networks for grape leaf disease identification. IEEE Access 2020, 8, 102188–102198. [Google Scholar] [CrossRef]
- Kaya, A.; Keceli, A.S.; Catal, C.; Yalic, H.Y.; Temucin, H.; Tekinerdogan, B. Analysis of transfer learning for deep neural network based plant classification models. Comput. Electron. Agric. 2019, 158, 20–29. [Google Scholar] [CrossRef]
- Santos, T.; de Souza, L.L.; dos Santos, A.A.; Avila, S. Grape detection, segmentation, and tracking using deep neural networks and three-dimensional association. Comput. Electron. Agric. 2020, 170, 105247. [Google Scholar] [CrossRef] [Green Version]
- Chopda, J.; Raveshiya, H.; Nakum, S.; Nakrani, V. Cotton crop disease detection using decision tree classifier. In Proceedings of the 2018 International Conference on Smart City and Emerging Technology (ICSCET), Mumbai, India, 5 January 2018; pp. 1–5. [Google Scholar] [CrossRef]
- Rothe, P.; Kshirsagar, R.V. Automated extraction of digital images features of three kinds of cotton leaf diseases. In Proceedings of the 2014 International Conference on Electronics, Communication and Computational Engineering (ICECCE), Hosur, India, 17–18 November 2014; pp. 67–71. [Google Scholar] [CrossRef]
- Xu, R.; Li, C.; Paterson, A.H.; Jiang, Y.; Sun, S.; Robertson, J.S. Aerial images and convolutional neural network for cotton bloom detection. Front. Plant Sci. 2018, 8, 2235. [Google Scholar] [CrossRef] [Green Version]
- Ma, J.; Du, K.; Zheng, F.; Zhang, L.; Gong, Z.; Sun, Z. A recognition method for cucumber diseases using leaf symptom images based on deep convolutional neural network. Comput. Electron. Agric. 2018, 154, 18–24. [Google Scholar] [CrossRef]
- Thangaraj, R.; Anandamurugan, S.; Pandiyan, P.; Kaliappan, V.K. Artificial intelligence in tomato leaf disease detection: A comprehensive review and discussion. J. Plant Dis. Prot. 2021, 129, 469–488. [Google Scholar] [CrossRef]
Figure 1.
Deep Learning Neural Network Architecture.

Figure 2.
CNN Architecture.

Figure 3.
Transfer Learning.

Figure 4.
Workflow of a model for leaf disease identification.

Figure 5.
Methodology.

Figure 6.
Different Cotton Leaf Images with different disease classes.

Figure 7.
Total No. of Parameters of CNN, VGG16, ResNet50, Proposed Model.

Figure 8.
Total No. of Images for Train and Test Set.

Figure 9.
Image Visualization.

Figure 10.
Predicted Images.

Figure 11.
CNN Training Accuracy and Loss.

Figure 12.
VGG16 Training and Validation.

Figure 13.
ResNet50 Training and Validation Accuracy.

Figure 14.
Proposed Model Training and Validation Accuracy.

Figure 15.
F1 Score of Diseases on Different Models.

Figure 16.
Heatmap of CNN Model.

Figure 17.
Heatmap of VGG16 Model.

Figure 18.
Heatmap of ResNet50 Model.

Figure 19.
Heatmap of Proposed Model.

Figure 20.
ROC Curve CNN.

Figure 21.
VGG16 ROC Curve.

Figure 22.
ResNet50 ROC Curve.

Figure 23.
ROC Curve of Proposed Model.

Figure 24.
Model Accuracy of CNN, VGG16, ResNet50 and Proposed Model on Cotton Dataset.


Table 1.
Summary of the Literature.
| Author | Methodology | Crop | Type of the Disease/Health Assessment | Limitation |
|---|---|---|---|---|
| [16] | VGGNET Transfer Learning | Rice, Maize | Gray leaf spot, Common rust, Northern leaf blight | The author of the study worked on VGGNET Transfer Learning to find the disease in the rice leaves. The proposed method achieved an accuracy of 92%. The limitation of the work is very small, as the dataset consists of 500 images selected for rice and 466 images selected for maize. The model was not tested on other benchmark datasets. |
| [32] | Image Processing | Cotton | Leaf Spot | The author claims the work as a generalized approach for detecting every disease, while no evidence is provided. |
| [33] | GrabCut, SVM, Deep CNN, GAN | Cucumber | anthracnose, downy mildew, and powdery mildew | The author has used two-stage segmentation to extract lesions from leafspot. Two-stage segmentation was implemented using GrabCut with the SVM method. Various features were extracted such as Color, Texture and border. Data Augmentation was done using AR-GAN to generate more images. The proposed study achieved an accuracy of 96.11%. The limitation of the work is that the experiment was performed on 600 images and the model was not tested on other plants to judge the accuracy of the model for generalization. |
| [34] | AlexNet, VGG, ResNet, GAN, DenseNet, Xception, ResNext, SEResNet, EfficientNet | Grape | Esca measles, Leaf spot, Black rot | The study’s author presented a GAN-based data augmentation strategy to expand the size of the Grape dataset’s original Dataset. The author tested the Dataset on various CNN architectures, including (AlexNet, VGG, ResNet, DenseNet, Xception, ResNext, SEResNet, and EfficientNet). The accuracy of the proposed model was 98.70 percent. To generalize the model, the author has not tested it outside of the Grape dataset. Only leaf images with no background are included in the Grape Dataset. The model’s performance on real-world images will suffer due to this method. |
| [36] | Mask R-CNN | Grape | Grape Varieties | The author of the study proposed Mask R-CNN to detect various Grape varieties by using instance segmentation. The limitation of the work is the proposed method will only work with Grape because of the annotated Dataset of Grape to detect instances. |
| [37] | Decision Tree Classifier | Cotton | Cotton Disease | The author in the proposed work has used various parameters such as temperature, soil moisture etc. to predict the disease of cotton. For classification, the author has used a decision tree classifier. The only parameters such as soil, moisture and temperature cannot help with detecting diseases of crop. |
| [38] | Image Segmentation, Gaussian filter, Graph cut | Cotton | Leaf Spot | The author has used manual image processing methods to identify disease in cotton. The method is based on image processing and requires time. |
| [39] | CNN | Cotton | Flower species | The author has worked on cotton flower species using unmanned aerial images. |
| [40] | DCNN, AlexNet | Cucumber | target leaf spots, mildew, powdery mildew, anthracnose, downy | The study’s author proposed a deep Convolutional Neural Network (DCNN) to recognize several diseases in cucumber. On 1184 original photos, the proposed work was implemented. Data Augmentation was used to increase the original dataset to 14,208 rows. The proposed model had a 93.4 percent accuracy rate. The suggested model achieves less accuracy, and the model was not trained on other benchmark datasets, which is a limitation of the study. |
| Proposed work | CNN, VGG16 Transfer Learning, ResNet50, GoogLeNet | Cotton | Healthy, Leaf Spot, Target Leaf Spot, Powdery Mildew Nutrient Deficiency, Verticillium wilt, Leaf curl |
Table 2.
Model Parameters.
| Model | CNN | VGG16 | ResNet50 | Proposed Model |
|---|---|---|---|---|
| No. of Parameters | 9,185,606 | 14,878,982 | 25,638,918 | 2,629,639 |
| FLOPs | 5.4 G | 30.9 G | 0.00421 G | 38.5 G |
| Training Time | 1 h 34 min 56 s | 54 min 3 s | 53 min 15 s | 1 h 17 min 52 s |
Table 3.
Total Training and Test Leaf Images.
| S. No | Disease Class | Training | Test |
|---|---|---|---|
| 1. | healthy | 204 | 50 |
| 2. | leaf curl | 334 | 84 |
| 3. | leafspot | 479 | 116 |
| 4. | Nutrient Deficiency | 257 | 64 |
| 5. | Powdery mildew | 182 | 46 |
| 6. | Target spot | 225 | 57 |
| 7. | Veticillium Wilt | 229 | 58 |
Table 4.
Hyper Parameters.
| Model | Name | Parameter |
|---|---|---|
| CNN | Optimizer | Adam |
| Learning rate | 0.0001 | |
| No. of Epochs | 100 | |
| Dropout | 0.5 | |
| Batch Size | 32 | |
| Input Shape | 224*224 | |
| VGG16 | Optimizer | Adam |
| Learning rate | 0.001 | |
| No. of Epochs | 100 | |
| Dropout | 0.5 | |
| Batch Size | 32 | |
| Input Shape | 224*224 | |
| ResNet50 | Optimizer | SGD |
| Learning rate | 0.01 | |
| Weight Decay | 0.0002 | |
| Momentum | 0.9 | |
| No. of Epochs | 100 | |
| Dropout | 0.4 | |
| Batch Size | 32 | |
| Input Shape | 224*224 | |
| Proposed Model | Optimizer | Adam |
| Learning rate | 0.001 | |
| No. of Epochs | 100 | |
| Dropout | 0.25 | |
| Batch Size | 32 |
Table 5.
CNN Precision, Recall and F Score.
| Disease Class | Precision | Recall | F-Score | Support |
|---|---|---|---|---|
| powdery mildew | 1.000000 | 1.000000 | 1.000000 | 46.0 |
| leaf curl | 1.000000 | 0.976190 | 0.987952 | 84.0 |
| target spot | 1.000000 | 0.947368 | 0.972973 | 57.0 |
| verticillium wilt | 1.000000 | 0.931034 | 0.964286 | 58.0 |
| leafspot | 0.934959 | 0.991379 | 0.962343 | 116.0 |
| healthy | 0.884615 | 0.920000 | 0.901961 | 50.0 |
| Nutrient deficiency | 0.875000 | 0.875000 | 0.875000 | 64.0 |
Table 6.
VGG16 Precision, Recall and F Score.
| Disease Class | Precision | Recall | F-Score | Support |
|---|---|---|---|---|
| powdery mildew | 1.000000 | 1.000000 | 1.000000 | 46.0 |
| leaf curl | 0.988235 | 1.000000 | 0.994083 | 84.0 |
| verticillium wilt | 1.000000 | 0.982759 | 0.991304 | 58.0 |
| target spot | 0.982456 | 0.982456 | 0.982456 | 57.0 |
| healthy | 0.980000 | 0.980000 | 0.980000 | 50.0 |
| leafspot | 0.958333 | 0.991379 | 0.974576 | 116.0 |
| Nutrient deficiency | 0.983333 | 0.921875 | 0.951613 | 64.0 |
Table 7.
ResNet50 Precision, Recall and F Score.
| Disease Class | Precision | Recall | F-Score | Support |
|---|---|---|---|---|
| healthy | 1.000000 | 1.000000 | 1.000000 | 50.0 |
| leaf curl | 1.000000 | 1.000000 | 1.000000 | 84.0 |
| verticillium wilt | 1.000000 | 1.000000 | 1.000000 | 58.0 |
| powdery mildew | 0.978723 | 1.000000 | 0.989247 | 46.0 |
| Nutrient deficiency | 1.000000 | 0.968750 | 0.984127 | 64.0 |
| leafspot | 0.965517 | 0.965517 | 0.965517 | 116.0 |
| target spot | 0.948276 | 0.964912 | 0.956522 | 57.0 |
Table 8.
Proposed Model Precision, Recall and F Score.
| Disease Class | Precision | Recall | F-Score | Support |
|---|---|---|---|---|
| healthy | 1.000000 | 1.000000 | 1.000000 | 50.0 |
| leaf curl | 1.000000 | 1.000000 | 1.000000 | 84.0 |
| verticillium wilt | 1.000000 | 1.000000 | 1.000000 | 58.0 |
| powdery mildew | 0.978723 | 1.000000 | 0.989247 | 46.0 |
| Nutrient deficiency | 1.000000 | 0.968750 | 0.984127 | 64.0 |
| leafspot | 0.957983 | 0.982759 | 0.970213 | 116.0 |
| target spot | 0.981818 | 0.947368 | 0.964286 | 57.0 |
Table 9.
Results Summary of Different Models.
| S. No. | Model | Accuracy | Dataset |
|---|---|---|---|
| 1. | Custom CNN | 95.37% | Cotton |
| 2. | VGG16 | 98.10% | Cotton |
| 3. | ResNet50 | 98.32% | Cotton |
| 4. | Proposed Model | 98.53% | Cotton |
Publisher’s Note: MDPI stays neutral with regard to jurisdictional claims in published maps and institutional affiliations. |
© 2022 by the authors. Licensee MDPI, Basel, Switzerland. This article is an open access article distributed under the terms and conditions of the Creative Commons Attribution (CC BY) license (https://creativecommons.org/licenses/by/4.0/).
Share and Cite
MDPI and ACS Style
Memon, M.S.; Kumar, P.; Iqbal, R. Meta Deep Learn Leaf Disease Identification Model for Cotton Crop. Computers 2022, 11, 102. https://doi.org/10.3390/computers11070102
AMA Style
Memon MS, Kumar P, Iqbal R. Meta Deep Learn Leaf Disease Identification Model for Cotton Crop. Computers. 2022; 11(7):102. https://doi.org/10.3390/computers11070102
Chicago/Turabian StyleMemon, Muhammad Suleman, Pardeep Kumar, and Rizwan Iqbal. 2022. "Meta Deep Learn Leaf Disease Identification Model for Cotton Crop" Computers 11, no. 7: 102. https://doi.org/10.3390/computers11070102
Note that from the first issue of 2016, this journal uses article numbers instead of page numbers. See further details here.