1. Introduction
Consumer purchase decisions are influenced by all five human senses [
1]. The influence can be observed in everyday life [
2,
3]. Examples include the playing of music in stores, waxed apples meant to please the eye, or the smell of perfume. In order to support a purchase reaction, consumers’ senses play an important role. Marketing strategies that consider controlling senses may also affect consumers’ perception, judgment, and behavior [
1]. Digitization, which is currently being boosted by the COVID-19 pandemic, is leading to more online purchases [
4]. Recently, Mehta et al. showed in a meta-analysis that AI plays an increasingly important role in marketing [
5]. In addition, several studies highlight the use-cases of AI in terms of sensory marketing to develop sensory word lexicons for products [
6] and to evaluate food taste, smell, and other characteristics based on consumers’ online reviews [
7]. Accordingly, current marketing strategies strongly support digitized components. Since the online buying clientele cannot directly see, smell, taste, hear or touch products, this is to be performed indirectly via sensory imagery [
3,
8,
9,
10,
11,
12,
13,
14,
15]. We now describe for the first time how sensory elements can be automatically detected and measured by applying the recently introduced OSMI (Online Sensory Marketing Index) [
16]. The OSMI introduced by Hamacher and Buchkremer in 2022 is intended to serve as a holistic sensory measure that enables website creators and marketing managers with a quick and comfortable evaluation of a website’s sensory communication quality and its potential for improvement. Currently, our OSMI consists of 36 individual indicators that can be checked manually on a website and evaluated according to the industry. The OSMI is not meant to serve as a quantitative measure. It allows to count and weigh sensory elements. Our assessment is quickly performed but is not automated as of yet.
Thus, the main goal of this paper is to present features to automate the OSMI assessments by applying AI techniques. We consider using AI to systematically capture sensory marketing elements as a research gap as the current scientific literature focuses exclusively on specific practical problems of sensory marketing and so far lacks holistic sensory evaluations of websites. Therefore, this paper aims to answer the following research questions:
To what extent has research on this gap been conducted in the literature? What possibilities arise from the use of methods such as “Natural Language Processing” (NLP) or “Machine Learning” (ML) to capture sensory elements?
Following these objectives, the paper is structured as follows:
Section 2 deals with a systematic literature review supported by AI methods to identify the most significant research contributions.
Section 3 explains the methodology used for text and image data analysis.
Section 4 compares sensory measurements of websites within a field study of 116 websites from the technology, automotive, fashion, and food industries.
Section 5 highlights, discusses, and compares the results’ main advantages and disadvantages compared to manual investigations [
16]. The paper concludes with
Section 6, which summarizes conclusions and limitations. Practical relevance for marketers and approaches for future research are discussed, too.
2. Related Work
We apply AI techniques to support reading relevant papers. Thus, we use the systematic taxonomy for information retrieval from literature (STIRL) approach introduced by Buchkremer et al. in 2019, which has been applied in various scientific contexts such as medicine or information technology. We were able to show that by increasing the number of abstracts, we reach a similar set of relevant topics compared to comprehensively reading only a few journal articles [
17,
18]. The STIRL method automatically generates a systematic literature review examining hits from state-of-the-art portals for scientific literature via ML and NLP techniques. For this purpose, high-quality online research databases are selected as data sources [
19,
20] for retrieving titles and abstracts. We can thus apply our methodology not only to determine whether big data or artificial intelligence have been studied in connection with sensory marketing. We also identify topics that have been addressed most frequently. It ensures that similar topics that we may have missed in our search have not been discussed in the context of sensory marketing.
As depicted in
Table 1, the knowledge corpus has been generated from seven online databases using three search strings.
For the keyword-selection process, Weber and Buchkremer (2022) recommend balancing the narrowness and tightness of each keyword and search string thoroughly to identify and retrieve relevant papers. The aim is to avoid too many search hits caused by non-specific terms [
18]. We focus on peer-reviewed articles to build a knowledge database (corpus) derived from high-quality scientific journals and conference papers [
21]. Our corpus consists of titles and abstracts taken from 469 articles. The next step is to prepare this corpus for further text analysis. For this purpose, the Natural Language Toolkit (NLTK), developed in Python, is used [
22]. After removing stop words and duplicates, lemmatization and stemming (snowball algorithm) are applied [
17]. The resulting text corpus is analyzed using latent dirichlet allocation (LDA) according to Buchkremer and coworkers [
23]. Our AI analysis reveals ten trending topics (depicted in
Figure 1) in papers returned from literature portals. The statistical occurrence of each topic is illustrated in
Figure 2. It is an excellent way to check if the results are appropriate. At that point, it should be noted that LDA resembles a clustering algorithm; consequently, identical words may be grouped across different topics [
18,
24,
25]. The ten identified trending topic groups are named as follows: Topic 0: Online Consumer Experience; Topic 1: Crossmodal Sensory Correspondences; Topic 2: Tourism Marketing; Topic 3: Consumer Food Preference; Topic 4: Sensory Measurement; Topic 5: Brand Marketing; Topic 6: Retail Marketing; Topic 7: Embodied Cognition; Topic 8: Product Marketing, and Topic 9: Color Perception. Following the creation and naming of the trends, this research project is assigned to the matching trends. Accordingly, this work can be categorized under Topic 1 and Topic 4. A total of 85 (47 in Topic 0; 38 in Topic 4) of the 469 identified papers are classified within these topics. Finally, a manual literature review is conducted based on the work of vom Brocke et al. [
26], beginning with the top 10 papers, which most closely matched the keywords from Topics 0 and 4.
A closer look at the most relevant papers for Topic 0 reveals that one trend in online sensory marketing can be seen in the development and implementation of virtual reality (VR) and augmented reality (AR) [
27,
28,
29,
30,
31,
32,
33,
34]. VR and AR aim to compensate for the limitations of the digital consumer world by triggering the sense of touch in particular. Another interface is the area of mental imagery [
30] since a sensory experience can also be generated in the consumer’s mind via images [
8]. In addition to images, texts can be helpful. Both are examined intensively in this work.
In contrast, Topic 4, which includes the trend towards sensory measurements, is unique when considering essential papers. These papers refer to sensory analysis and measures in the field of agriculture. There are no articles that deal with counting and weighing sensory elements. Some papers deal with weighing sensory marketing elements—e.g., Haase and Wiedmann and their efforts to develop scales for sensory marketing [
35] and sensory perception [
36]. Thus, the OSMI index can also be assigned as the first approach to holistically measuring sensory elements in the digital sphere [
16].
Interestingly, no topic has been created regarding keywords explicitly used in search term three (big-data, artificial intelligence, deep learning). This fact reveals that big data and artificial intelligence are not yet broadly linked to sensory marketing in the scientific literature to create a new trend. Nevertheless, some papers are in place that focus on automatic sensory data retrieval and interpretation, which we also address in our study. For example, Kim et al. (2018) [
7] developed a sensemaking-based model for evaluating pasta dishes based on online reviews. A similar approach has also been conducted by Hamilton and Lahne [
6]. They applied natural language processing (NLP) to develop a sensory lexicon based on online reviews that included flavor classifications of whiskey. Another article by Meng et al. (2018) [
37] deals with a data-based approach to determining appropriate scent terms in product marketing. The analytical tools utilized in these papers will be applied in this work and described and adapted in detail in
Section 3.
3. Methodology
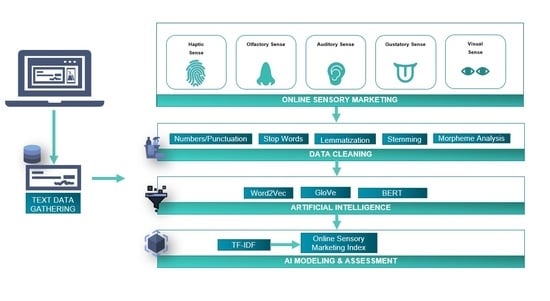
Our overarching goal is to digitize sensory marketing content and enable the automatic evaluation of e-commerce platforms regarding sensory communication quality. Therefore, the OSMI will be supported by an automated procedure based on evolving artificial intelligence methods. In this chapter, we describe the application of the text-based AI techniques Word2Vec, GloVe, and BERT, as well as the image analysis tools of the vendors Amazon and Google. Following our goal, we have conducted an applicability test of the OSMI through machine learning methods together with 40 big-data master students as part of a project at our university [
38]. To test various AI and big data technologies, we crawled previously defined 116 websites from 11 industries for texts and images. The chosen industries are automobile, cosmetics, fashion, food, healthcare, household, interior, leisure, lifestyle, technology, and vacation.
In contrast to the manual OSMI analysis, each subpage was included in the crawling process and subsequent investigations. Using the open-source software Beekeeper Studio combined with the Python libraries Scrapy and BeautifulSoup enabled the creation of a standardized source code that could extract text data from about 116 web pages and convert it to a predefined structure using Structured Query Language (SQL) applying a MariaDB database. A challenge was extracting the relevant text data from the different web pages. Variations in the designations, classes, and tags between web pages have been noticed. As a result, Cascading Style Sheets (CSS) had to be dynamically extracted from each web page before crawling. It ensures that every text element has been considered.
On the other hand, the storage concept for image data retrieval was fundamentally different from the storage concept for text. The significantly larger data volumes of the image files required scalable object storage in the form of the Amazon S3 cloud storage. For storing associated metadata, we decided to use a non-relational database in the form of a MongoDB database management system. We first set an initial filter for image data sourcing that specified an image’s minimum size of 95 × 95 pixels. It meant that buttons, icons, and cachets could be sorted out in advance. Images are always saved in the defined JPG format and, if necessary, converted into it. It was required to remove duplicates from the collected data for text and image retrieval. A total of 43,055 images could be extracted from web pages of 9138 URLs.
A total of 32,607 images have been recognized as unique and stored in the cloud application. The previously collected texts and images were subsequently evaluated by natural language processing (NLP) [
17] as well as automatic machine learning (AutoML) procedures [
39] to acquire sensory elements [
40,
41]. The evaluation of images has been studied and evaluated using OSMI indicators G3, color schemes, and V6, image contrast. The value range of both indicators is binary scaled according to the OSMI. However, text analysis with indicators H1, O1, A1, G1, and V1 forms the analytical focus of the automated approach [
16]. These five indicators include the text-based sensory communication approaches based on the imagery of the respective sensory impressions. The structure of the text analysis architecture was based on the techniques of Kim et al. [
7] and Hamilton and Lahne [
6], which have been discussed in
Section 2.
To adapt these approaches, we also used classical preprocessing to remove stopwords or filler words that merely lengthen sentences or serve grammatical correctness but are irrelevant to the actual content of a statement and thus to the analysis. The traceability to word root was mainly achieved with the lemmatization method. This method traces irrelevant conjugations of verbs back to the word origin (e.g., experienced → experience). We also tried another option of preprocessing text data by applying the stemming method. However, since this method rarely produces words with a clear meaning (for example, experienced -> experi), and this does not seem helpful for the subsequent analysis, we focused on the lemmatization method and neglected stemming. Finally, a morpheme analysis was carried out, assigning words their grammatically most minor property (the morpheme). It can be determined whether it is a noun, adjective, or verb. Adjectives were selected as descriptive words for the further course of the analysis as the most relevant word group. This preliminary work served for the subsequent vectorization of the phrase through word embedding. The machine learning word embedding methods GloVe and Word2Vec [
29,
30,
31] were utilized for analyzing text data. Those methods consider individual words as vectors of a vector space, also defined as a text corpus [
42,
43].
Additionally, we used the Bidirectional Encoder Representations from Transformers (BERT) [
44]. BERT is conceptualized based on a multi-layer bidirectional transformer [
45]. Using plain text, BERT can perform tasks such as masked word prediction and next sentence prediction [
46]. The BERT results obtained in the subsequent analysis are weighted with one-fifth due to the ratio to the other methods, so the overall result shows the same tendency as the word-embedding methods.
Figure 3 schematically illustrates the data infrastructure we base our analysis on, including the cleaning and preparation.
The last step was the specification of the modeling of the OSMI. Here, the TF-IDF (Term-Frequency—Inverse Document Frequency) algorithm was used, which was designed to record the frequency of specific keywords in documents [
47]. TF-IDF values were formed based on the frequency in the training corpus and subsequently converted to the OSMI. According to Ao et al. (2020), the TF-IDF Score is formally characterized as [
48]:
In addition to the frequency determination in connection with human senses, further weighting was carried out using TF-IDF. This weighting allows for categorizing words beginning with the most specific, least frequent, and thus most meaningful terms. These words are assigned a high weight, while frequently occurring words are given a lower weight [
48]. Through the values of the TF-IDF method, an OSMI could be determined utilizing the scoring algorithm. Maintaining the shared data structure could be traced back to individual websites, companies, and, in a highly aggregated manner, entire industries. It has been based on a total of 126,051 values for 1013 unique words from eleven business sectors, obtained using various word embedding techniques. The TF-IDF calculation in our paper differs minimally from the original TF-IDF score because we can read from our data that the meaning of different words for a given sense depends strongly on the analyzed industry. That is why IDF scores were calculated separately for each industry, based solely on the texts for that industry. Thus, the entire text corpus has not been considered to obtain industry-specific scores. Since we first defined keywords for each sense, we calculated an industry-specific usage of these words. In the following chapters, we would like to look closely at the identical scores related to four industries.
4. Results
According to
Table 2, the determined OSMI values of the individual parameters based on TF-IDF are higher than in the manual analysis we conducted previously. In this respect, key terms are searched per sense and subject to the assessment that even senses that are atypical for the respective industry are rated well (e.g., gustatory in the technology industry). In addition, the calculated weighted OSMI values are, on average, always approx. 19% below the unweighted OSMI. The change due to the weighting is stronger than in the manual analysis. Not every indicator of the OSMI is included in the automatic analysis, and purely mathematically. Thus the percentage change is more significant since the automatically calculated OSMI values were higher than in the manual analysis.
4.1. Automatic OSMI Evaluation of the Automobile Industry
Due to far-reaching restrictions regarding crawling websites in the automotive industry, we could only subject four websites to automatic analysis. These are Alfa Romeo, Ferrari, Lamborghini, and Volvo. Other websites, such as Ford, have prevented crawling through HTTP error 403. Let us look at the OSMI scores for this industry. Volvo achieved the best score within the sample with an OSMI
w of 0.56, followed by Lamborghini at 0.54, Alfa Romeo at 0.53, and Ferrari at 0.35. The unweighted OSMI scores were previously adjusted by an average of −14.88 %. However, the best (unweighted) parameter scores are assigned to the sense of sight at 0.75 and the sense of taste at 0.73 (Volvo), with the latter value losing significance due to the low weighting. A closer look at the machine-determined absolute frequencies of the input words used in the cleaned input data from the text analysis reveals that the automotive industry has a pronounced technical affinity for sensory consumer communication. This observation is consistent with those from the manual analysis and is reflected in the fact that the most frequently used words are “drive” (n = 164), “system” (n = 128), “design” (n = 82), performance (n = 58) and technology and engine (n = 55). In contrast, sensory terms such as “make” (n = 51), “dynamic” (n = 50), active (n = 42), experience (n = 40), or emotion (n = 24) are used with a significantly lower frequency of use. This is also illustrated by the word cloud below for the automobile industry (see
Figure 4).
A closer look at the TF-IDF evaluations based on GloVe cosine similarity reveals that, for example, sensory terms such as “fruit” (TF-IDF = −0.000211328) and “fresh” (TF-IDF = −0.000472486) are associated with the gustatory sense on Alfa Romeo’s web presence. The TF-IDF values are to be interpreted in such a way that although the terms are rare in the context of the senses and are thus significant, the smaller the value, the more rarely it occurs in the entire text corpus of the automotive websites. Accordingly, the word fresh was used twice as often compared to fruit. Such an assignment reveals the high scores for the gustatory and olfactory senses in the automatic analysis, which could hardly be located in the manual analysis. One reason for this is the limitation of the manual analysis to a few subpages so that indicators of the OSMI may be rated poorly because corresponding features are not available on the selected subpages. For example, in the case of Alfa Romeo, the word fruit is integrated into the following sentence, which per se is not intended to stimulate gustatory perception. Still, the key term can be evaluated positively in sensory communication style: “The excellent driving dynamics of the Alfa Romeo Giulia are the fruit of specific design choices” (Alfa Romeo). The automatic method seems to have a particular advantage in that some sensory elements are perceived unconsciously. Through AI, however, these are identified.
Other rare terms include “crisp” (TF-IDF = −0.000222913), which was used in our sample only by Lamborghini in, among others, the following sentence and is also linked to the gustatory sense according to AutoML: “With its crisp, streamlined lines, designed to cut through the air and tame the road, you will get a thrill just by looking at it.” (Lamborghini 2020). It would correspond to an excellent rating of the text-based, visual OSMI indicator V1 and, at the same time, a moderate rating of G1 since the word crisp appeals to the gustatory sense, even if only subliminally. Interestingly, it can also be extracted from the data that specific terms such as “experience” are used across all four companies but are also related to different senses. Thus, the token “experience” refers not only to haptics but also to our AI-based OSMI analysis, to the auditory and the visual sense. The same applies to tokens such as “fresh,” which is attributed to gustatory and olfactory. On the other hand, some terms were calculated to belong to only one sense, such as “immersive” (TF-IDF = −0.000203774) for acoustics. Here even the TF-IDF is identical, independent of the type of calculation (GloVe, Word2vec cosine, and Euclidean).
4.2. Automatic OSMI Evaluation of the Fashion Industry
In contrast to the automotive industry, we could crawl more websites and analyze them by applying AI-based methods in the fashion industry. The total of 14 websites includes, among other things, Tommy Hilfiger, Hugo, Boss, Gant, and H&M so that we could examine companies with different target groups. When looking at the average OSMI
w of 0.41 in the fashion industry, the first thing that stands out is that the weighting corrects the original (unweighted) values by −16.40% (d = −0.09), which can mainly be explained by the fact that the acoustic parameter is weighted significantly more compared to the automotive industry. An examination of the individual average parameter values also shows that the visuality parameter receives the highest rating, with 0.59 and 0.18 as weighted values in the manual analysis beforehand; however, haptics was identified as the most robust parameter, whereas in the automatic analysis, haptics only receives a lower average rating with 0.46/0.09 (weighted). The best weighted OSMI
w of the fashion websites examined was achieved by Tommy Hilfiger with 0.54, followed by Polo Ralph Lauren and G-Star with OSMI
w = 0.48 each. The rear in this sample of 14 websites was H&M with OSMI
w = 0.05. Furthermore, the Word Cloud for the fashion industry shown below in
Figure 5 demonstrates the machine-determined absolute frequencies of the input words used in the cleaned input data.
The text analysis reveals that measured by the frequency of certain terms, the factual focus in communication also tends to predominate in the fashion industry. Indications for this are the most frequent terms such as order (n = 231), size (n = 149), return (n = 141), store (n = 132) or item (n = 117), which rather describe the purchase process, but do not (strongly) appeal to the senses. Sensually appealing terms, in contrast, are make (n = 72), find (n = 49), create (n = 28) choose (n = 27), discover (n = 20), experience (n = 16). Interestingly, these terms were used less frequently than in the automotive sector, for example, even though ten more websites were analyzed in this sample.
Using the NLP methods described previously, a total of 1956 relevant tokens for the 14 web pages could be analyzed, and their TF-IDF calculated. The token “experience” has also been used in the fashion industry concerning several senses (haptics, visuality, acoustics). In the case of Gant, however, this term was given the lowest TF-IDF rating (TF-IDF = −0.001352577), indicating that this is remarkably concise. It is also worth looking at the results of the less obvious TF-IDF tokens and values. According to the previously determined weighting, the fashion industry has a subordinate role in olfaction and gustation. Nevertheless, our AI-based method produces excellent values for both parameters.
Thus, the olfactory parameter is characterized by tokens such as “floral” for the brands Gant (TF-IDF = −0.000453358) and Topshop (TF-IDF = −0.001608304), and the token “fragrance” (TF-IDF = −0.000429262) for Polo Ralph Lauren and Tommy Hilfiger (TF-IDF = −0.002448014), whereby fragrance is mentioned exclusively in the context of lifestyle products (perfumes) alongside the core business of these two fashion brands. The term floral is also ultimately related to the patterning of a garment but has cross-modal imaginative effects, albeit slight, on the olfactory sense. In addition, the high ratings of the gustatory parameter are due to terms that initially seem surprising. These include “vegetable” (TF-IDF = −0.000762665), which is used exclusively by the company Mango in the following formulation, for example: “A soft, elastic and resistant fiber of vegetable origin with a high capacity to absorb humidity.” Another rather unusual term is “salty” (TF-IDF = 0.00004987), used by the brand The North Face. However, this is merely the product name of a beanie called “Salty Dog Beanie,” which nevertheless has a cross-modal effect on the taste imagination due to this concise naming and product design, even if certainly only slightly. Once again, an additional distribution strategy has resulted in a higher evaluation of the gustatory experience for Polo Ralph Lauren, for example, since the brand also sells its coffee in addition to clothing. It is therefore not surprising that the token “coffee” can be found here with TF-IDF = 0.000694562. There are also numerous terms, such as “satisfy” or “mix,” which are used by many of the websites in our sample. In addition, clothing descriptions, especially colors such as orange or green, were assigned and evaluated by AI.
4.3. Automatic OSMI Evaluation of the Food Industry
The sample of the food industry includes a total of 26 websites of internationally operating companies and brands. Firstly, it must be noted that the following detailed analysis of the food industry corresponds to a relatively high level of aggregation and the broad market definition. Among the 26 websites, narrower market definitions could also be made (e.g., coffee, ice cream, etc.). The average weighted OSMIw of the sample corresponds to 0.47 with a weighting of the original values by −22.11% (d = −0.15). Thus, the influence of the weighting is the strongest compared to the samples of other industries examined so far. Finally, according to Kilian [
49], the multisensory appeal of food is by far the least heavily weighted in olfaction and taste except for the −40% from our addition of the weighting related to the limited imagination possibility. This aspect is interesting, however, because the values achieved in the parameters are not weighted so heavily from a mathematical point of view. In return, haptics and acoustics are weighted more heavily (3/21 each). Looking at the OSMI
w values in this sample, Lipton performs best with OSMI
w = 0.60. This is followed by Ben and Jerrys (OSMI
w = 0.57) and Langnese (OSMI
w = 0.56). Bringing up the rear in this relatively large sample are De’Longhi with OSM
Iw = 0.33, M&M’s with 0.31, Pizza Hut with 0.28, and finally Heineken with 0.04. The latter, however, can only be due to a technical error and does not reflect the actual OSMI
w value.
Furthermore, the word frequencies show (depicted in word cloud in
Figure 6) that among the 7291 entries with relevant word counts, the term “ice” is the most frequently used, with 408 counts. Other terms with similar counts are “tea” (n = 400), “make” (n = 393) and “cream” (n = 381). The term button, on the other hand, although frequent, is only the 13th most frequently used term across all 26 web pages with 251 uses. “Flavor” (n = 186) and “food” (n = 147) appear even less frequently. However, it is also interesting to note that terms such as “humor” (n = 118), “love” (n = 111), “people” and “share” (n = 96), and” family” (n = 93) are used relatively frequently, which underlines the social nature of food.
These results are reflected in our TF-IDF calculation. A total of 8418 tokens of the food industry could be identified using NLP methods. The term taste is found in this calculation in 21 companies with different TF-IDF values ranging from −0.036334791 (Lipton) to −0.000730107 (Melitta) and is associated with both gustatory and olfactory at the same time. Accordingly, the term taste is approximately 50 times less frequent for Melitta than for the Lipton brand. What are also linked to the sense of taste are terms such as “delicious” (e.g., Senseo, TF-IDF = −0.000524081) and “fresh” (e.g., Starbucks, TF-IDF = −0.000501102). The term fresh, in particular, shows that it can be determined to belong differently. While it is predominantly associated with taste and smell in the food industry, it is linked with visuality in the fashion industry, for example. Compared to the manual analysis, in which especially the olfactory sense was often very bad or not to be evaluated at all, the automatic analysis shows that also some tokens are responsible for the good parameter values of the OSMI calculations, which are not always immediately obvious by manual examination. This includes taste but also terms such as “rich” (e.g., Nescafe, TF-IDF = −0.021447275) or “morning” in relation to coffee products (also Nescafe, TF-IDF = −0.021479388) as well as “refresh” (e.g., Pepsi, TF-IDF = −0.010823447).
4.4. Automatic OSMI Evaluation of the Technology Industry
The fourth industry automatically examined has a sample size of 26 websites from various companies of international scope, including Apple, Samsung, IBM, and SAP, among others. Again, one aggregation level was maintained for simplicity, that of the tech industry. It could also be further clustered if needed, e.g., into the smartphone industry, the laptop industry, and many other sub-industries. Measured by OSMI
w results, Bosch achieved the best OSMI score of the sample at 0.61. Canon achieved the lowest rating with OSMi
w = 0.43. It should be noted, however, that the OSMIw results of the 26 websites are not very different from their unweighted OSMI itself, as the average weighting is only −13.63%, making it the lowest weighting in our sample of 11 various industries apart from the household industry. Having a look at the most frequent words used in the technology industry depicted in the word cloud chart below in
Figure 7, the automatic approach detected “service” (n = 800), “data” (n = 790), “product” (n = 691) and “business” (n = 660) as the four most frequently used words.
Expanding the horizon, the top 15 most frequently used words include “solution” (n = 585), “support” (n = 438), “time” (n = 356) and “customer” (n = 352). The TF-IDF analysis further shows, also based on a total of 8685 identified tokens, that the most frequently used terms attributed to sensory parameters are, in particular, “support,” which is by far the most frequently identified as sensory for TeamViewer (TF-IDF = −0.067276333) and Philips (TF-IDF = −0.050286917) and could be attributed to the haptic sense for all 25 identified tokens for this term. However, according to the TF-IDF calculation, the frequency of a token within the text corpus per se does not correspond to its importance. It is because the word support is used least frequently by Samsung (TF-IDF = −0.001685012) but is nevertheless even more closely related to the haptic sense. Additionally, brand names can also represent tokens. For example, “Bose” (TF-IDF = 0.03840414) and “Sony” (TF-IDF = 0.01256427) are related to the acoustic sense. Other terms associated with the auditory sense are “punchy” (Sony, TF-IDF = 0.001222402) and “bass.” The latter term is used by Sony (TF-IDF = 0.001217304) and by Bose (TF-IDF = 0.000314748), with Sony using it four times more often.
In contrast, the gustatory and olfactory senses are only given a very low weighting in the OSMI assessment within the technology industry. Nevertheless, the average OSMI values are moderate and significantly better than in the manual analysis. If we look at the tokens for the gustatory sense, for example, “aromatic” (TF-IDF = 0.002090729) is used by Philips, but to advertise a related product with such a sentence: “Aromatic coffee varieties from fresh beans made easy.” Bose also writes similarly, but according to the token of “coffee”: “perfect for ordering a coffee or making small talk with coworkers.” (TF-IDF = −0.000349977) and for “milk” as another gustatory term: “Alexa, add milk to my shopping list” or “[…] (TF-IDF = −0.000216297). Less obvious, but still linked to the gustatory as well as the olfactory sense are, e.g., “texture” (TF-IDF = −0.000453023). Apple also uses this in phrases such as, “Check out the texture in the wood, fabric, and crystal.” another short and thus significant olfactory term is “refreshingly” (TF-IDF = 0.000051839), which LG only uses in the following sentence: “Refreshingly convenient. Use the LG ThinQ app to control your air conditioner functions remotely.” Among the tokens for olfaction, there are also unusual words such as “stink” (TF-IDF = 0.000224945). It is only used by Microsoft, but apparently in a support section (FAQ) in the following context: “Now I have no idea where my address book is, and it stinks.” Here, a reference to olfaction can be calculated, but when viewed manually, this keyword has only subordinate multisensory meaning in this concrete case. Finally, our analysis results demonstrate that the technology industry seems to focus communicatively on solving customers’ problems. In this sense, the product is more of a means to an end in solving customers’ wishes and concerns.
5. Discussion of Results from Automatic OSMI Analysis
Our findings indicate that online sensory marketing content can, in principle, be analyzed in terms of its meaning on a website and evaluated utilizing our OSMI approach. It can be performed with the aid of AI methods [
50]. In this context, automatic keyword recognition and image data analysis about object and emotion recognition are particularly worth mentioning. First, we would like to state that using AI, object recognition, label analysis, recognition of faces and emotions, and text recognition in images are possible in an automated way. Amazon Web Services and Google Cloud have proven to be extremely useful and reliable in our approach. However, due to limited technical resources, we initially focused on image analysis and evaluating OSMI indicators G3 (use of color schemes) and V6 (contrast of images/web page). Therefore, our focus on automated OSMI computation is primarily text-based analysis using NLP methods. Even though we have utilized different NLP methods, the results obtained via GloVe and Word2Vec were similar in many respects. The GloVe method showed excellent values in the sense of hearing, while the use of Word2Vec excelled, especially in the sense of taste. Looking in detail at some of the senses, it was noticeable that the cosine similarity approach followed gave more robust, plausible, or fitting results than was the case with euclidean distance.
For the sense of hearing, the results of GloVe stand out as descriptive words such as immersive, astonish, loud, pleasant, or uplifting are recognized. In comparison, Word2Vec identifies nouns related to the sense of hearing, such as noise, speaker, or headphone, as particularly appropriate. For the sense of taste, the words delicious, tasty, sweet, or roast are more prominent in Word2Vec than in GloVe, and the GloVe model sometimes uses misleading terms such as graveyard. The words identified by GloVe for the sense of smell, such as fresh, lavender, crisp, or savory, appear to have a better connection to the sense than the words identified by Word2Vec, such as odor, fragrance, or perfume. Here, as with the sense of hearing, it is also evident that Word2Vec primarily identifies nouns as the best-related words.
Regarding the sense of touch, it can be stated that GloVe and Word2Vec have difficulties identifying relevant, descriptive words. In direct comparison, the results of Word2Vec such as give, attention, or touch have a more critical context to the sense of touch than the words identified by GloVe such as hi, strongly, or respondent. Finally, for the sense of sight, Word2Vec provides more appropriate terms such as elegant, sleek, clear, or unique compared to GloVe. In contrast, the words identified by GloVe, such as well, great, or moment are more general and could also fit other senses. A closer look at some senses reveals that the method of cosine similarity produces more robust, more plausible, or more relevant results than the method of Euclidean distance. Finally, the OSMI automatically determined by the TF-IDF procedure in this work reflects a large part of Killian’s listed weights in the form of a high value of the respective parameter. For example, the sense of sight has the highest overall importance and the highest unweighted OSMI value (0.68). The sense of taste, on the other hand, is the least important and has the lowest OSMI value at 0.57 but shares it with the auditory parameter. Overall, however, the determined OSMI values of the individual parameters based on TF-IDF are, on closer inspection, especially for olfactory, acoustic, and gustatory, significantly higher than in the manual analysis. The reason for this lies in the methodology of the applied TF-IDF procedure since a value is calculated by multiplying two metrics.
On the one hand, how often a word occurs in a document, and on the other hand, the inverse document frequency of the word in a series of documents—in our case, all preprocessed text data per industry. Insofar crucial terms are searched for per sense and subjected to an evaluation. Nevertheless, the text-based analysis reveals some interesting insights into the use of multisensory communication aspects on websites of the four industries studied.
6. Conclusions
We hereby present the first study to assess sensory marketing elements through artificial intelligence methods automatically. For this purpose, transformers and word embedding has been applied, including analyzing images and texts via machine learning. In particular, image analysis was limited to contrast and color analysis; therefore, in future studies, the required memory and processor resources should be considered and planned to perform more far-reaching image analyses, such as object recognition. As shown in this paper, text analysis with the help of AI works well compared to the manual study by Hamacher and Buchkremer [
16]. The results obtained from the automatic analysis reveal similar findings regarding the four investigated industries. For example, the technology and automotive industries rely heavily on communicating technical details; sensory communication is currently not a focus. Despite that, the approach we presented for the automatic OSMI calculation is based on seven indicators, five of which are text-based and two related to images. Image analysis, in particular, has been limited to contrast and color analysis; therefore, in future studies, the necessary memory and processor resources should be considered and planned to perform more far-reaching image analyses, such as object recognition.
However, we want to refine text analysis in the future, recognize active sensory formulations, and evaluate them using the OSMI index. In addition, the automatic procedure does not consider some indicators of the OSMI (e.g., Videos, VR, and AR), but these are recordable. A reasonable strategy could be to crawl and evaluate the respective Java-based code of the e-commerce website according to these indicators.
The results generally show that transferring the OSMI from a manual to an automatic version is possible. Regardless, we advocate further improving the automated analysis by implementing AI and machine learning methods to calculate the OSMI if the complexity grows. On the one hand, our approach provides many options for the scientific audience for further studies in this area. For example, it is possible to apply AI techniques not only for the sensory evaluation of websites but also to create close wiring to practice, e.g., by generating recommendations for sensory texts based on the advertised product. It would also be possible to automatically create sensory descriptions for products for commercial marketing in e-commerce with the help of AI.
On the other hand, our approach also offers significant advantages for marketing managers. They may benefit not only from an evaluation of their efforts in sensory product promotion, but our method also provides the possibility to very quickly perform a competitor analysis based on these marketing parameters. In addition, it would be possible in the future to experience efficiency gains through AI (labor and cost savings) if specific content creation processes could be automated.


