


Analyzing the Spread of Misinformation on Social Networks: A Process and Software Architecture for Detection and Analysis

1
Department of Computer Engineering, Yildiz Technical University, 34220 Istanbul, Turkey
2
Information Systems Group, University of Groningen, 9747 AG Groningen, The Netherlands
*
Authors to whom correspondence should be addressed.
Computers 2023, 12(11), 232; https://doi.org/10.3390/computers12110232
Submission received: 24 September 2023
/
Revised: 29 October 2023
/
Accepted: 9 November 2023
/
Published: 14 November 2023
(This article belongs to the Special Issue Selected Papers from the 23rd International Conference on Computational Science and Its Applications (ICCSA 2023))
Abstract
:The rapid dissemination of misinformation on social networks, particularly during public health crises like the COVID-19 pandemic, has become a significant concern. This study investigates the spread of misinformation on social network data using social network analysis (SNA) metrics, and more generally by using well known network science metrics. Moreover, we propose a process design that utilizes social network data from Twitter, to analyze the involvement of non-trusted accounts in spreading misinformation supported by a proof-of-concept prototype. The proposed prototype includes modules for data collection, data preprocessing, network creation, centrality calculation, community detection, and misinformation spreading analysis. We conducted an experimental study on a COVID-19-related Twitter dataset using the modules. The results demonstrate the effectiveness of our approach and process steps, and provides valuable insight into the application of network science metrics on social network data for analysing various influence-parameters in misinformation spreading.
1. Introduction
The COVID-19 pandemic has brought misinformation issues to the forefront of research, as a large amount of misinformation were circulated on social media platforms. Misinformation led to confusion, fear, and even dangerous behavior among the public. The proliferation of false information and disinformation primarily on social networking platforms is one of the most urgent problems of our time. The circulation of such content in general has reached unprecedented levels in recent years and has had a detrimental impact on a wide range of areas, from politics and economy, to public health [1]. Of particular concern in this work is the dissemination of falsified medical information related to the healthcare sector, which can have serious consequences [2]. Therefore, it is crucial to develop methods to identify and combat the spread of false information on social media, particularly during public health crises [3].
Misinformation can spread through different dissemination patterns or coordinated attempts to simulate widespread diffusion. Social media users can spread specific ideas across networks, creating opportunities for misinformation to spread rapidly [4]. However, not all models that examine the propagation of information and knowledge in social networks distinguish between different types of information, including misinformation and disinformation [5].
This study aims to address the misinformation-related challenges by presenting a data analysis process that applies some well-known Social Networks Analysis (SNA) metrics and algorithms to analyze the spread of misinformation. In the scope of this research, we are working on designing and implementing a process-based tool that can specify the steps of analyzing the spread of misinformation in social networks, as well as the software modules of an architecture that supports an SNA analytics process. In this context, we present a conceptual framework and proof-of-concept software architecture that supports the proposed SNA analysis. We determined what modules should be included in the software architecture and what functions they should perform, and implemented an initial version of the architecture, which we present here. We have utilized the prototype application for studying the propagation of misinformation on Twitter, and we plan to extend its usage by testing it with various SNA datasets from other social networks. The key contributions of this study is our prototype application that supports a process model that we are proposing, and the evaluation of its effectiveness in identifying the involvement of fake accounts in misinformation spread within sub-communities of social networks. The results we have obtained indicate that the proposed process and software modules supporting it, enable successful analysis of social network data. Moreover, the results obtained in the context of this study offer substantial insights into the analysis of misinformation propagation on Twitter, motivating us for a the future intention of validating this approach on datasets from different social networks in future research.
The structure of this paper is as follows. Section 2 provides a literature review. Section 3 explains the research problem and the research questions within this scope. Section 4 details the proposed process within the scope of the research. Section 5 describes the dataset used in this research, and Section 6 elaborates on the details of the proposed process prototype. Section 6 also reports on the experimental study and results obtained on the implemented software modules. Finally, Section 7 concludes the paper, in which we also discuss future work.
2. Related Work
Misinformation studies: The internet has completely changed the way people communicate. It allows information to be sent instantly across physical barriers and improves connectedness among its users. However, such progress has increased the dissemination of false information [6]. For this study, misinformation is defined as any information that is wrong, misleading, or falsified and conveyed through different modes of communication, such as print, text messages, or social media. While members of society have some options for intervening in the propagation of false news (flagging on social networking sites, fact-checking information, notifying others, correcting inaccuracies), the issues with misinformation remain open, from the technical as well as the social perspective. This is a cause for concern, as the amount of misinformation spread online shows no signs of decline [7,8,9].
Studies on misinformation have primarily focused on detecting [10,11] and/or preventing [12,13,14] false information on the internet and social media, while studies that consider the spreading factors of misinformation [15] are less. Our work aims to add value to the existing work on misinformation spread by modeling the SNA analysis as a process, so that these types of analysis can be conducted on a variety of datasets. Our work is focused on presenting modules as tools for SNA that include as input a dataset and returns the results from applying well-known network science metrics. Our hypothesis in our research is that the spread of false information in social networks depends on certain factors. It is predicted that incorrect information will be more easily detected, and the spread of misinformation more easily prevented, if these factors can be appropriately determined [16,17]. For this reason, we try to find several indicators that can be identified with some of the well-known centrality metrics.
False information that is transmitted on purpose to achieve a goal, such as convincing others to believe something for financial, political, and similar social benefits, is commonly referred to as “disinformation” [18]. However, many people who spread false information might do it unintentionally. Instead, they may be sharing information not knowing that it is not ture, or attempting to make sense of contradictory facts. This is known as “misinformation”. In this work, we refer to both misinformation and disinformation as misinformation for clarity and readability.
Misinformation detection in the healthcare domain has gained significant attention in recent years, reflecting the growing concern about the potentially harmful consequences of false or misleading health information. The proliferation of social media and online forums has made it easier for misinformation to spread rapidly, undermining public trust in healthcare institutions and affecting individual health decisions. Recent studies have explored various approaches to address this issue. Zhao et al. (2021) proposed a machine learning framework for identifying false health-related claims on social media, using features such as user behavior and linguistic patterns [19]. In a similar vein, another study developed a deep learning model to detect and classify health-related misinformation in online discussions, showcasing the potential of natural language processing techniques [20]. Furthermore, Safarnejad et al. (2020) employed network analysis to examine the spread of healthcare misinformation within online communities, shedding light on the intricate dynamics of misinformation propagation [21]. These studies underscore the urgency of developing effective misinformation detection tools in the healthcare domain and highlight the diverse range of methodologies and strategies being explored to mitigate this critical issue.
The constantly evolving information environment has made it simpler for misinformation to spread at unprecedented speed and scale, particularly on social media and search engines [22]. Correcting disinformation and false beliefs is crucial for instilling proper knowledge into public discourse. The purpose of fact-checking groups is to reduce the spread of disinformation, but the knowledge of the impact of these initiatives and activities on different demographics is lacking [23]. Thus, there are several research challenges in this aspect.
During the epidemic, researchers saw that misinformation distribution patterns varied widely between platforms, which might be due to the platform’s cultural and demographic structure and capabilities [15,24]. Because some demographic characteristics influence misinformation and fact-check sharing, studying how disinformation and fact-checks spread for different demographics and specific communities may be critical for establishing personalized tactics to combat online misinformation [25]. As an outcome, having a trustworthy framework for analyzing social media demographics is crucial for identifying whether certain distribution patterns significantly impact specific user demographics or communities with different characteristics. However, obtaining demographic data underlying social media accounts is a sensitive topic and involves privacy considerations, and requires careful data management, like anonymization. Furthermore, it is a complicated procedure that may be hampered by network security restrictions or users’ choices to identify themselves differently than they are, resulting in an incorrect perception [15]. Identifying different social media demographics data automatically has been a topic of interest for researchers, although achieving high levels of accuracy can be challenging. Specifically, identifying user age, gender, language, education, nationality, and account type on Twitter has been a focus of recent research [26]. In the context of these considerations, it is vital to emphasize the importance of using only the essential data points to address research questions when analyzing social network data. This analysis should be conducted with a Privacy by Design approach and in compliance with GDPR (or other relevant privacy laws outside of the EU) as the foundational privacy guidelines. Therefore, privacy considerations are much more than the law. We want to accentuate here that the treatment of sensitive data and attention to privacy issues should be a key focus for researchers doing any type of social network investigation. While in this study we intend to explore the association between misinformation and fact-checking spread during the outbreak regarding network data and community characteristics, this is mostly based on link and interaction data.
The authors in [27] have investigated privacy data propagation in social networks. These types of studies are important as they at least can be used to consider the challenges regarding the propagation of data in networks. Despite the expectation that social media platforms should counteract misinformation and the recent efforts, it is unlikely that the social media platforms will achieve this goal fully [27]. One assumption is that reacting to all misinformation information would require significant resources, and a more important one is that these platforms rely on ongoing user engagement. Unfortunately, disinformation often attracts attention, and social media platforms function on attention-keeping. Ultimately, engagement-based monetization takes precedence over all else.
The study of SNA has gained a lot of attention in recent years, with the emergence of big data and machine learning techniques. One such approach is supervised link prediction using structured-based feature extraction, which was proposed in a recent paper [28]. Another active area of research is the identification and classification of disaster-related tweets using improved bidirectional encoder representations from transformers [29]. Additionally, researchers have proposed a hyper parameter optimization approach with classifier vote ensemble for predicting COVID-19 infodemic tweet sentiment [30]. These studies demonstrate the effectiveness of machine learning techniques in these areas and provide valuable insights for future research.
An interesting approach in misinformation analysis in social networks by using provenance data is presented in [31].
Table 1 provides a comprehensive assessment of the existing research pertaining to misinformation detection systems within the healthcare domain. This study aims to utilize Twitter COVID-19 data to examine the effectiveness of our suggested approach for detecting disinformation with the usage of test and network analysis. The methodology incorporates graph-based and community-based algorithms.
Datasets: Several COVID-19 datasets have been published in a short time span. The majority of these datasets are simple and lack annotations or labels. Samples include international corpus on a broad range of topics linked to COVID-19, continuous Twitter chatter samples, multilingual data with geographical information of the members, Twitter collection for detection of postures, responses, and quotations [37,38]. The majority of those data sets either contain no labels at all, involve automated labeling using learning algorithms or semi-supervised approaches, or are not specially created for disinformation [39,40,41]. Examples of datasets gathered for COVID-19 disinformation analysis and detection include CoAID [34], which automatically labels tweets, responses, and assertions for false news. ReCOVery [36] is a heterogeneous collection annotated for tweets presenting credible vs. untrustworthy news, annotated through remote supervision. FakeCovid [42] is a large-scale Twitter dataset that focuses on misleading information as well as a bilingual, cross-domain misinformation identification collection with manual labeling.
Additionally, community detection in social networks has emerged as a pivotal research area, and over the past decade, a plethora of methodologies and algorithms have been proposed driven by the need to unveil the underlying network structures and topologies for studying their influence on information spreading or on other network dynamics. These methods range from traditional graph theoretic approaches, such as modularity optimization and spectral clustering, to more recent advancements like deep learning-based techniques [43]. Notably, the choice of a community detection method depends on the specific characteristics of the social network under investigation, including its size, sparsity, and the nature of the relationships among its nodes. This diversity of approaches reflects the dynamic and evolving nature of the field, where researchers continually adapt and expand their techniques to accommodate the ever-increasing scale and diversity of social network data. Moreover, the development of robust evaluation metrics and benchmarks has been instrumental in assessing the performance of these methods, fostering healthy competition and enabling meaningful comparisons [44]. Consequently, the ongoing exploration of community detection methods in social networks is crucial for better understanding the structural organization, information diffusion, and targeted interventions within these complex systems.
Processes: Six stages of a process of SNA are presented in [45], with which we agree, and organize our software modules accordingly. We aim for our work to benefit business applications, and our experiments can be further generalized in analyzing different types of social network data. The research presented in this paper is in line with studies commented in [46], and aims to provide mechanisms in the form of SNA support tools.
3. Research Questions
The research problem addressed in this study is to design and develop a software architecture for a process that can be used for SNA, specifically for misinformation spread analysis using network-science metrics on social network data. The modules of the proposed software architecture within the scope of the research are presented, along with the functionalities they are expected to perform. A prototype of the proposed process-supporting architecture is developed and used to investigate how data analysis studies can be conducted on the detection of COVID-19 related misinformation by analyzing SNA metrics. Specific research questions that are examined within the scope of this research problem are as follows:
- (1)
- How can a software architecture be designed to effectively use SNA metrics and algorithms for detecting misinformation spread? What are the modules that should be included in such an architecture?
- (2)
- How can the proposed architecture be implemented in a prototype software application for analysing misinformation spreading using SNA metrics? How effective is the proposed architecture testing it with a COVID-19 related dataset?
- (3)
- What type of insights can be gained from analyzing the data collected from the prototype implementation of the proposed process, regarding the effect of social network interactions on the spread of misinformation and the sub-community topology on Twitter?
4. Proof-of-Concept Prototype for Misinformation Spreading Analysis Utilizing SNA Metrics
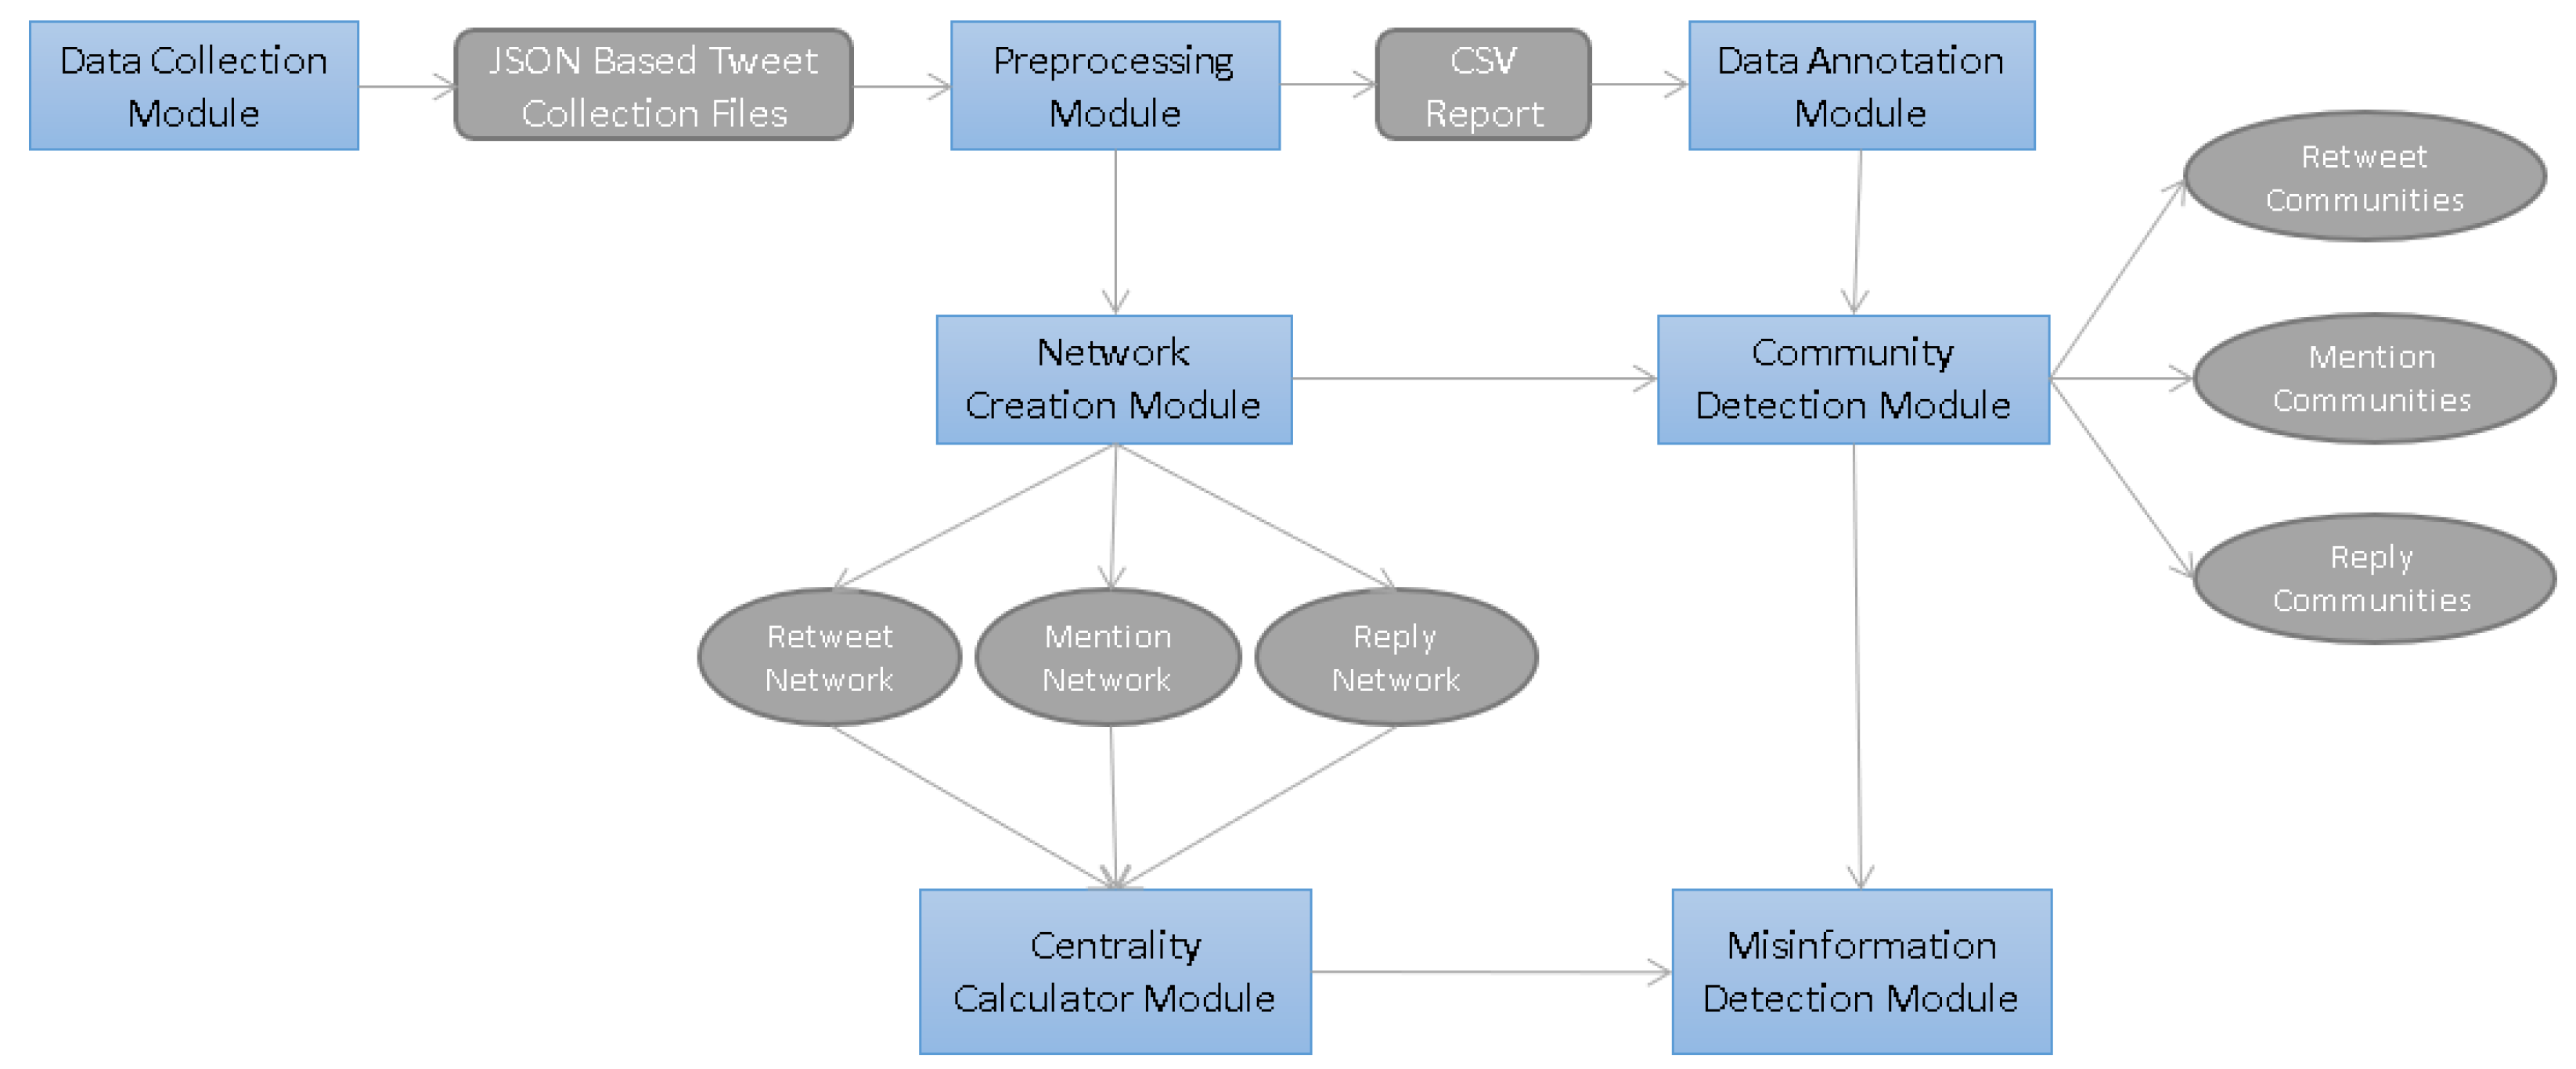
In this study, we propose a software architecture to be used in analyzing social network data (e.g., replies, mentions, and retweets) to study misinformation spreading patterns and influence-related network properties. The proposed process includes several modules: Data Collection, Data Preprocessing, Data Annotation, Network Creation, Centrality Calculator, Community Detection, and Misinformation Detection Modules, respectively. The proposed modules are depicted in Figure 1. In the following, we describe the objective of each module and the functionalities that each of them should perform in detail. This section provides an answer to the research question #1 from Section 3.
Our method leverages network centrality measures, such as degree centrality, in-degree/out-degree centrality, closeness centrality, and betweenness centrality, to identify influential nodes and communities within the network. This allows us to detect the involvement of fake accounts in misinformation spread and understand the impact of social network interactions on the dissemination of false information. By focusing on SNA metrics and community detection algorithms like the Girvan–Newman algorithm, our approach provides a unique perspective on the analysis of misinformation propagation, offering novel insights into the dynamics of misinformation spread within social networks.
4.1. Data Collection Module
The objective of this module is to collect Twitter data using the REST API provided by Twitter. This API offers programmatic access to various types of Twitter data, such as Tweets, and Accounts, among others. Over time, the Twitter API has evolved, providing developers and researchers with several access levels to explore and enhance public discourse.
The Twitter API offers multiple access levels to enable users to expand their usage on the platform. New users can quickly sign up for free and basic access. However, for the purposes of this study, this was insufficient due to the large dataset and constraints on free accounts. Therefore, an application was submitted for academic research access, which enabled the querying of 10 million tweets per month. It is important to note that we care about privacy principles as human rights, so we do not keep personal data, anonymize the accounts, by randomizing the IDs, and do not keep the account names in our dataset.
4.2. Data Preprocessing Module
This module is designed to convert the data collected during the tweet-gathering process into a format that other modules can process. In this module, each obtained tweet is browsed individually, and the relevant information outlined in Figure 2 is accessed to create a file with comma-separated values (CSV) format.
While most of the column names in the CSV file are self-explanatory, it is helpful to clarify the header values that will be used to construct the network. A mention is a type of tweet that includes the Twitter username of another account preceded by the “@” symbol. When a user responds to someone else’s tweet, it is called a reply. A Retweet, on the other hand, is a re-posted tweet. The Retweet function on Twitter enables users to quickly share a tweet with all of their followers. This feature can be used to retweet one’s own tweets or those of other users.
4.3. Data Annotation Module
This module takes the output of the preprocessing module and applies automatic labeling to the resulting dataset. The processed tweets are stored in a separate CSV file, which contains the tweet ID, tweet text, and a flag indicating whether the data are considered as reliable or unreliable.
The utilization of “Iffy.news” [47] in the context of automatic labeling for Twitter content represents a proactive and pivotal approach in the ongoing battle against the dissemination of misinformation. By categorizing tweets that contain links to, or textual references from, unreliable sources, this platform contributes to the ever-evolving landscape of digital information verification. The labeling of such tweets as misinformation serves as a crucial step in curtailing the spread of false or misleading content, safeguarding the integrity of online discourse, and fostering a more informed and critical digital society. In addition, we used the list of untrusted sources provided in [48] to label records from untrusted sources. We want to note that we do not claim that our labeling is completely correct, we can only assume as we get this data from external sources as described in this subsection.
4.4. Network Creation Module
This module is designed to model the dataset as a network graph so that we can conduct network analysis on the resulting graph. The network consists of nodes (or vertices) and links (or edges). To construct this social network, retweets, mentions, and replies are utilized. Accounts are represented as nodes, and (multiple) interactions are represented as edges.
4.5. Centrality Calculator Module
This module takes the output of the preprocessing module as its input and outputs network centrality metric values. Network centrality metrics are well-known SNA metrics that assess the importance and infliuence of an individual or group in a network from multiple perspectives, and can help analyse information flow, and emergent network patterns [49]. Four methods for measuring network centrality are well known: degree centrality, closeness centrality, betweenness centrality, and eigenvector centrality. We work with the degree, in-degree, out-degree, closeness and betweenness centralities. Depending on the specific metric applied, centrality indicates that a node is directly connected to most other nodes, indirectly connected to many others, or serves as a crucial mediator among multiple other nodes, e.g., a bridge.
By quantifying centrality, researchers can unveil key actors in social networks, pinpointing individuals who serve as critical brokers of information, connectors between disparate groups, or influential trendsetters [50]. Furthermore, centrality metrics enable the identification of structural vulnerabilities and potential points of control within a network, which has significant implications for fields as diverse as epidemiology, marketing, sociology, and security analysis. As such, the application of centrality metrics represents a cornerstone in the study of social networks, enhancing our ability to unravel the intricacies of human interactions and their societal repercussions [51]. We describe these metrics in this subsection.
Degree centrality [52] is a measure that indicates the number of connections or relationships that each node in a network has. Nodes that have a higher degree are considered more significant because they have more interactions. Therefore, they can be crucial players in the network and exert more influence over other nodes [53]. In directed networks, the in-degree and out-degree metrics are important measures for understanding the structural characteristics and dynamics of social networks. In-degree denotes the number of connections directed towards a particular node within the network, offering insights into an individual’s popularity or prominence within the network. On the other hand, out-degree quantifies the number of connections originating from a node, indicating an individual’s propensity for forming relationships or disseminating information [54].
Closeness centrality is a measure of how quickly a node can reach other nodes in the network, and is the mean distance from node i to every other node in the network [52]. Nodes that are more central have shorter distances to other nodes. In contrast, nodes with higher closeness centrality scores have to travel farther along network paths to reach other nodes, indicating that they are less central and potentially less important in the network [53].
Betweenness centrality [52] is a metric that calculates how often a node in the network falls on the shortest path that connects two other nodes. Nodes with higher betweenness centrality ratings are often viewed as information and resource brokers since they can act as bridges or intermediaries between different parts of a network. These nodes are essential in maintaining connectivity in the network, and their removal can lead to fragmentation of networks [53].
4.6. Community Detection Module
This module aims to identify communities within the Twitter dataset by utilizing the graph outputs generated by the Network Creation module. By examining the neighborhood information along with the communities extracted from the retweets, mentions, and replies networks, this module can be used to identify which groups are spreading misinformation. Community detection algorithms can be used to group together nodes that are more densely connected to each other than to the rest of the network. By analyzing these communities, researchers can gain insights into how misinformation spreads within different groups on social media.
4.7. Misinformation Detection Module
The Misinformation Detection module uses the communities output from the Community Detection module to identify user and tweet pairs that belong to these communities from the previously labeled tweet collection. Then, by comparing the centrality metrics for the users within each community, it attempts to determine how important these users are in the user group/community. This information can be useful in identifying influential users who may be spreading misinformation within a specific community. Additionally, by analyzing the content of the tweets within these communities, the module may also be able to identify specific topics or themes that are prevalent within the community and potentially contributing to the spread of misinformation.
5. Dataset
CoVaxxy is a collection of English tweets related to COVID-19 vaccination, which is being monitored and analyzed by the Observatory on Social Media (OSoMe) at Indiana University. The goal of the project is to understand how online information affects the uptake of COVID-19 vaccines and their health consequences [55]. The database is updated continuously and in real-time, and it provides public access to a vast amount of vaccine-related English-language tweets. The CoVaxxy dashboard is a website that combines these data with vaccination uptake and surveys, allowing anyone to visualize descriptive and inferential statistics and preliminary findings related to COVID-19 vaccination [56].
The dataset covers the period from January 2021 to January 2022 and is obtained by querying specific keywords on a daily basis. The keywords used for the query are listed in Table 2, and can be found in the keywords.txt file in the dataset folder. Each data file contains information on tweet ids in text files on a daily basis. However, not all tweets may be accessible due to privacy settings or deactivated accounts. For this investigation, the tweets sent on 11 January 2021 were selected and attempted to be retrieved. We use the raw IDs shared by the authors in [55] to hydrate the tweets.
This study uses the Twitter API, version 2, to access tweets. To access the Twitter API version 2, an application is created through the Twitter web interface, and the necessary access and secret key credentials are obtained. The “tweets lookup” rest endpoint [57] is used to query tweet collections, which provides information about a tweet or collection of tweets based on their ID(s). To optimize efficiency, the API’s limit of 900 requests every 15 min is kept in mind and tweet IDs are submitted as batches of up to 100 IDs, separated by commas. Moreover, the endpoint allows us to specify the fields we want to return, and selected fields are listed in Table 3. However, as aforementioned, we are careful about privacy, we do not use private data, and we delete all fields that are unnecessary for our analysis like name, full name, and username, as well as all fields related to location.
After each request, a JavaScript Object Notation (JSON) file is created for every 100 tweets downloaded, and all information is stored inside it. The structure of the data are as shown in Table 4. The ‘data’ property in the JSON file holds tweets that have been successfully downloaded. The ‘errors’ property represents the responses that could not be answered for any reason. The ’includes’ field contains extra information for successful response tweets.
The data are stored in a folder with the name of the same day after all the tweets are downloaded from the tweet IDs for a day, using the JSON format. Storing the data in a single file for the day allows for easier processing of the data using the Python library. In this study, tweets regarding COVID-19 on 11 January 2021 were used. The Python script was run for the selected day, and all the JSON files in the folder were processed to generate a data report for that day. Any columns without a value were marked with a # sign to facilitate filtering operations on the data.
Data Statistics
In this work, a request was made to obtain a dataset of tweets from the Twitter Application Programming Interface (API) for a specific day. A total of 778,246 tweets were requested, but only 493,200 tweets were successfully retrieved. It is worth noting that some tweets could not be accessed due to factors such as the deletion of tweets or users disabling or hiding their profiles. After the tweet collection is passed through the data annotation module, the output obtained includes information about the tweet and whether it is misinformation. The classification of the collection is shown in Figure 3.
6. Prototype and Evaluation
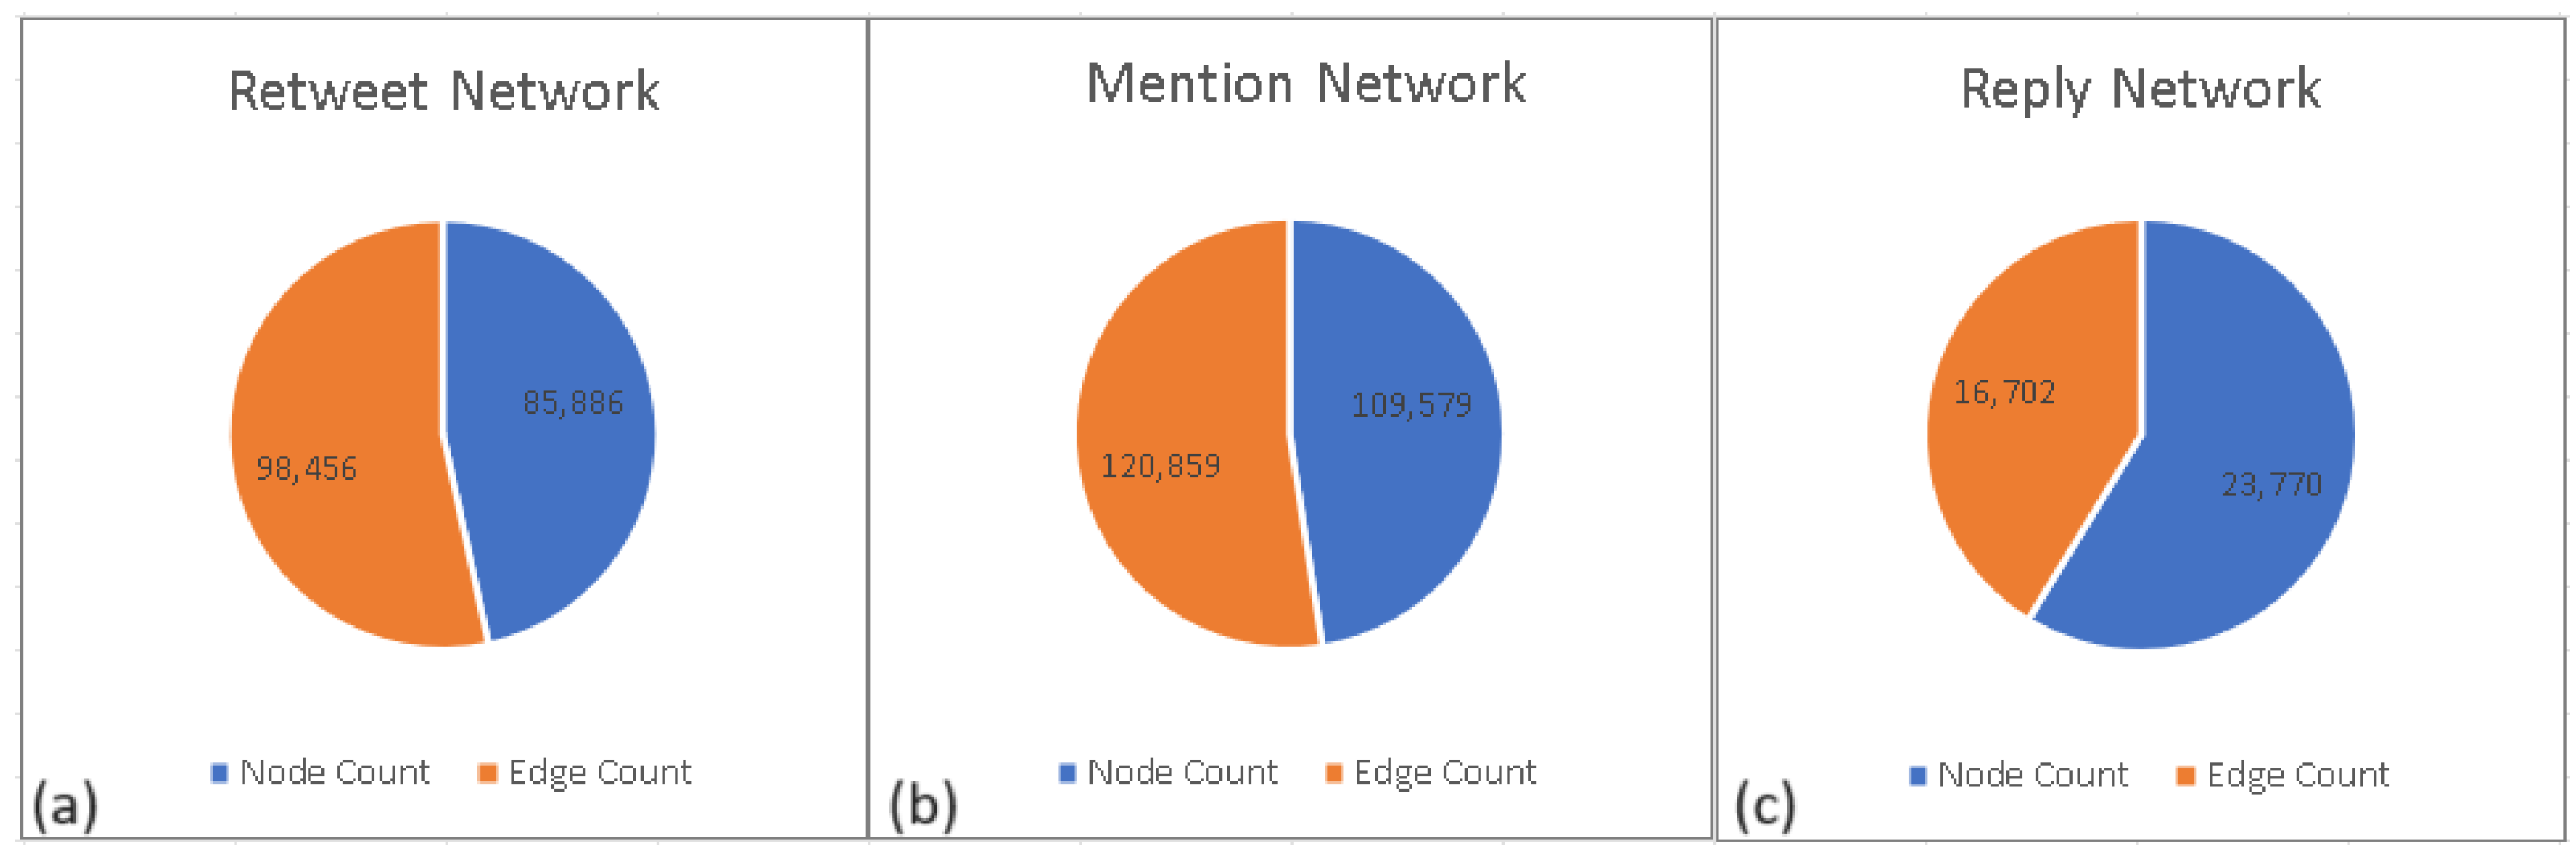
In this section, we discuss the details of the prototype implementation of the proposed process. This section provides an answer to the research question #2 from Section 3. Once the data collection is downloaded and all processing operations are complete, the network/graph creation module is executed. This module reads the CSV output of the preprocess module using the Pandas library and imports it into the runtime. Subsequently, separate retweet, mention, and reply networks are created using the ’from_pandas_edgelist’ function of the NetworkX library. During the creation of the retweet network, IDs of the users who tweeted and the retweeted user are defined as the nodes of the graph, and an edge is defined between them. UserID, retweeted tweet ID, and retweet userID are defined as additional information for correlation. The mention and reply networks are created using a similar approach. Isolated nodes of each network are removed from the network, and confusing correlations are eliminated. The node and edge statistics of each network are depicted in Figure 4.
Due to the limitations of the NetworkX library in rendering large graphs with numerous nodes and edges, the Gephi application was used for visualizing the graphs. To enable the Gephi application to comprehend the retweet, mention, and reply networks, the write gexf function of the NetworkX library was utilized to convert the graph-based data into a suitable format. The resulting visual representations of the networks, generated using the Gephi application, are depicted in Figure 5.
The graphs produced by the network creation module serve as input for two additional modules. The first is the Centrality Metric Creation Module, which takes the related graphs as input and uses the degree centrality, in-degree centrality, out-degree centrality, closeness centrality, and betweenness centrality functions of the NetworkX library to calculate the metrics for the networks. The centrality metrics for each network are returned as a Python dictionary. It is important to note that the larger the centrality metric, the more central a node is in the network, and thus more influential. However, in the Closeness metric, nodes with lower values are considered more central as they have to travel fewer paths. Conversely, in the betweenness metric, nodes with higher values are considered more critical as they have shorter paths than other node pairs and they serve as “bridges” between communities.
It is crucial to analyze the parameters used in the proposed methods and discuss their optimal choices within the framework. The selection of parameters plays a significant role in the effectiveness and practicality of the proposed process. For instance, in the network creation module, parameters such as the threshold for retweet counts or the time window for data collection can impact the resulting network structure. Similarly, in the centrality calculator module, parameters like the type of centrality metric or the normalization method can influence the identification of influential nodes. It is important to conduct parameter analysis experiments to evaluate the impact of different parameter settings on the performance of the proposed methods.
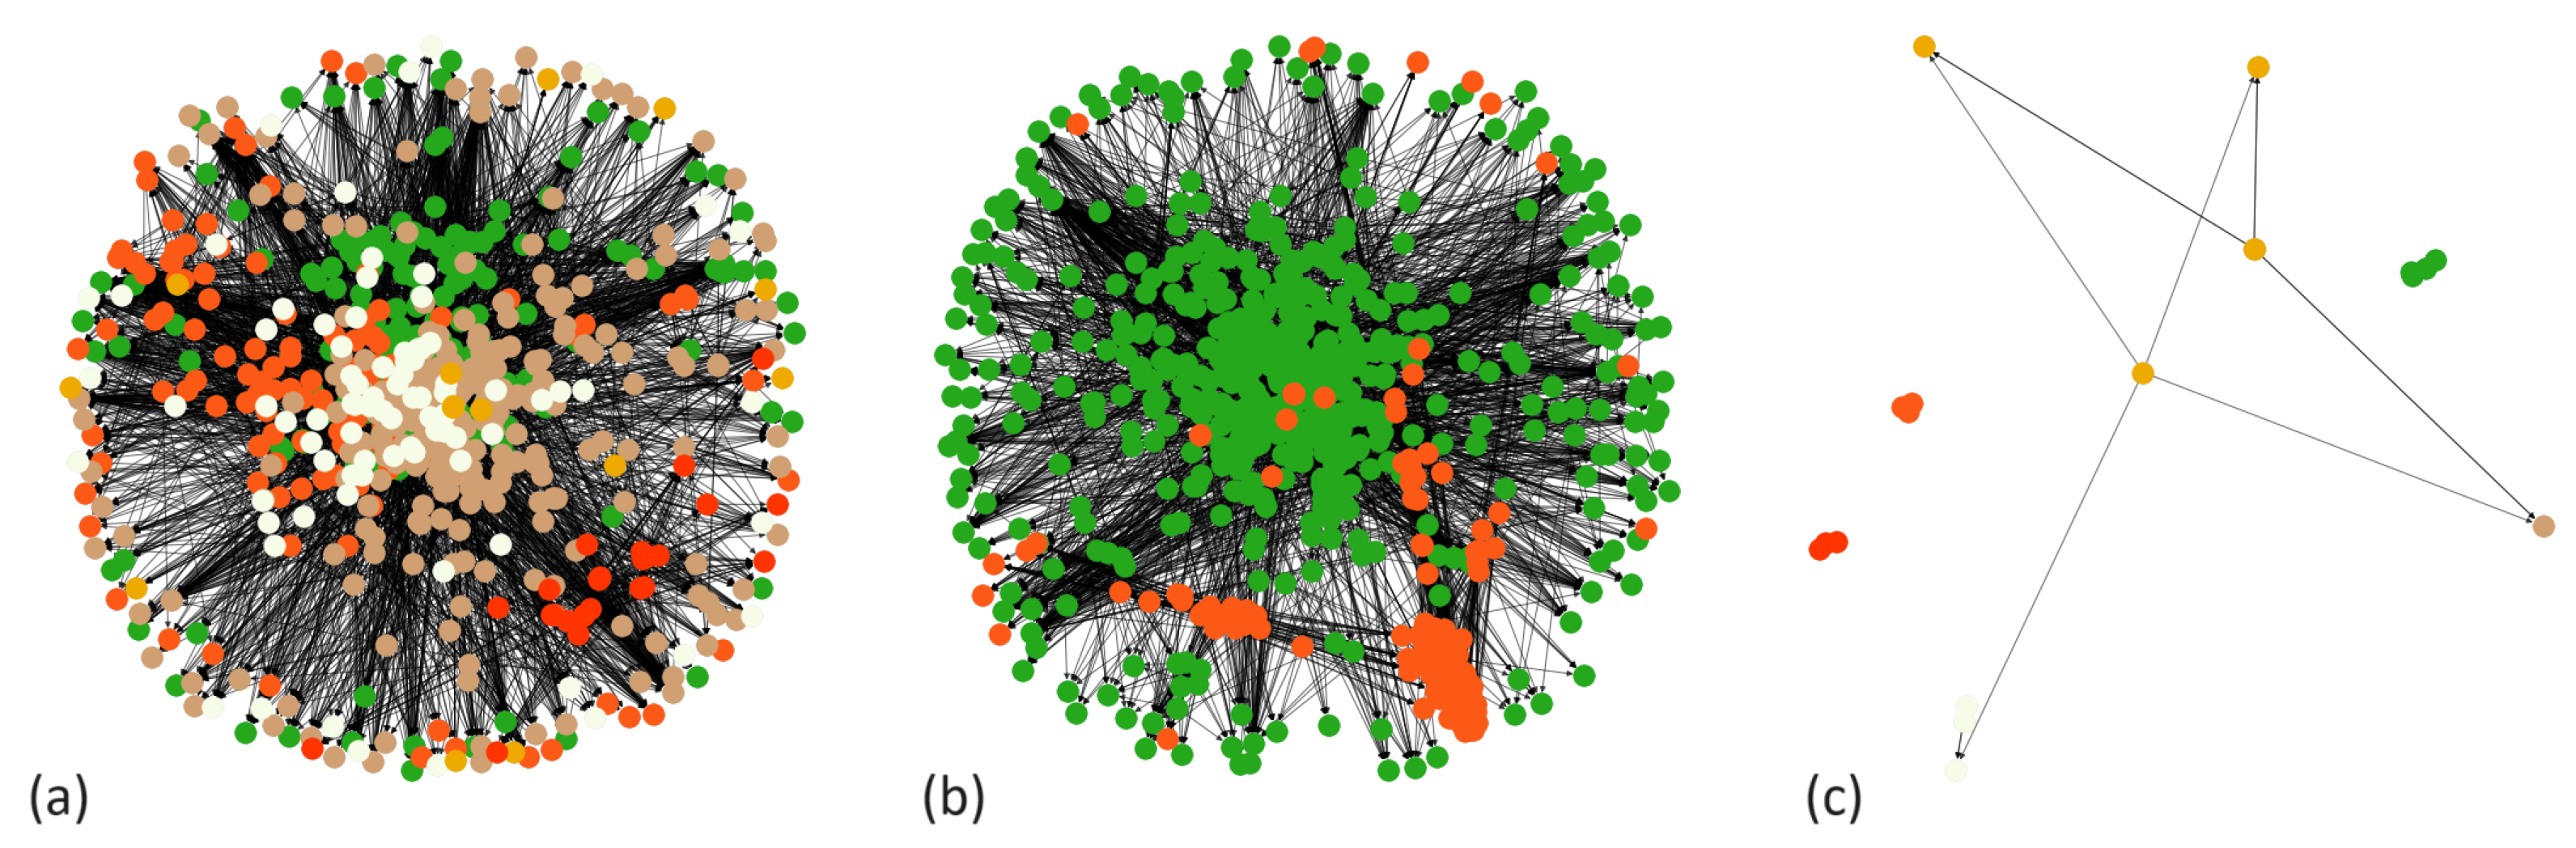
The output of the network creation module is utilized by another module, namely the Community Detection module. This module applies the Girvan-Newman algorithm and function of the NetworkX library to identify communities in the graph. The Girvan-Newman algorithm was selected for community detection in our study due to its well-established effectiveness in identifying community structures in networks [58]. Developed by Michelle Girvan and Mark Newman, this algorithm iteratively removes edges with the highest number of shortest paths among vertices that pass through them, i.e., edges with highest betweenness centality. By progressively eliminating edges, the network becomes fragmented into clusters called communities. The Girvan–Newman algorithm is widely used in SNA for its ability to detect and analyze community structures [58]. While our study specifically utilizes the Girvan–Newman algorithm, it is important to note that other community detection methods, such as the Louvain method, modularity-based communities, and Tree partitioning, can also be integrated into our proposed process. This flexibility allows for the exploration and comparison of different community detection approaches in the analysis of misinformation spread within social networks. Figure 6 displays graphics created from the retweet, mention, and reply networks, which are color-coded according to communities.
The misinformation detection module is executed in the final stage of the process, utilizing the output from the data labeling, centrality calculation, and community detection modules. The module compares the users who have posted tweets in the communities identified by the retweet, mention, and reply networks with those who have posted tweets that were flagged as misinformation in the data labeling module. The module also marks bot accounts present in each community. Subsequently, nodes in a community are ranked for each centrality metric, and the significance of bot accounts within the community is measured. The results of the aforementioned data analysis conducted using the proposed module implementations provides an answer to research question #3 from Section 3.
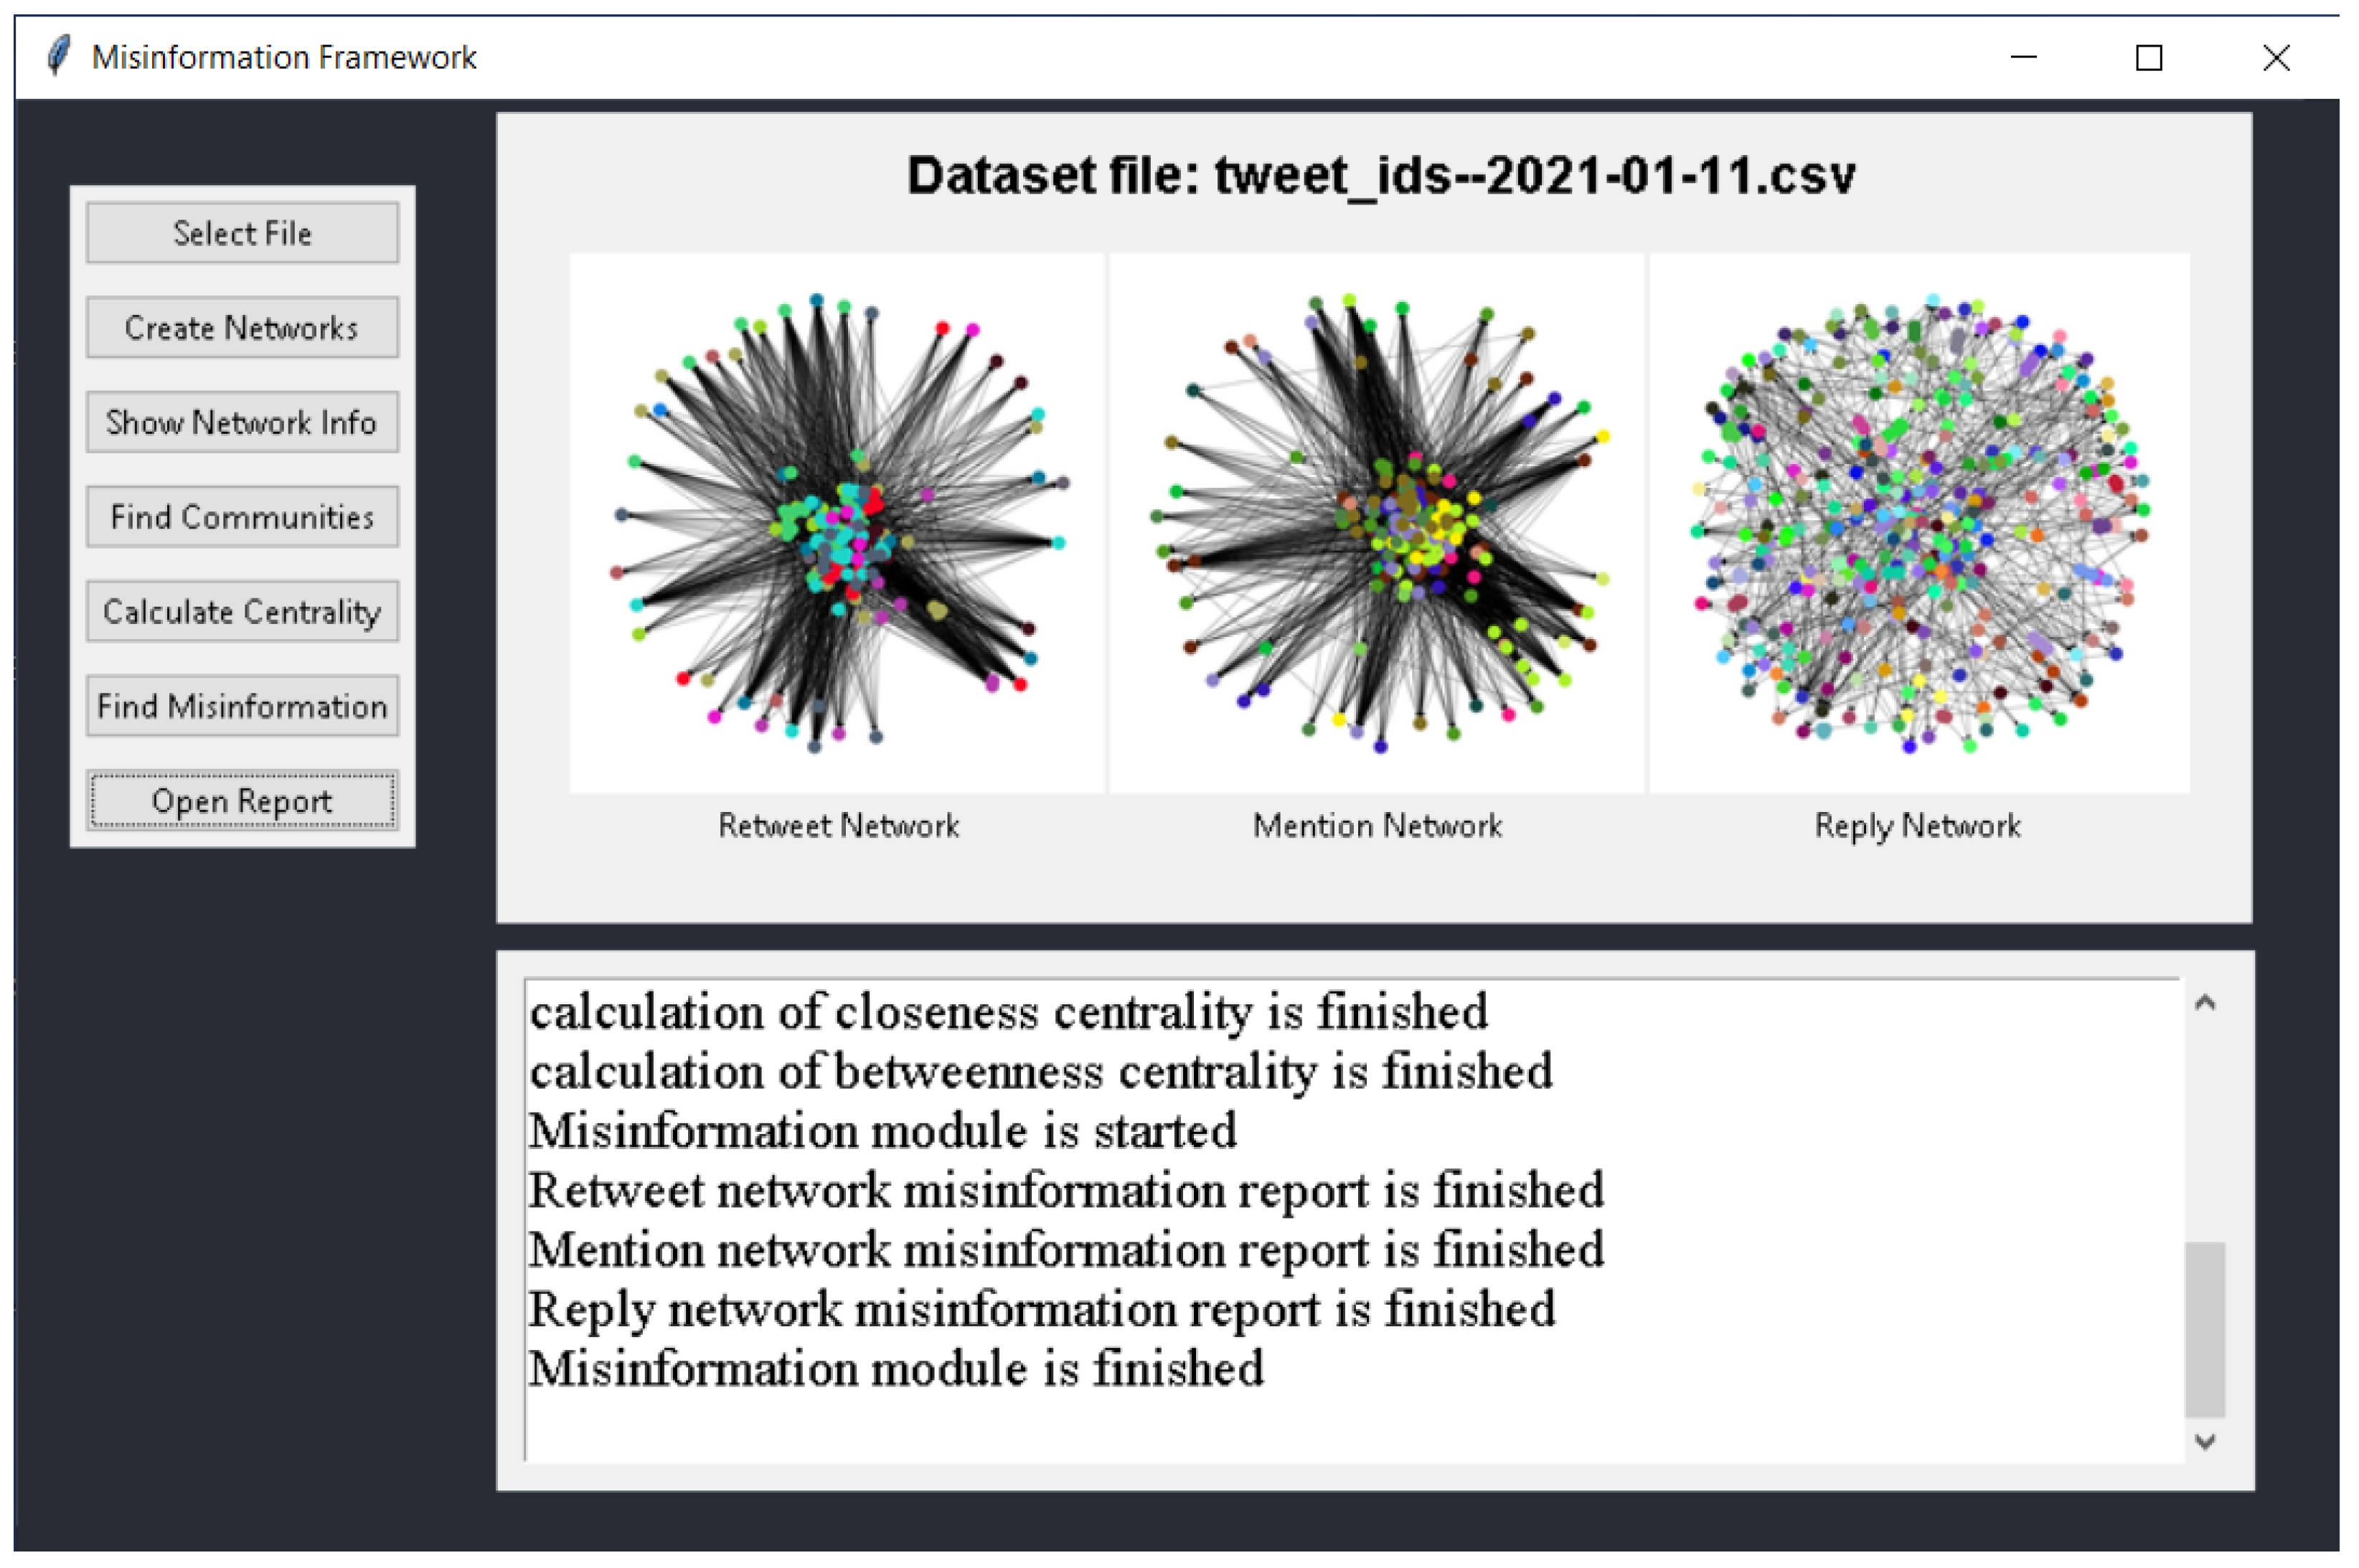
In addition to the aforementioned prototype implementation, we have also developed a graphical user interface (GUI) application to make it easier for users to interact with the proposed framework. The GUI is built using the Python library Tkinter and provides a user-friendly interface for uploading data, selecting preprocessing options, and executing the various modules of the proposed framework. Once the data is processed and the networks are created, the GUI in Figure 7 allows users to visualize the networks using the NetworkX application and analyze the centrality metrics and community structure of the networks using the implemented modules. The GUI also displays the results of the misinformation detection module, providing users with a clear understanding of the extent to which misinformation is being disseminated in the communities identified by the aforementioned metrics and algorithms. The availability of the GUI application on GitHub as an open-source project makes it easier for researchers and analysts to access and use the proposed framework, promoting transparency and reproducibility in data analysis [59].
Furthermore, throughout the execution of the experiments in this study, the centrality metrics utilized in the NetworkX library were computed using default values. In the computation of the betweenness value, the normalized parameter was set to true and the number of node samples was set to 500. The findings of experiments conducted with lower node sample values did not exhibit any statistically significant alterations. Furthermore, in the use of the Girvan-Newman method, nodes that have fewer than three connections were disregarded.
In this research, we also label tweets as disinformation or not on a dataset collected on 11 January 2021. The visual representation of this is depicted in Figure 8. It is important to note that our work does not focus on misinformation detection, but we label twets based on iffy and also on the list on un-trusted sources that we have mentioned earlier. The first column presents the id of the evaluated tweet. The second column indicates whether the tweet in question was labeled as disinformation. The subsequent three columns display the network type established, together with the centrality metric’s type and the corresponding value computed within the respective network. The following two columns provide information on the community detection module. Specifically, they present the community affiliation of the tweet, the number of nodes inside that community, and the ranking of the tweet’s relevance based on the centrality metric within the respective community.
7. Conclusions and Future Work
In conclusion, the spread of misinformation on social media is a significant issue that has emerged as a pressing concern, particularly during public health crises such as the COVID-19 pandemic. Thus, the need to develop effective methods for identifying and combating misinformation on social media has never been more urgent. This research proposes a process that can detect the spread of misinformation on social network data using SNA metrics, and a tool that provides network-science metrics and algorithms for SNA on various datasets. The software architecture of the proposed process is presented, along with a prototype application that demonstrates its success in analyzing misinformation spread with a Twitter case study.
This study makes several novel contributions to the scientific community. Firstly, it proposes a module-based process design and software architecture for analyzing the spread of misinformation in social networks, along with a GUI, which we believe can be used for a variety of social network datasets.The process incorporates SNA metrics and algorithms to detect the influential accounts in misinformation spread. Secondly, the study proposes a developed prototype application that implements the proposed process, demonstrating its effectiveness in analyzing misinformation spread on the Twitter platform. This prototype application serves as a practical tool for identifying and combating misinformation on social media, as it gets as an input a json based dataset, with specific data structure requirements, and the user can apply then social network metrics like the centrality ones, as well as clustering algorithms such as the tested Girwan-Newman algorithm to get the output metric values, statistics and network clusters respectively also in a visual way. Lastly, the research provides valuable insights into the analysis of misinformation propagation on Twitter, particularly during public health crises like the COVID-19 pandemic.
The findings obtained within the scope of this research provide valuable insights into how the spread of misinformation can be analysed on social media platforms, particularly during public health crises. It is hoped that the proposed process and prototype application can contribute to the development of more effective methods for combating the spread of misinformation on social media in the future. This study also provides a preliminary assessment of the scale of disinformation propagation and identifies some of its possible characteristics. To mitigate the adverse effects of this phenomenon, it is imperative that all relevant stakeholders take action to promote the dissemination of reliable and authenticated information using social media’s vast outreach capabilities.
Further work is needed to evaluate the performance of the proposed tool. The impact of bot accounts on the dissemination of misinformation can be assessed more efficiently by downloading more data for different days of the same dataset. Moreover, since the model presented in this study is a general framework, it may be applied to any dataset, obtained from Twitter and other sources to conduct misinformation spread. We will test this in our future work. Community detection in our model is based on the Girvan-Newman algorithm; however, other community detection methods, such as the Louvain method, modularity-based communities, and Tree partitioning, can also be plugged-in. Our future work on the proposed architecture includes providing functionality for users to import NetworkX output and visualize it in Gephi automatically, which involves adding one more module and an additional application integration work.
Author Contributions
Conceptualization, Z.D., M.R. and M.S.A.; methodology, Z.D., M.R. and M.S.A.; formal analysis, Z.D., M.R. and M.S.A.; data curation, Z.D.; writing—original draft preparation, Z.D.; writing, review and editing, Z.D., M.R. and M.S.A.; visualization, Z.D.; supervision, M.R. and M.S.A. All authors have read and agreed to the published version of the manuscript.
Funding
This research received no external funding.
Data Availability Statement
All data and materials are available upon request and can be found at public GitHub repository [59].
Acknowledgments
We would like to thank the reviewers for their thoughtful comments that helped improve the quality of this work.
Conflicts of Interest
The authors declare no conflict of interest.
References
- Maffioli, E.M.; Gonzalez, R. Are socio-demographic and economic characteristics good predictors of misinformation during an epidemic? PLoS Glob. Public Health 2022, 2, e0000279. [Google Scholar] [CrossRef] [PubMed]
- Kumar, S.; Arora, B. A Review of Fake News Detection Using Machine Learning Techniques. In Proceedings of the 2021 Second International Conference on Electronics and Sustainable Communication Systems (ICESC), Coimbatore, India, 4–6 August 2021; pp. 1–8. [Google Scholar] [CrossRef]
- Almaliki, M. Misinformation-Aware Social Media: A Software Engineering Perspective. IEEE Access 2019, 7, 182451–182458. [Google Scholar] [CrossRef]
- Rahmanto, A.N.; Dirgatama, C.H.A. The implementation of e-government through social media use in local government of Solo Raya. In Proceedings of the 2018 International Conference on Information and Communications Technology (ICOIACT), Yogyakarta, Indonesia, 6–7 March 2018; pp. 765–768. [Google Scholar] [CrossRef]
- Guess, A.M.; Lyons, B.A. Misinformation, disinformation, and online propaganda. In Social Media and Democracy: The State of the Field, Prospects for Reform; Cambridge University Press: Cambridge, UK, 2020; Volume 10. [Google Scholar]
- Cuan-Baltazar, J.Y.; Muñoz-Perez, M.J.; Robledo-Vega, C.; Pérez-Zepeda, M.F.; Soto-Vega, E. Misinformation of COVID-19 on the Internet: Infodemiology Study. JMIR Public Health Surveill 2020, 6, e18444. [Google Scholar] [CrossRef] [PubMed]
- Avram, M.; Micallef, N.; Patil, S.; Menczer, F. Exposure to social engagement metrics increases vulnerability to misinformation. arXiv 2020, arXiv:2005.04682. [Google Scholar] [CrossRef]
- Yang, Y. COVID-19 Fake News Detection via Graph Neural Networks in Social Media. In Proceedings of the 2021 IEEE International Conference on Bioinformatics and Biomedicine (BIBM), Houston, TX, USA, 9–12 December 2021; pp. 3178–3180. [Google Scholar] [CrossRef]
- Volkova, S.; Jang, J.Y. Misleading or Falsification: Inferring Deceptive Strategies and Types in Online News and Social Media. In Proceedings of the Companion Proceedings of the The Web Conference, Lyon, France, 23–27 April 2018; pp. 575–583. [CrossRef]
- Dhankar, A.; Samuel, H.; Hassan, F.; Farruque, N.; Bolduc, F.; Zaïane, O. Analysis of COVID-19 Misinformation in Social Media using Transfer Learning. In Proceedings of the 2021 IEEE 33rd International Conference on Tools with Artificial Intelligence (ICTAI), Washington, DC, USA, 1–3 November 2021; pp. 880–885. [Google Scholar] [CrossRef]
- Safarnejad, L.; Xu, Q.; Ge, Y.; Chen, S. A Multiple Feature Category Data Mining and Machine Learning Approach to Characterize and Detect Health Misinformation on Social Media. IEEE Internet Comput. 2021, 25, 43–51. [Google Scholar] [CrossRef]
- Lewandowsky, S.; Van Der Linden, S. Countering misinformation and fake news through inoculation and prebunking. Eur. Rev. Soc. Psychol. 2021, 32, 348–384. [Google Scholar] [CrossRef]
- Pham, D.V.; Nguyen, G.L.; Nguyen, T.N.; Pham, C.V.; Nguyen, A.V. Multi-topic misinformation blocking with budget constraint on online social networks. IEEE Access 2020, 8, 78879–78889. [Google Scholar] [CrossRef]
- Chen, Q.; Srivastava, G.; Parizi, R.M.; Aloqaily, M.; Al Ridhawi, I. An incentive-aware blockchain-based solution for internet of fake media things. Inf. Process. Manag. 2020, 57, 102370. [Google Scholar] [CrossRef]
- Spezzano, F. Modeling Misinformation Diffusion in Social Media: Beyond Network Properties. In Proceedings of the 2021 IEEE Third International Conference on Cognitive Machine Intelligence (CogMI), Atlanta, GA, USA, 13–15 December 2021; pp. 168–171. [Google Scholar] [CrossRef]
- Valecha, R.; Volety, T.; Rao, H.R.; Kwon, K.H. Misinformation Sharing on Twitter During Zika: An Investigation of the Effect of Threat and Distance. IEEE Internet Comput. 2021, 25, 31–39. [Google Scholar] [CrossRef]
- Ahvanooey, M.T.; Zhu, M.X.; Mazurczyk, W.; Choo, K.K.R.; Conti, M.; Zhang, J. Misinformation Detection on Social Media: Challenges and the Road Ahead. IT Prof. 2022, 24, 34–40. [Google Scholar] [CrossRef]
- Abiola, O.; Abayomi-Alli, A.; Tale, O.A.; Misra, S.; Abayomi-Alli, O. Sentiment analysis of COVID-19 tweets from selected hashtags in Nigeria using VADER and Text Blob analyser. J. Electr. Syst. Inf. Technol. 2023, 10, 5. [Google Scholar] [CrossRef]
- Zhao, Y.; Da, J.; Yan, J. Detecting health misinformation in online health communities: Incorporating behavioral features into machine learning based approaches. Inf. Process. Manag. 2021, 58, 102390. [Google Scholar] [CrossRef]
- Du, J.; Preston, S.; Sun, H.; Shegog, R.; Cunningham, R.; Boom, J.; Savas, L.; Amith, M.; Tao, C. Using machine learning–based approaches for the detection and classification of human papillomavirus vaccine misinformation: Infodemiology study of reddit discussions. J. Med Internet Res. 2021, 23, e26478. [Google Scholar] [CrossRef] [PubMed]
- Safarnejad, L.; Xu, Q.; Ge, Y.; Krishnan, S.; Bagarvathi, A.; Chen, S. Contrasting misinformation and real-information dissemination network structures on social media during a health emergency. Am. J. Public Health 2020, 110, S340–S347. [Google Scholar] [CrossRef]
- Pham, D.V.; Duong, H.V.; Pham, C.V.; Bao, B.Q.; Nguyen, A.V. Multiple Topics Misinformation blocking in Online Social Networks. In Proceedings of the 2019 11th International Conference on Knowledge and Systems Engineering (KSE), Da Nang, Vietnam, 24–26 October 2019; pp. 1–6. [Google Scholar] [CrossRef]
- Pierri, F.; Perry, B.; DeVerna, M.R.; Yang, K.; Flammini, A.; Menczer, F.; Bryden, J. The impact of online misinformation on US COVID-19 vaccinations. Sci. Rep. 2021, 12, 5966. [Google Scholar] [CrossRef]
- Duzen, Z.; Riveni, M.; Aktas, M.S. Misinformation Detection in Social Networks: A Systematic Literature Review. In Proceedings of the 22nd International Conference on Computational Science and Its Applications, Malaga, Spain, 4–7 July 2022; pp. 57–74. [Google Scholar] [CrossRef]
- Pierri, F.; DeVerna, M.R.; Yang, K.C.; Axelrod, D.; Bryden, J.; Menczer, F. One Year of COVID-19 Vaccine Misinformation on Twitter: Longitudinal Study. J. Med. Internet Res. 2023, 25, e42227. [Google Scholar] [CrossRef]
- Vogel, I.; Meghana, M. Detecting Fake News Spreaders on Twitter from a Multilingual Perspective. In Proceedings of the 2020 IEEE 7th International Conference on Data Science and Advanced Analytics (DSAA), Sydney, Australia, 6–9 October 2020; pp. 599–606. [Google Scholar] [CrossRef]
- Hu, X.; Zhu, T.; Zhai, X.; Zhou, W.; Zhao, W. Privacy Data Propagation and Preservation in Social Media: A Real-world Case Study. IEEE Trans. Knowl. Data Eng. 2021, 35, 4137–4150. [Google Scholar] [CrossRef]
- Kumari, A.; Behera, R.K.; Sahoo, K.S.; Nayyar, A.; Kumar Luhach, A.; Prakash Sahoo, S. Supervised link prediction using structured-based feature extraction in social network. Concurr. Comput. Pract. Exp. 2022, 34, e5839. [Google Scholar] [CrossRef]
- Prasad, R.; Udeme, A.U.; Misra, S.; Bisallah, H. Identification and classification of transportation disaster tweets using improved bidirectional encoder representations from transformers. Int. J. Inf. Manag. Data Insights 2023, 3, 100154. [Google Scholar] [CrossRef]
- Olaleye, T.; Abayomi-Alli, A.; Adesemowo, K.; Arogundade, O.T.; Misra, S.; Kose, U. SCLAVOEM: Hyper parameter optimization approach to predictive modelling of COVID-19 infodemic tweets using smote and classifier vote ensemble. Soft Comput. 2023, 27, 3531–3550. [Google Scholar] [CrossRef]
- Baeth, M.J.; Aktas, M.S. Detecting Misinformation in Social Networks Using Provenance Data. Concurr. Comput. Pract. Exp. 2019, 31, e4793. [Google Scholar] [CrossRef]
- Vishwakarma, D.K.; Varshney, D.; Yadav, A. Detection and veracity analysis of fake news via scrapping and authenticating the web search. Cogn. Syst. Res. 2019, 58, 217–229. [Google Scholar] [CrossRef]
- Kinsora, A.; Barron, K.; Mei, Q.; Vydiswaran, V.V. Creating a labeled dataset for medical misinformation in health forums. In Proceedings of the 2017 IEEE International Conference on Healthcare Informatics (ICHI), Park City, UT, USA, 23–26 August 2017; pp. 456–461. [Google Scholar]
- Cui, L.; Lee, D. CoAID: COVID-19 Healthcare Misinformation Dataset. arXiv 2020, arXiv:2006.00885. [Google Scholar] [CrossRef]
- Su, Q.; Wan, M.; Liu, X.; Huang, C.R. Motivations, methods and metrics of misinformation detection: An NLP perspective. Nat. Lang. Process. Res. 2020, 1, 1–13. [Google Scholar] [CrossRef]
- Zhou, X.; Mulay, A.; Ferrara, E.; Zafarani, R. ReCOVery: A Multimodal Repository for COVID-19 News Credibility Research. In Proceedings of the Proceedings of the 29th ACM International Conference on Information Knowledge Management, Virtual, 19–23 October 2020; pp. 3205–3212. [Google Scholar] [CrossRef]
- Chen, E.; Lerman, K.; Ferrara, E. Tracking Social Media Discourse About the COVID-19 Pandemic: Development of a Public Coronavirus Twitter Data Set. JMIR Public Health Surveill 2020, 6, e19273. [Google Scholar] [CrossRef] [PubMed]
- Abdul-Mageed, M.; Elmadany, A.; Nagoudi, E.M.B.; Pabbi, D.; Verma, K.; Lin, R. Mega-COV: A Billion-Scale Dataset of 100+ Languages for COVID-19. In Proceedings of the 16th Conference of the European Chapter of the Association for Computational Linguistics: Main Volume, Online, 19–23 April 2021; pp. 3402–3420. [Google Scholar] [CrossRef]
- Banda, J.M.; Tekumalla, R.; Wang, G.; Yu, J.; Liu, T.; Ding, Y.; Artemova, E.; Tutubalina, E.; Chowell, G. A Large-Scale COVID-19 Twitter Chatter Dataset for Open Scientific Research—An International Collaboration. Epidemiologia 2021, 2, 315–324. [Google Scholar] [CrossRef]
- Cox, R.A.V.; Kumar, S.; Babcock, M.; Carley, K.M. Stance in Replies and Quotes (SRQ): A New Dataset For Learning Stance in Twitter Conversations. arXiv 2020, arXiv:2006.00691. [Google Scholar] [CrossRef]
- Qazi, U.; Imran, M.; Ofli, F. GeoCoV19: A Dataset of Hundreds of Millions of Multilingual COVID-19 Tweets with Location Information. SIGSPATIAL Spec. 2020, 12, 6–15. [Google Scholar] [CrossRef]
- Shahi, G.K.; Nandini, D. FakeCovid—A Multilingual Cross-domain Fact Check News Dataset for COVID-19. arXiv 2020, arXiv:2006.11343. [Google Scholar] [CrossRef]
- Rostami, M.; Oussalah, M.; Berahmand, K.; Farrahi, V. Community Detection Algorithms in Healthcare Applications: A Systematic Review. IEEE Access 2023, 11, 30247–30272. [Google Scholar] [CrossRef]
- Berahmand, K.; Li, Y.; Xu, Y. DAC-HPP: Deep attributed clustering with high-order proximity preserve. In Neural Computing and Applications; Springer: Berlin/Heidelberg, Germany, 2023; pp. 1–19. [Google Scholar]
- Kazienko, P. Process of Social Network Analysis. In Encyclopedia of Social Network Analysis and Mining; Springer: New York, NY, USA, 2018; pp. 1927–1942. [Google Scholar] [CrossRef]
- Bonchi, F.; Castillo, C.; Gionis, A.; Jaimes, A. Social Network Analysis and Mining for Business Applications. ACM Trans. Intell. Syst. Technol. 2011, 2, 22. [Google Scholar] [CrossRef]
- Sites, I.M. Unreliable Sources. Available online: https://iffy.news/iffy-plus/ (accessed on 1 October 2022).
- OSoMe. Dataset for Paper: The COVID-19 Infodemic: Twitter versus Facebook. 2020. Available online: https://zenodo.org/records/4313903 (accessed on 1 October 2022).
- Jackson, M.O. Genetic influences on social network characteristics. Proc. Natl. Acad. Sci. USA 2009, 106, 1687–1688. [Google Scholar] [CrossRef] [PubMed]
- Grando, F.; Noble, D.; Lamb, L.C. An Analysis of Centrality Measures for Complex and Social Networks. In Proceedings of the 2016 IEEE Global Communications Conference (GLOBECOM), Washington, DC, USA, 4–8 December 2016; pp. 1–6. [Google Scholar] [CrossRef]
- Fronzetti Colladon, A.; Naldi, M. Distinctiveness centrality in social networks. PLoS ONE 2020, 15, e0233276. [Google Scholar] [CrossRef] [PubMed]
- Newman, M. Networks; Oxford University Press: Oxford, UK, 2018. [Google Scholar] [CrossRef]
- Das, K.; Samanta, S.; Pal, M. Study on centrality measures in social networks: A survey. Soc. Netw. Anal. Min. 2018, 8, 13. [Google Scholar] [CrossRef]
- Robins, G.; Pattison, P.; Wang, P. Closure, connectivity and degree distributions: Exponential random graph (p*) models for directed social networks. Soc. Netw. 2009, 31, 105–117. [Google Scholar] [CrossRef]
- DeVerna, M.R.; Pierri, F.; Truong, B.T.; Bollenbacher, J.; Axelrod, D.; Loynes, N.; Torres-Lugo, C.; Yang, K.C.; Menczer, F.; Bryden, J. CoVaxxy: A Collection of English-Language Twitter Posts About COVID-19 Vaccines. Proc. Int. AAAI Conf. Web Soc. Media 2021, 15, 992–999. [Google Scholar] [CrossRef]
- Covaxxy. CoVaxxy Dashboard. Available online: https://osome.iu.edu/tools/covaxxy (accessed on 1 October 2022).
- Twitter-API. Tweets Endpoint. Available online: https://api.twitter.com/2/tweets (accessed on 1 October 2022).
- Sathiyakumari, K.; Vijaya, M. Community detection based on girvan newman algorithm and link analysis of social media. In Proceedings of the Digital Connectivity–Social Impact: 51st Annual Convention of the Computer Society of India, CSI 2016, Coimbatore, India, 8–9 December 2016; Proceedings 51. Springer: Berlin/Heidelberg, Germany, 2016; pp. 223–234. [Google Scholar]
- Duzen, Z. Covaxxy-Data-Mining. 2023. Available online: https://github.com/duzenz/covaxxy-data-mining (accessed on 9 May 2023).
Figure 1.
Proposed architecture modules for data collection, preprocessing, network creation, centrality calculation, community detection, and misinformation detection.
Figure 1.
Proposed architecture modules for data collection, preprocessing, network creation, centrality calculation, community detection, and misinformation detection.

Figure 2.
Column names for preprocessing phase.

Figure 3.
(a) The most used words in the tweet collection. The x-axis shows the number of tweets, while the y-axis shows the density of words in the collection. (b) The distribution of tweet credibility levels based on their count. The x-axis shows the number of tweets, while the y-axis shows whether tweeting is marked as misinformation or not.

Figure 4.
This figure displays the number of nodes and edges in the retweet network (a), mention network (b) and reply network (c) at 11 January 2021, providing insights into the size and structure of the network.
Figure 4.
This figure displays the number of nodes and edges in the retweet network (a), mention network (b) and reply network (c) at 11 January 2021, providing insights into the size and structure of the network.

Figure 5.
Visual representations of the retweet (a), mention (b), and reply (c) networks generated using the Gephi and NetworkX applications. The figure presents visualizations of the retweet, mention, reply networks, and their colored communities, created at 11 January 2021.
Figure 5.
Visual representations of the retweet (a), mention (b), and reply (c) networks generated using the Gephi and NetworkX applications. The figure presents visualizations of the retweet, mention, reply networks, and their colored communities, created at 11 January 2021.

Figure 6.
This graph consists of three sub-figures: (a) Retweet communities graph, (b) Mention communities graph, and (c) Reply communities graph. Each sub-figure represents the communities identified by Community Detection module with Girvan-Newman algorithm within the respective network. The communities are color-coded, each color is colored according to the community it belongs to, allowing for visual differentiation and analysis of the different communities present within each network.

Figure 7.
This figure showcases a screenshot of the GUI of the proposed framework, providing a glimpse of the various features and functionalities available, including network visualizations, centrality metrics, community structures, and the results of the misinformation detection module.
Figure 7.
This figure showcases a screenshot of the GUI of the proposed framework, providing a glimpse of the various features and functionalities available, including network visualizations, centrality metrics, community structures, and the results of the misinformation detection module.

Figure 8.
This figure showcases a screenshot of the obtained report from the misinformation detection module. (Tweet identifier is intentionally blurred to protect user privacy.)
Figure 8.
This figure showcases a screenshot of the obtained report from the misinformation detection module. (Tweet identifier is intentionally blurred to protect user privacy.)


Table 1.
Comparative analysis of misinformation detection in the healthcare domain.
| Data Source | Features Used | Detection Techniques | Strengths | Weaknesses |
|---|---|---|---|---|
| Social Media [2,20,29] | Text analysis | NLP, Machine Learning | High accuracy, Real-time monitoring | Limited to online data, Subject to bias |
| Web Scraping [9,32] | Text and Metadata | Rule-based, Semantic Analysis | Broad data sources, Low false positives | Limited to publicly available data, Scalability issues |
| Healthcare Forums [19,33] | Text analysis | Topic modeling, User profiling | Domain-specific, User engagement | Limited to specific platforms, May not detect emerging trends |
| News Articles [34,35] | Text analysis | NLP, Fact-checking | Reliable sources, Well-established | May miss information from less-known sources, Delayed updates |
| Twitter Data [16,36] | Text analysis and Network Analysis | Graph-based algorithms | Real-time insights, Identify influential users | Limited to Twitter data, May require substantial computing resources |
Table 2.
Search keywords used to collect tweets on COVID-19 vaccinations.
| vaccine | vaccination | vaccinate | pfizer | sputnikv |
| pfizervaccine | gavi | corona pfizer | modernavaccine | cepi |
| covid moderna | covax | corona moderna | moderna | biontechvaccine |
| covidiots | vax | vaxx | getvaccinated | mrna |
| glyphosate | coronavaccine | covidvaccine | nvic | oxfordvaccine |
| pharmagreed | azvaccine | astrazeneca | kungflu | pandemic |
| plandemic | mybody | eugenics | greatreset | willnotcomply |
Table 3.
Fields used for tweet collection. For each successful tweet download, these values are persisted and processed.
Table 3.
Fields used for tweet collection. For each successful tweet download, these values are persisted and processed.
| Field Key | Field Value |
|---|---|
| tweet.fields | author_id, created_at, conversation_id, in_reply_to_user_id, lang, possibly_sensitive, source, text, referenced_tweets |
| expansions | author_id, entities.mentions.username, in_reply_to_user_id, referenced_tweets.id, referenced_tweets.id.author_id |
| user.fields | public_metrics, created_at, id, verified, name, pinned_tweet_id, username, url, description |
Table 4.
Structure of a downloaded tweet collection. This table shows the structure of the JSON file kept for every 100 tweets downloaded.
Table 4.
Structure of a downloaded tweet collection. This table shows the structure of the JSON file kept for every 100 tweets downloaded.
| Field Name | Description |
|---|---|
| response.data | Holds successfully downloaded tweet metadata and information |
| response.errors | Holds the information of tweets which could not be downloaded |
| response.includes | Holds extra information about tweets (e.g., author, timestamp) |
Disclaimer/Publisher’s Note: The statements, opinions and data contained in all publications are solely those of the individual author(s) and contributor(s) and not of MDPI and/or the editor(s). MDPI and/or the editor(s) disclaim responsibility for any injury to people or property resulting from any ideas, methods, instructions or products referred to in the content. |
© 2023 by the authors. Licensee MDPI, Basel, Switzerland. This article is an open access article distributed under the terms and conditions of the Creative Commons Attribution (CC BY) license (https://creativecommons.org/licenses/by/4.0/).
Share and Cite
MDPI and ACS Style
Duzen, Z.; Riveni, M.; Aktas, M.S. Analyzing the Spread of Misinformation on Social Networks: A Process and Software Architecture for Detection and Analysis. Computers 2023, 12, 232. https://doi.org/10.3390/computers12110232
AMA Style
Duzen Z, Riveni M, Aktas MS. Analyzing the Spread of Misinformation on Social Networks: A Process and Software Architecture for Detection and Analysis. Computers. 2023; 12(11):232. https://doi.org/10.3390/computers12110232
Chicago/Turabian StyleDuzen, Zafer, Mirela Riveni, and Mehmet S. Aktas. 2023. "Analyzing the Spread of Misinformation on Social Networks: A Process and Software Architecture for Detection and Analysis" Computers 12, no. 11: 232. https://doi.org/10.3390/computers12110232
Note that from the first issue of 2016, this journal uses article numbers instead of page numbers. See further details here.