

Novel Deep Feature Fusion Framework for Multi-Scenario Violence Detection
by
 ,
,
Sabah Abdulazeez Jebur
1,2,
Khalid A. Hussein
3 ,
,
Haider Kadhim Hoomod
3 and
Laith Alzubaidi
4,5,* 1
Department of Computer Sciences, University of Technology, Baghdad 00964, Iraq
2
Department of Computer Techniques Engineering, Imam Al-Kadhum College (IKC), Baghdad 00964, Iraq
3
Department of Computer Science, College of Education, Mustansiriyah University, Baghdad 00964, Iraq
4
School of Mechanical, Medical and Process Engineering, Queensland University of Technology, Brisbane, QLD 4000, Australia
5
Centre for Data Science, Queensland University of Technology, Brisbane, QLD 4000, Australia
*
Author to whom correspondence should be addressed.
Computers 2023, 12(9), 175; https://doi.org/10.3390/computers12090175
Submission received: 8 August 2023
/
Revised: 26 August 2023
/
Accepted: 31 August 2023
/
Published: 5 September 2023
(This article belongs to the Special Issue Uncertainty-Aware Artificial Intelligence)
Abstract
:Detecting violence in various scenarios is a difficult task that requires a high degree of generalisation. This includes fights in different environments such as schools, streets, and football stadiums. However, most current research on violence detection focuses on a single scenario, limiting its ability to generalise across multiple scenarios. To tackle this issue, this paper offers a new multi-scenario violence detection framework that operates in two environments: fighting in various locations and rugby stadiums. This framework has three main steps. Firstly, it uses transfer learning by employing three pre-trained models from the ImageNet dataset: Xception, Inception, and InceptionResNet. This approach enhances generalisation and prevents overfitting, as these models have already learned valuable features from a large and diverse dataset. Secondly, the framework combines features extracted from the three models through feature fusion, which improves feature representation and enhances performance. Lastly, the concatenation step combines the features of the first violence scenario with the second scenario to train a machine learning classifier, enabling the classifier to generalise across both scenarios. This concatenation framework is highly flexible, as it can incorporate multiple violence scenarios without requiring training from scratch with additional scenarios. The Fusion model, which incorporates feature fusion from multiple models, obtained an accuracy of 97.66% on the RLVS dataset and 92.89% on the Hockey dataset. The Concatenation model accomplished an accuracy of 97.64% on the RLVS and 92.41% on the Hockey datasets with just a single classifier. This is the first framework that allows for the classification of multiple violent scenarios within a single classifier. Furthermore, this framework is not limited to violence detection and can be adapted to different tasks.
1. Introduction
Surveillance cameras are widely employed in supermarkets, gas stations, streets, roads, cafes, and similar areas. They are commonly used to monitor suspicious activities, known explicitly as anomaly behaviours. These behaviours cover a wide range of actions, such as attacks, harassment, fights, robberies, and vandalism. Anomaly behaviour refers to actions that deviate from the usual norms within a given context. Regarding computer vision (CV), anomalies are identified via data patterns showing significant deviations from normal data [1]. Regrettably, significant amounts of time and money are dedicated to monitor and detect these activities without the support of automated systems [2]. This scenario emphasises the growing necessity for automated systems to comprehend and evaluate these actions. Machine learning (ML) techniques are crucial in providing efficient solutions for detecting anomaly behaviour, specifically for violence detection in video surveillance. Implementing these methods can significantly mitigate the risk of social violence [3,4,5,6,7,8,9,10,11]. ML algorithms usually rely on dependable features to accurately represent input data and classify output outcomes [12]. The precision of behaviour recognition is directly linked to the quality of the chosen features. Utilising empirically based feature extraction methods may lead to a decrease in classification accuracy. Deep learning (DL) employs neural network (NN) models to detect and capture characteristics from input data, eliminating the need for a distinct feature extraction stage. DL excels at efficiently classifying vast amounts of data and incorporating intricate features [13]. DL has a significant benefit in not requiring any preprocessing to obtain feature descriptions. The neural network can automatically determine numerous unknown parameters through the training process. While the training may be time-consuming, the outcome can be highly gratifying [14]. Convolution neural networks (CNNs) are powerful DL algorithms that can extract meaningful features from video frames and learn to classify them based on their content. Violence detection in videos involves identifying violent actions and events, which can be carried out by training a CNN on a labelled video dataset [6]. Training convolutional neural networks (CNNs) to achieve good performance requires vast data. However, the high data requirement poses a significant challenge. To address this issue, the idea of transfer learning (TL) has been widely accepted by researchers as a potential solution [15,16,17,18,19,20]. TL is a process where a pre-trained CNN model is employed for a new task [21]. The model is trained on a specific dataset and it learns features for a particular task. The model is then fine-tuned for the new task, even in a different domain. The potency of this concept has led to its widespread adoption in various image classification and action recognition tasks. Several studies have employed deep TL models for the automatic detection of violent scenes in videos, such as VGG16 [22], GoogleNet [19], InceptionV3 [17], and MobileNet [8]. However, existing methods employed in video anomaly detection frequently encounter challenges associated with generalisation, which pertains to a model’s capability to perform effectively on unseen data. The flexible integration of multiple models into a cohesive framework poses a common hurdle in this field. Moreover, the scalability of video anomaly detection becomes increasingly critical as datasets expand in size and complexity. Incorporating new datasets without requiring extensive retraining from the ground up is vital [23]. Furthermore, achieving accurate and discriminative feature representation remains a significant challenge in video anomaly detection. These aforementioned challenges have been specifically targeted and addressed by introducing novel approaches in this paper. DL has long been regarded as a complex and opaque process, often referred to as a “black box”. Unfortunately, a significant portion of the existing literature has failed to incorporate virtualisation techniques to elucidate the decision-making mechanisms employed by DL systems. Consequently, this lack of transparency can undermine trust in these systems’ final decisions [24]. In light of this concern, the present study employs the Grad-CAM method to address these limitations and provide a more comprehensive understanding of how DL arrives at its decisions. The primary contributions of this paper are outlined as follows:
- A novel generalisation framework, the Concatenation model, has been proposed to address the generalisation problem in video violence detection. This approach offers flexibility in incorporating new datasets without requiring training for new tasks;
- An interior deep feature fusion approach, the Fusion model, has been adopted to enhance feature representation by integrating multiple DL models;
- Three pre-trained models from ImageNet have been utilised in this paper, leveraging TL to tackle data scarcity and improve feature representation and reduce the risk of overfitting;
- The Fusion model attained an accuracy of 97.66% on the RLVS and 92.89% accuracy on the Hockey datasets during interior fusion. These results show better performance than the best existing methods;
- The proposed Concatenation model attained 97.64% accuracy on the RLVS and 92.41% on the Hockey datasets with the same classifier. As far as we know, no existing method performed similar work of a single model on multiple tasks in video anomaly detection;
- The results are further validated and explained using the Grad-CAM technique.
2. Related Works
This section thoroughly examines various methodologies employed in video anomaly detection, explicitly emphasising the use of ML and DL techniques. The aim is to explore the significance of computer vision (CV) algorithms in extracting features from input video sequences and highlight the pivotal role of ML techniques and automated DL-based approaches in accurately predicting and identifying anomalies. A TL-based DL model was presented in [20] to identify aggressive human behaviour and detect violent scenes in videos. The model uses the GoogleNet architecture as a source task network and is fine-tuned on the Hockey and Movies datasets with optimised parameters. The authors of [19] presented a three-step violence detection scheme for movies. To identify violent and non-violent shots in a movie, we use a process that involves dividing the movie into segments called shots, choosing a frame that stands out from each shot, and running them through a simple deep learning model customised using TL. Finally, non-violent scenes are combined to generate a violence-free movie that children and violent, paranoid people can watch. The research in [6] proposed a DL architecture for video violence detection using a combination of 2D CNN and RNN and optical flow computed from video sequences. CNN is responsible for extracting spatial features, while RNN extracts temporal features. Additionally, the optical flow encodes scene movements. The proposed approach has been validated on three different databases: Hockey, Violent flow, and RLV datasets. A model called the deep neural network was suggested in [5] for recognising violent actions carried out by a single person, like punching and kicking. The proposed model utilises an ensemble of Mask RCNN, key-point detection, and Long-Term Short Memory (LSTM) techniques to extract masks and vital human points while capturing temporal information from the data. The model utilises different techniques for better performance in detecting violent activities. The paper [22] explored deep TL with SVM for violent video classification. The process involved using VGGNet-16 for feature extraction, followed by SVM for classification using different kernel functions. The results showed that SVM with linear kernel function and VGGNet-16 had the highest accuracy compared to RBF, Polynomial kernel functions, and PCA combined with SVM. The study referenced as [18] focused on modifying an advanced pre-trained violence detection model specifically for detecting violence within a car. A dataset comprising videos inside a car is created specifically for this study. Four public datasets for violence detection are examined, and the model with fewer parameters is selected for faster processing. TL is applied to address In-Car Violence Recognition. The model has been trained on various violence recognition datasets like RLVS, RWF, Hockey fights, and Movies, and its performance has been evaluated on the Car dataset. The research [25] presented three DL-based video violence detection models. The algorithms were tested using the AIRTLab dataset, which is designed to assess their ability to handle false positives. The findings indicated that networks based on TL have superior generalisation levels compared to those trained from scratch. Based on the experiments conducted, it is recommended to keep using TL-based models for violence detection. The models proposed using 3D CNNs have been shown to perform better than the popular 2D CNNs that were pre-trained on ImageNet. A new system for detecting video violence was introduced in a paper titled [10]. The system uses a combination of 2D CNNs, frame grouping, and attention mechanisms for better spatiotemporal representation of learning. The frame grouping technique averages input frames and groups consecutive frames, enabling the 2D CNNs to effectively capture temporal information. Spatial and temporal attention modules are introduced to enhance violence recognition performance. The experimental results show that the suggested method has less computational complexity than other methods based on 3D-CNN. In [7], the authors proposed a framework for detecting and categorising violent events from video streams using supervised learning. To identify violence, the framework employs 3D convolutional neural networks. It uses a pre-trained InceptionV3 model for feature extraction and recurrent gated units for temporal processing to classify the type of violence. The models were trained on multiple datasets, and TL was applied to improve their performance. In a research paper titled [8], CNNs were suggested to detect violent behaviour. Various CNN models such as MobileNet, AlexNet, VGG-16, and GoogleNet were evaluated for their performance in the study. It concludes that the proposed MobileNet model has the highest accuracy, lowest loss, and low computation time in detecting violence in the Hockey fight dataset. In their article, Paper [26] presented a model for detecting crowd violence behaviour using human contour and dynamic characteristics. The model leverages a 3D-CNN framework to extract spatial features and LSTM to combine temporal features. It was tested on RLVS, Hockey, and Violent flow datasets to validate the model. A recent paper [9] introduced a new method for detecting violence in video surveillance footage. The method uses a unique architecture that includes a spatial feature-extracting U-Net-like network with MobileNet V2 as the encoder and LSTM for temporal feature extraction and classification. Despite being computationally efficient and lightweight, the method achieved excellent results. The authors in [17] employed the InceptionV3 network to recognise abnormal human behaviour in video surveillance. The paper evaluated pre-training and fine-tuning TL approaches in feature extraction from the input data. The results showed that the pre-trained and fine-tuned InceptionV3 approaches effectively classify the normal and abnormal behaviours in videos. However, fine-tuning the layers’ weights can improve the model’s performance. The fine-tuned model performed better than the pre-trained model in terms of accuracy, recall, precision, and F1 score. A lightweight DL model for video anomaly detection is proposed in the paper [27]. This framework utilised a keyframe method based on histogram and dynamic thresholding to extract the essential frames from training video clips. Furthermore, it proposed an effective approach called Modified Spatio-Temporal (MST) for motion tracking and interest point extraction. The pre-processed frames estimate motion tracking and create a codebook using Discrete Wavelet Transform (DWT) combined with Principal Component Analysis (PCA). The codebook is then fed into a Recurrent Neural Network (RNN) with an (LSTM) classifier for sequential input and classification. A new real-time model for recognising human violence using DL has been proposed [28]. The model is made up of two modules: a spatial attention module that identifies spatial features and regions of interest using frame difference between consecutive frames and morphological dilation and a temporal attention module that identifies temporal features by averaging the RGB channels to a single channel and inputting three frames into a 2D CNN backbone. The model’s effectiveness was assessed in terms of efficiency, accuracy, and real-time capabilities. The literature discusses various ways to detect abnormal video behaviour using AI algorithms. Despite these advancements, effectively detecting anomalous videos remains a significant research challenge. This is mainly due to existing research gaps, which are detailed below:
- The methods mentioned above have a significant issue with generalisation. They require to be started from scratch when adding new datasets for new tasks, which limits their ability to perform well in various situations. This problem makes anomaly detection systems less practical and efficient. Therefore, new approaches are needed to solve the generalisation problem without extensive retraining.
- The methodologies mentioned in [5,6,7,8,9,17,18,19,20,22,25,26,28] faced a shared challenge concerning the integration of new models into the existing framework. These methods require the existing models to be retrained from scratch, resulting in substantial demands on computational resources and time. This computationally intensive and time-consuming process impedes the efficiency and practicality of incorporating new models, underscoring the need for alternative approaches to alleviate the burden of extensive retraining, while maintaining or improving performance.
- The existing approaches outlined in references [8,17,18,19,20,22] employed a single model for feature extraction, thereby overlooking the opportunity to achieve an enhanced feature representation. This limitation arises due to the varying strengths exhibited by different models in capturing specific features or patterns within the data. By amalgamating the capabilities of multiple models, we can establish a more inclusive and diverse feature representation capable of encompassing a broader spectrum of patterns and relationships in the data. Additionally, integrating multiple models mitigates the risk of overfitting and enhances the overall generalisation capacity of the model.
3. Materials and Methods
3.1. Datasets
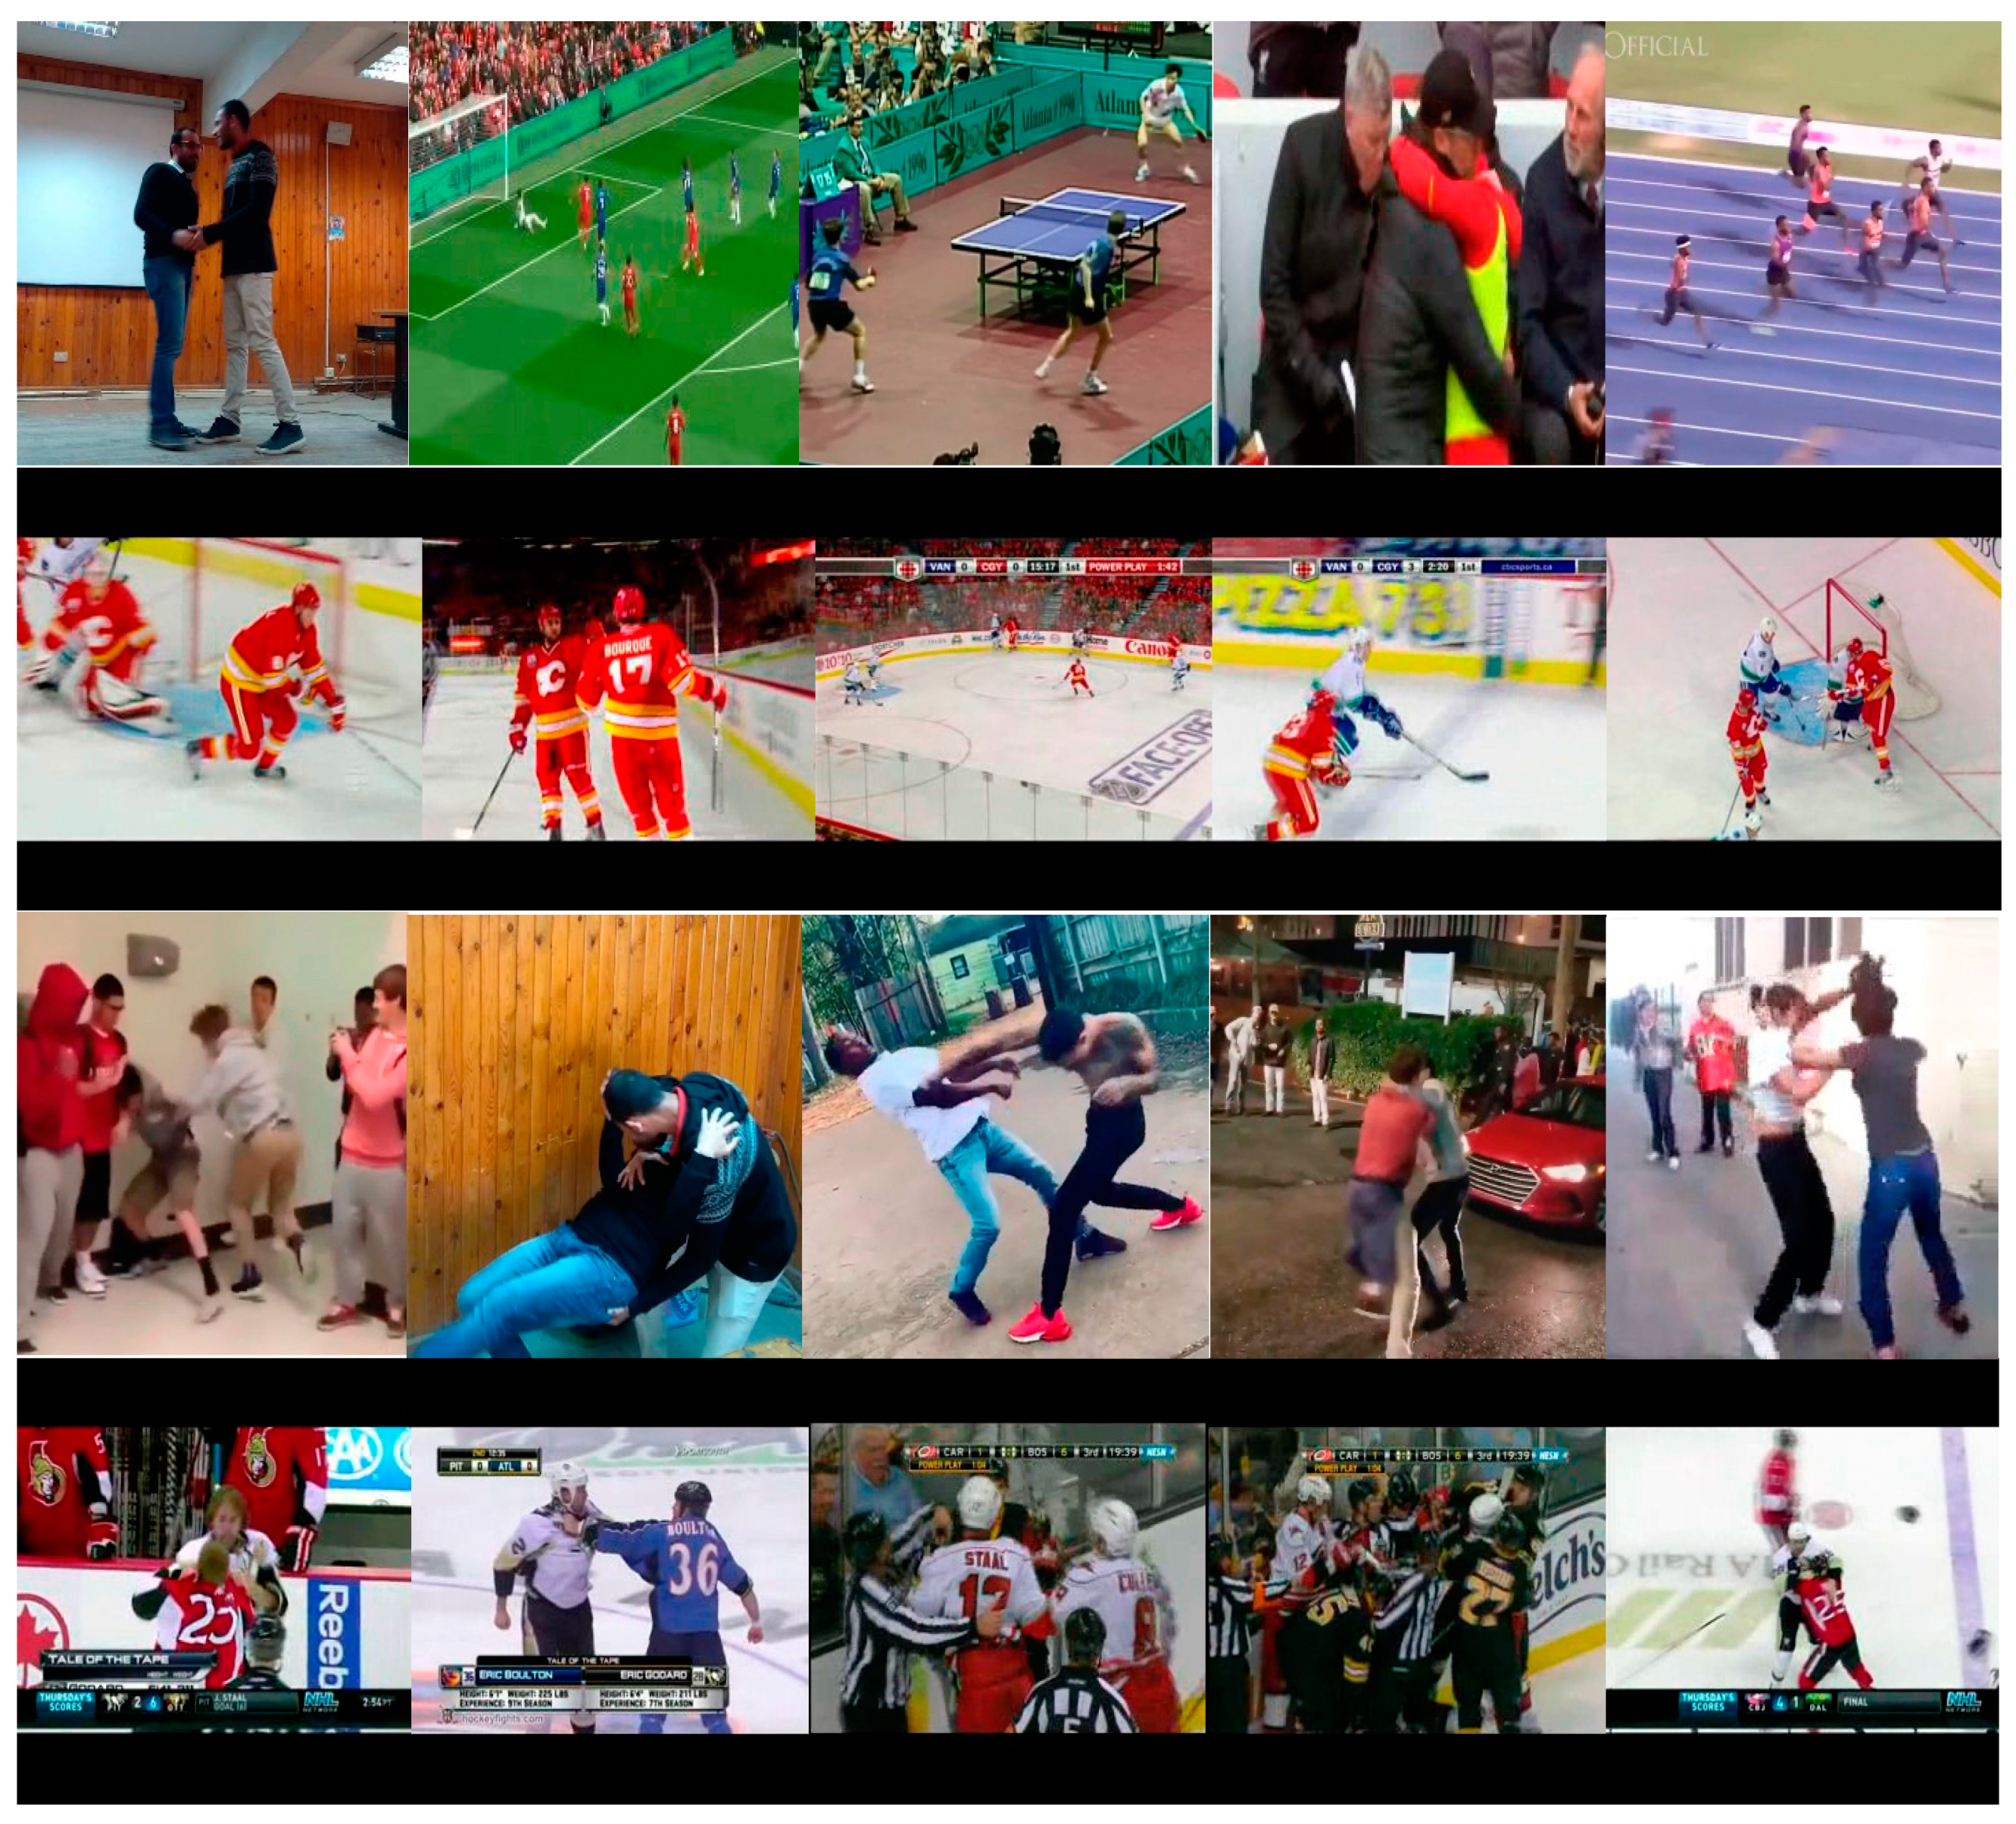
Two benchmark violence datasets have been used: the Real-Life Violence Situations (RLVS) and the Hockey datasets. The RLVS dataset [29] contains 2000 videos, equally split into violent and non-violent activities. The videos depicting violence feature physical confrontations in diverse environments, including streets, prisons, and schools, and the dataset is characterised by its diversity in terms of gender, race, and age. The videos have a high resolution ranging from 480 p to 720 p, and from 3 to 7 s. On the other hand, the Hockey dataset [30] comprises 1000 video clips, each of size 360 × 288, and labelled into 500 instances of violent and 500 instances of non-violent events. The videos were collected from actual hockey games played by the National Hockey League (NHL) to capture real-life violent events, and they typically last one to two s, exhibiting a frame rate of 25 frames per second. Sample snippets from both RLVS and Hockey datasets are shown in Figure 1. The conducted experiments split both datasets into 80% for training and 20% for testing. In the RLVS dataset, the violence class was partitioned into 719 video clips for training and 175 for testing. In contrast, the non-violence class was split into 800 videos for training and 200 videos for testing. During the frame extraction process, a frame interval of 10 was set, resulting in six frames extracted per second of the video clip. All frames from each clip were used as input to the proposed models for the Hockey dataset. The violence class was partitioned into 397 video clips for training and 103 video clips for testing, while the non-violence class was divided into 399 videos for training and 101 videos for testing. The data in the RLVS and Hockey datasets were split to establish a balanced dataset, as the video clips have varying durations and, therefore, different numbers of frames. Table 1 details the data division followed in this work for both RLVS and Hockey datasets. It is worth mentioning that some frames in violent videos may not depict the violent action and can be more similar to frames from a normal video. These frames and blank and noisy frames were manually removed during the data cleaning process to improve the overall quality and relevance of the data utilised for training.
3.2. State-of-the-Art Architectures
Detecting anomalous behaviours has become more effective with the use of DL algorithms, which are capable of handling large amounts of data and powerful processing capabilities. These techniques can efficiently manage all stages of the modelling process, including data preparation, architecture design, hyperparameter tuning, and architecture parameter selection and updating. In this study, we used recent CNN models, namely InceptionV3, Inception-ResNetV2, and Xception, in addressing the problem at hand. These models possess several notable advantages, including their excellent performance on the ImageNet dataset, well-designed structures for feature extraction, and the ability to obtain both small and large features due to their varying filter size range of 1 × 1 to 7 × 7. These models also rectified linear units and residual connections, improved the feature representation quality and addressed the gradient vanishing problem. Additionally, they use dropout layers and global average pooling (GAP) to reduce the risk of overfitting. Furthermore, including Batch Normalization layers speeds up the training procedure, resulting in a more effective and efficient method of anomaly detection in videos. In the following paragraphs, we will briefly describe the advanced models utilised in this study.
3.2.1. InceptionV3 Model
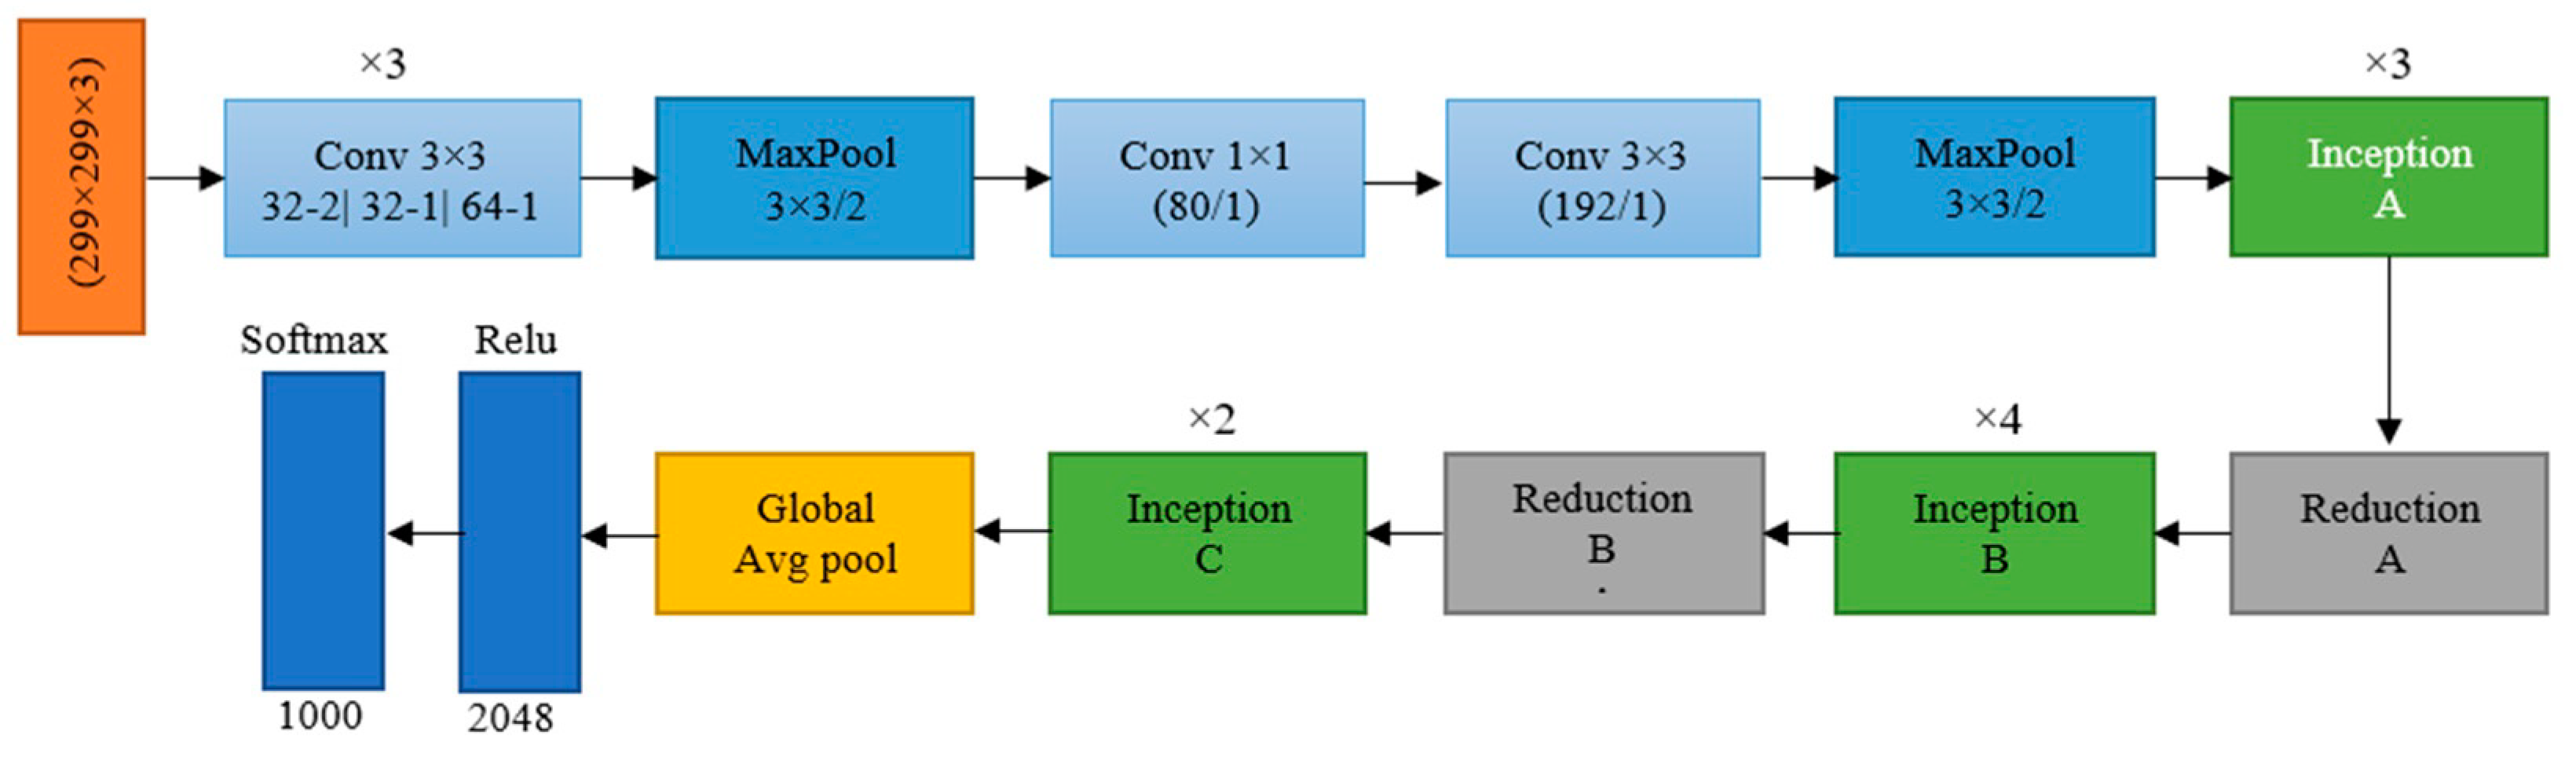
The InceptionV3 is a complex deep CNN architecture that extracts features at different scales [31]. This architecture comprises three main building elements: the stem, Inception blocks, and final layers. The stem block decreases the input’s spatial resolution and computational complexity in the following layers. Inception blocks focus on deepening the network and comprise convolutional layers and Inception modules. The convolutional layers deepen the network, while the Inception modules allow for learning features at various scales. The final layers minimise the spatial resolution of the feature maps and produce the final result, which typically includes a GAP layer and several convolutional layers. A fully connected layer generates the final classification by passing the output from the last layers. The InceptionV3 model’s architecture is displayed in Figure 2.
3.2.2. InceptionResNetV2 Model
The InceptionResNetV2 is a modification of the Inception framework that incorporates residual connections [32]. This design combines the Inception module with the ResNet approach by using residual connections, which allows the network to learn more complex representations more quickly. The Inception module comprises multiple branches that uses different convolutional filters to learn features at various scales. The architecture also employs factorisation, which makes it more efficient and compact than traditional Inception designs. The network comprises two modules: the stem and InceptionResNet blocks. The InceptionResNet blocks increase the network’s depth, while the stem decreases the input’s spatial resolution. For more information, refer to Figure 3.
3.2.3. Xception Model
The Xception network uses a more efficient type of convolution called depthwise separable convolution. This splits the convolution process into two stages: a depthwise convolution that applies one filter to each input channel and a pointwise convolution that combines the result of the depthwise convolution [33]. This helps to speed up processing and minimize the number of parameters in the network. The architecture includes fully linked layers, a GAP layer, and an optional dropout layer to reduce the feature map’s spatial dimensions and prevent overfitting [34]. The Xception model’s architecture is shown in Figure 4.
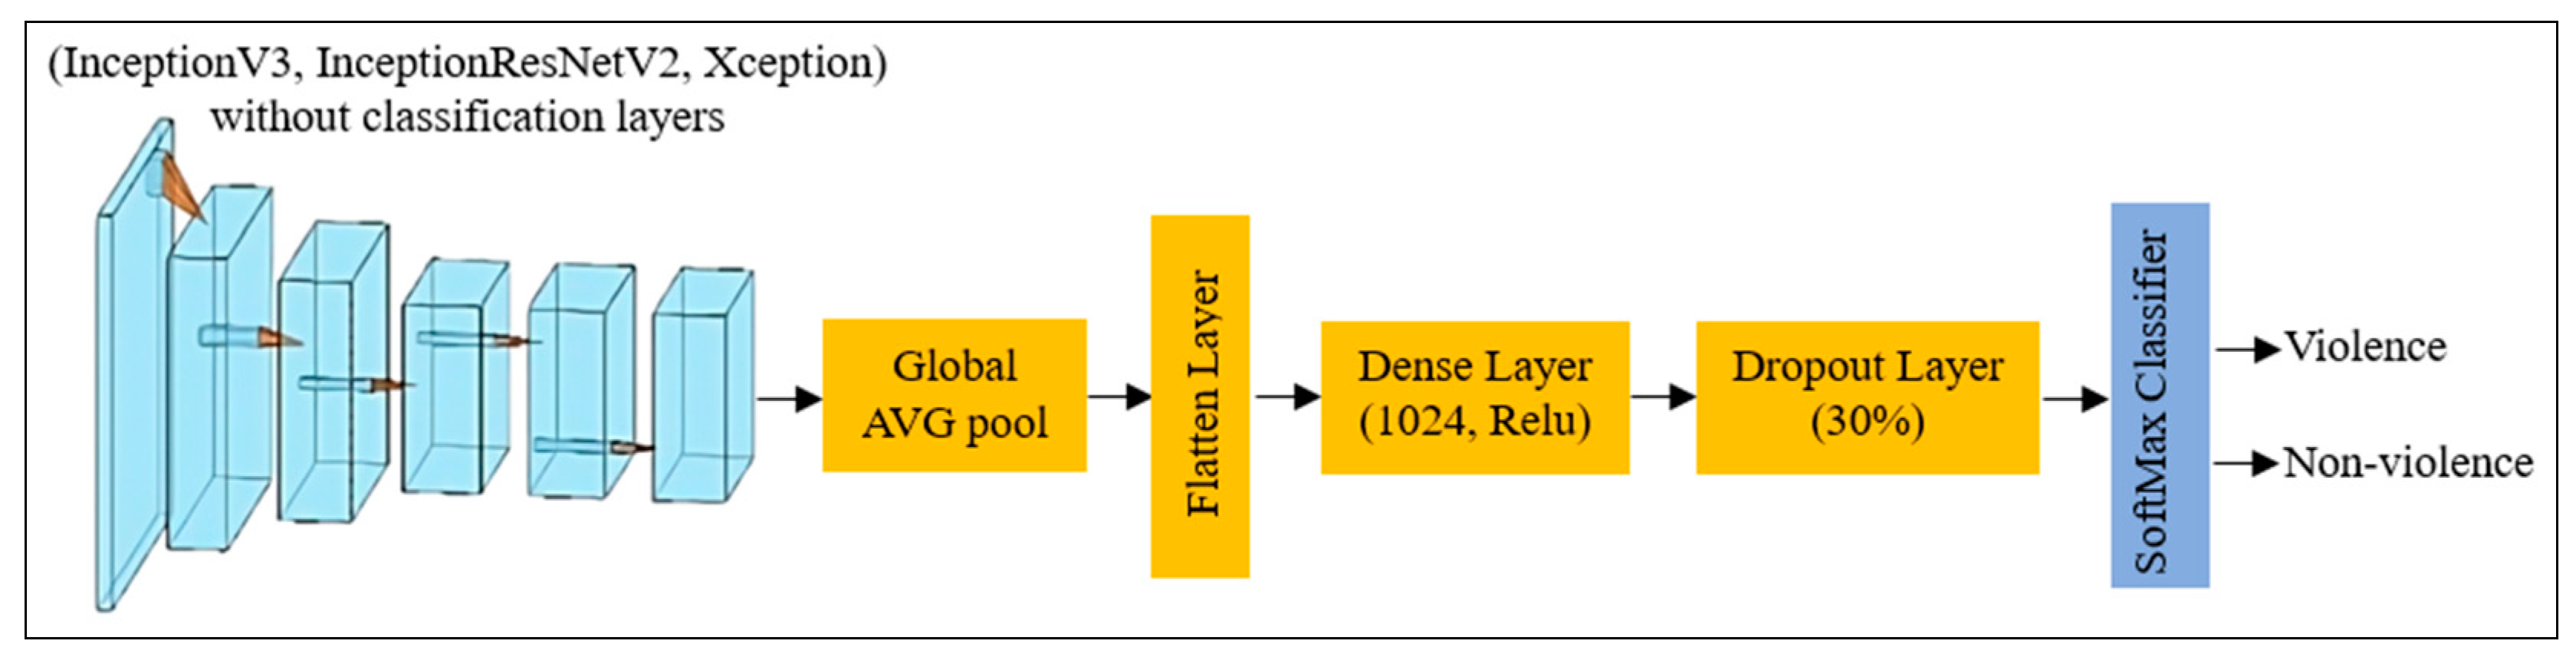
In order to tailor the pre-trained CNN models to effectively address the specific problem at hand, the fully connected layers are omitted to allow for the integration of custom layers designed for two-class classification. This adjustment provides an opportunity to tailor the models to the specific task at hand, enhancing their performance in distinguishing between the two classes. Figure 5 presents a schematic diagram illustrating the pre-trained models with the inclusion of the additional classification layers. The additional layers include the following:
- The global average pooling (GAP) layer, which reduces the dimensions of the feature maps and produces a fixed-length feature vector by computing the average value of each feature map;
- Flatten layer, which transforms the multi-dimensional feature maps into a one-dimensional representation, facilitating subsequent processing;
- The dense (fully connected) layer, which aims to capture intricate patterns and establish complex relationships within the feature vector. This layer allows for comprehensive feature representation through its connectivity to every element of the preceding layer;
- The dropout layer, which aims to deactivate neurons during training to prevent overfitting. Doing so encourages the model to learn more robust and generalisable features;
- The SoftMax layer, which aims to assign class probabilities for the two types of human behaviour: violence and normal behaviour. The Softmax activation function computes the probability distribution, ensuring that the predicted probabilities sum up to 1.
3.3. Proposed Solutions
In this study, we propose two novel approaches, namely the Fusion and Concatenation models, to address essential issues in video anomaly detection tasks, such as flexibility, feature representation, stability, and generalisation. These approaches aim to improve the model’s ability to perform accurately on unseen data. Anomaly detection in videos is challenging as it involves identifying events or behaviours that significantly deviate from normal patterns. Therefore, the proposed solutions aim to enhance the performance of video anomaly detection by fusing multiple CNN models. The subsequent subsections present the architectures of the Fusion model and Concatenation model.
3.3.1. The Architecture of the Proposed Fusion Model
The fusion model comprises three modules: a cooperative CNN module, a feature fusion module, and a feature classification module. In Figure 6, you can see a diagram of the Fusion model. To begin with, the cooperative CNN module extracts feature related to violent behaviour using three pre-trained CNN models: InceptionV3, InceptionResNetV2, and Xception. These models were trained on the ImageNet dataset and then fine-tuned to extract features from video frames using TL. Next, the feature fusion module combines these extracted features from the cooperative CNN into a single feature pool, which is then used as input for feature classification. Lastly, the feature classification module uses machine learning classifiers, such as SoftMax, Support Vector Machine (SVM), K-Nearest Neighbor (KNN), AdaBoost, Logistic Regression (LogReg), and Naive Bayes classifiers, to assign class probabilities and distinguish between two types of human behaviour: violent and normal behaviour. The weights of the features are also trained during this process. The Fusion model offers several advantages:
- Flexibility: It offers a flexible approach for fusing multiple CNN models without training them from scratch. Instead, the new models are trained separately on specific datasets of interest, and the extracted features are added to the existing feature pool. This approach saves significant time and effort, reduces the computational resources required, and eliminates the need to retrain the pre-trained models.
- Better feature representation: It captures features from different models that can achieve a better feature representation than a single model. This is because different models have different strengths in capturing certain features or patterns in the data. By fusing the strengths of multiple models, we can create a more comprehensive and diverse feature representation that captures a wider range of patterns and relationships in the data. Moreover, combining multiple models can reduce the risk of overfitting and improve the model’s generalisation ability.
3.3.2. The Structure of the Concatenation Model
The Concatenation model is composed of three major parts: the fusion module, the concatenation module, and the feature classification module. Figure 7 depicts a schematic diagram of the Concatenation model. The Fusion module utilises the Fusion model (without the classification module) as a component of the Concatenation model. The Fusion model includes three pre-trained CNN models, extracting relevant input data features. The Fusion module uses multiple pre-trained models to capture various discriminative features from diverse violence scenarios. In the Concatenation module, the feature pools obtained from several datasets are concatenated into a unified feature concatenation pool that serves as input for the feature classification module. The feature classification module trains feature weights using SoftMax, SVM, KNN, AdaBoost, LogReg, and Naive Bayes classifiers to assign accurate class probabilities for discriminating between two distinct categories of human behaviour: violence and normal behaviour. The Concatenation model offers several advantages:
- It has improved generalisation capabilities compared to individual models trained on specific datasets. By fusing features from different pre-trained CNN models and incorporating dataset-specific models, the model leverages the strengths of each component to perform well on previously unseen data, combining knowledge from diverse violent scenarios.
- The Concatenation model has been developed with scalability, ensuring that it can efficiently incorporate new datasets. This feature allows the model to adapt and excel in various anomaly scenarios, including violence, arson, and road accidents, without requiring complete retraining of the entire model. The capability to integrate new datasets enhances the model’s versatility and practicality in real-world settings.
3.4. Training
Our experiment involved testing five models: InceptionV3, Inception-ResNetV2, Xception, the Fusion model, and the Concatenation model. We used two datasets, RLVS and Hockey, and tested the models in the following scenarios:
- Training and evaluating the three models using the RLVS dataset;
- Training and evaluating the three models using the Hockey dataset;
- Assessing the performance of the proposed Fusion model, which incorporates features from the RLVS dataset, through separate tests on both the RLVS and Hockey datasets;
- Evaluating the proposed Fusion model using features from the Hockey dataset, and conducting separate tests on both the Hockey and RLVS datasets;
- Finally, for evaluating the proposed Concatenation model, which integrates the extracted features from both the RLVS and Hockey datasets, we performed tests specifically on the RLVS dataset. Subsequently, we also assessed the model’s performance on the Hockey dataset.
3.5. Experiment Setup and Training Options
We used Python version 3.1 to create the model and relied on two open-source software libraries, TensorFlow and Keras. Keras is a high-level API for neural networks in Python and can run seamlessly on TensorFlow. For training and testing, we used a 12th Generation Intel Core i7-1265H CPU with a clock speed of 2.30 GHz and ten cores, along with an NVIDIA GeForce RTX 3070 GPU with 8 GB of memory. We used specific parameter settings during the model training process, such as a learning rate of 0.001, the ‘Adam’ optimiser, and categorical cross-entropy as the loss function. We also utilised a batch size of 32 over 30 epochs, with a dropout rate of 0.3 and a fully connected layer consisting of 1024 neurons.
3.6. Grad-CAM
Grad-CAM is a method for interpreting DL models by creating a heatmap that highlights the critical areas of an input image for a particular classification decision. It uses the output class score’s gradient concerning the network’s final convolutional layer’s feature maps, which is then weighted by the average pooling of the gradients to produce a class-discriminative localisation map [35]. Grad-CAM has been used in various fields to demonstrate how deep learning models make decisions. It is more accurate in localising critical features than other saliency methods, such as Integrated gradients, Eigen-CAM, DeepLIFT, Layer-wise relevance propagation (LRP), and Occlusion, making it superior in visualising the critical features used by DL models for classification decisions [36]. Our research used Grad-CAM to find regions of interest emphasised by the InceptionV3, InceptionResNetV2, and Xception models. By doing so, we aimed to understand the specific traits better and features of these models prioritised when detecting.
4. Results
4.1. Performance Evaluation Metrics
This research assessed the pre-trained and proposed solutions, evaluating their performance using various metrics, including accuracy, recall, precision, and F1 score [1,13]. The accuracy metric measures the model’s ability to predict violent video behaviours based on the test images. As the dataset used in this study was symmetric, accuracy is a critical performance parameter for the models under investigation. The accuracy of predictions is determined by the ratio of correctly predicted samples to the total number of predictions, which is illustrated in Equation (1).
where
- TP—True positive, TN—True negative.
- FP—False positive, FN—False negative.
TP and TN predictions are correct, while FP and FN are incorrect.
Equation (2) uses recall as an evaluation measure to capture positives and determine the number of successfully detected positive samples.
Precision is calculated as the ratio of correct positive results to predicted positive results. It is a valuable measure when we require high confidence in our predictions. The precision value can be obtained using (Equation (3)).
The F1 score is a metric that calculates the balanced average of recall and precision rates. A high F1 score indicates better performance of the model. It is commonly used when there is an uneven distribution of classes (as shown in Equation (4)).
4.2. Evaluation of Individual Models
The three pre-trained models (InceptionV3, InceptionResNetV2, and Xception) were evaluated for their effectiveness in violence recognition. The experimental results obtained on the RLVS and Hockey datasets are presented in the following subsections.
4.2.1. Experiment Results on RLVS Dataset
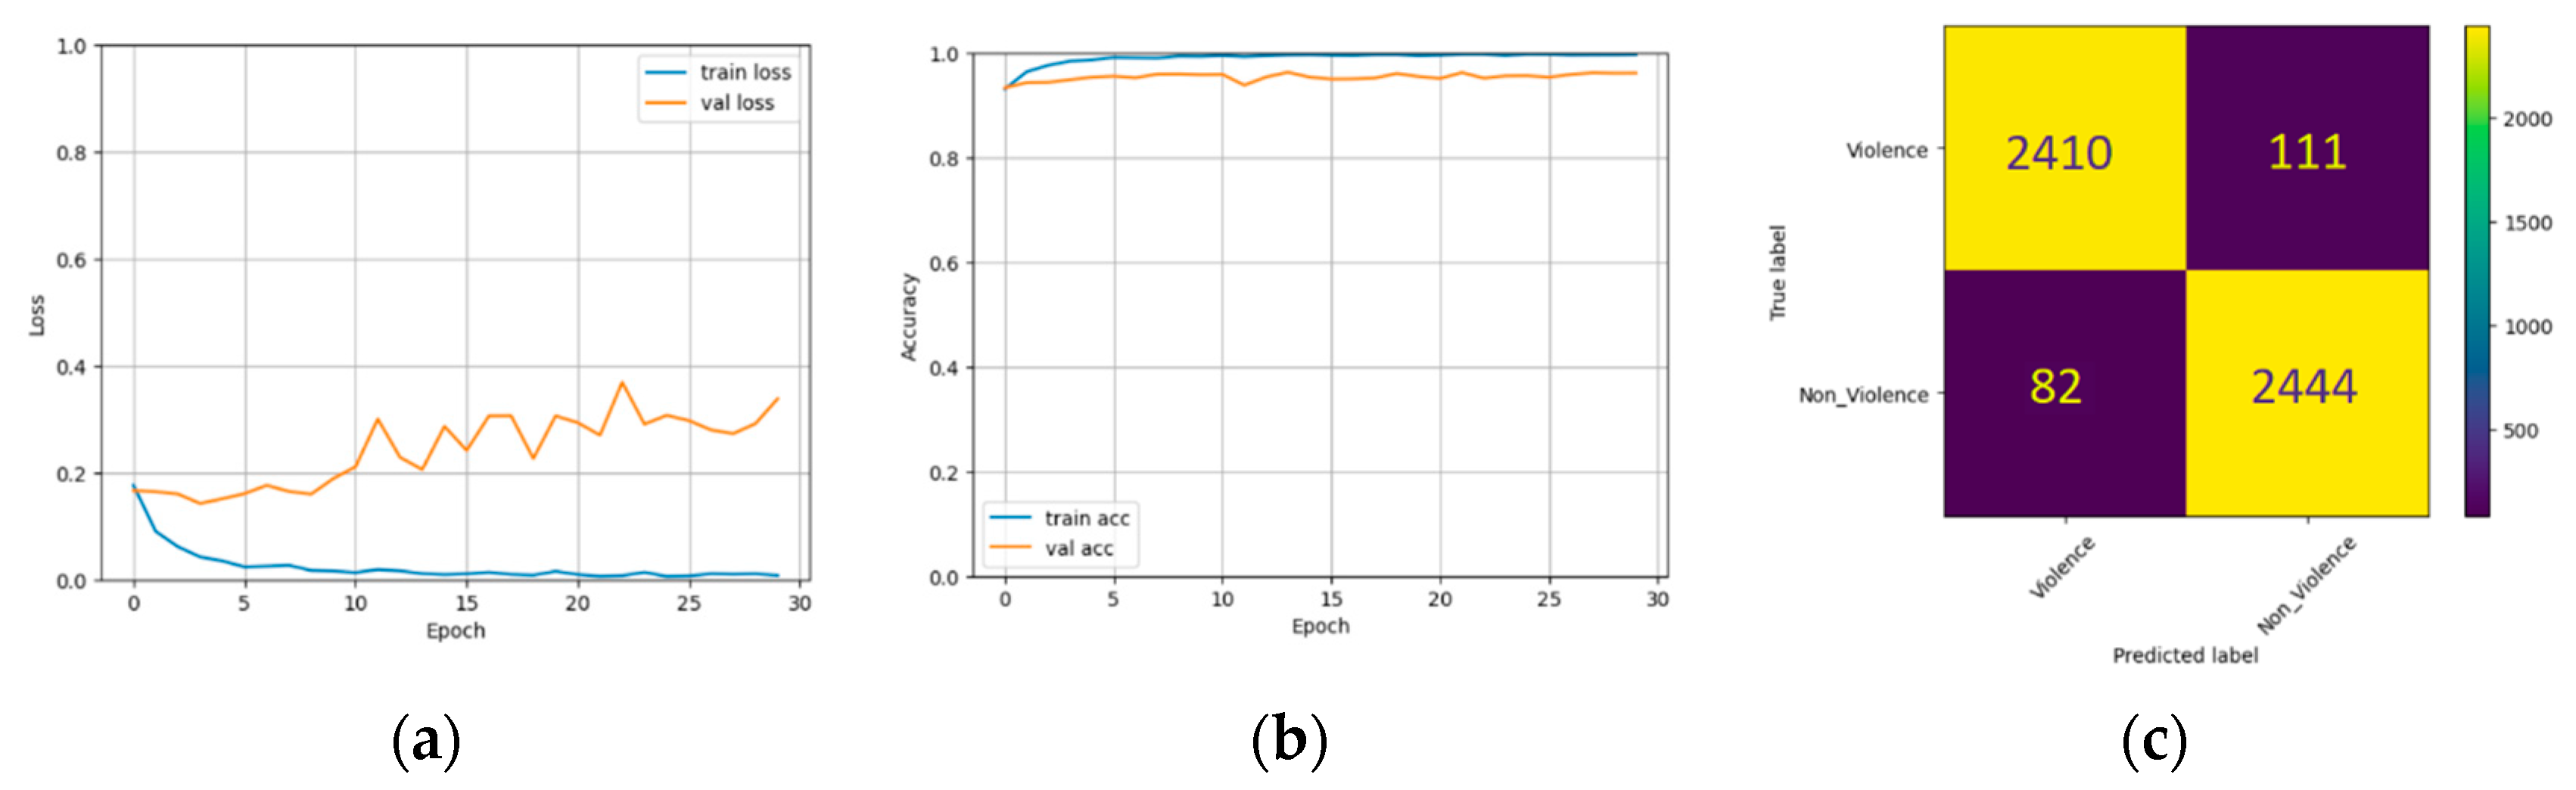
The performance of three pre-trained models on the RLVS dataset is shown in Figure 8, Figure 9 and Figure 10. These figures illustrate the training and validation set losses, accuracies, and confusion matrices. Table 2 presents the models’ accuracy, recall, precision, and F1 score. The InceptionResNet model achieved the highest accuracy and the lowest loss, followed by Xception with the second-highest accuracy but the most significant loss. The Inception model had the lowest accuracy but the second-lowest loss. Inception, InceptionResNet, and Xception had accuracy scores of 96.0%, 96.19%, and 96.17%, respectively. InceptionResNet had the highest precision score with 97.0%, while Xception had the highest recall with 96.75 and an F1 score of 96.20%. Figure 11 displays the heatmap generated via Grad-CAM for Inception, InceptionResNet, and Xception.
4.2.2. Experiment Results on Hockey Dataset
The Hockey dataset was used to train and test three individual models in this particular case. Training and validation set losses, accuracies, and confusion matrices were measured across several epochs to evaluate how well these models performed. Figure 12, Figure 13 and Figure 14 show the corresponding outcomes. Table 3 summarises these models’ performance metrics on the Hockey dataset. The Inception model achieved 93.75% accuracy, 91.59% recall, 95.82% precision, and 93.66% F1 score. InceptionResNet model scored 88.72% for accuracy, 91.0% for recall, 87.18% for precision, and 89.05% for F1 score. At the same time, the Xception model achieved 92.41% accuracy, 95.50% recall, 90.0% precision, and 96.69% F1 score. These results demonstrate how well each model performed in classifying violent behaviour in the Hockey dataset, with Inception attaining the most accuracy and precision, Xception achieving the highest recall, and InceptionResNet displaying the lowest overall performance. Figure 15 illustrates the heatmap produced with Grad-CAM for the Inception, InceptionResNet, and Xception models.
4.3. Experimental Results of the Fusion Model
The subsequent sections demonstrate the experimental outcomes of a Fusion model applied to the RLVS and Hockey datasets. Figure 16 shows the Grad-Cam of three DL models, where each model focuses on a specific region of the target. Combining the three models represents the features excellently for the ML classifiers.
4.3.1. Experimental Results on RLVS Dataset
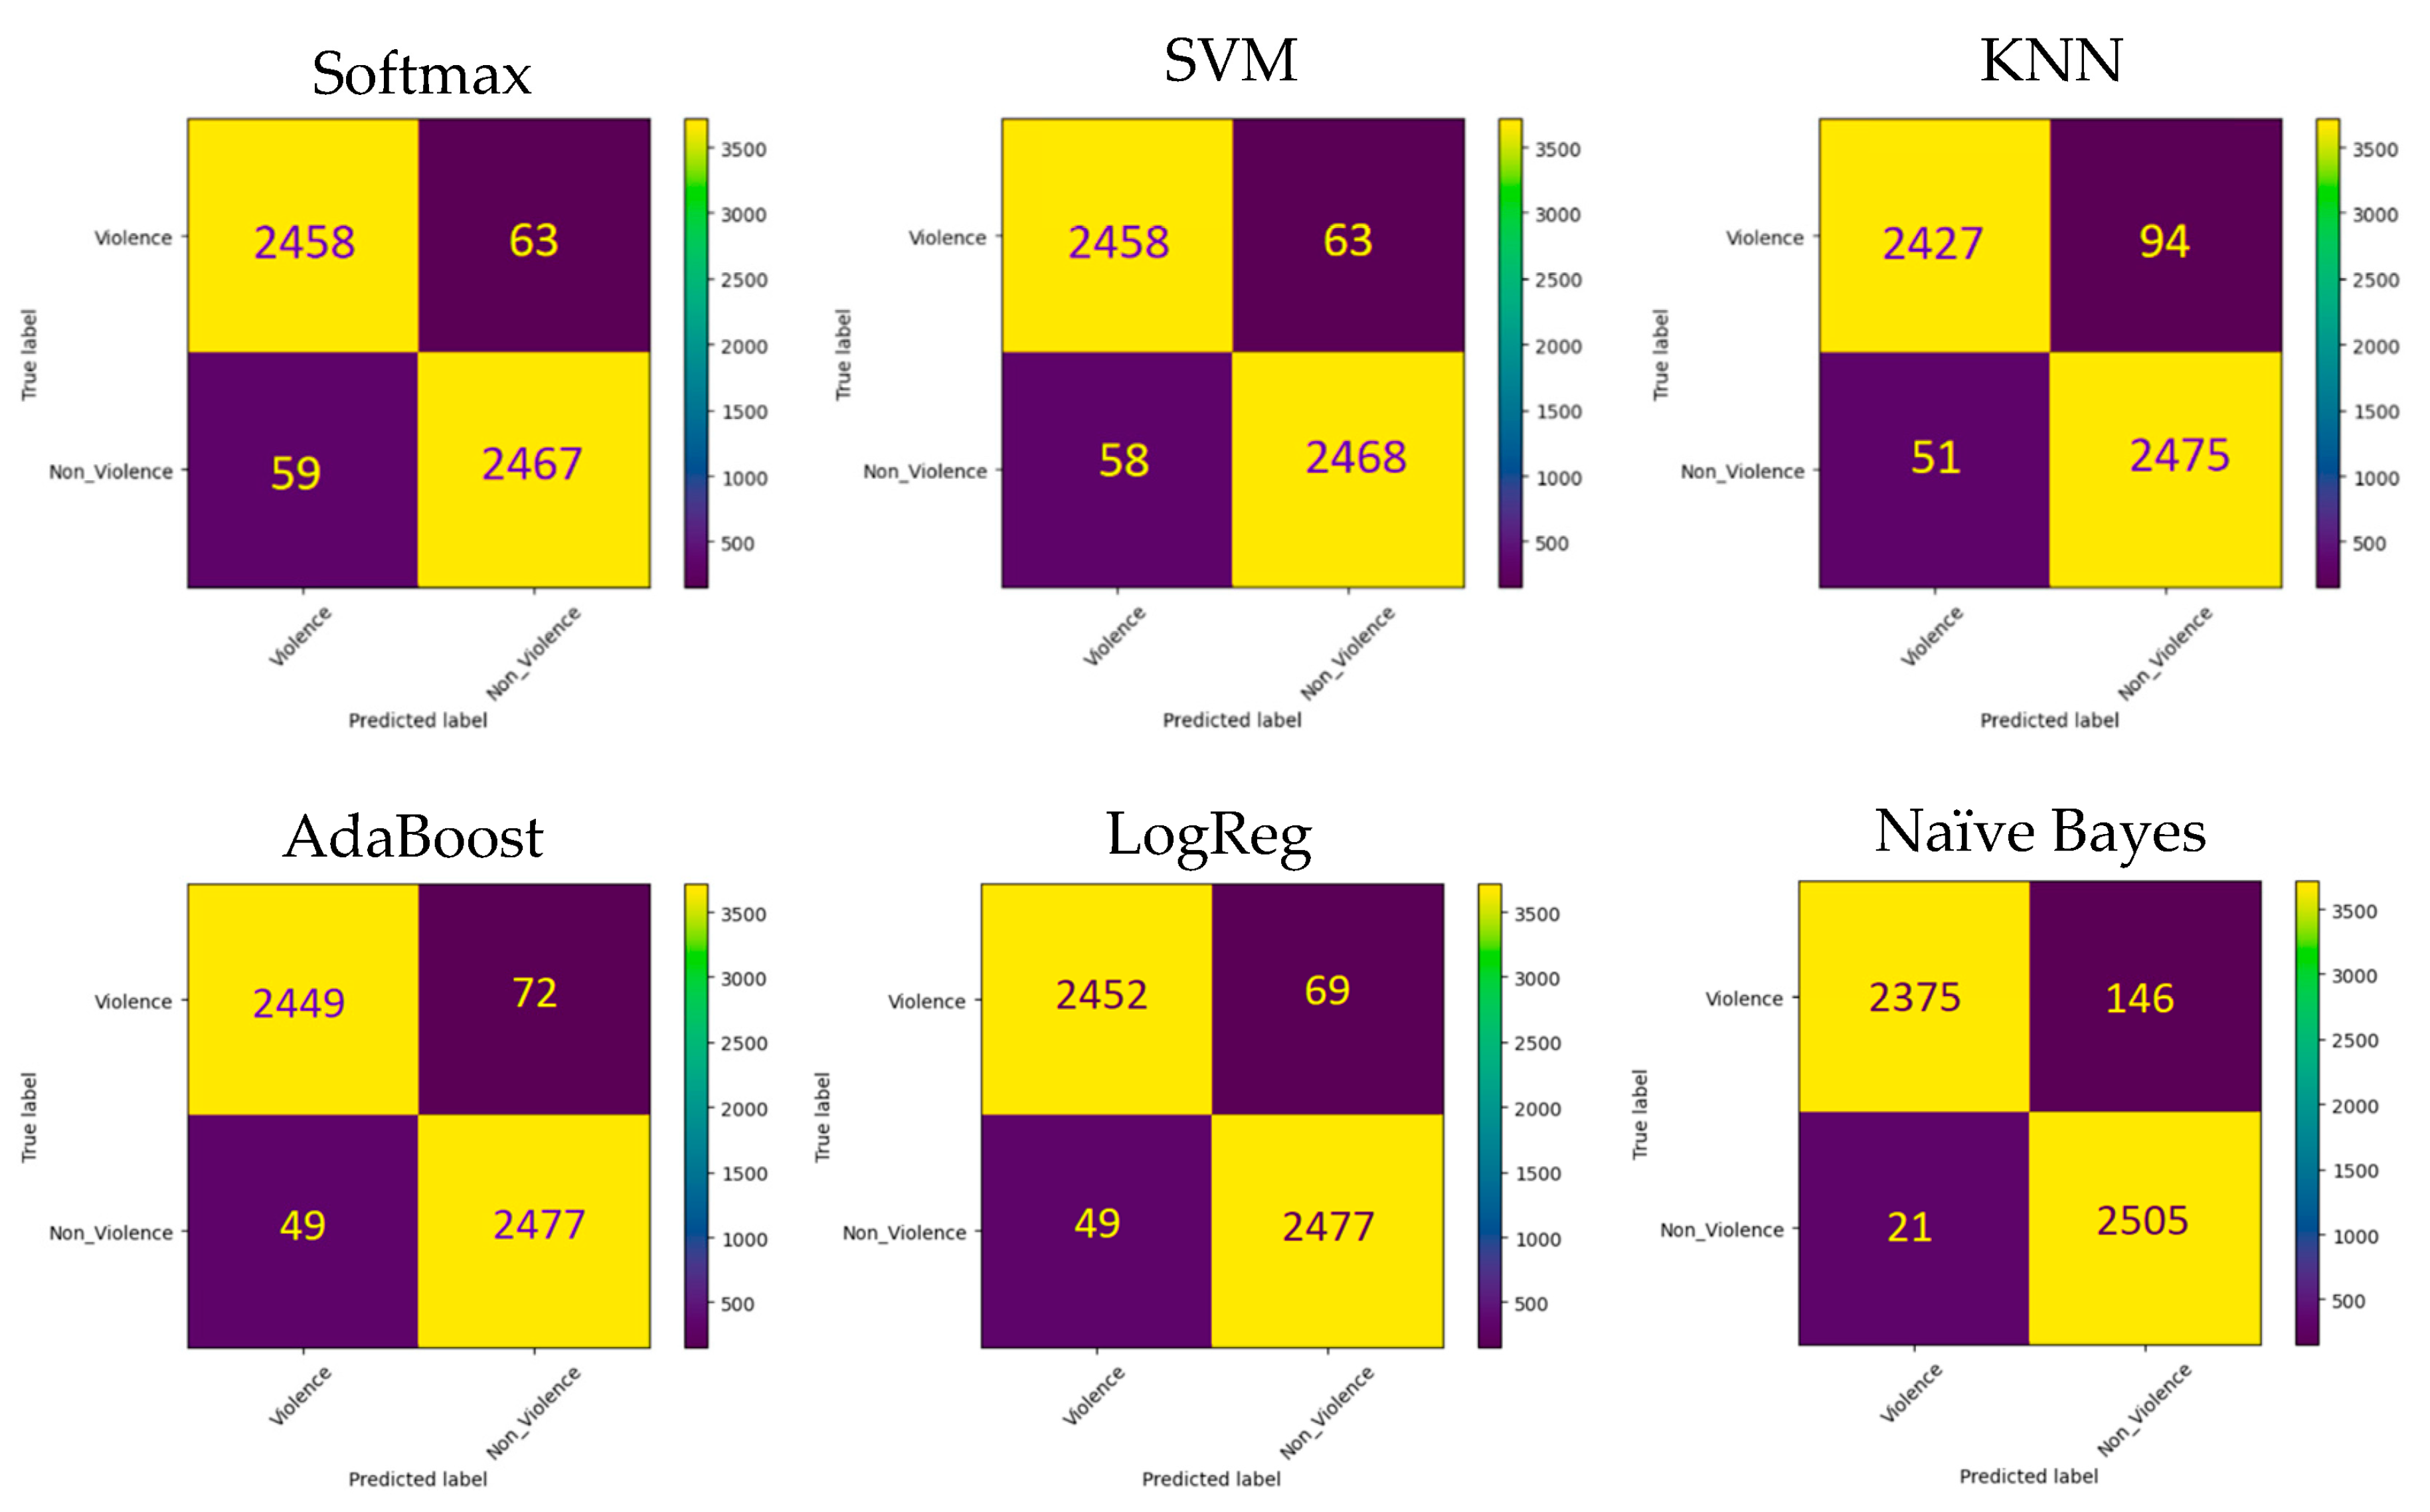
Our proposed Fusion model combines three CNN models, namely InceptionV3, InceptionResNetV2, and Xception, all trained on the RLVS training dataset to extract features from video frames. These features were then merged into a single pool. To classify input frames as violent or normal, we utilised five ML classifiers: SoftMax, SVM, KNN, AdaBoost, LogReg, and Naïve Bayes. We assessed the performance of the Fusion model on the RLVS testing dataset. We presented the experimental results and the confusion matrices of the ML classifiers in Table 4 and Figure 17, respectively. Our findings show that the Fusion model outperformed all individual models in terms of accuracy, recall, precision, and F1 score, achieving respective scores of 97.66%, 98.06%, 97.28%, and 97.67%, respectively.
4.3.2. Experimental Results on Hockey Dataset
We analysed the Hockey dataset to determine how effective the Fusion model is. To do so, we combined the extracted features from individual models trained on the Hockey dataset into a single feature pool. We then tested the model’s performance on the Hockey testing dataset using five ML classifiers. The results and corresponding confusion matrices can be found in Table 5 and Figure 18, respectively. The results display that the Fusion model outperformed the single models in terms of accuracy, recall, precision, and F1 score. However, the Inception model had a slightly better accuracy score.
4.4. Experimental Results of the Concatenation Model
We conducted two experiments to evaluate the Fusion model’s ability to adapt to different datasets. In the first experiment, the model was trained on the RLVS dataset and we tested it on the Hockey dataset. In the second experiment, the model was trained on the Hockey dataset and we tested it on the RLVS dataset. The evaluation of these experiments is presented in Table 6 and Table 7, respectively. Based on the results in Table 6, the model’s ability to distinguish violent acts in various contexts and domains is limited. The Naïve Bayes classifier achieved accuracy, recall, precision, and F1 scores of 37.19%, 3.37%, 10.76%, and 5.14%, respectively. The SVM, SoftMax, and LogReg classifiers achieved accuracy scores of about 41%, and recall, precision, and F1 scores of less than 3%. The KNN classifier achieved accuracy, recall, precision, and F1 scores of 52.47%, 71.45%, 52.08%, and 60.25%, respectively. The Adaboost classifier performed better, with accuracy, recall, precision, and F1 scores of 58.82%, 60.81%, 58.85%, and 59.82%, respectively. However, these results still need to be considered subpar.
The outcomes of the second experiment, outlined in Table 7, reveal that the model’s capability to differentiate violent acts across various contexts and domains remains limited. When utilizing the SoftMax and SVM classifiers, the accuracy, recall, precision, and F1 scores were confined to a range between 14% and 37%. The KNN classifier achieved approximately 50% score across all metrics. Conversely, the LogReg and AdaBoost classifiers attained around 62% accuracy, 85% recall, 59% precision, and 69% F1 score. In contrast, the Naïve Bayes classifier exhibited even better performance, with scores of 65.70% accuracy, 69.12% recall, 64.73% precision, and 66.82% F1 score. Nonetheless, additional efforts are necessary to ensure the dependability of the results and to meet the desired level of performance.
In response to the challenge of generalisation, we introduced a Concatenation model as a solution. We evaluated the performance of the Concatenation model on the RLVS and Hockey testing datasets. The experimental results conducted on the RLVS and Hockey datasets are shown in Table 8 and Table 9, respectively.
According to the data presented in Table 8, SoftMax, SVM, AdaBoost, and LogReg classifiers achieved impressive accuracy scores of about 97.60% in identifying video frames. These classifiers also displayed excellent recall, precision, and F1 scores above 97%, indicating their ability to correctly identify violent behaviour. On the other hand, the KNN classifier had slightly lower accuracy, recall, precision, and F1 scores of 95.00%, 93.03%, and 96.66%, respectively, but still demonstrated its efficacy in detecting violence in the RLVS dataset. In Table 9, the Hockey dataset results showed that the Concatenation model continued to perform well. The Naïve Bayes classifier achieved accuracy ratings of 92.41%, 96.03% recall, 89.64% precision, and 92.73% F1 score. In contrast, the KNN classifier had a lower accuracy of 90.91%, with recall, precision, and F1 scores ranging between 90% and 91%. Despite this, the KNN classifier performed well on the Hockey dataset, albeit achieving lower scores than the other classifiers. Overall, the results of the Concatenation model demonstrated its capability to handle generalization and scalability issues while accurately identifying violent events in various scenarios. This positions it as a practical approach for video content analysis and other relevant applications
4.5. State-of-the-Art Analysis
Our study compared the accuracy of the proposed Fusion model to existing methods for automatic video anomaly detection on the RLVS and Hockey datasets. We selected these methods because they use ML and DL techniques, which align with the objective of our research. A detailed description of these methods can be found in the related works section of our paper. After analyzing the results from the RLVS dataset and the Hockey dataset (presented in Table 10 and Table 11, respectively), we found that our proposed Fusion model delivered cutting-edge results. These outcomes reinforce the quality of our approach and its substantial contribution to the current state-of-the-art in video anomaly detection.
The Concatenation model obtained an impressive accuracy of 97.64% on the RLVS dataset and 92.41% on the Hockey dataset. Moreover, this model consistently performs well on both datasets using just one classifier, proving its effectiveness in accurately identifying anomalies and providing a reliable solution for video anomaly recognition. Additionally, the Concatenation model significantly improves the ability to detect violence in various scenarios. It is worth noting that this is the first approach that combines two different violence detection scenarios while still allowing for the inclusion of additional scenarios without needing to start from scratch. As a result, previous studies cannot be directly compared to our approach in terms of this specific aspect.
5. Conclusions
We have introduced a new generalisation model called Concatenation, which addresses the problem of generalisation in video anomaly detection. This flexible model can incorporate new datasets without requiring complete retraining. Our experimental results proved that the Fusion model outperformed other methods and achieves an accuracy of 97.66% on the RLVS dataset and 92.89% on the Hockey dataset during model fusion. Similarly, the Concatenation model has achieved a high accuracy of 97.64% on the RLVS dataset and 92.41% on the Hockey dataset. Analysis through the Grad-CAM technique has provided additional validation and insights into our results. It is worth noting that no other method has demonstrated similar capabilities of a single model performing multiple tasks in video anomaly detection. Our plans include expanding our solution to multi-scenario anomaly detection, such as fighting, stealing, and vehicle accidents.
Author Contributions
Conceptualization, S.A.J., L.A., K.A.H. and H.K.H.; methodology, S.A.J. and L.A.; software, S.A.J. and L.A.; validation, S.A.J., K.A.H., H.K.H. and L.A.; data curation, S.A.J., K.A.H., H.K.H. and L.A.; writing—original draft preparation, S.A.J. and L.A.; writing—review and editing, S.A.J., K.A.H., H.K.H. and L.A.; project administration, S.A.J., K.A.H., H.K.H. and L.A. All authors have read and agreed to the published version of the manuscript.
Funding
Laith Alzubaidi would like to acknowledge the support received through the following funding schemes of Australian Government: ARC Industrial Transformation Training Centre (ITTC) for Joint Biomechanics under grant IC190100020.
Data Availability Statement
All relevant dataset links were provided in the main paper content.
Conflicts of Interest
The authors declare no conflict of interest.
References
- Jebur, S.A.; Hussein, K.A.; Hoomod, H.K.; Alzubaidi, L.; Santamaría, J. Review on Deep Learning Approaches for Anomaly Event Detection in Video Surveillance. Electronics 2022, 12, 29. [Google Scholar] [CrossRef]
- Amin, J.; Anjum, M.A.; Ibrar, K.; Sharif, M.; Kadry, S.; Crespo, R.G. Detection of Anomaly in Surveillance Videos Using Quantum Convolutional Neural Networks. Image Vis. Comput. 2023, 135, 104710. [Google Scholar] [CrossRef]
- Abd, W.H.; Sadiq, A.T.; Hussein, K.A. Human Fall down Recognition Using Coordinates Key Points Skeleton. In Proceedings of the 2022 3rd Information Technology to Enhance E-Learning and Other Application (IT-ELA), Baghdad, Iraq, 27–28 December 2022; IEEE: Piscataway, NJ, USA, 2022; pp. 232–237. [Google Scholar]
- Ali, M.A.; Hussain, A.J.; Sadiq, A.T. Deep Learning Algorithms for Human Fighting Action Recognition. Int. J. Online Biomed. Eng. 2022, 18, 71–87. [Google Scholar]
- Naik, A.J.; Gopalakrishna, M.T. Deep-Violence: Individual Person Violent Activity Detection in Video. Multimed. Tools Appl. 2021, 80, 18365–18380. [Google Scholar] [CrossRef]
- Traoré, A.; Akhloufi, M.A. Violence Detection in Videos Using Deep Recurrent and Convolutional Neural Networks. In Proceedings of the 2020 IEEE International Conference on Systems, Man, and Cybernetics (SMC), Toronto, ON, Canada, 11–14 October 2020; IEEE: Piscataway, NJ, USA, 2020; pp. 154–159. [Google Scholar]
- Gadelkarim, M.; Khodier, M.; Gomaa, W. Violence Detection and Recognition from Diverse Video Sources. In Proceedings of the 2022 International Joint Conference on Neural Networks (IJCNN), Padova, Italy, 18–23 July 2022; IEEE: Piscataway, NJ, USA, 2022; pp. 1–8. [Google Scholar]
- Irfanullah; Hussain, T.; Iqbal, A.; Yang, B.; Hussain, A. Real Time Violence Detection in Surveillance Videos Using Convolutional Neural Networks. Multimed. Tools Appl. 2022, 81, 38151–38173. [Google Scholar] [CrossRef]
- Vijeikis, R.; Raudonis, V.; Dervinis, G. Efficient Violence Detection in Surveillance. Sensors 2022, 22, 2216. [Google Scholar] [CrossRef]
- Kang, M.; Park, R.-H.; Park, H.-M. Efficient Spatio-Temporal Modeling Methods for Real-Time Violence Recognition. IEEE Access 2021, 9, 76270–76285. [Google Scholar] [CrossRef]
- Abdali, A.-M.R.; Al-Tuma, R.F. Robust Real-Time Violence Detection in Video Using Cnn and Lstm. In Proceedings of the 2019 2nd Scientific Conference of Computer Sciences (SCCS), Baghdad, Iraq, 27–28 March 2019; IEEE: Piscataway, NJ, USA, 2019; pp. 104–108. [Google Scholar]
- Ali, L.R.; Shaker, B.N.; Jebur, S.A. An Extensive Study of Sentiment Analysis Techniques: A Survey. In Proceedings of the AIP Conference Proceedings, Baghdad, Iraq, 8–9 December 2021; AIP Publishing: Baghdad, Iraq, 2023; Volume 2591. [Google Scholar]
- Alzubaidi, L.; Zhang, J.; Humaidi, A.J.; Al-Dujaili, A.; Duan, Y.; Al-Shamma, O.; Santamaría, J.; Fadhel, M.A.; Al-Amidie, M.; Farhan, L. Review of Deep Learning: Concepts, CNN Architectures, Challenges, Applications, Future Directions. J. Big Data 2021, 8, 53. [Google Scholar] [CrossRef]
- Al-Khazraji, L.R.A.; Abbas, A.R.; Jamil, A.S. A Systematic Review of Deep Dream. IRAQI J. Comput. Commun. Control Syst. Eng. 2023, 23, 192–209. [Google Scholar]
- Ali, L.R.; Jebur, S.A.; Jahefer, M.M.; Shaker, B.N. Employing Transfer Learning for Diagnosing COVID-19 Disease. Int. J. Online Biomed. Eng. 2022, 18, 31–42. [Google Scholar] [CrossRef]
- Abdulhadi, M.T.; Abbas, A.R. Human Action Behavior Recognition in Still Images with Proposed Frames Selection Using Transfer Learning. iJOE 2023, 19, 47. [Google Scholar] [CrossRef]
- Jebur, S.A.; Hussein, K.A.; Hoomod, H.K. Improving Abnormal Behavior Detection in Video Surveillance Using Inception-v3 Transfer Learning. IRAQI J. Comput. Commun. Control Syst. Eng. 2023, 23, 201–221. [Google Scholar]
- Durães, D.; Santos, F.; Marcondes, F.S.; Lange, S.; Machado, J. Comparison of Transfer Learning Behaviour in Violence Detection with Different Public Datasets. In Progress. in Artificial Intelligence, Proceedings of the 20th EPIA Conference on Artificial Intelligence, EPIA 2021, Virtual Event, 7–9 September 2021, Proceedings 20; Springer: Berlin/Heidelberg, Germany, 2021; pp. 290–298. [Google Scholar]
- Khan, S.U.; Haq, I.U.; Rho, S.; Baik, S.W.; Lee, M.Y. Cover the Violence: A Novel Deep-Learning-Based Approach towards Violence-Detection in Movies. Appl. Sci. 2019, 9, 4963. [Google Scholar] [CrossRef]
- Mumtaz, A.; Sargano, A.B.; Habib, Z. Violence Detection in Surveillance Videos with Deep Network Using Transfer Learning. In Proceedings of the 2018 2nd European Conference on Electrical Engineering and Computer Science (EECS), Bern, Switzerland, 20–22 December 2018; IEEE: Piscataway, NJ, USA, 2018; pp. 558–563. [Google Scholar]
- Alzubaidi, L.; Bai, J.; Al-Sabaawi, A.; Santamaría, J.; Albahri, A.S.; Al-dabbagh, B.S.N.; Fadhel, M.A.; Manoufali, M.; Zhang, J.; Al-Timemy, A.H. A Survey on Deep Learning Tools Dealing with Data Scarcity: Definitions, Challenges, Solutions, Tips, and Applications. J. Big Data 2023, 10, 46. [Google Scholar] [CrossRef]
- Imah, E.M.; Wintarti, A. Violence Classification Using Support Vector Machine and Deep Transfer Learning Feature Extraction. In Proceedings of the 2021 International Seminar on Intelligent Technology and Its Applications (ISITIA), Virtual, 21–22 July 2021; IEEE: Piscataway, NJ, USA, 2021; pp. 337–342. [Google Scholar]
- Alzubaidi, L.; Duan, Y.; Al-Dujaili, A.; Ibraheem, I.K.; Alkenani, A.H.; Santamaría, J.; Fadhel, M.A.; Al-Shamma, O.; Zhang, J. Deepening into the Suitability of Using Pre-Trained Models of ImageNet against a Lightweight Convolutional Neural Network in Medical Imaging: An Experimental Study. PeerJ Comput. Sci. 2021, 7, e715. [Google Scholar] [CrossRef]
- Albahri, A.S.; Duhaim, A.M.; Fadhel, M.A.; Alnoor, A.; Baqer, N.S.; Alzubaidi, L.; Albahri, O.S.; Alamoodi, A.H.; Bai, J.; Salhi, A. A Systematic Review of Trustworthy and Explainable Artificial Intelligence in Healthcare: Assessment of Quality, Bias Risk, and Data Fusion. Inf. Fusion. 2023, 96, 156–191. [Google Scholar] [CrossRef]
- Sernani, P.; Falcionelli, N.; Tomassini, S.; Contardo, P.; Dragoni, A.F. Deep Learning for Automatic Violence Detection: Tests on the AIRTLab Dataset. IEEE Access 2021, 9, 160580–160595. [Google Scholar] [CrossRef]
- Chexia, Z.; Tan, Z.; Wu, D.; Ning, J.; Zhang, B. A Generalized Model for Crowd Violence Detection Focusing on Human Contour and Dynamic Features. In Proceedings of the 2022 22nd IEEE International Symposium on Cluster, Cloud and Internet Computing (CCGrid), Taormina, Italy, 16–19 May 2022; IEEE: Piscataway, NJ, USA, 2022; pp. 327–335. [Google Scholar]
- Kotkar, V.A.; Sucharita, V. Fast Anomaly Detection in Video Surveillance System Using Robust Spatiotemporal and Deep Learning Methods. Multimed. Tools Appl. 2023, 82, 34259–34286. [Google Scholar] [CrossRef]
- Huillcen Baca, H.A.; de Luz Palomino Valdivia, F.; Solis, I.S.; Cruz, M.A.; Caceres, J.C.G. Human Violence Recognition in Video Surveillance in Real-Time. In Future of Information and Communication Conference (FICC); Springer Nature: Cham, Switzerland, 2023; pp. 783–795. [Google Scholar]
- Soliman, M.M.; Kamal, M.H.; Nashed, M.A.E.-M.; Mostafa, Y.M.; Chawky, B.S.; Khattab, D. Violence Recognition from Videos Using Deep Learning Techniques. In Proceedings of the 2019 Ninth International Conference on Intelligent Computing and Information Systems (ICICIS), Cairo, Egypt, 8–9 December 2019; IEEE: Piscataway, NJ, USA, 2019; pp. 80–85. [Google Scholar]
- Bermejo Nievas, E.; Deniz Suarez, O.; Bueno García, G.; Sukthankar, R. Violence Detection in Video Using Computer Vision Techniques. In Proceedings of the International Conference on Computer Analysis of Images and Patterns, Seville, Spain, 29–31 August 2011; Springer: Berlin/Heidelberg, Germany, 2011; pp. 332–339. [Google Scholar]
- Szegedy, C.; Vanhoucke, V.; Ioffe, S.; Shlens, J.; Wojna, Z. Rethinking the Inception Architecture for Computer Vision. In Proceedings of the IEEE Conference on Computer Vision and Pattern Recognition, Las Vegas, NV, USA, 27–30 June 2016; pp. 2818–2826. [Google Scholar]
- Peng, S.; Huang, H.; Chen, W.; Zhang, L.; Fang, W. More Trainable Inception-ResNet for Face Recognition. Neurocomputing 2020, 411, 9–19. [Google Scholar] [CrossRef]
- Chollet, F. Xception: Deep Learning with Depthwise Separable Convolutions. In Proceedings of the IEEE Conference on Computer Vision and Pattern Recognition, Honolulu, HI, USA, 21–26 June 2017; pp. 1251–1258. [Google Scholar]
- Huang, C.; Wang, X.; Cao, J.; Wang, S.; Zhang, Y. HCF: A Hybrid CNN Framework for Behavior Detection of Distracted Drivers. IEEE Access 2020, 8, 109335–109349. [Google Scholar] [CrossRef]
- Selvaraju, R.R.; Das, A.; Vedantam, R.; Cogswell, M.; Parikh, D.; Batra, D. Grad-CAM: Why Did You Say That? arXiv 2016, arXiv:1611.07450. [Google Scholar]
- Saporta, A.; Gui, X.; Agrawal, A.; Pareek, A.; Truong, S.Q.H.; Nguyen, C.D.T.; Ngo, V.-D.; Seekins, J.; Blankenberg, F.G.; Ng, A.Y. Benchmarking Saliency Methods for Chest X-Ray Interpretation. Nat. Mach. Intell. 2022, 4, 867–878. [Google Scholar] [CrossRef]
- Bi, Y.; Li, D.; Luo, Y. Combining Keyframes and Image Classification for Violent Behavior Recognition. Appl. Sci. 2022, 12, 8014. [Google Scholar] [CrossRef]
- Deniz, O.; Serrano, I.; Bueno, G.; Kim, T.-K. Fast Violence Detection in Video. In Proceedings of the 2014 International Conference on Computer Vision Theory and Applications (VISAPP), Lisbon, Portugal, 5–8 January 2014; IEEE: Piscataway, NJ, USA, 2014; Volume 2, pp. 478–485. [Google Scholar]
- Huang, J.-F.; Chen, S.-L. Detection of Violent Crowd Behavior Based on Statistical Characteristics of the Optical Flow. In Proceedings of the 2014 11th International Conference on Fuzzy Systems and Knowledge Discovery (Fskd), Xiamen, China, 19–21 August 2014; IEEE: Piscataway, NJ, USA, 2014; pp. 565–569. [Google Scholar]
- Schwarz, K.; Fragkias, M.; Boone, C.G.; Zhou, W.; McHale, M.; Grove, J.M.; O’Neil-Dunne, J.; McFadden, J.P.; Buckley, G.L.; Childers, D. Trees Grow on Money: Urban Tree Canopy Cover and Environmental Justice. PLoS ONE 2015, 10, e0122051. [Google Scholar] [CrossRef]
- Gao, Y.; Liu, H.; Sun, X.; Wang, C.; Liu, Y. Violence Detection Using Oriented Violent Flows. Image Vis. Comput. 2016, 48, 37–41. [Google Scholar] [CrossRef]
- Serrano, I.; Deniz, O.; Bueno, G.; Garcia-Hernando, G.; Kim, T.-K. Spatio-Temporal Elastic Cuboid Trajectories for Efficient Fight Recognition Using Hough Forests. Mach. Vis. Appl. 2018, 29, 207–217. [Google Scholar] [CrossRef]
- Garcia-Cobo, G.; SanMiguel, J.C. Human Skeletons and Change Detection for Efficient Violence Detection in Surveillance Videos. Comput. Vis. Image Underst. 2023, 233, 103739. [Google Scholar] [CrossRef]
Figure 1.
The first and second rows represent non-violent samples from the RLVS and Hockey datasets, respectively. The third and four rows represent violent samples from the RLVS and Hockey datasets, respectively.
Figure 1.
The first and second rows represent non-violent samples from the RLVS and Hockey datasets, respectively. The third and four rows represent violent samples from the RLVS and Hockey datasets, respectively.

Figure 2.
The architecture of InceptionV3.

Figure 3.
The architecture of the InceptionResNetV2 model.

Figure 4.
The architecture of the Xception model.

Figure 5.
Schematic diagram of the pre-trained CNN models with the additional classification layers.
Figure 5.
Schematic diagram of the pre-trained CNN models with the additional classification layers.

Figure 6.
Schematic diagram of the proposed Fusion model.

Figure 7.
Schematic diagram of the proposed Concatenation model.

Figure 8.
The experimental results on the RLVS dataset using InceptionV3. (a) Loss with different epochs. (b) Accuracy with different epochs. (c) Confusion matrix.
Figure 8.
The experimental results on the RLVS dataset using InceptionV3. (a) Loss with different epochs. (b) Accuracy with different epochs. (c) Confusion matrix.

Figure 9.
The experimental results on the RLVS dataset using InceptionResnetV2. (a) Loss with different epochs. (b) Accuracy with different epochs. (c) Confusion matrix.
Figure 9.
The experimental results on the RLVS dataset using InceptionResnetV2. (a) Loss with different epochs. (b) Accuracy with different epochs. (c) Confusion matrix.

Figure 10.
The experimental results on the RLVS dataset using Xception. (a) Loss with different epochs. (b) Accuracy with different epochs. (c) Confusion matrix.
Figure 10.
The experimental results on the RLVS dataset using Xception. (a) Loss with different epochs. (b) Accuracy with different epochs. (c) Confusion matrix.

Figure 11.
Grad-Cam with heatmap of violent behaviour in the RLVS dataset using Inception, InceptionResNet, and Xception.
Figure 11.
Grad-Cam with heatmap of violent behaviour in the RLVS dataset using Inception, InceptionResNet, and Xception.

Figure 12.
Results on Hockey dataset using InceptionV3. (a) Loss with different epochs. (b) Accuracy with different epochs. (c) Confusion matrix.
Figure 12.
Results on Hockey dataset using InceptionV3. (a) Loss with different epochs. (b) Accuracy with different epochs. (c) Confusion matrix.

Figure 13.
Results on Hockey dataset using InceptionResnetV2. (a) Loss with varying epochs. (b) Accuracy with varying epochs. (c) Confusion matrix.
Figure 13.
Results on Hockey dataset using InceptionResnetV2. (a) Loss with varying epochs. (b) Accuracy with varying epochs. (c) Confusion matrix.

Figure 14.
Results on Hockey dataset using Xception. (a) loss with different epochs. (b) Accuracy with different epochs. (c) Confusion matrix.
Figure 14.
Results on Hockey dataset using Xception. (a) loss with different epochs. (b) Accuracy with different epochs. (c) Confusion matrix.

Figure 15.
Grad-Cam with heatmap of violent behaviour in the Hockey dataset using Inception, InceptionResNet, and Xception.
Figure 15.
Grad-Cam with heatmap of violent behaviour in the Hockey dataset using Inception, InceptionResNet, and Xception.

Figure 16.
Grad-Cam with heatmap of three DL models showing how each model focuses on a different spot.
Figure 16.
Grad-Cam with heatmap of three DL models showing how each model focuses on a different spot.

Figure 17.
Confusion matrixes of SoftMax, BSVM, KNN, AdaBoost, LogReg, and Naïve Bayes classifiers on the RLVS dataset.
Figure 17.
Confusion matrixes of SoftMax, BSVM, KNN, AdaBoost, LogReg, and Naïve Bayes classifiers on the RLVS dataset.

Figure 18.
Confusion matrices of SoftMax, SVM, KNN, AdaBoost, LogReg, and Naïve Bayes classifiers on the Hockey dataset.
Figure 18.
Confusion matrices of SoftMax, SVM, KNN, AdaBoost, LogReg, and Naïve Bayes classifiers on the Hockey dataset.


Table 1.
Data division details of RLVS and Hockey datasets for violence and non-violence classes.
| Dataset Name | Class Name | Group Name | No. of Clips | No. of Frames |
|---|---|---|---|---|
| RLVS | Violence | Training | 719 | 10,659 |
| Testing | 175 | 2526 | ||
| Non-violence | Training | 800 | 10,661 | |
| Testing | 200 | 2521 | ||
| Hockey | Violence | Training | 397 | 15,795 |
| Testing | 103 | 3950 | ||
| Non-violence | Training | 399 | 15,776 | |
| Testing | 101 | 3882 |
Table 2.
The experimental results of Inception, InceptionResNet, and Xception models on the RLVS dataset.
Table 2.
The experimental results of Inception, InceptionResNet, and Xception models on the RLVS dataset.
| Model | Accuracy (%) | Recall (%) | Precision (%) | F1 Score (%) |
|---|---|---|---|---|
| Inception | 96.0 | 95.88 | 96.18 | 96.0 |
| InceptionResNet | 96.19 | 95.32 | 97.0 | 96.16 |
| Xception | 96.17 | 96.75 | 95.65 | 96.20 |
Table 3.
Experimental results of Inception, InceptionResNet, and Xception models on the Hockey dataset.
Table 3.
Experimental results of Inception, InceptionResNet, and Xception models on the Hockey dataset.
| Model | Accuracy (%) | Recall (%) | Precision (%) | F1 Score (%) |
|---|---|---|---|---|
| Inception | 93.75 | 91.59 | 95.82 | 93.66 |
| InceptionResNet | 88.72 | 91.0 | 87.18 | 89.05 |
| Xception | 92.41 | 95.50 | 90.0 | 92.69 |
Table 4.
Experimental results of the proposed Fusion model on the RLVS dataset.
| Classifier | Accuracy (%) | Recall (%) | Precision (%) | F1 Score (%) |
|---|---|---|---|---|
| Naïve Bayes | 96.69 | 99.16 | 94.49 | 96.77 |
| KNN | 97.12 | 97.98 | 96.34 | 97.15 |
| SoftMax | 97.58 | 97.66 | 97.50 | 97.58 |
| SVM | 97.60 | 97.70 | 97.51 | 97.60 |
| AdaBoost | 97.60 | 98.06 | 97.17 | 97.61 |
| LogReg | 97.66 | 98.06 | 97.28 | 97.67 |
Table 5.
Experimental results of the proposed fusion model on the Hockey dataset.
| Classifier | Accuracy (%) | Recall (%) | Precision (%) | F1 Score (%) |
|---|---|---|---|---|
| KNN | 85.88 | 80.31 | 90.60 | 85.15 |
| SVM | 92.23 | 93.39 | 91.37 | 92.37 |
| LogReg | 92.24 | 93.39 | 91.40 | 92.38 |
| Softmax | 92.29 | 93.65 | 91.28 | 92.45 |
| AdaBoost | 92.30 | 93.09 | 91.76 | 92.42 |
| Naïve Bayes | 92.89 | 88.06 | 97.60 | 92.59 |
Table 6.
Results of the Fusion model trained on the RLVS dataset and tested on the Hockey dataset.
| Classifier | Accuracy (%) | Recall (%) | Precision (%) | F1 Score (%) |
|---|---|---|---|---|
| Naïve Bayes | 37.19 | 3.37 | 10.76 | 5.14 |
| SVM | 41.50 | 0.43 | 2.55 | 0.73 |
| SoftMax | 41.57 | 0.40 | 2.42 | 0.69 |
| LogReg | 41.87 | 0.35 | 2.21 | 0.61 |
| KNN | 52.47 | 71.45 | 52.08 | 60.25 |
| AdaBoost | 58.82 | 60.81 | 58.85 | 59.82 |
Table 7.
The results of the Fusion model, which was trained on the Hockey dataset and tested on the RLVS dataset.
Table 7.
The results of the Fusion model, which was trained on the Hockey dataset and tested on the RLVS dataset.
| Classifier | Accuracy (%) | Recall (%) | Precision (%) | F1 Score (%) |
|---|---|---|---|---|
| SoftMax | 37.05 | 16.19 | 27.84 | 20.47 |
| SVM | 37.07 | 14.13 | 26.17 | 18.35 |
| KNN | 51.71 | 57.0 | 51.59 | 54.16 |
| LogReg | 62.88 | 85.78 | 58.86 | 69.82 |
| AdaBoost | 62.98 | 85.15 | 59.02 | 69.72 |
| Naïve Bayes | 65.70 | 69.12 | 64.73 | 66.82 |
Table 8.
Results of the Concatenated model on the RLVS dataset.
| Classifier | Accuracy (%) | Recall (%) | Precision (%) | F1 Score (%) |
|---|---|---|---|---|
| KNN | 95.00 | 93.03 | 96.86 | 94.91 |
| Naïve Bayes | 97.34 | 98.57 | 96.21 | 97.37 |
| SoftMax | 97.60 | 97.78 | 97.43 | 97.60 |
| SVM | 97.60 | 97.70 | 97.51 | 97.60 |
| AdaBoost | 97.60 | 98.06 | 97.17 | 97.61 |
| LogReg | 97.64 | 97.98 | 97.32 | 97.65 |
Table 9.
Results of the Concatenated model on the Hockey dataset.
| Classifier | Accuracy (%) | Recall (%) | Precision (%) | F1 Score (%) |
|---|---|---|---|---|
| KNN | 90.91 | 90.32 | 91.53 | 90.92 |
| SoftMax | 92.24 | 93.47 | 91.33 | 92.39 |
| SVM | 92.24 | 93.39 | 91.40 | 92.38 |
| AdaBoost | 92.25 | 94.0 | 90.93 | 92.44 |
| LogReg | 92.30 | 93.77 | 91.20 | 92.47 |
| Naïve Bayes | 92.41 | 96.03 | 89.64 | 92.73 |
Table 10.
Comparison of the accuracy values of the proposed Fusion model with other methods using the RLVS dataset.
Table 10.
Comparison of the accuracy values of the proposed Fusion model with other methods using the RLVS dataset.
| Ref., Year | Method | Accuracy % |
|---|---|---|
| [29], 2019 | VGG16 + LSTM | 88.20 |
| [6], 2020 | ValdNet2 (GRU) | 96.74 |
| [18], 2021 | Flow Gated RGB | 87.25 |
| [37], 2022 | keyframe-based ResNet18 | 94.60 |
| [26], 2022 | HD-NET | 96.50 |
| Proposed Fusion model | 97.66 | |
Table 11.
Comparison of the accuracy values of the proposed Fusion model with other methods using the Hockey dataset.
Table 11.
Comparison of the accuracy values of the proposed Fusion model with other methods using the Hockey dataset.
| Ref., Year | Method | Accuracy % |
|---|---|---|
| [30], 2011 | STIP (HOG) + HIK | 91.7 |
| [38], 2014 | Histograms of frequency-based motion intensities + AdaBoost | 90.1 |
| [39], 2014 | The variance of optical flow, SVM | 86.9 |
| [40], 2015 | Motion blobs + Random Forests | 82.4 |
| [41], 2016 | ViF, OViF, AdaBoost and SVM | 87.5 |
| [42], 2018 | STEC + Hough Forests | 82.6 |
| [19], 2019 | MobileNet | 87.0 |
| [29], 2019 | VGG16 + LSTM | 86.20 |
| [18], 2021 | Flow Gated RGB | 92.0 |
| [43], 2023 | ConvLSTM | 91.0 |
| Proposed Fusion model | 92.89 | |
Disclaimer/Publisher’s Note: The statements, opinions and data contained in all publications are solely those of the individual author(s) and contributor(s) and not of MDPI and/or the editor(s). MDPI and/or the editor(s) disclaim responsibility for any injury to people or property resulting from any ideas, methods, instructions or products referred to in the content. |
© 2023 by the authors. Licensee MDPI, Basel, Switzerland. This article is an open access article distributed under the terms and conditions of the Creative Commons Attribution (CC BY) license (https://creativecommons.org/licenses/by/4.0/).
Share and Cite
MDPI and ACS Style
Jebur, S.A.; Hussein, K.A.; Hoomod, H.K.; Alzubaidi, L. Novel Deep Feature Fusion Framework for Multi-Scenario Violence Detection. Computers 2023, 12, 175. https://doi.org/10.3390/computers12090175
AMA Style
Jebur SA, Hussein KA, Hoomod HK, Alzubaidi L. Novel Deep Feature Fusion Framework for Multi-Scenario Violence Detection. Computers. 2023; 12(9):175. https://doi.org/10.3390/computers12090175
Chicago/Turabian StyleJebur, Sabah Abdulazeez, Khalid A. Hussein, Haider Kadhim Hoomod, and Laith Alzubaidi. 2023. "Novel Deep Feature Fusion Framework for Multi-Scenario Violence Detection" Computers 12, no. 9: 175. https://doi.org/10.3390/computers12090175
Note that from the first issue of 2016, this journal uses article numbers instead of page numbers. See further details here.