
Performance Evaluation and Analysis of Urban-Suburban 5G Cellular Networks


College of Engineering and Technology, American University of the Middle East, Egaila 54200, Kuwait
*
Author to whom correspondence should be addressed.
Computers 2024, 13(4), 108; https://doi.org/10.3390/computers13040108
Submission received: 18 February 2024
/
Revised: 7 April 2024
/
Accepted: 17 April 2024
/
Published: 22 April 2024
Abstract
:5G is the fifth-generation technology standard for the new generation of cellular networks. Combining 5G and millimeter waves (mmWave) gives tremendous capacity and even lower latency, allowing you to fully enjoy the 5G experience. 5G is the successor to the fourth generation (4G) which provides high-speed networks to support traffic capacity, higher throughput, and network efficiency as well as supporting massive applications, especially internet-of-things (IoT) and machine-to-machine areas. Therefore, performance evaluation and analysis of such systems is a critical research task that needs to be conducted by researchers. In this paper, a new model structure of an urban-suburban environment in a 5G network formed of seven cells with a central urban cell (Hot spot) surrounded by six suburban cells is introduced. With the proposed model, the end-user can have continuous connectivity under different propagation environments. Based on the suggested model, the related capacity bounds are derived and the performance of 5G network is studied via a simulation considering different parameters that affect the performance such as the non-orthogonality factor, the load concentration in both urban and suburban areas, the height of the mobile, the height of the base station, the radius, and the distance between base stations. Blocking probability and bandwidth utilization are the main two performance measures that are studied, however, the effect of the above parameters on the system capacity is also introduced. The provided numerical results that are based on a network-level call admission control algorithm reveal the fact that the investigated parameters have a major influence on the network performance. Therefore, the outcome of this research can be a very useful tool to be considered by mobile operators in the network planning of 5G.
1. Introduction
The arrival of fifth generation (5G) wireless technology has brought into a new time of being connected. It offers exceptional data speeds, extremely low delays, and substantial capacity [1]. The improvements in 5G technology have immense potential for revolutionizing urban and suburban environments, paving the way for smart and sustainable cities [2]. Shehab et al. in [1] provide a comprehensive overview of 5G networks and their potential applications in smart and sustainable cities. They highlight the transformative impact of 5G on different aspects of urban life, including transportation, healthcare, energy management, and environmental monitoring.
Sanchez in [2] traces the evolutionary path of mobile communication technologies from 2G to 5G, accentuating the substantial advancements introduced by 5G. He underscores the pivotal role of 5G in empowering the Internet of Things (IoT) by interconnecting myriad devices, thereby generating a wealth of actionable data to optimize urban functionality and enhance the quality of life. The performance variability of 5G networks is notably contingent upon the intricacies of deployment environments, with urban and suburban settings presenting distinct challenges characterized by dense infrastructure, high user density, and intricate signal propagation dynamics [3]. In addition to this observation, recent work such as DroidPerf [4], which scrutinizes the performance of various 5G-enabled Android mobile applications, sheds further light on the evaluation of 5G network performance. This emphasizes the critical importance of comprehensive assessments to ensure seamless connectivity and to fully exploit the potential of 5G applications [4]. Amidst the escalating demand for stable internet connections across a myriad of devices encompassing smartphones, wearables, smart homes, and automobiles, global telecommunications entitle are vigorously pursuing advancements in 5G technology [5]. This concerted effort is geared towards addressing the dynamic nature of speed requirements within an ever-expanding technological landscape. Evaluating 5G network performance in these diverse contexts remains paramount to unlocking its full capabilities and ensuring ubiquitous connectivity [6].
While 5G technology promises substantial advancements in mobile network performance within urban and suburban regions, realizing these benefits requires careful consideration of unique challenges such as building penetration and complex terrain [7]. Building Penetration, particularly at higher frequencies like mmWave, poses significant obstacles for 5G NR signals. Similarly, complex terrain including uneven landscapes, hills, and geographical features can disrupt signal propagation, leading to coverage gaps and impacting overall network performance [7]. Addressing these challenges is essential for the successful deployment and optimization of 5G technology in urban and suburban environments.
Embarking on the journey of evaluating and analyzing 5G systems within urban and suburban landscapes, the endeavor is to unravel the capacity bounds and performance metrics crucial for optimizing network efficiency [8]. Through the presentation of a novel model structure comprising urban and suburban cells, efforts are made to shed light on the intricacies of network behavior and capacity limitations, specifically tailored to the unique characteristics of urban and suburban environments [9]. Employing simulation studies that encompass diverse influencing parameters, including non-orthogonality factor, load concentration, and terrain characteristics, underscores the pivotal role of comprehensive performance assessments in shaping network planning and deployment strategies within both urban and suburban settings. This, in turn, facilitates the seamless integration of 5G technology into the fabric of urban and suburban landscapes. The fifth-generation technology standard for cellular networks stands at the forefront of connectivity innovation, heralding a new era of seamless communication. With the integration of millimeter waves (mmWave), 5G offers unparalleled capacity and remarkably low latency, redefining user experiences. Positioned as the successor to fourth-generation (4G) networks, 5G not only amplifies network performance, enhancing traffic capacity, throughput, and efficiency but also catalyzes the adoption of emerging technologies like the Internet of Things (IoT) and machine-to-machine communication [10].
This research paper investigates the performance of 5G networks in urban and suburban environments with a new model structure formed of seven cells with a central urban cell surrounded by six suburban cells. Through extensive simulations, this paper analyzes the impact of various factors on 5G network performance. The research findings provide valuable insights for optimizing 5G network deployment and ensuring reliable and efficient connectivity in urban and suburban settings.
- A.
- 5G Characteristics
5G technology, as analyzed [3], marks a substantial advancement from previous generations of cellular networks, introducing improved capabilities that could revolutionize our connectivity with the world. To accurately assess the performance of 5G networks in urban and suburban settings, it is crucial to comprehend the unique attributes that set 5G apart from its predecessors. 5G networks possess the capability to handle an extensive volume of connected devices, with the potential to accommodate up to 1 million devices per square kilometer. This capability, referred to as massive machine-type communication (mMTC), will facilitate the deployment of numerous Internet of Things applications in both urban and suburban settings. The vast capacity of 5G, with its billions of sensors, smart devices, and connected appliances, will play a pivotal role in advancing the development of smarter cities and homes.
One of the most notable features of 5G networks is their ability to achieve significantly higher data speeds than earlier technologies. As per [5], 5G is expected to reach peak data rates of up to 20 Gbps for downloads and 10 Gbps for uploads. This increase in data speed is particularly vital in densely populated urban and suburban areas where the demand for high-speed connectivity is high.
5G networks boast ultra-fast response times, aiming for latencies less than 1 millisecond. This rapid response is crucial for enabling real-time applications like autonomous vehicles, remote surgery, and immersive virtual reality experiences. Especially in urban and suburban environments where real-time communication is increasingly prevalent, 5G’s ultra-fast response will be key [6].
Beyond the increase in data speeds and low latency, another distinguishing factor of 5G networks pertains to their channel characteristics. 5G operates at higher frequencies compared to its predecessors, resulting in wider bandwidths and significant data rate enhancements. However, these higher frequencies introduce propagation challenges, such as reduced signal penetration and range, particularly in urban areas characterized by dense buildings and obstacles. To mitigate these challenges, 5G networks employ advanced antenna technologies and signal processing techniques to optimize signal transmission and reception, thereby ensuring consistent and reliable network performance even in intricate urban and suburban settings [7].
Understanding the coverage characteristics of 5G, particularly in urban areas, is of paramount importance for its successful implementation. Factors such as building density, signal propagation, and base station placement exert significant influence on 5G coverage within urban environments. The presence of tall buildings in densely populated urban settings can result in signal blockage and attenuation, potentially creating coverage deficiencies. To mitigate these challenges, network operators must engage in meticulous planning and optimization efforts for base station deployment. This may involve the deployment of a denser network comprising smaller cells or utilization of advanced antenna technologies to enhance signal propagation and coverage across the urban landscape [8].
- B.
- 5G Standards
The evolution of 5G technology came from the demand for faster data, lower latency, and higher capacity to support lots of connected devices and applications. To make sure different networks can work together and perform well, standardization organizations have developed a set of 5G standards that define the technical specifications and protocols for 5G deployment. These standards play an important role in enabling seamless connectivity and ensuring that 5G networks meet the demands of various use cases, particularly in urban and suburban environments [7].
The main international standards organization in charge of creating and keeping up with 5G specifications is the Third Generation Partnership Project (3GPP). 3GPP’s Release 15 (Rel-15) marked the first phase of the 5G standardization process, focusing on defining the core functionalities and capabilities of 5G New Radio (NR) technology. Later, Releases 16 (Rel-16) and 17 (Rel-17), have further enhanced 5G standards by introducing features such as ultra-reliable low-latency communication (URLLC) and massive machine-type communication(mMTC), specifically addressing the needs of urban and suburban environments. Several 5G standards are particularly relevant for optimizing performance and addressing challenges in urban and suburban environments. New Radio (NR) sets the physical layer and medium access control (MAC) protocols for 5G, enabling better data transmission and resource allocation in dense and congested areas [8].
Beamforming and Massive MIMO techniques use several antennas to direct wireless signals towards specific users or devices. This improves coverage, reducing interference, and enhancing data speeds, especially in busy urban areas. URLLC ensures highly dependable and super-fast connections, crucial for applications such as self-driving cars and remote surgeries. This reliability is particularly crucial in crowded cities with heavy traffic. mMTC supports numerous connected devices efficiently, without draining excessive power. It facilitates the integration of numerous IoT devices in urban and suburban areas, contributing to smart city infrastructure and connected houses [9].
The adoption of 5G standards is reshaping the structure and function of urban and suburban networks. These standards offer a blueprint to improve network performance, handle signal issues, and guarantee consistent connections for various uses. As 5G technology continues to evolve, upcoming standards will further enhance network capabilities and enable the development of innovative applications revolutionizing 5G networks in urban and suburban areas [10].
- C.
- 5G Architecture
The 5G architecture is a layered architecture tailored to meet the evolving needs of mobile networks, particularly in urban and suburban environments, where high data rates, low latency, and massive capacity are essential [10]. It encompasses a flexible and scalable network design that can accommodate a diverse range of devices and applications. Figure 1 illustrates the basic 5G architecture, which consists of three main layers.
1- Access Network (AN) Layer: This layer provides radio access to the network for User equipment devices. The gNodeBs (gNBs) in the AN layer are responsible for transmitting and receiving signals to and from the UE devices [11,12].
2- Transport Network (TN) Layer: The TN layer connects the gNBs to the 5G core (5GC) network. The routers, switches, and optical transport equipment within this layer facilitate traffic routing and transport between the AN and the 5GC layers [11].
3- 5G Core (5GC) Network Layer: This central control plane manages user sessions, routing traffic, and provides network security. The Access and Mobility Management Function (AMF), Session Management Function (SMF), User Plane Function (UPF), and Authentication Server Function (AUSF) are some of the key functions in the 5GC layer. The AN layer is connected to the TN layer and the TN layer to the 5GC layer. This allows for the seamless flow of data between the different layers of the 5G network [13].
Data Flow
Initially, user devices transmit data to the nearest base station in the AN, which subsequently relays this information to the TN through radio waves. The TN, equipped with high-speed fiber optic cables and other advanced technologies, efficiently transports the data to the 5G core. Upon arrival at the 5GC, the data undergoes processing, and interactions with other networks are facilitated if necessary. Subsequently, the 5GC communicates instructions back to the AN via the TN. These instructions serve as directives for the AN to control the radio signals effectively, enabling the delivery of seamless services to user devices [14] as depicted in Figure 2.
2. Related Work
Performance evaluation of 5G networks in urban and suburban environments has been the subject of several recent studies. Shehab et al. in [1] vividly illustrated the potential of 5G in cultivating smart and sustainable cities. Their exploration of recent advancements emphasizes the utilization of 5G’s robust capabilities to drive applications such as smart grids, intelligent transportation systems, and environmental monitoring, all powered by the robust capabilities of 5G. Nanda and Dey in [3] presented a concise analysis of the 5G wireless network, focusing on key performance metrics like throughput, latency, and jitter. They discuss factors like carrier aggregation and network slicing, highlighting their role in enhancing performance to cater to a wide array of use cases.
Akhpashev et al. in [8] presented a comprehensive analysis utilizing ray tracing simulations to assess key aspects of 5G NR coverage in urban environments. The authors emphasize the unique challenges urban environments present for 5G NR coverage. Buildings, clutter, and non-line-of-sight propagation create intricate signal paths, impacting the overall coverage. Understanding and mitigating these challenges is crucial for the successful deployment of 5G networks in urban areas [8]. Lazar et al. in [9] analyzed 5G communication performance, focusing on distance evaluation using the SIM8200EA-M2 module. Their analysis revealed a decline in network performance as distance increased. Yet, it remained sufficient to meet the demands of most applications.
Expanding network coverage and capacity, especially in geographically diverse areas, presents a significant challenge that demands innovative solutions. One such solution, explored by Khan et al. in [15], involves leveraging UAV-aided 5G networks. By equipping unmanned aerial vehicles (UAVs), commonly known as drones, with base stations, these networks can be strategically deployed to provide temporary or permanent coverage in regions where traditional infrastructure struggles to reach. The potential of UAV-aided 5G networks goes beyond urban settings. Gharib et al. in [16] delve into the utilization of drones to extend 5G connectivity to rural and remote areas currently underserved by conventional network infrastructure. This approach not only addresses the digital divide, but also opens up new possibilities for economic development, emergency response, and improved quality of life in these communities.
Moreover, as highlighted by Sumoza Matos et al. in [17], the consideration of device-to-device (D2D) communication further enriches the evaluation of 5G network performance. D2D communication allows devices to communicate directly with each other, bypassing the need for a central base station. This decentralized approach not only enhances network efficiency but also facilitates seamless communication in environments with limited infrastructure or high user density. In essence, the combined efforts of researchers exploring UAV-aided 5G networks, extending connectivity to non-urban areas, and optimizing D2D communication underscore the complexity and importance of evaluating 5G network performance in urban and suburban contexts. These advancements hold the promise of bridging connectivity gaps and transforming the way we communicate and interact in diverse environments. Understanding the complex dynamics of radio wave propagation in urban and suburban environments is crucial for optimizing the performance of 5G networks. The studies by Gonsioroski et al. in [18] and Huang et al. in [19] offer in-depth insights into channel modeling tailored specifically for these dynamic settings. Channel modeling involves a thorough understanding of how radio waves propagate through the environment, considering factors such as path loss, reflection, and scattering. By examining these propagation characteristics closely, researchers can devise advanced strategies to address signal degradation and improve network coverage.
Furthermore, as the density of deployments in urban and suburban areas increases, the importance of energy efficiency becomes even more pronounced in sustaining 5G network operations. This is where the research conducted by Huttunen et al. in [20] becomes significant. Their work focuses on energy efficiency in dense deployments, exploring protocols and management techniques aimed at reducing the environmental impact of 5G technology. With the rising number of connected devices, the energy consumption of 5G networks escalates accordingly. Thus, the implementation of energy-efficient solutions is essential not only for cost reduction but also for mitigating the environmental consequences associated with the widespread adoption of 5G technology.
Hasan et al. in [21] explored the complexities involved in achieving widespread access within 5G networks across diverse urban and rural environments. They highlight the potential challenges arising from distinct infrastructure needs, variations in user density, and strategies for spectrum allocation. To address these challenges, the authors propose a comprehensive strategy encompassing network densification, effective spectrum management, and economically feasible deployment methods. They stress the significance of customizing network solutions to suit the unique requirements of each environment, whether it is densely populated urban areas or thinly populated rural areas. Chinda et al. in [22] proposed the utilization of Artificial intelligence (AI) to further enhance the performance of 5G networks. They explore AI-based methodologies focusing on traffic prediction, radio resource management, and network optimization, suggesting that integrating AI can unleash the complete capabilities of 5G. Similarly, moving to particular performance elements, Al-Dabbagh et al. in [23] conducted a comparative analysis of distinct millimeter-wave bands within 5G networks. They analyze factors such as path loss and penetration, emphasizing the trade-offs between frequency bands and their applicability across diverse deployment scenarios. Several studies concentrate on evaluating 5G performance in real-world environments. Mallikarjun et al. in [24] specifically conducted a performance analysis of a private 5G SA campus network, emphasizing throughput, latency, and jitter. Their findings demonstrated that the network achieved commendable throughput rates and exhibited minimal latency, indicating its viability for applications sensitive to latency.
Cainelli et al. in [25] evaluated the performance of a 5G device in a non-public network. Their findings highlighted the device’s capability to attain high throughput and maintain low latency. However, they observed that the device’s performance was affected by factors such as network congestion and interference. Yoshioka et al. in [26] examined the performance of 5G mmWave radio access regarding beam tracking and latency in an outdoor mobile environment. Their results showed that beam tracking can significantly improve latency performance, particularly in scenarios where there is no direct line of sight.
Looking beyond individual metrics, Erunkulu et al. in [27] classified 5G applications like Enhanced mobile broadband (eMBB), ultra-reliable low-latency communication (URLLC), and mMTC, emphasizing the diverse performance requirements of each application type. Meanwhile, Perna et al. in [28] investigated the performance of 5G concerning emergency services via cloud and edge platforms, showcasing its potential to offer reliable and low latency connectivity crucial for saving lives.
Chan and Liang in [29] conducted a comprehensive analysis of key performance indicators (KPIs) within 5G networks, focusing on network architecture. Their study introduces innovative optimization strategies and methodologies, such as network slicing and resource algorithms. Utilizing software simulations, they meticulously evaluated these approaches, demonstrating substantial enhancements in network performance when compared to conventional, un-optimized configurations.
Li et al. in [30] introduced an innovative area restriction scheme, utilizing a Tracking Area Code (TAC) control policy tailored for 5G private networks. Leveraging the advantages of open network architecture and virtualized network elements, their scheme establishes a dedicated data channel catering to diverse wireless devices within a specified area. This methodology fosters effortless integration of sensing terminals, thereby guaranteeing secure and uninterrupted data collection across industrial production processes.
Arendt et al. in [31] proposed an agile system tailored for cross-network monitoring of end-to-end guarantees within private 5G networks. Utilizing a distributed testbed, they unveiled a methodology that actively measures throughput, latency, and reliability across diverse network points, offering a holistic assessment surpassing traditional single-point measurement. This approach holds particular significance for multi-user and cell-edge scenarios, where performance variability is more pronounced.
Lin et al. in [32] delved into an exploration of 5G standalone (SA) network performance via field trials, concentrating on the assessment of control plane and user plane latency, alongside network coverage in both multi-cell and single-cell scenarios. Their discoveries furnish operators with invaluable insights concerning network deployment and optimization strategies within the SA architecture.
Shurman et al. in [33] suggested a novel approach to improve performance and reduce latency for high-priority applications in 5G networks by incorporating prioritization within network slices. Their study utilizes end-to-end network slicing and employs simulations with the NS-3 network simulator to showcase the effectiveness of priority-based resource allocation. This research underscores the potential of integrating prioritization within slices to enhance performance and meet diverse Service Level Agreements (SLAs).
Mohammad et al. in [34] undertook field trials using a self-contained 5G base station to scrutinize the performance disparity between Standalone (SA) and Non-Standalone (NSA) networks within an indoor setting. They meticulously assessed key performance indicators (KPIs) such as data rate and latency across diverse system configurations. Their discoveries indicate that SA networks exhibit marginally higher uplink rates compared to NSA counterparts with identical Radio Access Network (RAN) setups, while network latency remains comparable. While showcasing the potential benefits of SA in terms of uplink performance, these findings emphasize the necessity for further investigation.
B.D. and Chaudhari in [35] assessed the effectiveness of 5G scheduling algorithms within the Open Air Interface (OAI) framework, comparing their throughput in a simulated environment featuring a single User Equipment (UE) and a single gNodeB (gNB). They specifically examined round-robin and First-In-First-Out (FIFO) scheduling algorithms and scrutinized resource allocation patterns using Wireshark. Their analysis reveals that Round Robin exhibits more consistent throughput when juxtaposed with FIFO.
The recent study by OpenSignal sheds light on the evolving landscape of 5G performance in both urban and suburban environments within the United States. The findings are detailed in the article “The U.S. rural-urban gap has narrowed for 5G speeds but widened for 5G availability”. The study’s findings reveal a notable convergence in 5G speeds between rural and urban areas, signifying a positive trend in bridging the gap in network performance. However, a paradoxical widening of the gap is observed in terms of 5G availability, particularly in suburban regions. The study underscores the nuanced dynamics at play, emphasizing that while rural areas witness speed improvements, suburban areas experience challenges in achieving widespread 5G coverage. These insights provide valuable information for stakeholders in the telecommunication industry, policymakers, and service providers, informing strategies to optimize 5G deployment and enhance network accessibility, especially in suburban environments where the demand for seamless connectivity remains a critical factor in shaping the future of 5G technology [36].
Finally, Dangi et al. in [37] conducted a systematic review of 5G technology, focusing on key performance indicators (KPI) and evaluating its performance. They identify critical metrics such as throughput, latency, reliability, and energy efficiency, highlighting the ongoing research efforts aimed at comprehensively understanding 5G performance across varied deployment scenarios and user conditions.
This comprehensive study of related work presents an encouraging outlook on 5G performance within urban and suburban environments. Despite persistent challenges, the research papers actively discuss solutions to optimize performance, unlock new applications, and fundamentally reshape human lifestyles and work dynamics within these interconnected environments.
Allied to other people’s work, the following points demonstrate the author’s contribution:
- The suggested urban-suburban model is new concerning the 5G application. The performance of the 5G network is studied concerning different parameters that affect the performance such as the non-orthogonality factor, the height of the mobile, the height of the base station, and the effect of load concentration. Moreover, comparative results are conducted to compare the realistic urban-suburban network with the non-realistic ideal free-space network.
- The main outcome and contribution of this work can be formulated as follows:
- ○
- The main goal of this research is to study the effect of different performance indicators on 5G performance and capacity. These indicators can be introduced to mobile operators to be considered as planning factors in the design of 5G network. Therefore, with the proposed model in this research, the end-user can have continuous connectivity under different propagation environments.
- ○
- It is shown in this research that studying 5G networks in more realistic environments degrades the network performance in areas where the load is concentrated. Therefore, a proper network-level call admission control algorithm that balances the load and manages the network resources is strongly needed. This is a very important issue to be considered by the research community while studying such systems.
- ○
- The introduced urban/suburban model in this research is very important because firstly, the real capacity of 5G is based on areas where the load and the density of the traffic is high. Secondly, the infrastructure of 5G which is based on mmWave can cover only short distances. Therefore, to ensure that networks provide connections with high-data throughput, low latency and other features already guaranteed by 5G, the focus will be on realistic small cell base stations.
- ○
- This research work also demonstrated the effect of the distance between base stations on the network capacity since capacity is a very critical issue in 5G. This issue is considered an optimization factor regarding cost performance and must be considered in the planning of 5G design and infrastructure.
Regardless of the main contribution of the current work, below are some limitations of the proposed work and a lot of work needs to be done in this regard:
- Different traffic scenarios and distributions should be considered in future work such as uniform and on-uniform traffic distribution over the network.
- To study the model in a more realistic status, the mobility model can be integrated into the model considering the seamless soft-handover principle of 5G between the target cell and the neighboring cells.
- I did not find any similar model scenario in the literature, otherwise, the results of the proposed model can be compared with other people’s work.
3. The Proposed Model
The proposed system is shown in Figure 3 which is formed of a 5G network cluster of seven cells. The inner cell is the urban cell which represents a hot spot with a highly populated dense area. In these areas, Reflection and transmission through walls, partitions, windows, floors, and ceilings are used to predict the propagation. On the other hand, the outer six cells are to represent the suburban areas with less population. Therefore, propagation is predicted through multiple diffractions over terrain and buildings as well as scattering or reflection from large buildings, hills, or mountains.
3.1. Modeling Assumptions
To investigate the above-proposed model, the following assumptions are considered:
- The arrival process of the session over the whole network is assumed to be a Poisson process.
- The traffic is assumed to be uniformly distributed over the coverage area of each Node B.
- The service time is modeled by a Pareto random variable to represent the WWW nature of the traffic. The service time is modelled as a Pareto random variable which represents the self-similar behavior of WWW traffic. During a packet call, several packets may be generated, which means that the packet call establishes a burst sequence of packets. After the document has entirely arrived at the terminal, the user consumes a certain amount of time to study the information. This time interval is called reading time (s). Pareto parameters are obtained from the 3GPP standard [38] and given in Table 2.
- Two traffic scenarios are assumed: Homogeneous and Hotspot. In the homogeneous case, the load is equal for all cells. In the hotspot scenario, we assign twice as many calls to the central cell than each of the other six border cells.
- The mobile station is assumed to be stationary. Mobility is not considered in the current analysis.
- All cells are assumed to be the same size.
- The call admission control algorithm (CACA) proposed in [39] is applied in this study. The analysis is based on the soft handover principle in 5G networks, which allows the user equipment (UE) to connect gently with many Node Bs at the same time, as illustrated in Figure 4. Given that the signals will be conveyed, no resources will be granted until the UE meets the admission requirements defined by Node B, which are characterized in our model as the minimum bit rate threshold and minimum distance. This research effort assumes multi-cell deployment, as indicated in Figure 3, where the user equipment (UE) is softly connected with more than one Node B at the same time, However, during the soft handover process, UE will only be linked to one Node B based on the strongest signal, which is computed in the model using a threshold of minimum bit rate, minimum distance, and interference levels between the cell and other surrounding cells. The two parameters needed for the CACA are the maximum distance, dmax and the maximum number of active users, nmax. Note that all symbols and associated descriptions used in the following equations are listed in Table 1.

Table 2.
Simulation Parameters.
| Parameter | Value |
|---|---|
| Average Packet size | 480 bytes |
| Average requested file size (25 × 480 bytes) | 12 Kbytes |
| The average number of packet calls within a session | 5 |
| Average reading time between packet calls | 412 s |
| The average amount of packets within a packet call | 25 |
| Average inter-arrival time between packets | 0.0625 s |
| Wavelength,λ | 0.15 m |
| Signal-to-Noise Ratio, SNR | 2 dB |
| Thermal Noise, N0 | −103 dBm |
| Distance between Nodes B, d | 1000 m, 4000, 7000 m |
| Number of codes, N | 64 |
| Frequency, f | 20 GHz |
| Height of the mobile, hm | 2 m, 5 m |
| Height of the base station, hb | 50 m, 100 m |
| Service Factor, S(SF/SINR) | 16, 32, 64, 128 |
| Cell radius, r | 1, 7 km |
| Spreading factor, SF | 32, 64, 128, 256 chips/symbol |
| Maximum transmission power, Psmax | 125 W |
| Non-orthogonality factor,ε | 0.30, 0.40, 0.50 |
| Traffic intensity over the network (Erlang), λ/µ | 200, 250, …, 450 |
- λ is the wavelength
- PSmax is the maximum transmission power of the UE
- N0 is the thermal noise.
- S is the spreading factor (the ratio between the bandwidth of the user signal and the transmitted bandwidth) = Spreading factor (SF)/Signal-to-Noise ratio (SNR).
- ε is the non-orthogonality factor (interference factor).
- Assuming that the cell coverage is defined by a radius, r then the maximum number of active users in the cell can be defined as:
3.2. Model Solution by MOSEL-2
MOSEL stands for Modeling Specification and Evaluation language. An extended version of the original MOSEL, called MOSEL-2 simulation, is used to analyze the suggested model [40]. After obtaining the required license to use the simulation, the simulator needs the Linux operating system to work. Because the MOSEL-2 language makes simulation easier to conduct, the suggested model is solved quickly and simply with a programming language that is simple to learn and use because it is quite similar to the C language. With MOSEL-2, you can easily solve the model that is shown graphically as a queueing model or Petri net. From there, you can deduce the stochastic process, create the related state space, and get the numerical solution.
The stages below summarize how the simulation model is developed:
- First, the high-level system description is created using the MOSEL-2 tool in a simple C-like language. The model description is saved as “filename.mos”, which specifies the intended performance measures. Without programmer intervention, the described model is transferred to the assessment environment, where all subsequent steps are carried out.
- Second, the model is turned into a tool for creating input files using MOSEL-2 environment. This tool can be either C-based Stochastic Petri Net (C-Based SPNP) or TimeNet. After selecting a specific tool, the MOSEL-2 environment will invoke the tool.
- Third, the utility handles the input file in the following two ways, depending on options given in the command-line arguments.
- (a).
- Numerical analysis: during this analysis, the entire state space of the system is produced using the modeling language’s semantic rules. The obtained semantic model is linked to the stochastic process. The stochastic process will then be solved using the numerical solution algorithms that are accessible.
- (b).
- Simulation: the tool will evaluate the model using discrete event simulation, eliminating the need to construct the state space.
- The obtained results from discrete event simulation or numerical solutions are saved in a file with the tool structure.
3.3. Capacity Bounds Derivation
The capacity bounds are derived using the extended COST-231 Hata model in [41]. Based on this derivation, the general propagation loss in dB is given by:
- where,
- is a propagation loss in environment of type E, in dB. E is 1 for urban and 2 for suburban.
- is the correction factor for each environment, E: E = 0 for urban and suburban models.
- f is the frequency of the transmission in MHz.
- hb is the height of base station or transmitter in meters.
- hm is the height of the mobile or receiver in meters.
- d is the distance between the transmitter and the receiver in kilometers.
- a (hm) is the mobile antenna correction factor.
- Therefore,
- 1.
- The propagation model for the urban environment is given as:
- where
- for the urban environment.
- 2.
- The propagation model for the urban environment is given as:
- where,
- is the transmitted power and is the received power.
- Moving the fraction to the left hand side, (7) can be rewritten as:
- where,
- is a function of the height of the mobile, hm, the height of the base station, hb and the frequency, f.
- is the correction parameter for each type of environment, E, which is a function based on the height of the mobile, hb, is given as:To be used for each environment (i.e., E is equal to 1 for urban and 2 for suburban)
- By introducing the distance, d, (12) can be rewritten as:
- For urban model:
From (5) and considering and
Therefore, from (11)
Which can be simplified to:
Therefore from (12),
- For suburban model:
The suburban propagation model is based on the urban model [42] and is given as:
Then,
Therefore, extracting leads to:
Which finally leads after substituting value to,
And therefore from (12),
4. Simulation Results with Discussion
The system has been studied via detailed simulation [40] written by the MOSEL-2 language. Simulation parameters are shown in Table 2. The call admission control algorithm (CACA) presented in [42] is applied in this simulation. Although the height of the mobile and the height of the base station are given in the table as average values, these values will be changed in the investigation to study the effect of these parameters on system performance. The investigation is focused on the most important performance measures, the blocking probability, and the utilization. The performance of the system in such an environment can be influenced by many factors including the interference levels, and the physical characteristics of the network, i.e., the height of Node B and the height of buildings in the area. The numerical results are given in the below subsections.
4.1. Effect of Non-Orthogonality Factor, ε
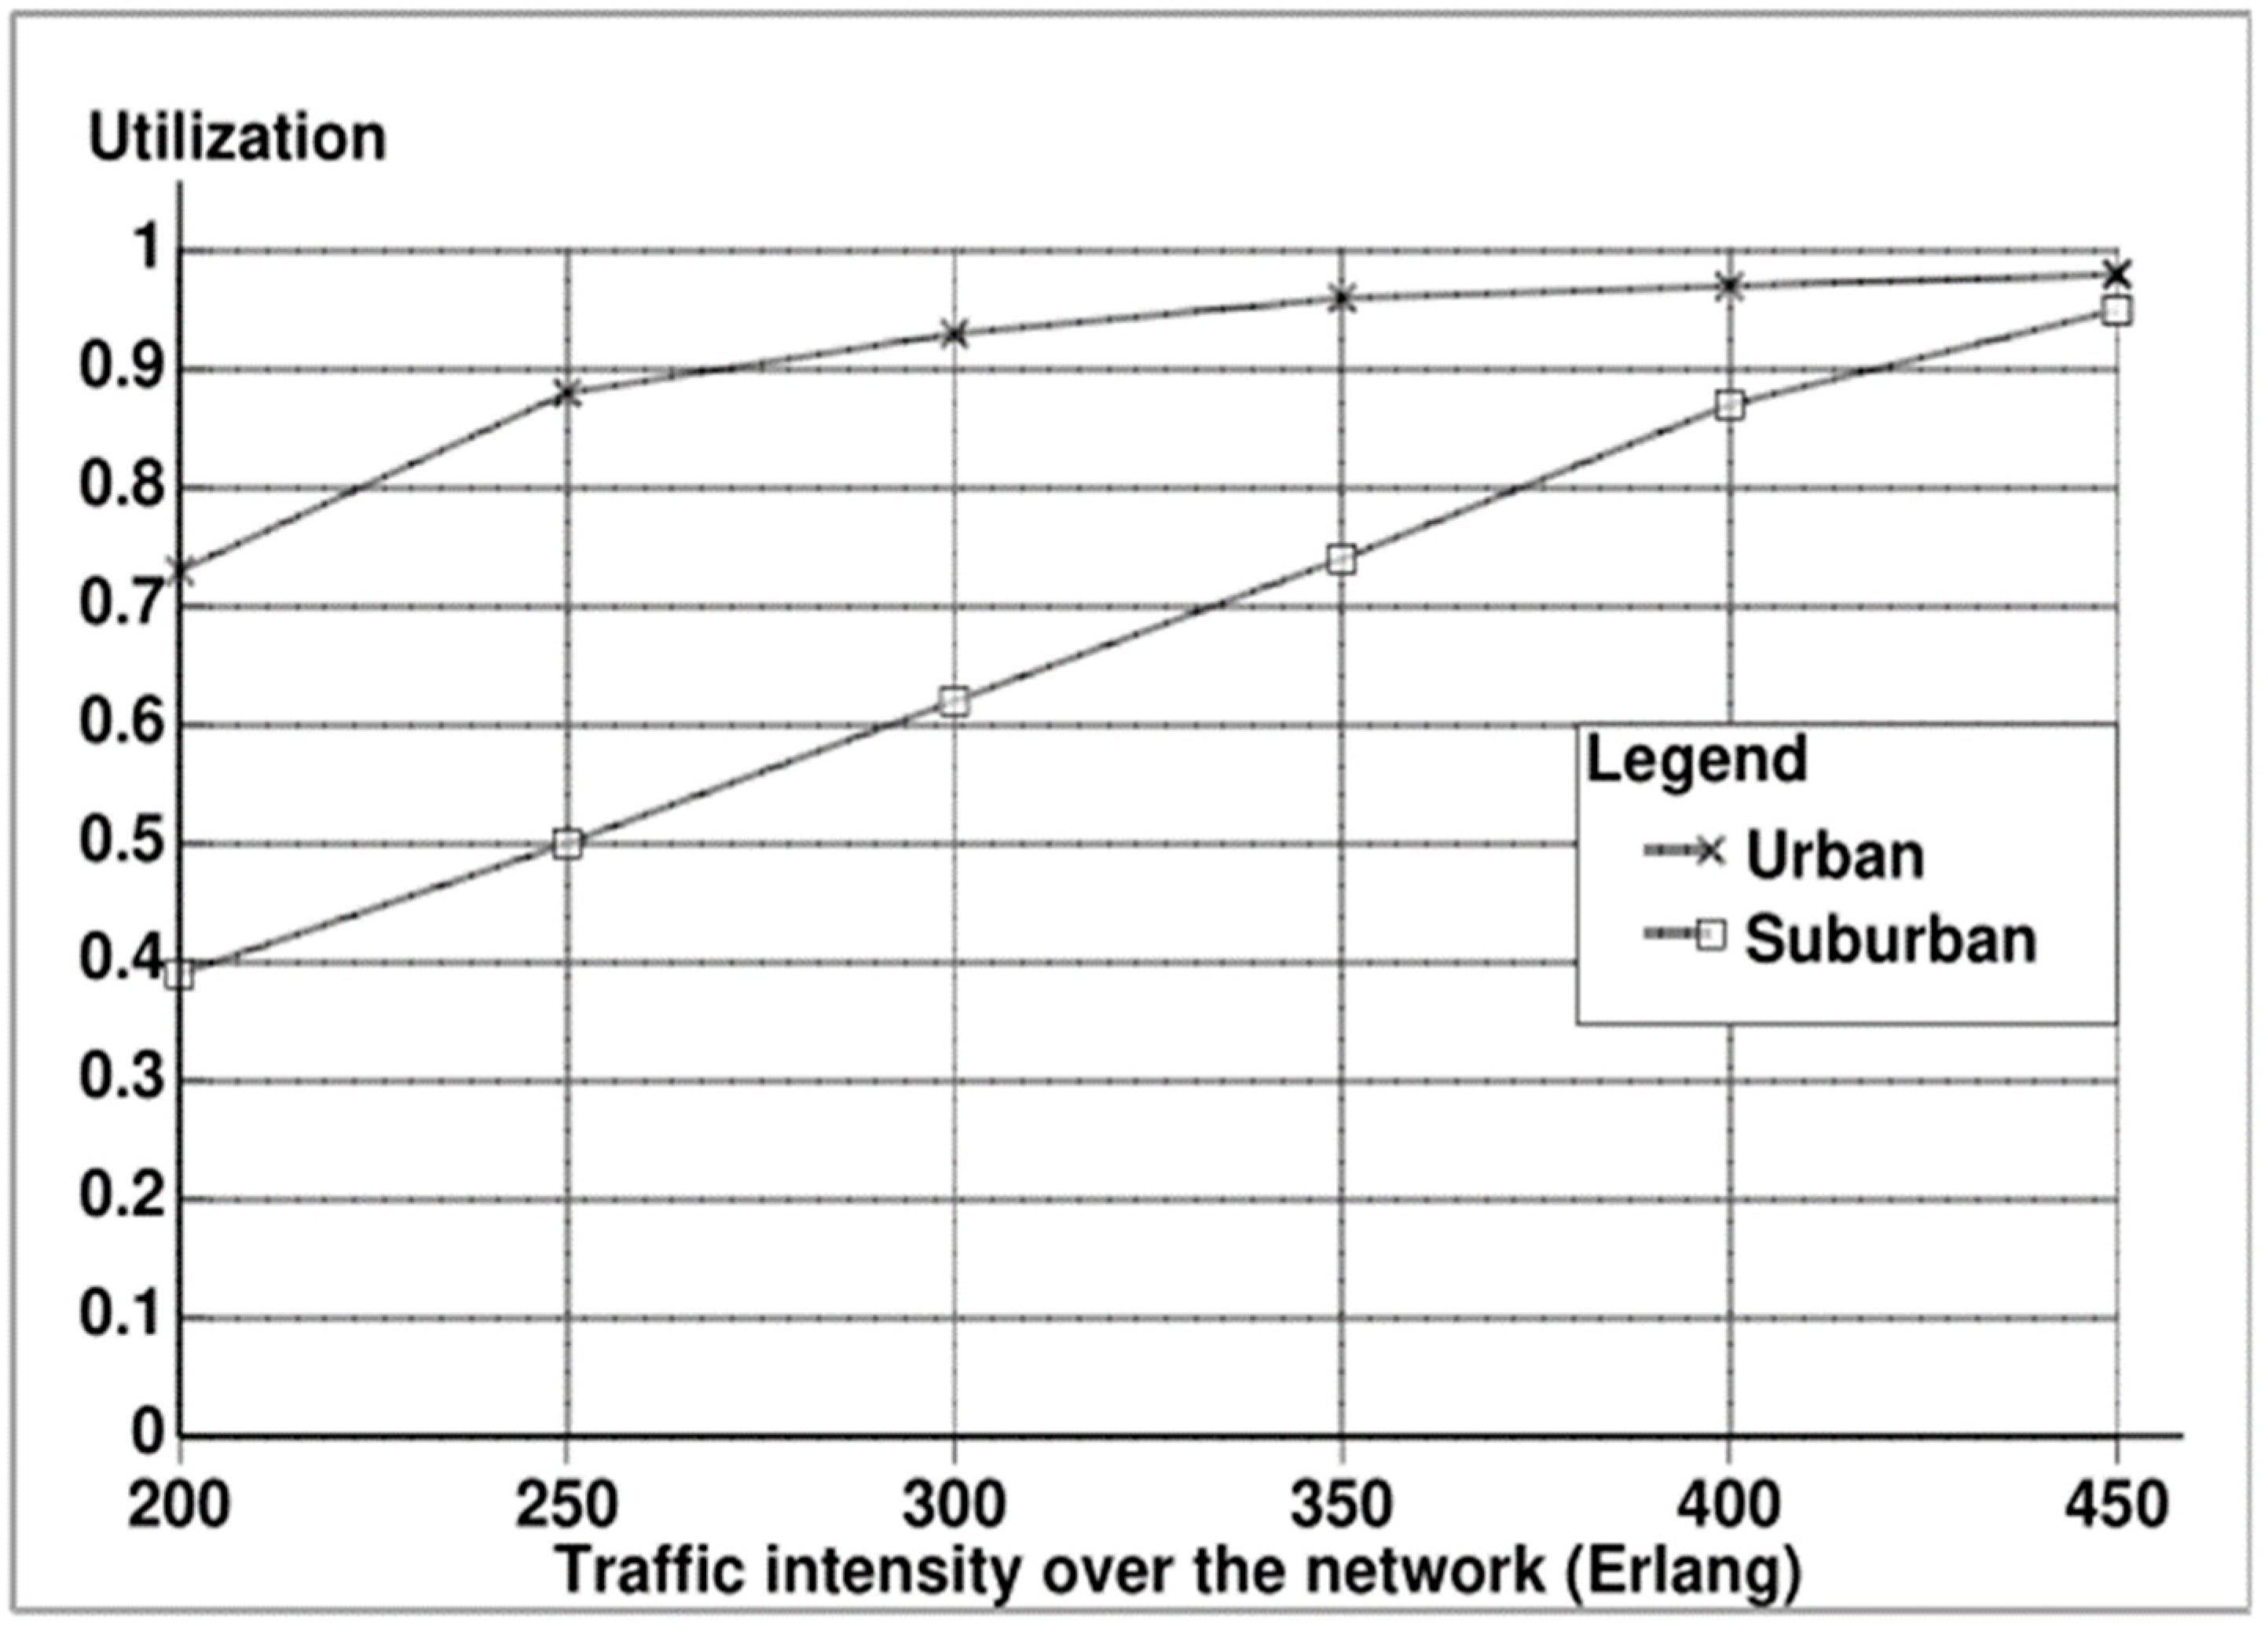
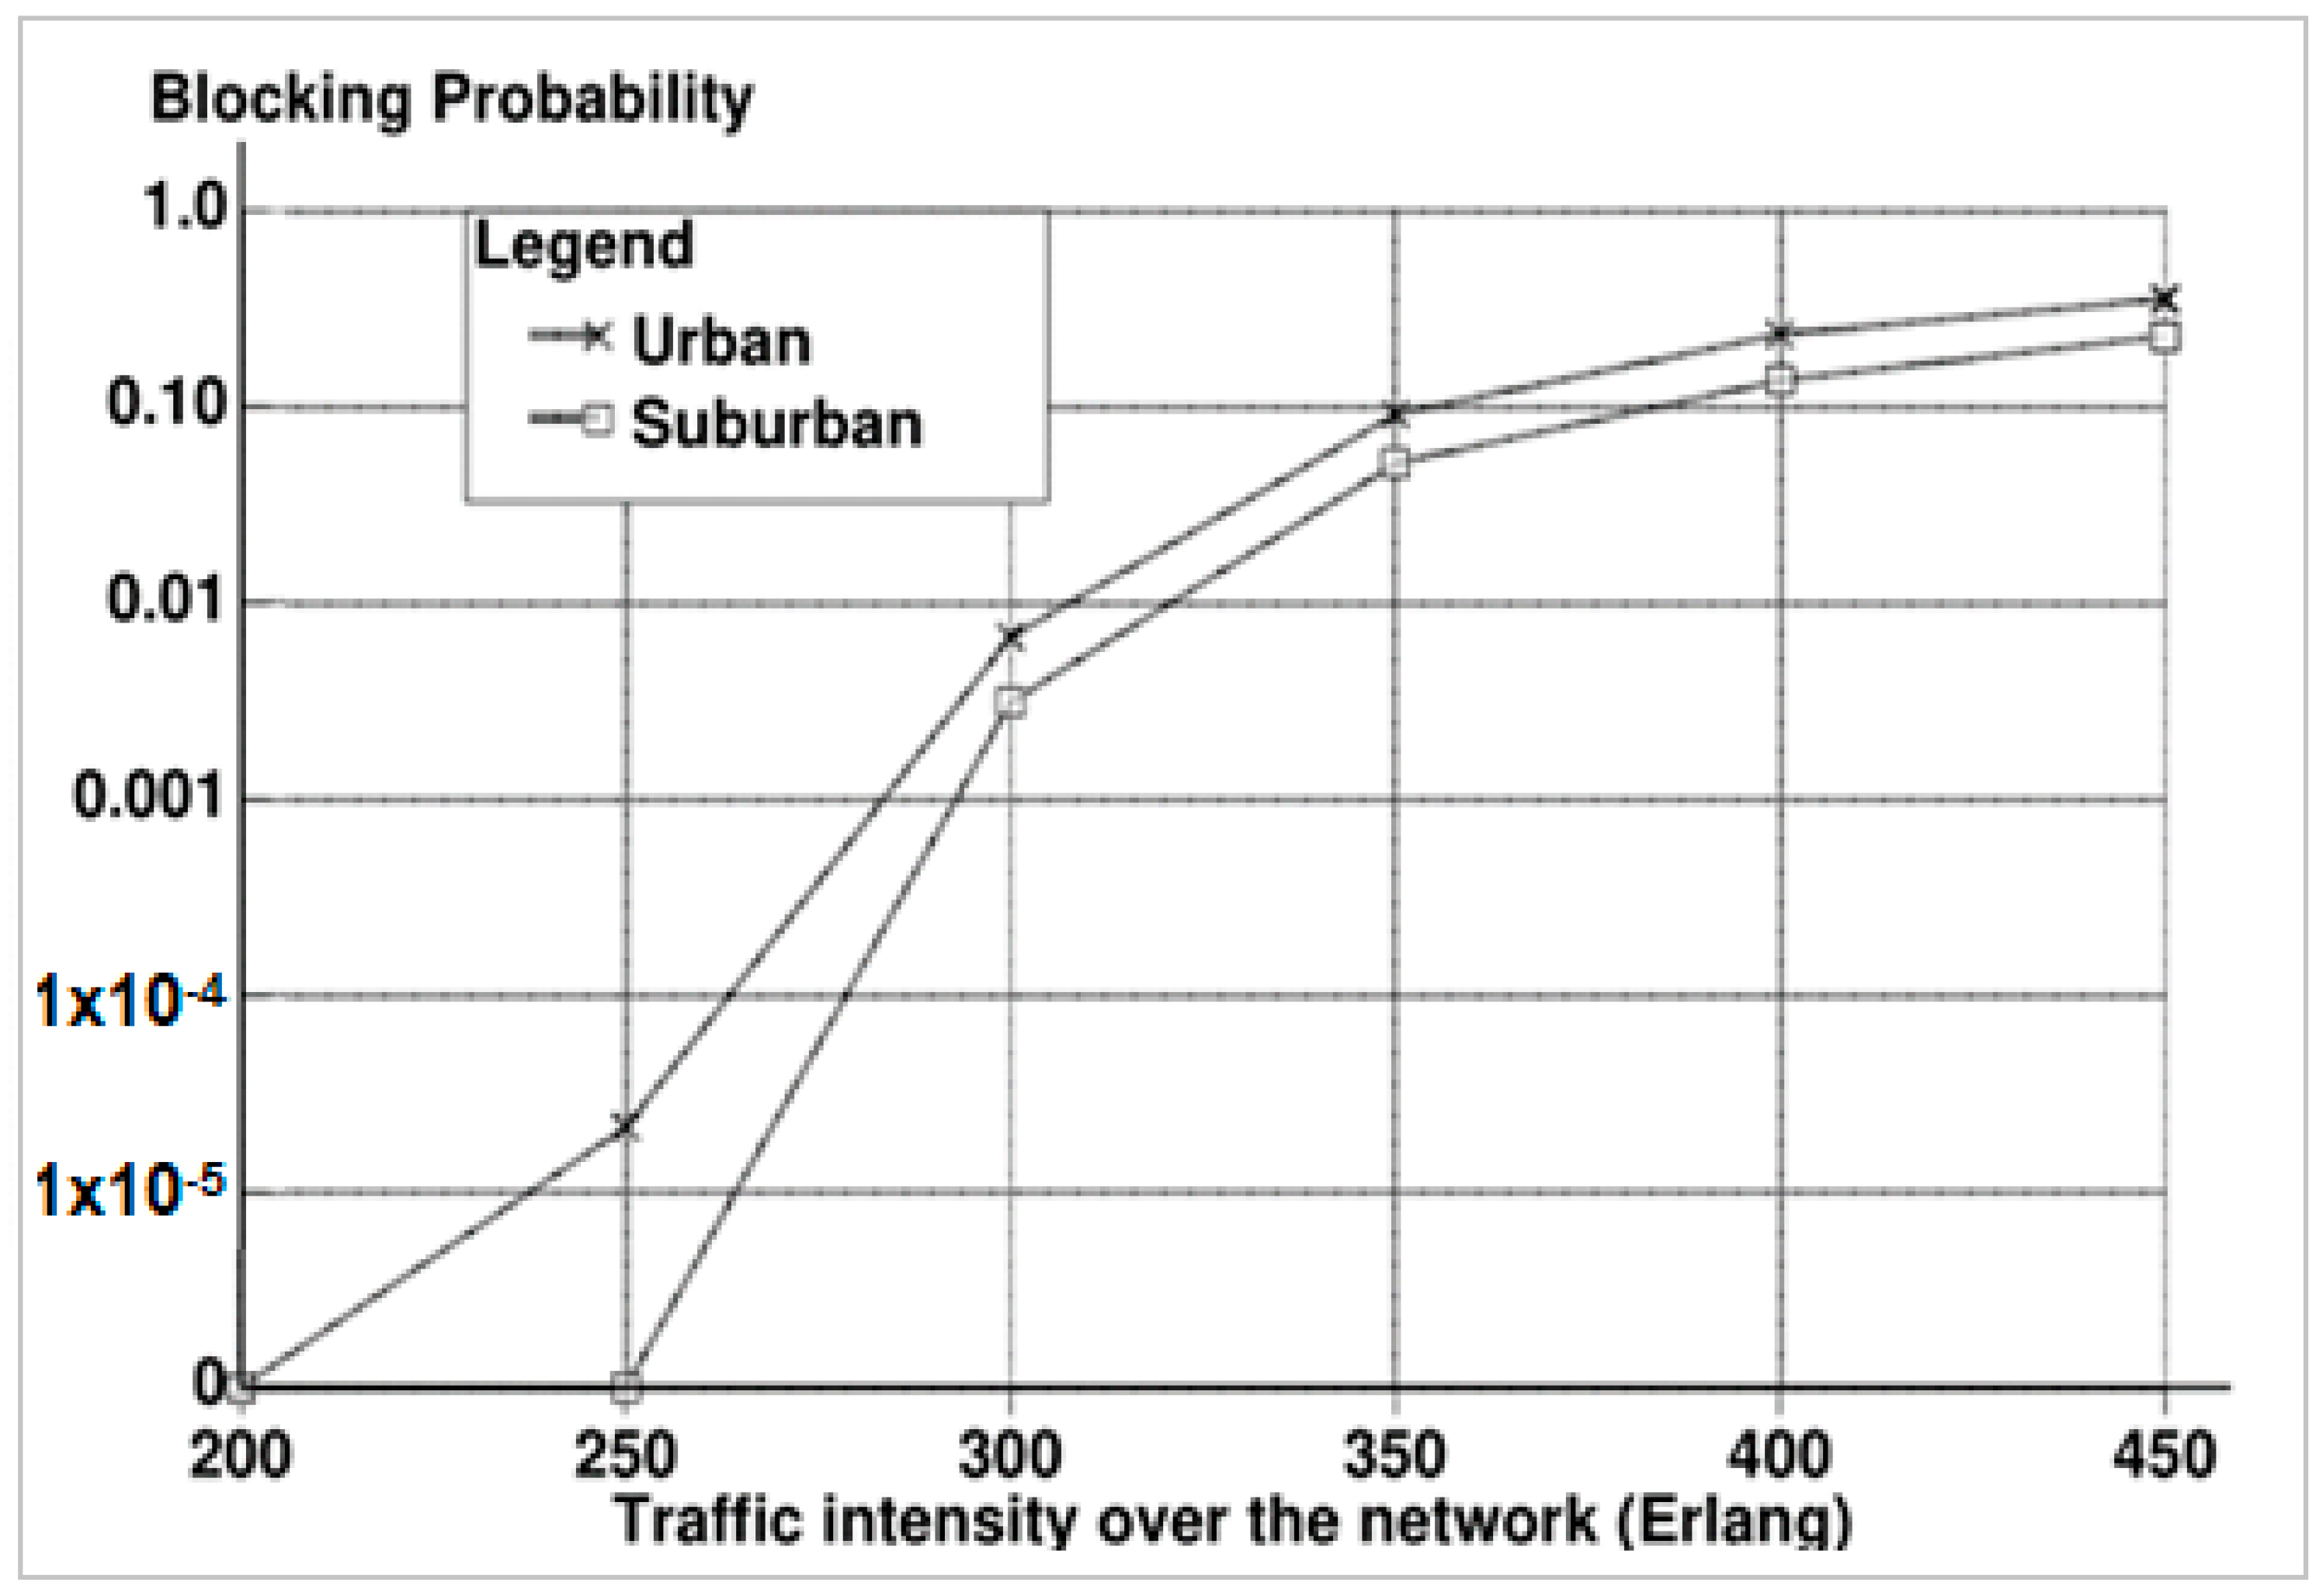
The first group of results is to study the effect of the non-orthogonality factor, ε on the network performance. As per Table 2, three values of ε are considered in the analysis: 0.30, 0.40, and 0.50. For each value, the network performance is evaluated by mainly two basic performance parameters, namely the blocking probability and the bandwidth utilization of the network. In Figure 5, ε is assumed to be 0.30. This level of interference is low and therefore, it can be noticed that at lower traffic load (<300 Erlang), low blocking probability values are obtained (at a maximum rate of 450 Erlang, it reaches around 0.10 for both environments) while maintaining high bandwidth utilization (a round 98%) values as shown in Figure 6 for both urban and suburban environments.
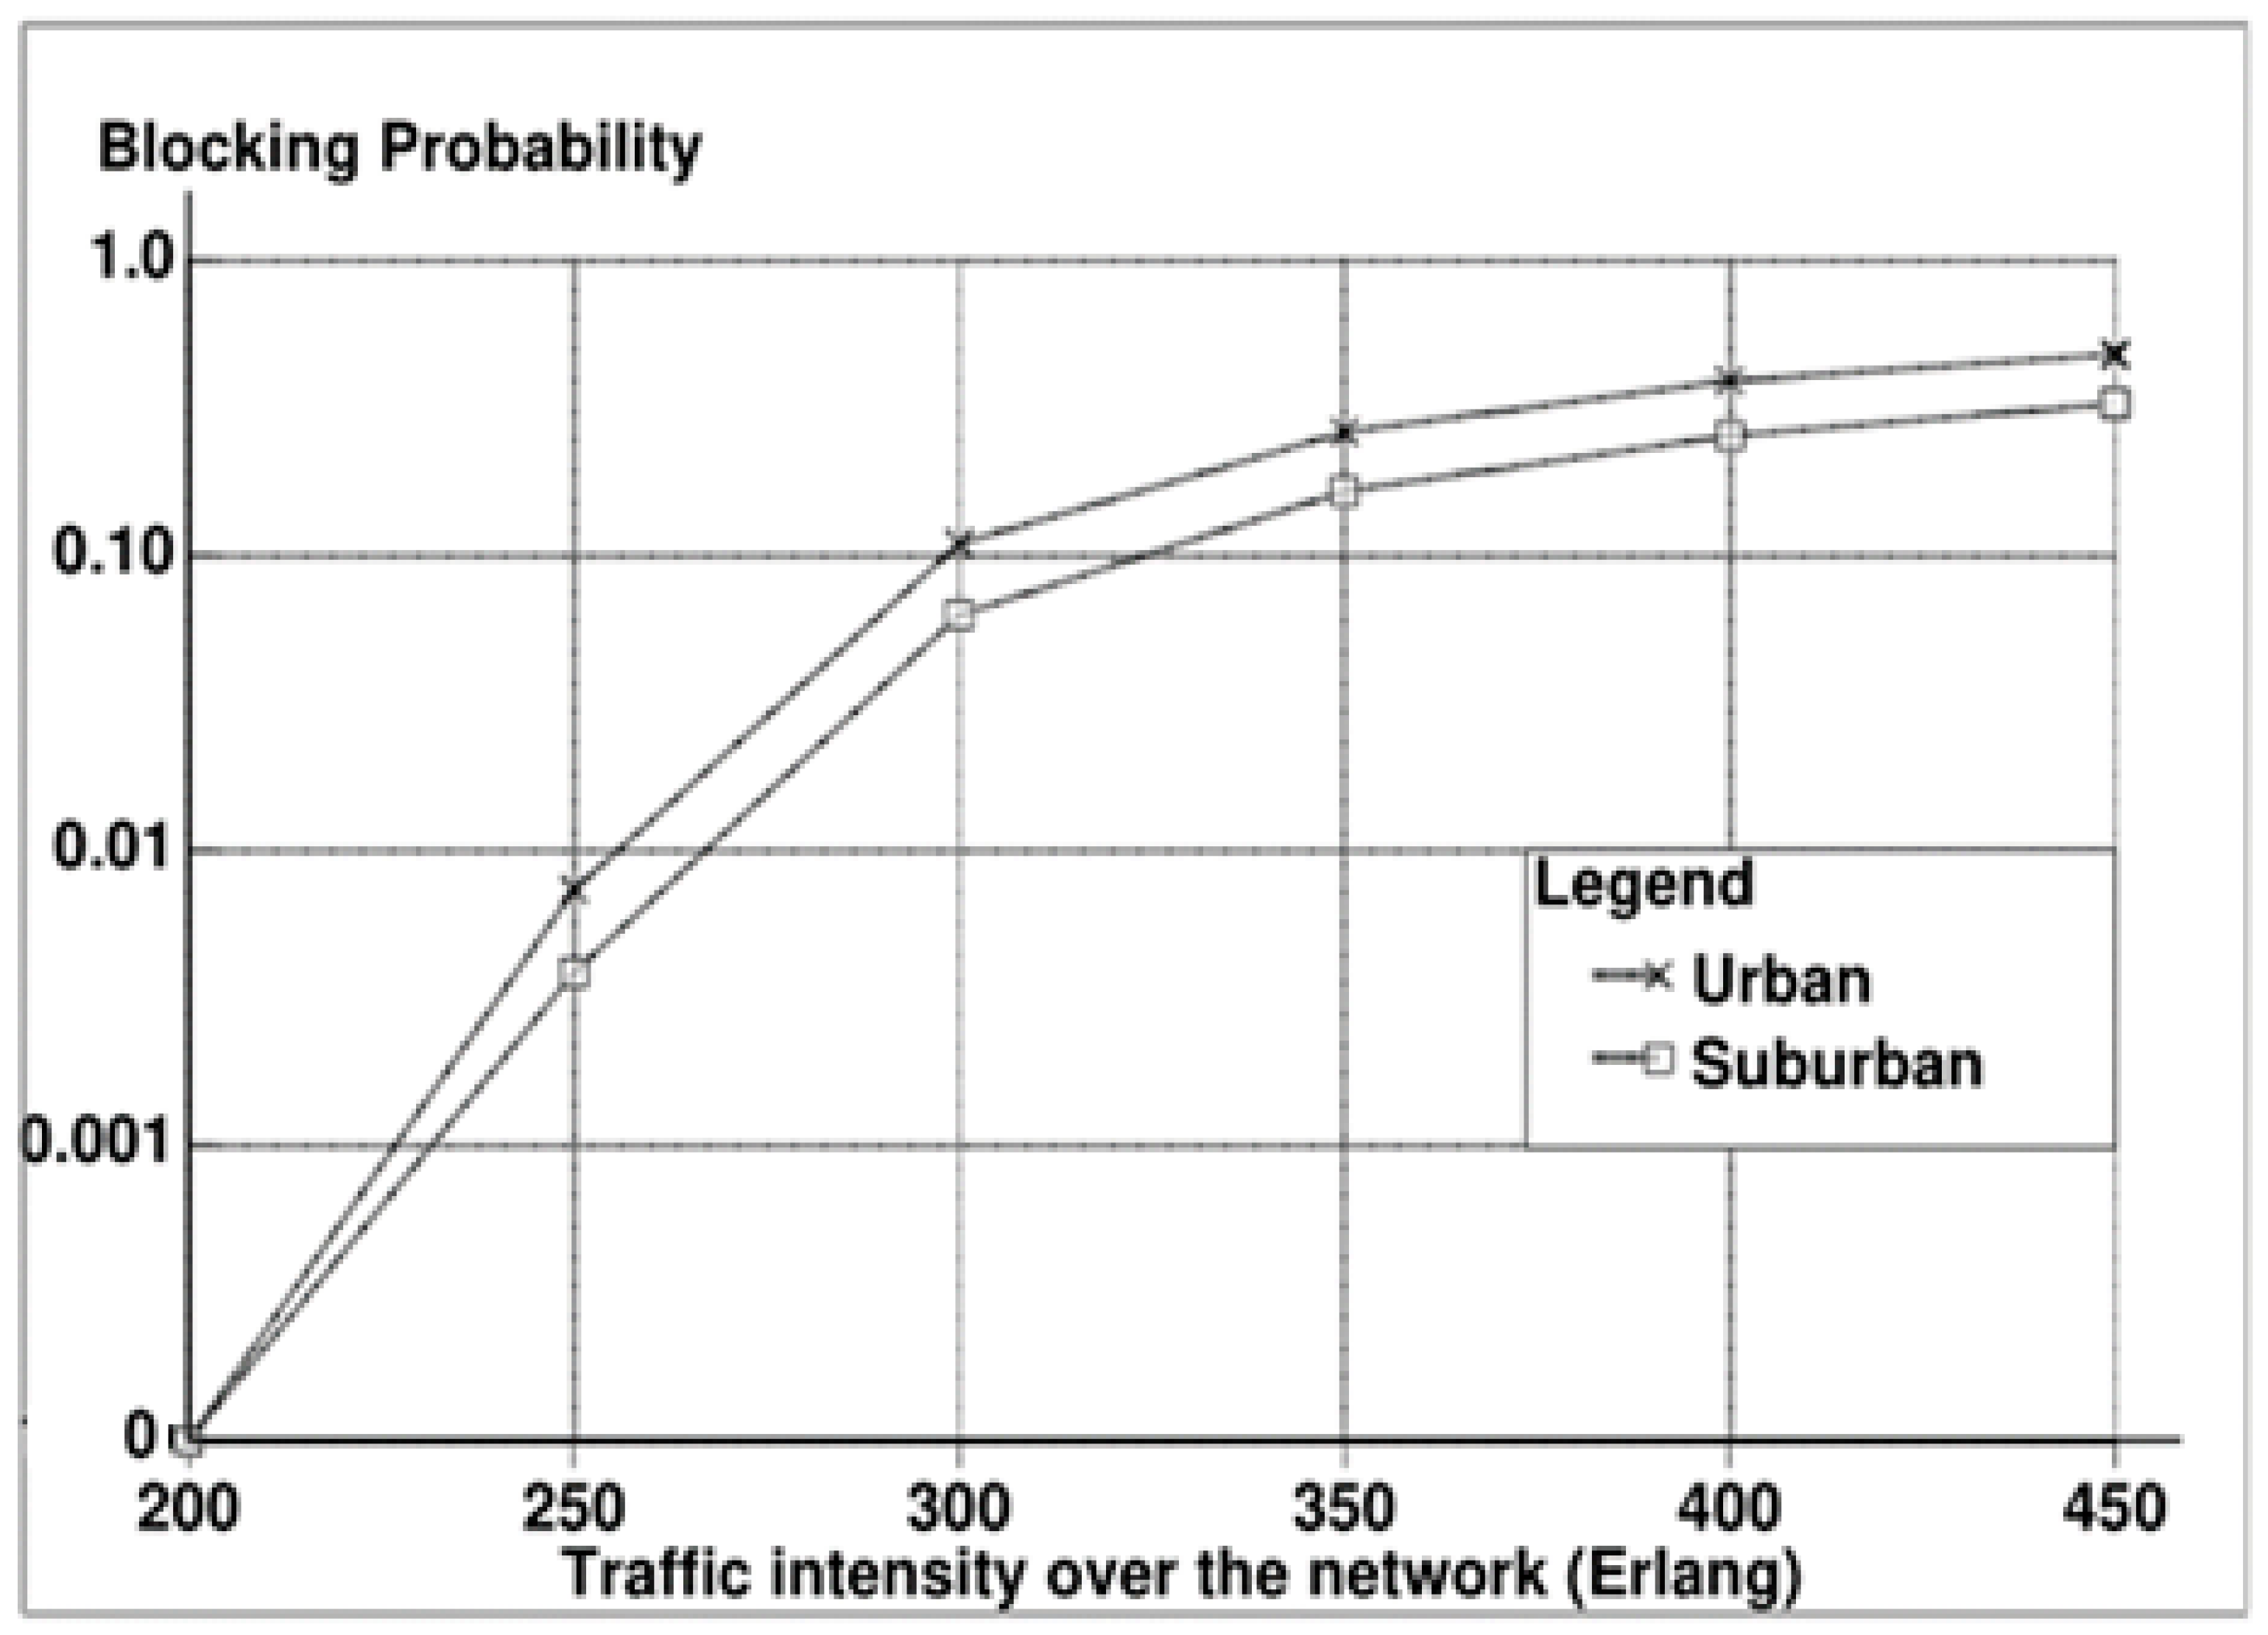
In Figure 7 and Figure 8, a moderate value of ε is assumed (ε = 0.40). We can notice that as the interference level increases, the performance of the network degrades accordingly, however, there is a slight increase in the blocking probability and a slight decrease in the bandwidth utilization. This small degradation in the performance is because the CACA is working effectively by balancing the load over the network. When the inner cell is overloaded, admissions are transferred from the heavily loaded areas (urban cells in this case) to the other neighboring cells (suburban cells). At a higher interference level (ε = 0.50), a clear degradation in the network performance regarding both the blocking probability and the bandwidth utilization can be noticed. On the other hand, we can observe from Figure 8 that the network reaches its maximum performance (around 70%) regarding bandwidth utilization very early (at lower rates (400 Erlang)) regardless of the type of the environment since values match both urban and suburban environments. This status occurs when the interference limit is high, even if the load is balanced, the network will not be able to process more jobs and therefore, most of the jobs will be blocked. Similar behavior appears in Figure 9 and Figure 10 but in this case, the interference factor is increased to (ε = 0.50). A higher interference factor degrades the network performance regarding the blocking probability and the utilization.
4.2. Effect of Load Concentration on the Inner Cell
The influence of load concentration on the inner cell is shown in Figure 11 and Figure 12. Two cases are considered, firstly when the load is doubled and secondly when the load is tripled against the outer cells. In both cases, the overall network load is the same. What is interesting about this is that, usually the CACA works in both cases to balance the load, therefore, no major effect of this increase can be noticed either in the urban cell or in the suburban cell.
4.3. Effect of Load Concentration on the Outer Cells
The influence of load concentration on the outer cells is shown in Figure 13 and Figure 14. Two cases are considered, firstly when the load is doubled and secondly when the load is tripled. Now, we can notice that a slight change appeared below traffic intensity of 250 Erlang compared to urban areas, afterwards, the lines for blocking probability and utilization are almost matching. This can be explained that suburban areas usually have less density of users compared to the urban areas and therefore, doubling or tripling the load does not make a big change since suburban areas are able to service most users and the users who are closer to cell border will make handover to be served by the neighboring cells. All of these actions will be controlled by the CACA who is responsible for balancing the load over the whole network regardless of the load concentration or the cell location.
4.4. Comparative Results
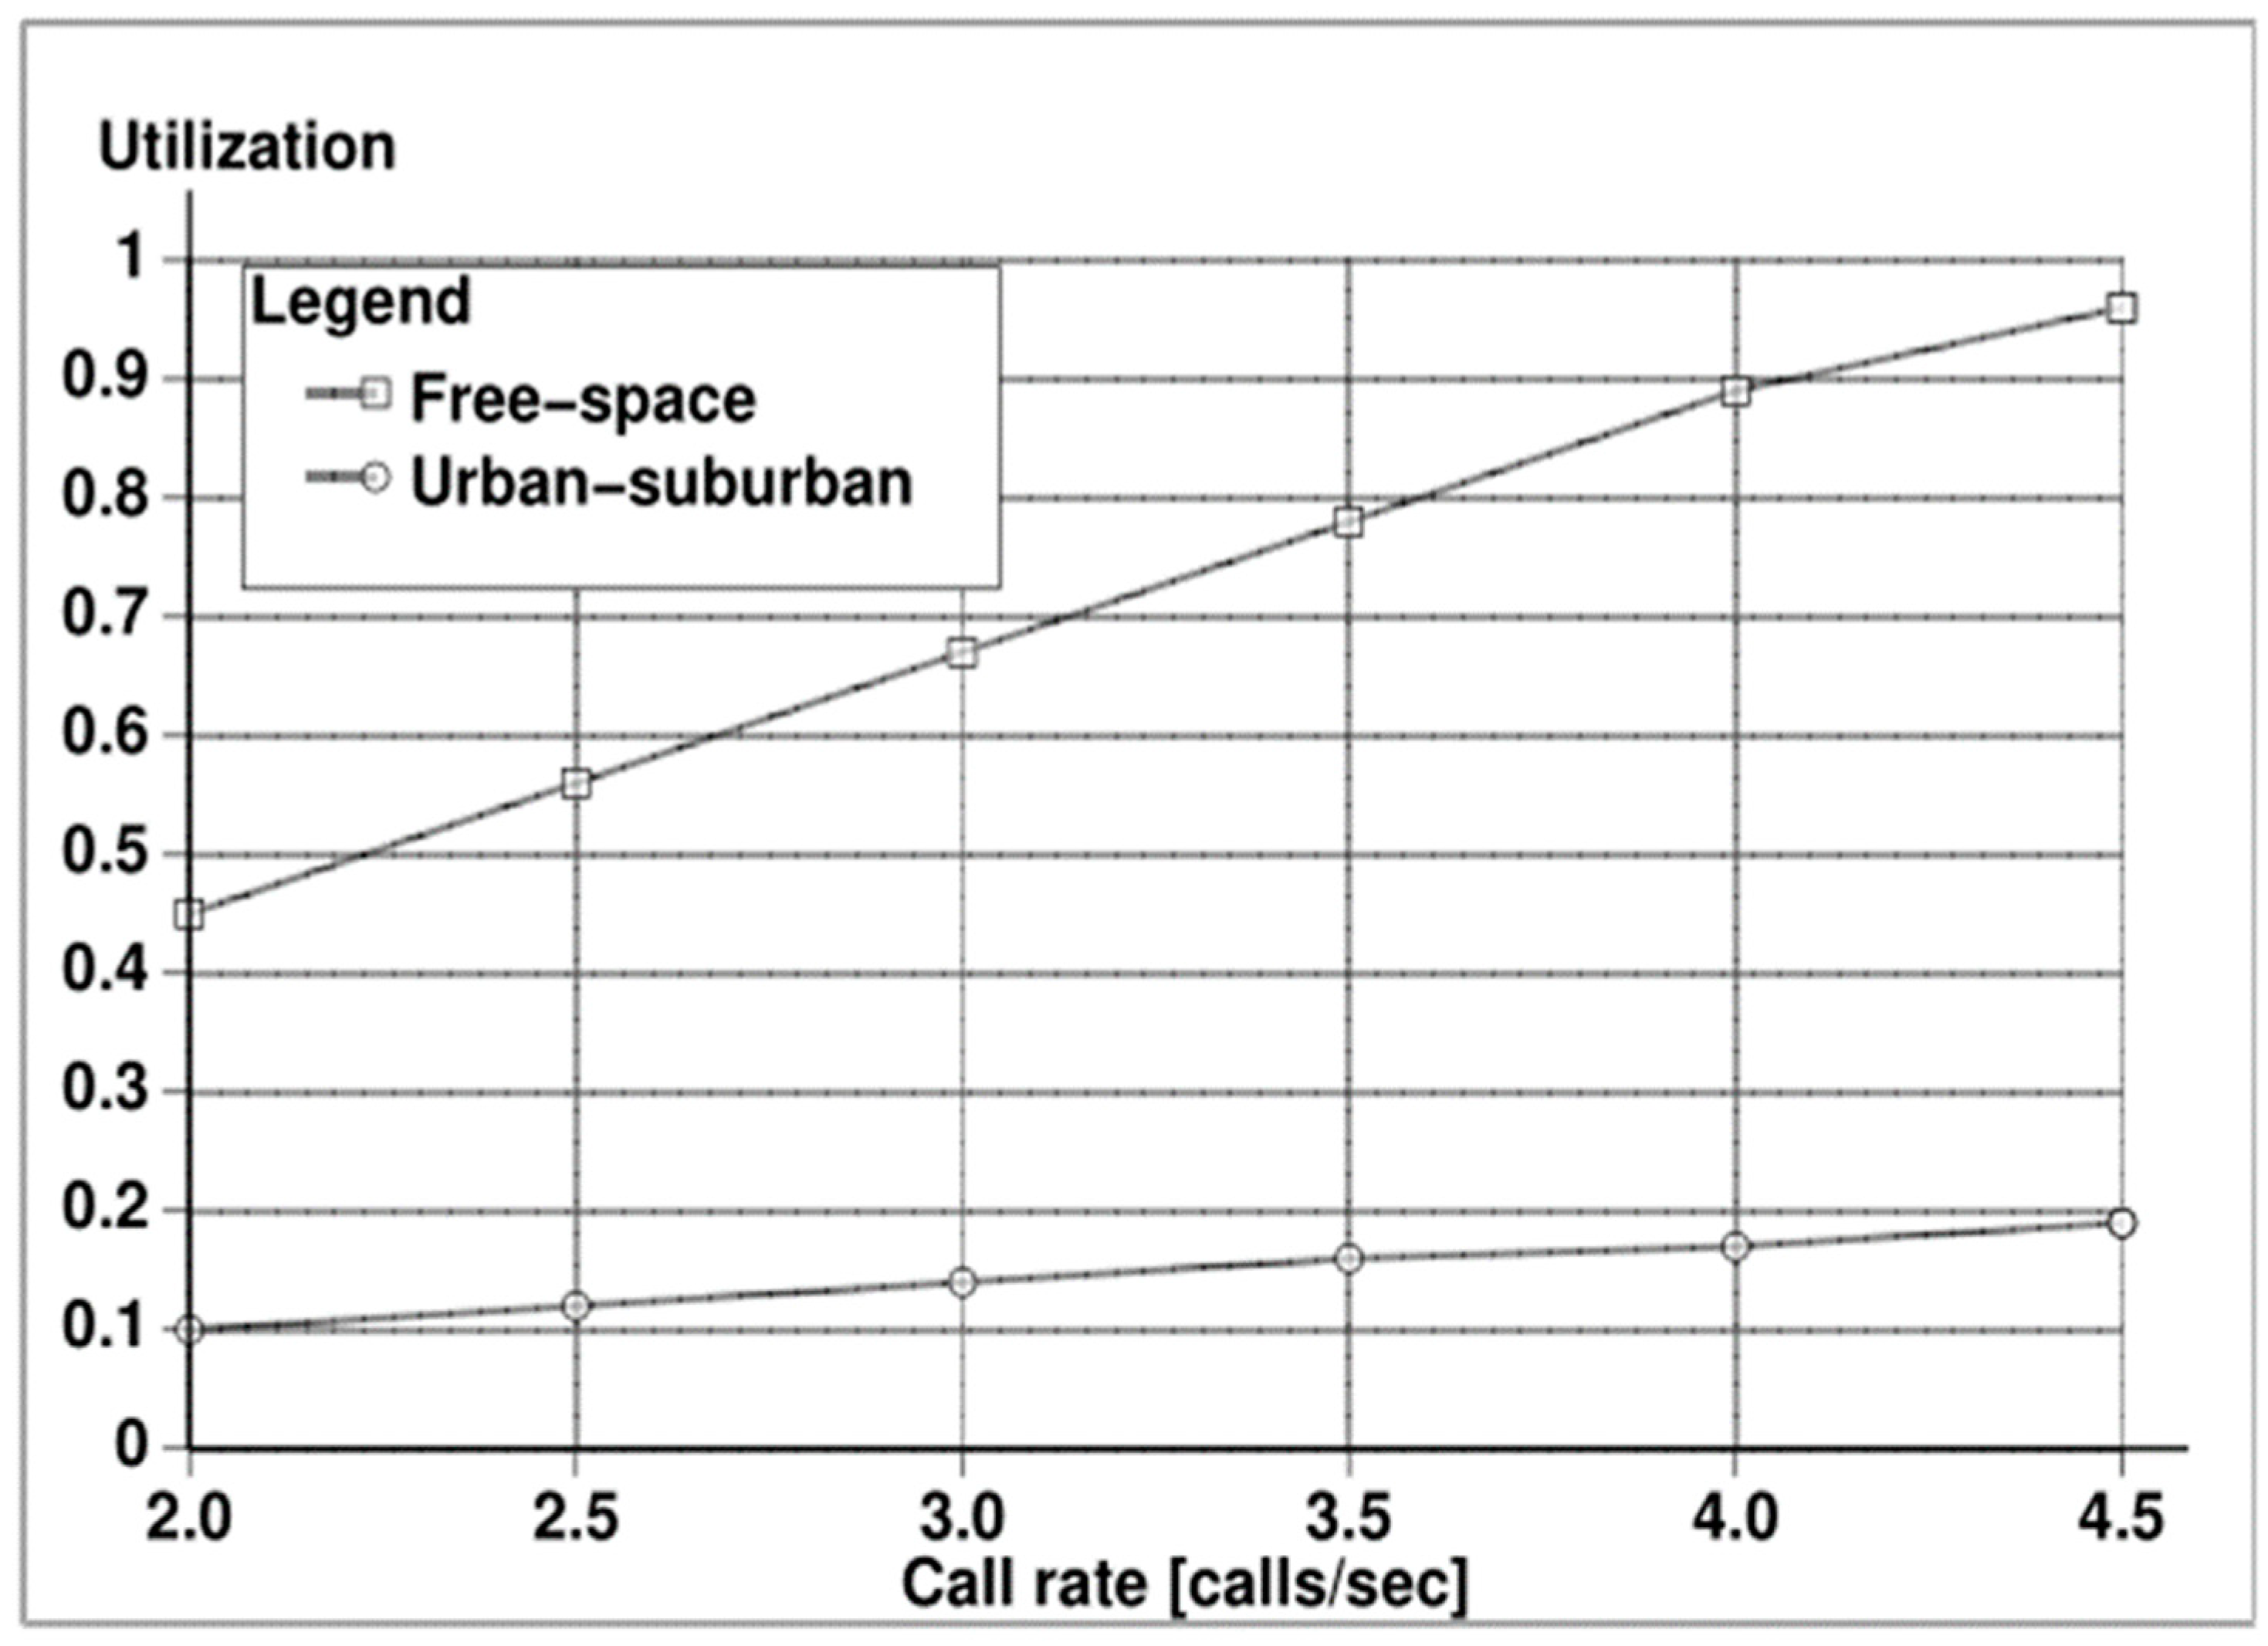
The next two sets of results (Figure 15 and Figure 16). Comparative results are discussed to compare the performance of an ideal environment (i.e., free space) where no propagation is considered with a more realistic environment (i.e., urban-suburban). It can be noticed from Figure 15 that starting from Erlang 250, the performance of the network is significantly affected concerning the blocking probability in Figure 15 and the bandwidth utilization in Figure 16. This is expected as in a more realistic environment, the signal is attenuated due to the obstacles caused by the propagation mechanisms such as scattering, reflection, and diffraction.
4.5. Effect of the Height of the Mobile, hm and the Height of the Base Station, hb
The effect of the height of the mobile (hm) and the height of the base station (hb) is discussed in the last set of Figure 17, Figure 18, Figure 19 and Figure 20. Figure 17 and Figure 18 show the effect of the height of the mobile on the performance regarding both the blocking probability in Figure 17 and the bandwidth utilization in Figure 18. Two values of hm are considered (5 m in a suburban cell and 10 m in an urban cell). Now, a higher value of hm in urban areas is expected since the urban area has high buildings, and the system starts behaving like in the free-space propagation model as there will be many connections in the line-of-sight with Node B. In this case, the network performance reaches a stable state. At a lower rate, the suburban area has better performance, starting to be matched for both environments at higher rates. The network performance regarding hb (Node B) is given in Figure 19 and Figure 20 for the urban environment concerning three values of height, namely 50 m, 100 m, and 150 m. It can be noticed that increasing Node B height can reduce the blocking probability and increase the bandwidth utilization, however, no dramatic increase is noticed. Therefore, we can conclude that this issue is considered an optimization factor regarding cost performance and should be considered in the planning of 5G design and infrastructure.
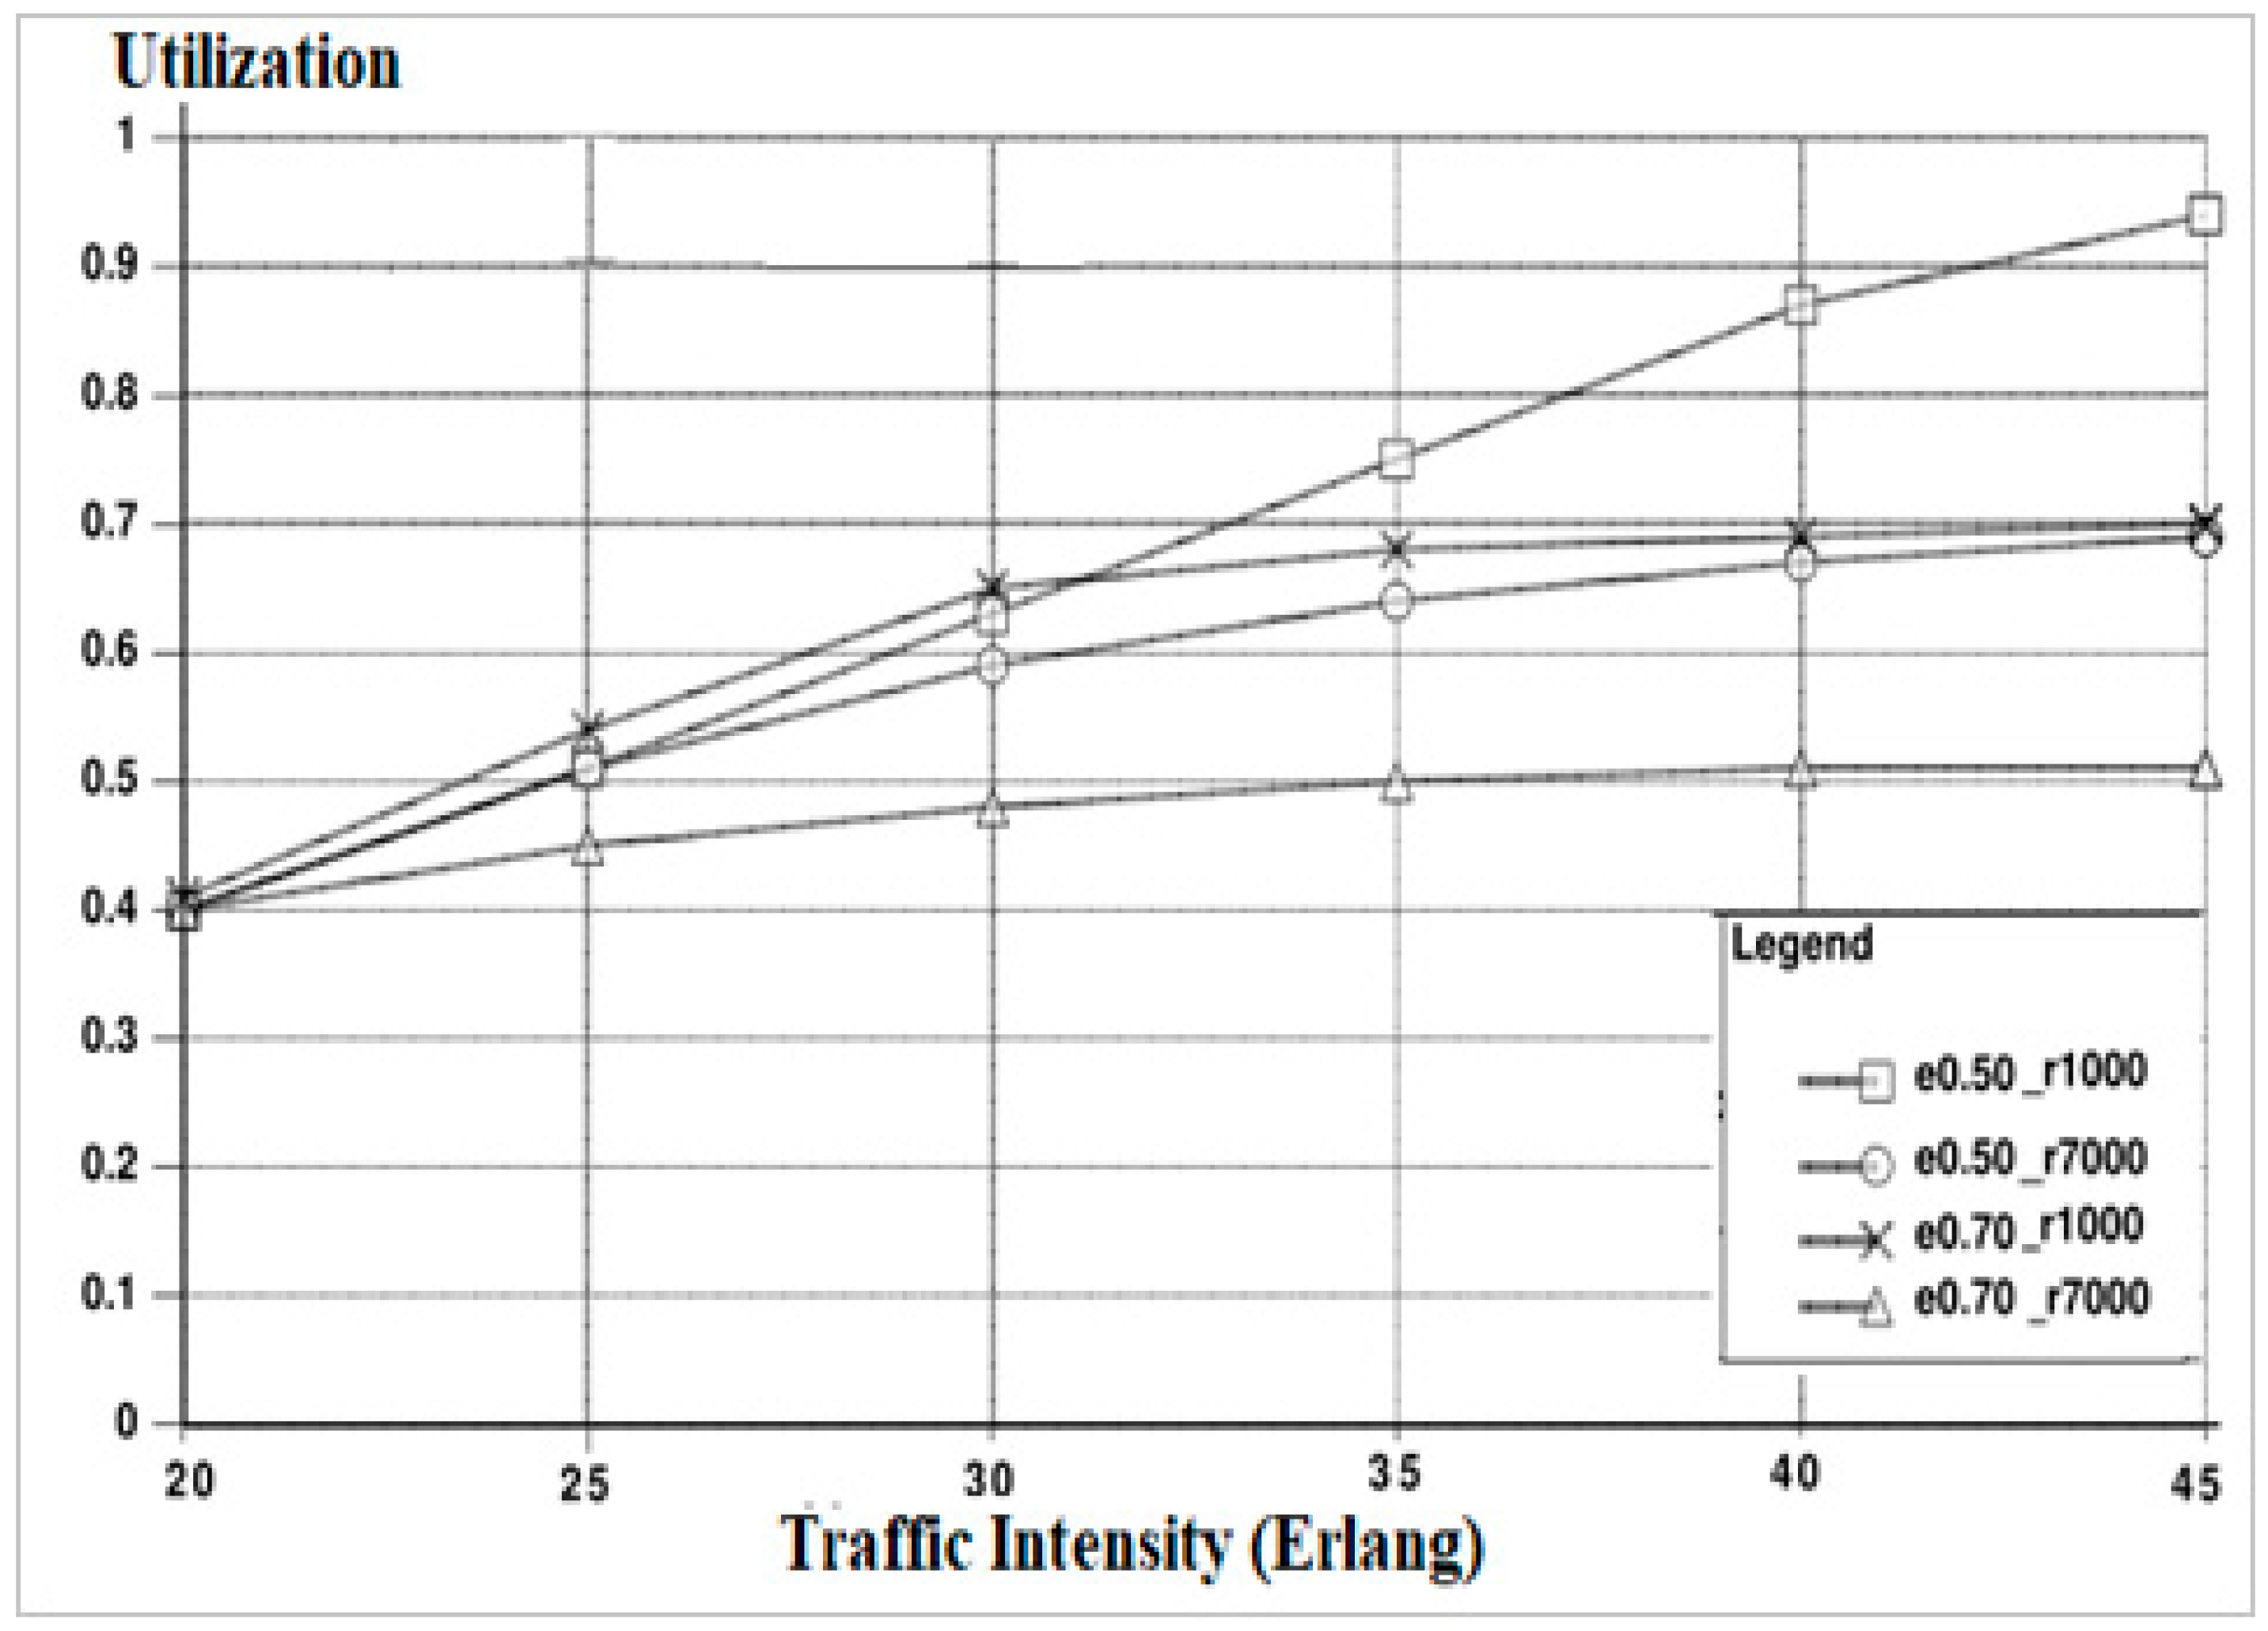
4.6. Effect of the Cell Raduis, r on the Network Performance
To study the effect of the cell radius on the network performance, we introduce here Figure 21, Figure 22 and Figure 23. The blocking probability is introduced in Figure 21. Two different cell radius values are considered (r = 1 & 7 km) with two interference values (ε = 0.50 & 0.70). It can be noticed that with the low value of the interference, the lower the cell radius, the better. When the cell radius is low this means the coverage of the cell is reduced and therefore a smaller number of users are admitted and requested a service at the cell. This is why ideal values of the blocking probability are obtained. Only 0.10 blocking value is obtained at the maximum traffic intensity of 45 Erlang. On the other hand, a round 90% blocking is obtained at the same traffic intensity when the radius of the cell is increased to 7 km under high interference value (ε = 0.70). As per our suggested model and considering real life status, urban areas have less cell radius compared to suburban areas and therefore, the impact of signal penetration due to the propagation phenomena is higher compared to suburban areas. Similar results are obtained for the utilization values in Figure 22. At maximum traffic intensity, the utilization exceeds 90%. Because the propagation effect in urban areas is more than suburban areas, the capacity of the cell degrades when the cell radius is small as shown in Figure 23. At a cell radius of around 8 km, less than 50 users are covered and receive service. On the other hand, at a cell radius of around 15 km, more than 150 users are covered.
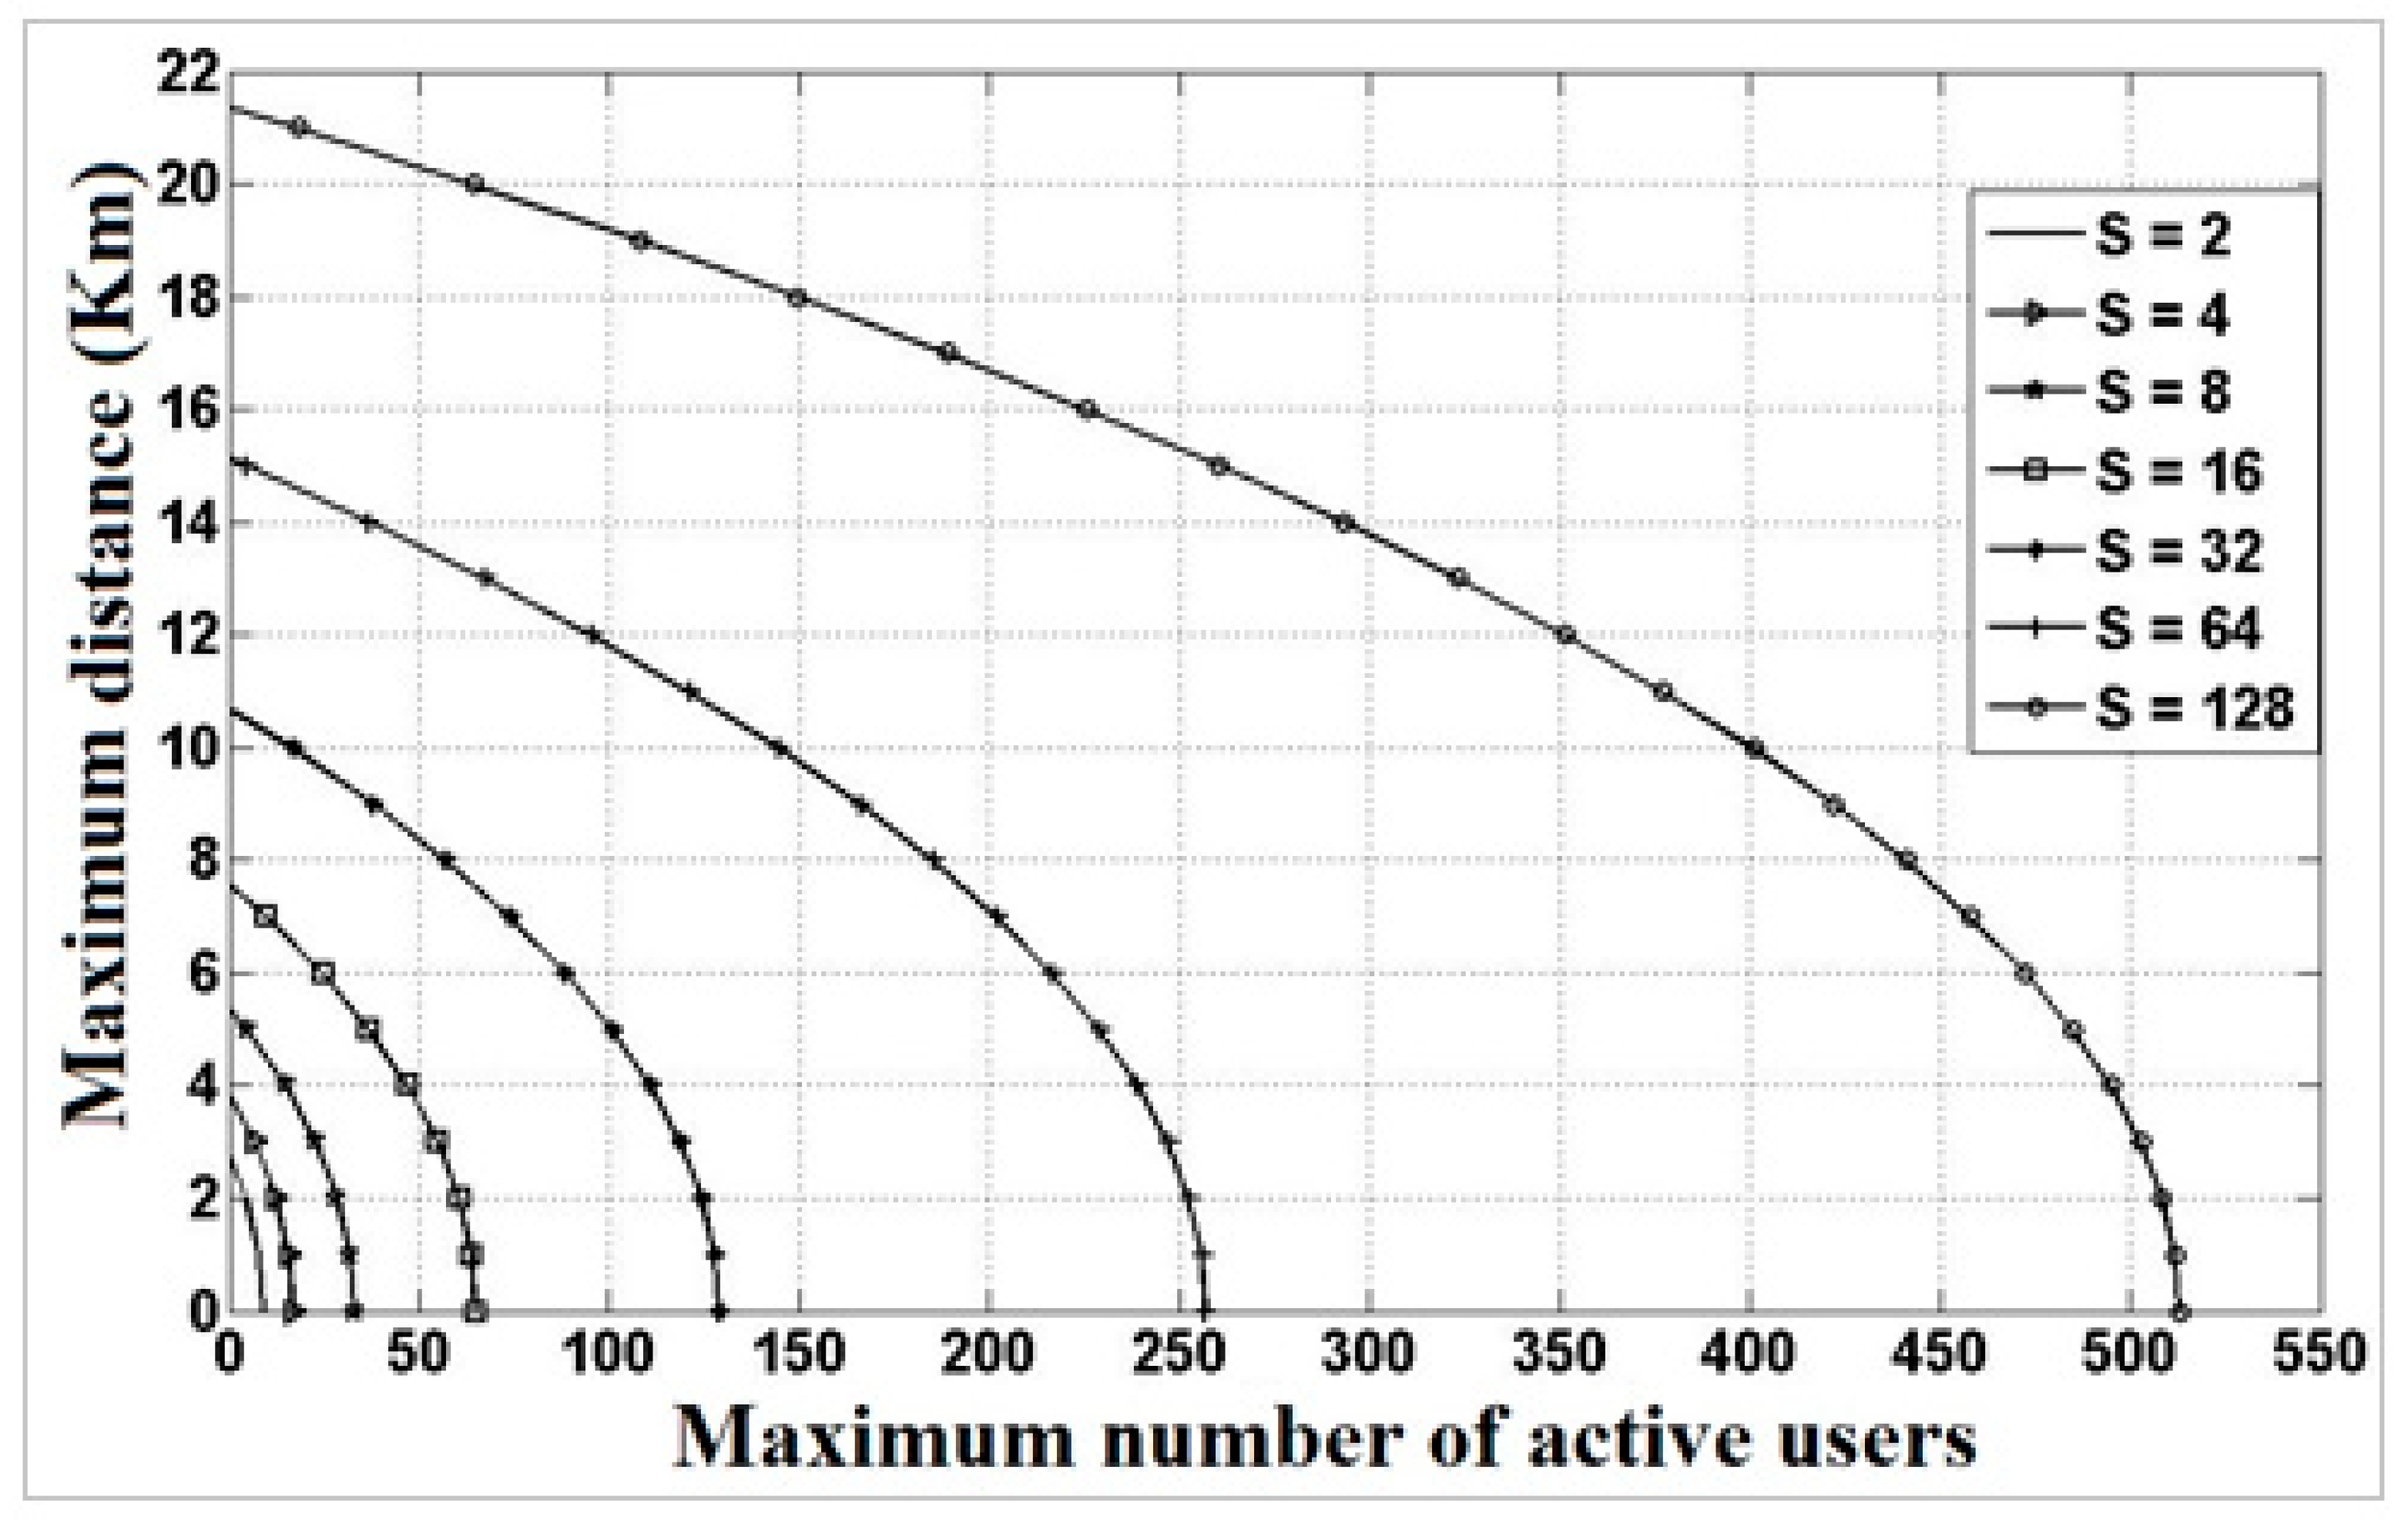
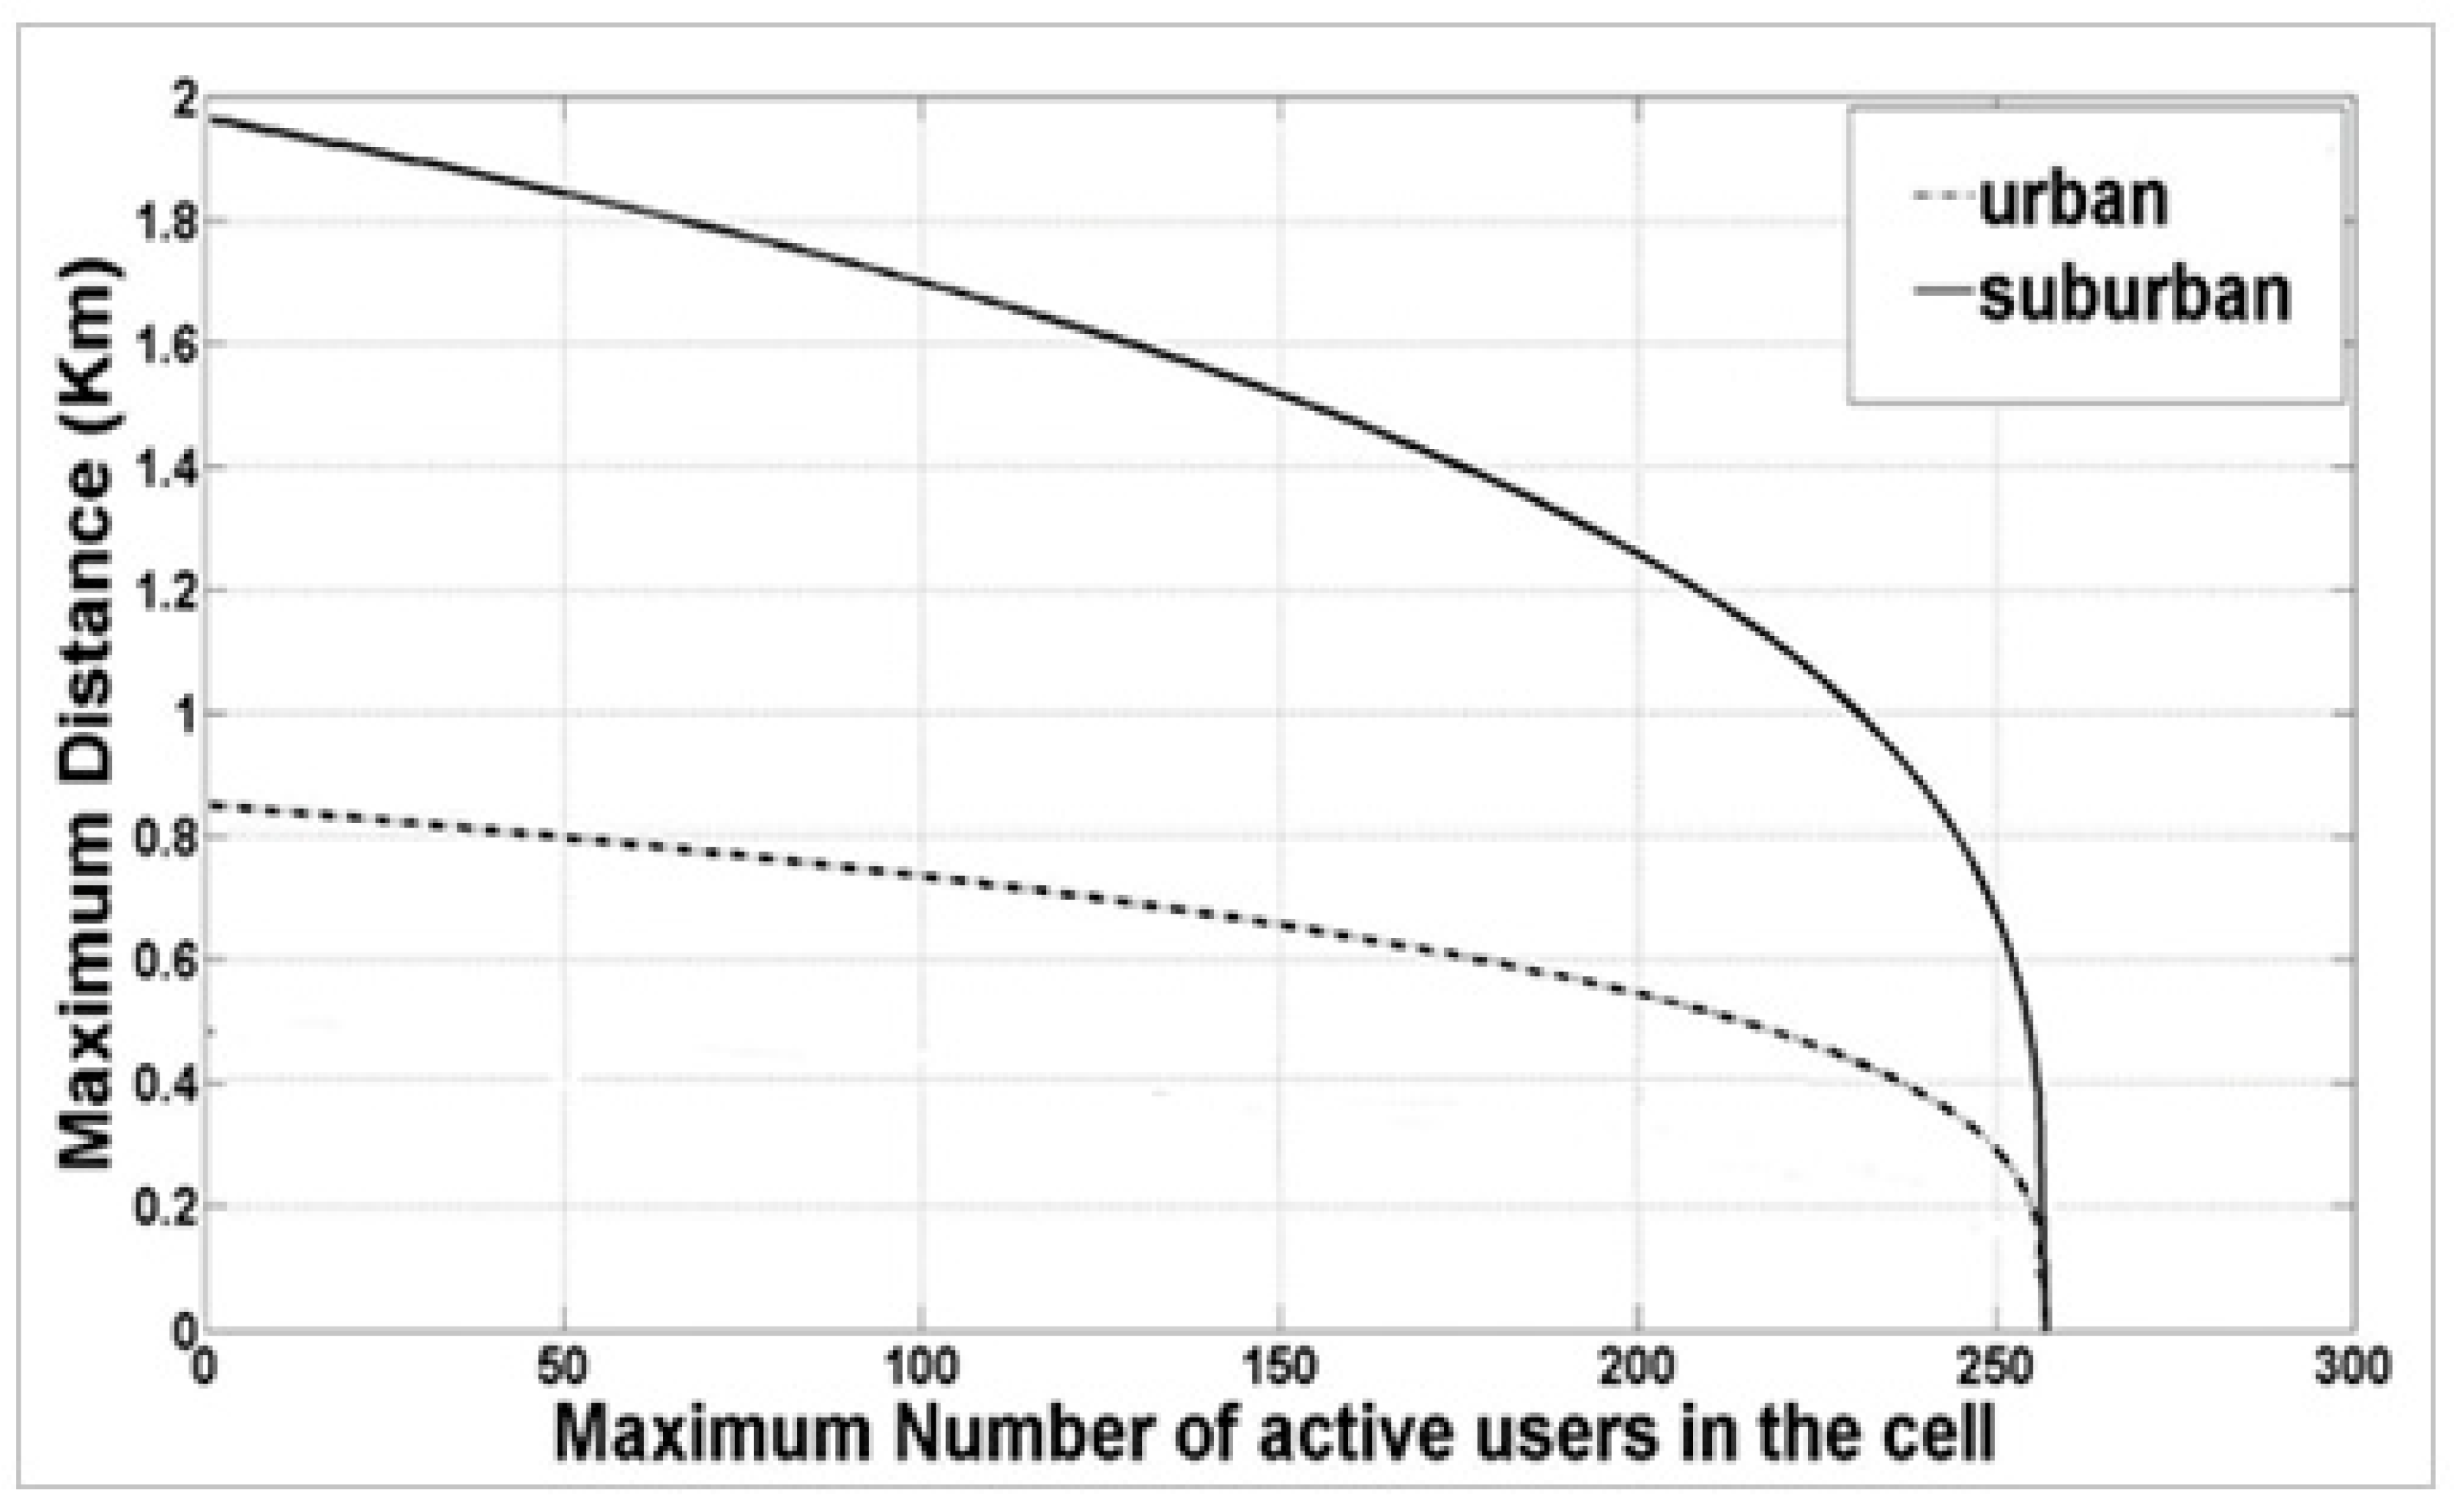
4.7. Effect of the Maximu Distance, dmax on the Network Performance
Two figures are presented in this section. The first figure (Figure 24) demonstrates the maximum distance, dmax effect on the performance. It can be noticed that the capacity of the cell is improved when the value of dmax is higher because in this case more users can be admitted to the system. For example, at a maximum distance of more than 20 km, more than 500 users are admitted to the system, compared to around 250 users at a distance around 15 km. This parameter is used in the CACA. A new user is admitted to the system only if the distance, d is less than the maximum distance, dmax. Figure 25 demonstrates the effect of dmax on the system capacity specifically for urban-suburban environments. It can be noticed that a maximum capacity (250 users) can be achieved in urban cells at low distance (less than 1 km), while the same capacity is obtained in suburban areas at a distance of almost 2 km. This is clear since urban areas have more traffic intensity and less propagation effect compared to a suburban area and therefore, more users will be admitted.
5. Conclusions and Future Work
5G is the latest iteration of cellular wireless networks. It is the new technology that covers the exponential growth in mobile data and traffic. Despite the great potential of the mmWave band in 5G which is between 30 to 300 GHz, it has been considered effective in short-range indoor communication rather than long-term communication due to the poor penetration through solid materials. Therefore, performance analysis and evaluation of such systems are considered to be crucial to understanding the network performance. The main goal of this research is to study the effect of different performance indicators on 5G performance and capacity. These indicators can be introduced to mobile operators to be considered as planning factors in the design of 5G network. Therefore, a new realistic model is proposed in this work to evaluate 5G performance. The model is formed of a network structure of a seven-cell cluster with a central urban (hot spot) cell surrounded by six suburban cells. With the proposed model, the end-user can have continuous connectivity under different propagation environments. Based on the suggested model, the related capacity bounds are derived and the performance of the 5G network is studied via a simulation considering different parameters that affect the performance such as the non-orthogonality factor, the load concentration in the central urban cell, the height of the mobile, the height of the base station the radius, and the distance between base stations. Blocking probability and bandwidth utilization are the main two performance measures that are studied, however, the effect of the above parameters on the system capacity is also introduced. The provided numerical results that are based on a network-level call admission control algorithm reveal the fact that the investigated parameters have a major influence on the network performance. Therefore, the outcome of this research can be a very useful tool to be considered by mobile operators in the network planning of 5G.
The current work can be extended in the future as follows. Firstly, different scenarios of the traffic can be studied such as uniform and non-uniform distribution over the network. Secondly, the mobility model can be incorporated in the suggested scenario to reflect the real-life nature of the current system. In this regard, 5G seamless soft-handover will be implemented and the effect of mobility on the network performance will be studied. Finally, a coexistence scenario of 5G/WiFi similar to the one proposed in [43] can be suggested in a future work to study the effect of this coexistence on 5G performance.
Author Contributions
A.I.Z. and S.M. were involved in the process of preparing the manuscript. Conceptualization; methodology; software; validation; formal analysis; investigation; resources; writing—original draft preparation; review and editing. All authors have read and agreed to the published version of the manuscript.
Funding
This research received no external funding.
Data Availability Statement
The original contributions presented in the study are included in the article, further inquiries can be directed to the corresponding author/s.
Conflicts of Interest
The authors declare no conflicts of interest.
References
- Shehab, M.J.; Kassem, I.; Kutty, A.A.; Kucukvar, M.; Onat, N.; Khattab, T. 5G Networks Towards Smart and Sustainable Cities: A Review of Recent Developments, Applications and Future Perspectives. IEEE Access 2021, 10, 2987–3006. [Google Scholar] [CrossRef]
- Sanchez, J.M. Mobile revolution: From 2G to 5G. In Proceedings of the 2021 IEEE Colombian Conference on Communications and Computing (COLCOM), Cali, Colombia, 26–28 May 2021; pp. 1–6. [Google Scholar] [CrossRef]
- Nanda, I.; Dey, R. An Analysis of 5G Wireless Networks. Information Management and Computer Science (IMCS). Inf. Manag. Comput. Sci. 2022, 5, 38–40. [Google Scholar] [CrossRef]
- Li, B.; Zhao, Q.; Jiao, S.; Liu, X. DroidPerf: Profiling Memory Objects on Android Devices. In Proceedings of the 29th Annual International Conference on Mobile Computing and Networking. Association for Computing Machinery, Madrid, Spain, 2–6 October 2023; Article 6. pp. 1–15. [Google Scholar] [CrossRef]
- He, L.; Guo, Q.; Zhong, J.; Wang, X. 5G Network Performance Analysis and Verification Based on Ubiquitous Electricity Internet of Things. In Proceedings of the 2020 IEEE 4th Information Technology, Networking, Electronic and Automation Control Conference (ITNEC), Chongqing, China, 12–14 June 2020; pp. 1–6. [Google Scholar] [CrossRef]
- MMalekzadeh, M. Performance prediction and enhancement of 5G networks based on linear regression machine learning. EURASIP J. Wirel. Commun. Netw. 2023, 2023, 74. [Google Scholar] [CrossRef]
- Bhardwaj, K.; Singh, A.; Sachan, V.K. 5G: An overview of Channels characteristics and modelling techniques. In Proceedings of the 2018 Fifth International Conference on Parallel, Distributed and Grid Computing (PDGC), Solan, India, 20–22 December 2018; pp. 400–405. [Google Scholar] [CrossRef]
- Akhpashev, R.V.; Drozdova, V.G. The Realistic 5G New Radio Coverage Analysis for Urban Area. In Proceedings of the 2022 Ural-Siberian Conference on Biomedical Engineering, Radioelectronics and Information Technology (USBEREIT), Yekaterinburg, Russia, 19–21 September 2022; pp. 145–147. [Google Scholar] [CrossRef]
- Lazar, R.G.; Militaru, A.V.; Caruntu, C.F.; Patachia–Sultanoiu, C. Performance analysis of 5G communication based on distance evaluation using the SIM8200EA-M2 module. In Proceedings of the 2022 26th International Conference on System Theory, Control and Computing (ICSTCC), Sinaia, Romania, 19–21 October 2022; pp. 37–42. [Google Scholar] [CrossRef]
- Nwajana, A.O. 5G Internet of Things and Changing Standards for Computing and Electronic Systems; IGI Global: Hershey, PA, USA, 2022. [Google Scholar] [CrossRef]
- 3rd Generation Partnership Project (3GPP). 5G System Overview. Available online: https://www.3gpp.org/technologies/5g-system-overview (accessed on 18 February 2024).
- Parkvall, S.; Dahlman, E.; Furuskar, A.; Frenne, M. NR: The New 5G Radio Access Technology. IEEE Commun. Stand. Mag. 2017, 1, 24–30. [Google Scholar] [CrossRef]
- Marsch, P.; Da Silva, I.; Bulakci, O.; Tesanovic, M.; El Ayoubi, S.E.; Rosowski, T.; Kaloxylos, A.; Boldi, M. 5G Radio Access Network Architecture: Design Guidelines and Key Considerations. IEEE Commun. Mag. 2016, 54, 24–32. [Google Scholar] [CrossRef]
- Jing, S.; Wang, H. Design and Implementation of a 5G Network Architecture Based on Software Defined Network. In Proceedings of the 2023 IEEE 3rd International Conference on Electronic Technology, Communication and Information (ICETCI), Changchun, China, 26–28 May 2023; pp. 1444–1449. [Google Scholar] [CrossRef]
- Khan, S.K.; Naseem, U.; Sattar, A.; Waheed, N.; Mir, A.; Qazi, A.; Ismail, M. UAV-aided 5G Network in Suburban, Urban, Dense Urban, and High-rise Urban Environments. In Proceedings of the 2020 IEEE 19th International Symposium on Network Computing and Applications (NCA), Cambridge, MA, USA, 24–27 November 2020; pp. 1–4. [Google Scholar] [CrossRef]
- Gharib, M.; Hopkins, B.; Murrin, J.; Koka, A.; Afghah, F. 5G Wings: Investigating 5G-Connected Drones Performance in Non-Urban Areas. In Proceedings of the 2023 IEEE 34th Annual International Symposium on Personal, Indoor and Mobile Radio Communications (PIMRC), Toronto, ON, Canada, 5–8 September 2023; pp. 1–6. [Google Scholar] [CrossRef]
- Matos, R.L.S.; Luján, E.; Mocskos, E.E. Performance of D2D/NB-IOT Communications in Urban and Suburban Environments. In Proceedings of the 2021 Winter Simulation Conference (WSC), Phoenix, AZ, USA, 12–15 December 2021; pp. 1–12. [Google Scholar] [CrossRef]
- Gonsioroski, L.; Da Silva Mello, L.; Santos, A.B.D. Measurements and Modeling of the Mobile Wireless Channel at 2.4 GHz in Urban and Suburban Areas. In Proceedings of the 2021 IEEE 32nd Annual International Symposium on Personal, Indoor and Mobile Radio Communications (PIMRC), Helsinki, Finland, 13–16 September 2021; pp. 873–879. [Google Scholar] [CrossRef]
- Huang, J.; Wang, C.-X.; Yang, Y.; Liu, Y.; Sun, J.; Zhang, W. Channel Measurements and Modeling for 400–600-MHz Bands in Urban and Suburban Scenarios. IEEE Internet Things J. 2021, 8, 5531–5543. [Google Scholar] [CrossRef]
- Huttunen, J.; Parssinen, M.; Heikkila, T.; Salmela, O.; Manner, J.; Pongracz, E. Base Station Energy Use in Dense Urban and Suburban Areas. IEEE Access 2023, 11, 2863–2874. [Google Scholar] [CrossRef]
- Hassan, S.A.; Omar, M.S.; Imran, M.A.; Qadir, J.; Jayakody, D.N.K. Universal Access in 5G Networks: Potential Challenges and Opportunities for Urban and Rural Environments. In 5G Networks: Fundamental Requirements, Enabling Technologies, and Operations Management; John Wiley & Sons: Hoboken, NJ, USA, 2018; pp. 299–326. [Google Scholar] [CrossRef]
- Hassan, S.A.; Omar, M.S.; Imran, M.A.; Qadir, J.; Jayako, D. Performance Enhancement of 5G Networks Using AI-Driven Techniques. Int. J. Appl. Res. Technol. 2023, 12, 64–70. [Google Scholar]
- Al-Dabbagh, R.K.; Al-Raweshidy, H.S.; Al-Aboody, N.A. Performance comparison of exploiting different millimetre-wave bands in 5G cellular networks. In Proceedings of the 2017 International Conference on Performance Evaluation and Modeling in Wired and Wireless Networks (PEMWN), Paris, France, 28–30 November 2017; pp. 1–6. [Google Scholar] [CrossRef]
- Mallikarjun, S.B.; Schellenberger, C.; Hobelsberger, C.; Schotten, H.D. Performance Analysis of a Private 5G SA Campus Network. Mobile Communication—Technologies and Applications. In Proceedings of the 26th ITG-Symposium, Osnabrueck, Germany, 18–19 May 2022; pp. 1–5. Available online: https://ieeexplore.ieee.org/document/9861872 (accessed on 18 February 2024).
- Cainelli, G.; Donga, M.; Rauchhaupt, L.; Underberg, L. Performance evaluation of a 5G device in a nonpublic network. In Proceedings of the 2021 IEEE 4th 5G World Forum (5GWF), Montreal, QC, Canada, 13–15 October 2021; pp. 334–339. [Google Scholar] [CrossRef]
- Yoshioka, S.; Inoue, Y.; Suyama, S.; Kishiyama, Y.; Okumura, Y.; Kepler, J.; Cudak, M. Field experimental evaluation of beamtracking and latency performance for 5G mm Wave radio access in outdoor mobile environment. In Proceedings of the 2016 IEEE 27th Annual International Symposium on Personal, Indoor, and Mobile Radio Communications (PIMRC), Valencia, Spain, 4–8 September 2016; pp. 1–6. [Google Scholar] [CrossRef]
- Erunkulu, O.O.; Zungeru, A.M.; Lebekwe, C.K.; Mosalaosi, M.; Chuma, J.M. 5G Mobile Communication Applications: A Survey and Comparison of Use Cases. IEEE Access 2021, 9, 97251–97295. [Google Scholar] [CrossRef]
- Perna, G.; Rosmaninho, R.; Sampaio, H.; Rito, P.; Luís, M.; Sargento, S. On the Performance of 5G for Cloud- and Edge-based Emergency Services in Smart Cities. In Proceedings of the 2021 12th International Conference on Network of the Future (NoF), Coimbra, Portugal, 6–8 October 2021; pp. 1–5. [Google Scholar] [CrossRef]
- Chen, H.; Liang, Y. Analysis of 5G Wireless Network Performance Index and Network Performance Optimization. In Proceedings of the 2023 IEEE 11th Joint International Information Technology and Artificial Intelligence Conference (ITAIC), Chongqing, China, 8–10 December 2023; pp. 1232–1235. [Google Scholar] [CrossRef]
- Li, W.; Yan, M.; Chan, C.A.; Wang, C.; Cai, Q. An Area Restriction Scheme Based on TAC Control Policy for 5G Private Network. In Proceedings of the 2023 IEEE 11th International Conference on Computer Science and Network Technology (ICCSNT), Dalian, China, 21–22 October 2023; pp. 85–89. [Google Scholar] [CrossRef]
- Arendt, C.; Böcker, S.; Bektas, C.; Wietfeld, C. Better Safe Than Sorry: Distributed Testbed for Performance Evaluation of Private Networks. In Proceedings of the 2022 IEEE Future Networks World Forum (FNWF), Montreal, QC, Canada, 10–14 October 2022; pp. 190–196. [Google Scholar] [CrossRef]
- Lin, P.; Yu, J.; Zhang, Z. Research and Trials of 5G SA Network Performance. In Proceedings of the 2022 5th International Conference on Information Communication and Signal Processing (ICICSP), Shenzhen, China, 26–28 November 2022; pp. 1–5. [Google Scholar] [CrossRef]
- Shurman, M.; Taqieddin, E.; Oudat, O.; Al-Qurran, R.; Nounou, A.A.A. Performance Enhancement in 5G Cellular Networks Using Priorities in Network Slicing. In Proceedings of the 2019 IEEE Jordan International Joint Conference on Electrical Engineering and Information Technology (JEEIT), Amman, Jordan, 9–11 April 2019; pp. 822–826. [Google Scholar] [CrossRef]
- Mohamed, R.; Zemouri, S.; Verikoukis, C. Performance Evaluation and Comparison between SA and NSA 5G Networks in Indoor Environment. In Proceedings of the 2021 IEEE International Mediterranean Conference on Communications and Networking (MeditCom), Athens, Greece, 7–10 September 2021; pp. 112–116. [Google Scholar] [CrossRef]
- Bhavana, D.; Chaudhari, S. Performance Evaluation of Openairinterface’s Scheduling Algorithms for 5G Networks. In Proceedings of the 2023 4th International Conference for Emerging Technology (INCET), Belgaum, India, 26–28 May 2023; pp. 1–4. [Google Scholar] [CrossRef]
- OpenSignal. The U.S. Rural-Urban Gap Has Narrowed for 5G Speeds but Widened for 5G Availability. OpenSignal. 14 September 2023. Available online: https://www.opensignal.com/2023/09/14/the-us-rural-urban-gap-has-narrowed-for-5g-speeds-but-widened-for-5g-availability (accessed on 18 February 2024).
- Dangi, R.; Lalwani, P.; Choudhary, G.; You, I.; Pau, G. Study and Investigation on 5G Technology: A Systematic Review. Sensors 2023, 22, 26. [Google Scholar] [CrossRef] [PubMed]
- 3GPP Specification for Pareto Distribution. Available online: https://www.3gpp.org/ftp/TSG_RAN/WG1_RL1/TSGR1_06/Docs/Pdfs/r1-99818.pdf (accessed on 3 December 2023).
- Zreikat, A.I. Load balancing call admission control algorithm (CACA) based on soft-handover in 5G Networks. In Proceedings of the 2022 IEEE 12th Annual Computing and Communication Workshop and Conference (CCWC), Las Vegas, NV, USA, 26–29 January 2022; pp. 863–869. [Google Scholar] [CrossRef]
- MOSEL Home Page. 2003. Available online: https://www4.cs.fau.de/Projects/MOSEL/ (accessed on 3 December 2023).
- Zreikat, A.I. Capacity Bounds Analysis of 5G networks in different propagation environments. In Proceedings of the 2023 IEEE 13th Annual Computing and Communication Workshop and Conference (CCWC), Las Vegas, NV, USA, 8–11 March 2023; pp. 988–993. [Google Scholar] [CrossRef]
- Parsons, J.D.; Parsons, P.J. The Mobile Radio Propagation Channel, 2nd ed.; John Wiley & Sons: Hoboken, NJ, USA, 2000; pp. 16–17+75–77+116–118. [Google Scholar]
- Zreikat, A.I.; Alabed, S. Performance Modeling and Analysis of LTE/Wi-Fi Coexistence. Electronics 2022, 11, 1035. [Google Scholar] [CrossRef]
Figure 1.
5G Architecture.

Figure 2.
Data Transmission Workflow.

Figure 3.
Proposed 5G model.

Figure 4.
Proposed CACA.

Figure 5.
Blocking Probability (ε = 0.30).

Figure 6.
Bandwidth Utilization (ε = 0.30).

Figure 7.
Blocking probability (ε = 0.40).

Figure 8.
Bandwidth Utilization (ε = 0.40).

Figure 9.
Blocking Probability (ε = 0.50).

Figure 10.
Bandwidth Utilization (ε = 0.50).

Figure 11.
Blocking Probability-(Urban).

Figure 12.
Bandwidth Utilization-(Urban).

Figure 13.
Blocking Probability-(Suburban).

Figure 14.
Utilization-(Suburban).

Figure 15.
Comparative Performance-Blocking Probability.

Figure 16.
Comparative Performance-Bandwidth Utilization.

Figure 17.
Blocking Probability for urban suburban environments (hm = 10 m, 5 m).

Figure 18.
Bandwidth Utilization for urban suburban environments (hm = 10 m, 5 m).

Figure 19.
Blocking Probability for urban environments (hb = 50 m, 100 m, 150 m).

Figure 20.
Bandwidth Utilization for urban environments (hb = 50 m, 100 m, 150 m).

Figure 21.
Blocking probability for different cell radius and interference values.

Figure 22.
Utilization for different cell radius and interference values.

Figure 23.
Capacity against cell radius under different service factor parameters (S = SF/SNR).

Figure 24.
Maximum distance against capacity for different service factor parameters.

Figure 25.
Maximum distance against capacity for urban-suburban environments.

Table 1.
Symbols used in the capacity bounds analysis.
| Symbol | Description |
|---|---|
| PLE | The path loss model for Environment E (1 for urban, 2 for suburban) |
| f | The frequency in MHz |
| hb | The height of the base station or transmitter in meters |
| hm | The height of the mobile or receiver in meters |
| d | The distance between transmitter and receiver in kilometers, km |
| a(hm) | The correction factor for the mobile antenna. |
| PS | The transmitted power |
| PR | The received power at Node B. |
| CFE | The correction factor for each environment E |
| mmWave | Millimeter waves |
| KE (hm, hb, f) | The function of hm, the height of the mobile and hb, the height of the base station, and the frequency, f. |
| IoT | Internet-of-things |
| NR 5G | 5G new radio |
| 3GPP | Third Generation Partnership Project |
| MIMO | Multiple input multiple output |
| gNBs | gNodeB |
| AN | Access Network Layer |
| AMF | Access and Mobility Management Function |
| OAI | Open Air Interface |
| AUSF | Authentication Server Function |
| SMF | Session Management Function |
| URLLC | Ultra-reliable low-latency communication |
| UPF | User Plane Function |
| TN layer | Transport network layer |
| TAC | Tracking Area Code |
| SLAs | Service Level Agreements |
| 5G SA | 5G standalone |
| mMTC | Massive machine-type communication |
Disclaimer/Publisher’s Note: The statements, opinions and data contained in all publications are solely those of the individual author(s) and contributor(s) and not of MDPI and/or the editor(s). MDPI and/or the editor(s) disclaim responsibility for any injury to people or property resulting from any ideas, methods, instructions or products referred to in the content. |
© 2024 by the authors. Licensee MDPI, Basel, Switzerland. This article is an open access article distributed under the terms and conditions of the Creative Commons Attribution (CC BY) license (https://creativecommons.org/licenses/by/4.0/).
Share and Cite
MDPI and ACS Style
Zreikat, A.I.; Mathew, S. Performance Evaluation and Analysis of Urban-Suburban 5G Cellular Networks. Computers 2024, 13, 108. https://doi.org/10.3390/computers13040108
AMA Style
Zreikat AI, Mathew S. Performance Evaluation and Analysis of Urban-Suburban 5G Cellular Networks. Computers. 2024; 13(4):108. https://doi.org/10.3390/computers13040108
Chicago/Turabian StyleZreikat, Aymen I., and Shinu Mathew. 2024. "Performance Evaluation and Analysis of Urban-Suburban 5G Cellular Networks" Computers 13, no. 4: 108. https://doi.org/10.3390/computers13040108
Note that from the first issue of 2016, this journal uses article numbers instead of page numbers. See further details here.