

Hop-by-Hop Worm Propagation with Carryover Epidemic Model in Mobile Sensor Networks
Department of Information Security, Seoul Women’s University, 621 Hwarangro, Nowon-Gu, Seoul 139-774, Korea
Computers 2015, 4(4), 283-292; https://doi.org/10.3390/computers4040283
Submission received: 15 June 2015
/
Revised: 14 September 2015
/
Accepted: 15 October 2015
/
Published: 20 October 2015
Abstract
:In the internet, a worm is usually propagated in a random multi-hop contact manner. However, the attacker will not likely select this random multi-hop propagation approach in a mobile sensor network. This is because multi-hop worm route paths to random vulnerable targets can be often breached due to node mobility, leading to failure of fast worm spread under this strategy. Therefore, an appropriate propagation strategy is needed for mobile sensor worms. To meet this need, we discuss a hop-by-hop worm propagation model in mobile sensor networks. In a hop-by-hop worm propagation model, benign nodes are infected by worm in neighbor-to-neighbor spread manner. Since worm infection occurs in hop-by-hop contact, it is not substantially affected by a route breach incurred by node mobility. We also propose the carryover epidemic model to deal with the worm infection quota deficiency that might occur when employing an epidemic model in a mobile sensor network. We analyze worm infection capability under the carryover epidemic model. Moreover, we simulate hop-by-hop worm propagation with carryover epidemic model by using an ns-2 simulator. The simulation results demonstrate that infection quota carryovers are seldom observed where a node’s maximum speed is no less than 20 m/s.
1. Introduction
Worm attacks against sensor motes are realistic in sensor networks, as demonstrated by [1,2] In particular, they show that a worm could be propagated by exploiting code injection vulnerabilities in target sensor motes. Wide-spread worm dissemination makes it possible for an attacker to rapidly gain control over the network.
To defend against a worm, it is very important to understand how a worm is propagated. In the sense that epidemic model [3] is good at modeling the spread of epidemic disease, researchers adapted it to worm propagation modeling in the internet and static sensor network [4,5,6,7]. However, these previous works do not consider node mobility which can greatly affect the worm infection capability and thus they are not appropriate for worm propagation in a mobile sensor network.
To mitigate this problem, we discuss a hop-by-hop worm propagation strategy in a mobile sensor network. In this strategy, worm infection is incurred only by neighbor-to-neighbor contact and thus node mobility will have little effect on worm propagation. Furthermore, we propose a carryover epidemic model in which the infection quota deficit in the current time slot is carried over to the next time slot. This model is adequate for the scenario where infection quota deficit occurs due to the frequent change of network topology and hence it is effective in the modeling of mobile sensor worm propagation. We analyze the cumulative number of infected nodes in the carryover epidemic model and derive Chernoff bounds on the number of time slots required for the whole network infection. Furthermore, we use an ns-2 simulator to evaluate the hop-by-hop worm propagation with carryover epidemic mode. The simulation results show that a worm infection quota deficit rarely occurs under the situation where a node’s maximum speed is at least 20 m/s and thus worm infection is not delayed but completed in time. This indicates that node mobility makes it possible for a mobile node to have enough neighbors, leading to expedition of worm infection.
The rest of paper is organized as follows. In Section 2, we describe the related work. In Section 4, we describe hop-by-hop worm propagation strategy and the carryover epidemic model in a mobile sensor network. In Section 5, we analyze the hop-by-hop worm propagation with carryover epidemic model. In Section 6, we simulate hop-by-hop worm propagation with carryover epidemic model in mobile sensor network and present the simulation results. In Section 7, we conclude the paper.
2. Related Work
In this section, we first introduce the related work of sensor worm modeling and then bring up the worm modeling work in the literature of mobile networks.
In the context of sensor networks, several researchers [4,5,6,8] proposed worm propagation modeling in static sensor networks. More specifically, De et al. [4] modeled sensor worm propagation by using node deployment knowledge. De’s work investigated how group deployment strategy affects the worm propagation in a sensor network. Khayam et al. [6] applied the signal processing technique to model sensor worm propagation. Khayam et al. explored the sensor worm propagation in terms of signal processing. Guo et al. [8] explored how to control worm propagation using the spatial correlation parameters. Feng et al. [5] examined the flux of worm dissemination using differential dynamical theory.
In the literature of mobile ad hoc networks, Mickens et al. [9,10] investigated queue-based propagation of malicious software under random waypoint model in mobile ad hoc networks. Valler et al. [11] compute a general epidemic threshold in the SIS (Susceptible-Infectious-Susceptible) model and demonstrate that the epidemic threshold is not influenced by mobile node’s speed. Moreover, there are related works that apply the concept of epidemic mobility to broadcasting or ad hoc routing. Specifically, Karlsson et al. [12] proposed broadcasting system that utilizes delay-tolerant data forwarding together with node mobility. In [13], the author proposed the combined version of AODV and DTN-based routing to take the benefits of both routing protocols.
3. Assumptions
For worm propagation modeling, we assume mobile sensor networks in which sensor nodes wander throughout the network in a pre-determined or random manner. This assumption is essential to explore how a worm is propagated over mobile sensor networks. Furthermore, we assume that both worm infection strategy and number are considered for accurate worm propagation modeling. This assumption is reasonable in the sense that it is imperative to explore how many benign nodes are infected through what kind of worm propagation tactics. To meet this assumption, we introduce a hop-by-hop worm infection with carryover epidemic model strategy that is well-suited for mobile sensor networks in the next section.
4. Hop-By-Hop Worm Propagation in Mobile Sensor Networks
In this section, we describe a hop-by-hop worm propagation with carryover epidemic model in a mobile sensor network. Note that this model is also used as an assumption for worm detection in our previous work [16].
Many researchers have adopted an epidemic model [3] in order to model the infection quota, which is defined as the number of nodes that a worm infects per time slot in a network. This is because the epidemic model is useful at the quantification of infection quota in a series of time slots. The infection quota in the discrete time version of a simple epidemic model [3] is calculated in units of time slots by the following equation:
where θ is a pairwise infection rate [3] and N is the total number of nodes in the mobile sensor network. indicates the number of worm originators. We define as the cumulative infection quota from the 0th time slot to the kth time slot. As a consequence, the infection quota in the kth time slot is set to .
Since the epidemic model only deals with the infection quota, there should be a model to describe how worm is spread through the mobile sensor network. To meet this need, we consider a a hop-by-hop worm dissemination strategy in mobile sensor network. Under this strategy, we assume that a sensor has susceptible or infectious state. All sensor nodes are initially set to the susceptible state except infectious worm originators. Each infectious node spreads worm to its one-hop neighboring susceptible nodes. Once a susceptible node is infected by a worm, it changes its state to infectious.
Although the epidemic model is good at modeling the infection quota, it may not be useful in the scenario in which infectious nodes in a time slot could have fewer neighboring susceptible nodes than the infection quota due to the network topology. To pacify this problem, we slightly change the discrete time version of simple epidemic model in such a way that we carry over the infection quota deficit in the current time slot to the next time slot, charging the total infection quota over the entire time period. More specifically, we denote the infection quota deficit in the kth time slot. The infection quota in the first time slot is calculated as and the infection quota in the kth time slot is accordingly computed as (). We call this modified version of epidemic model the carryover epidemic model. In the next section, we provide a quantitative analysis of the carryover epidemic model.
5. Analysis
In this section, we first present an analysis on the carryover epidemic model and then describe the analytical results on the number of time slots required for the entire network infection.
In the following Lemma, we first derive the cumulative number of infected nodes when the carryover epidemic model is used.
Lemma 1. In carryover epidemic model, the cumulative number of infected nodes from the 0th time slot to the τth time slot is .
Proof. Recall that is the infection quota in the th time slot () in carryover epidemic model, where is the infection quota in the first time slot and is the infection quota deficit in the tth time slot. The number of infected nodes in a time slot is the difference between the infection quota and the quota deficit in a time slot. Hence, the cumulative number of infected nodes from the 0th time slot to the τth time slot is given by:
☐
If the entire network infection is completed in the τth time slot, will be zero. Accordingly, by the Lemma 1, will be equal to the total number of nodes in the network.
Next, we compute the average number of time slots required for the entire network infection. To do this, we employ discrete Poisson distribution to model the number of time slots required to infect the entire network. This is reasonable in the sense that discrete Poisson distribution is generally useful for random data counting and thus can be applied to randomly count the number of time slots required for the entire network infection. Specifically, we define a discrete Poisson random variable X with parameter μ. X indicates a time slot in which the entire network infection is finished. Putting it in differently, X times slots are needed to infect all nodes in the network.
We define as the probability that the entire network infection is completed in the jth time slot. Accordingly, is the average number of time slots required for the entire network infection.
By the definition of discrete Poisson distribution, is given by:
and .
Then the probability that the entire network infection is completed at most the τth time slot is calculated as . Thus, 1- is the probability that more than τ time slots are consumed to infect all nodes in the network.
Finally, we derive the Chernoff bounds on the number of time slots required for the entire network infection.
Lemma 2. If and , then
.
Proof. For any , the Markov’s inequality is given by:
Since is the moment generating function of the Poisson discrete random variable X, we have
Given that and , by selecting , we have
☐
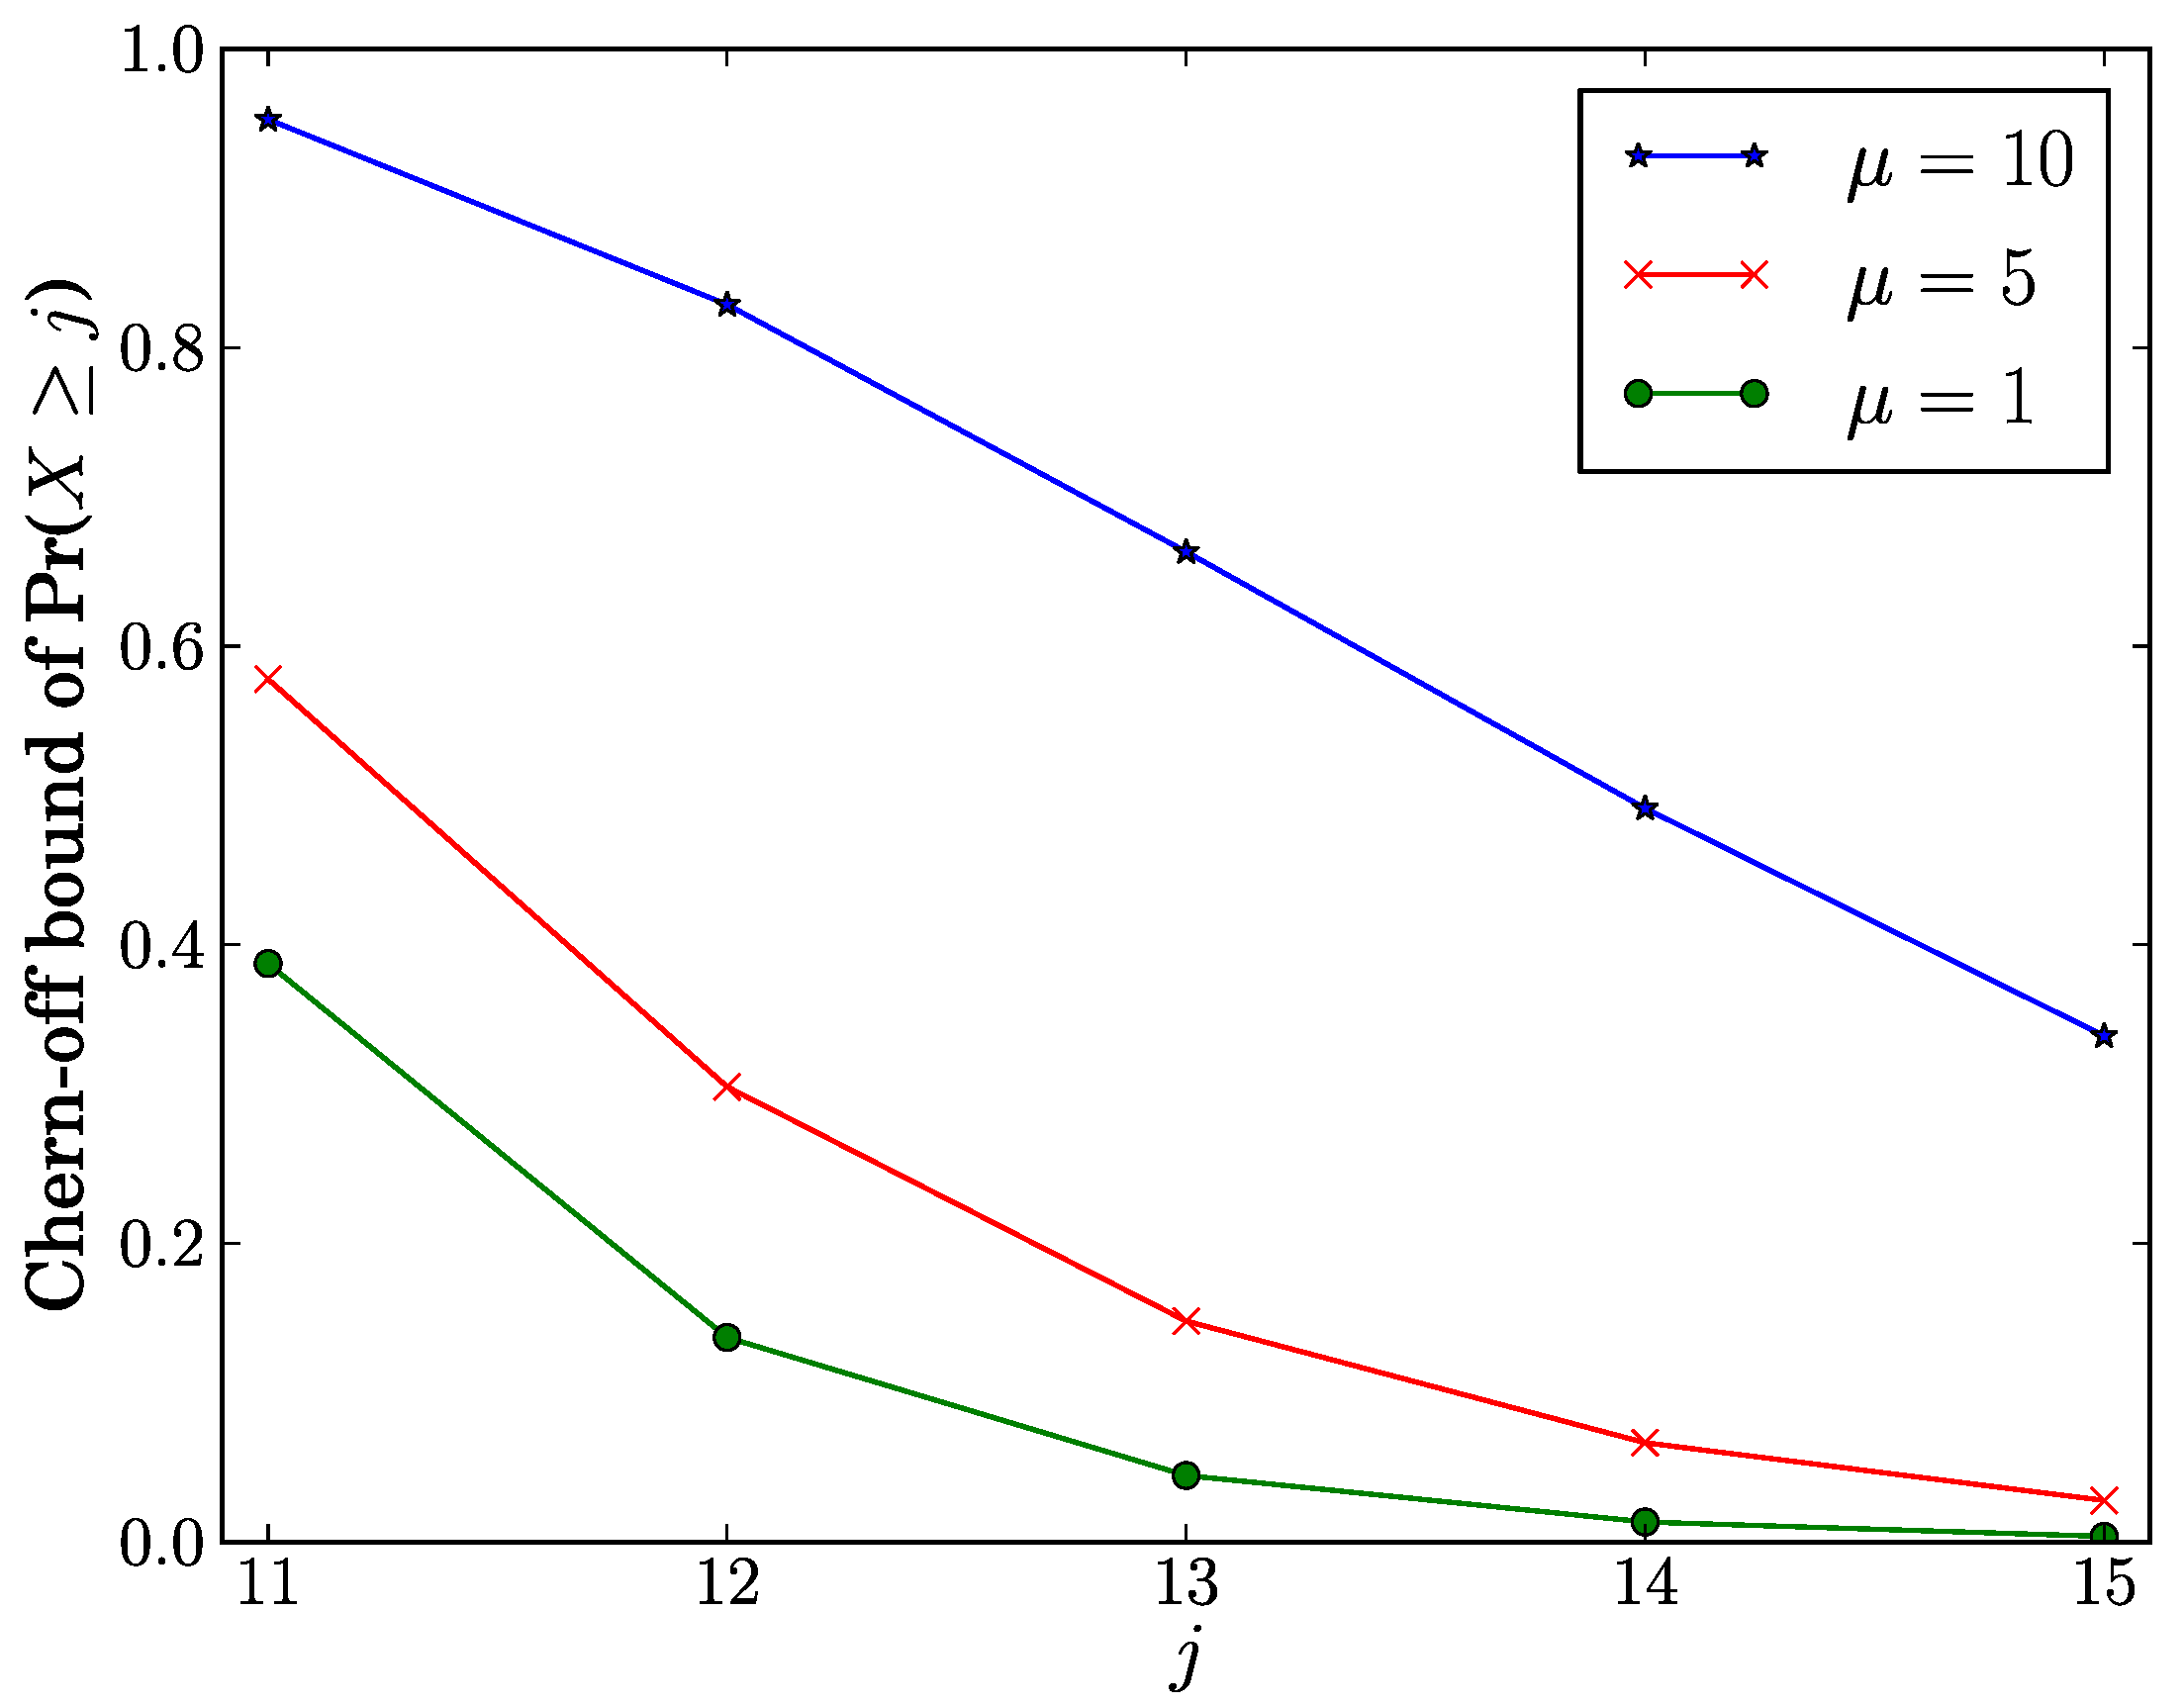
We investigate how j affects the Chernoff bound of Pr() when . As shown in Figure 1, the Chernoff bound of Pr() decreases as j increases. From this observation, as j is away from τ, it decays the Chernoff bound on the probability that the number of time slots required for the entire network infection is at least j. Given a fixed value of j, the Chernoff bound of Pr() increases as μ increases. This means that the Chernoff bound of Pr() rises as an average number of slots required for the entire network infection is close to τ.
Figure 1.
Chernoff bound of Pr() vs. j.

Lemma 3. If and , then
.
Proof. For any , the Markov’s inequality is given by:
Since is the moment generating function of the Poisson discrete random variable X, we have
Given that and , by selecting , we have
☐
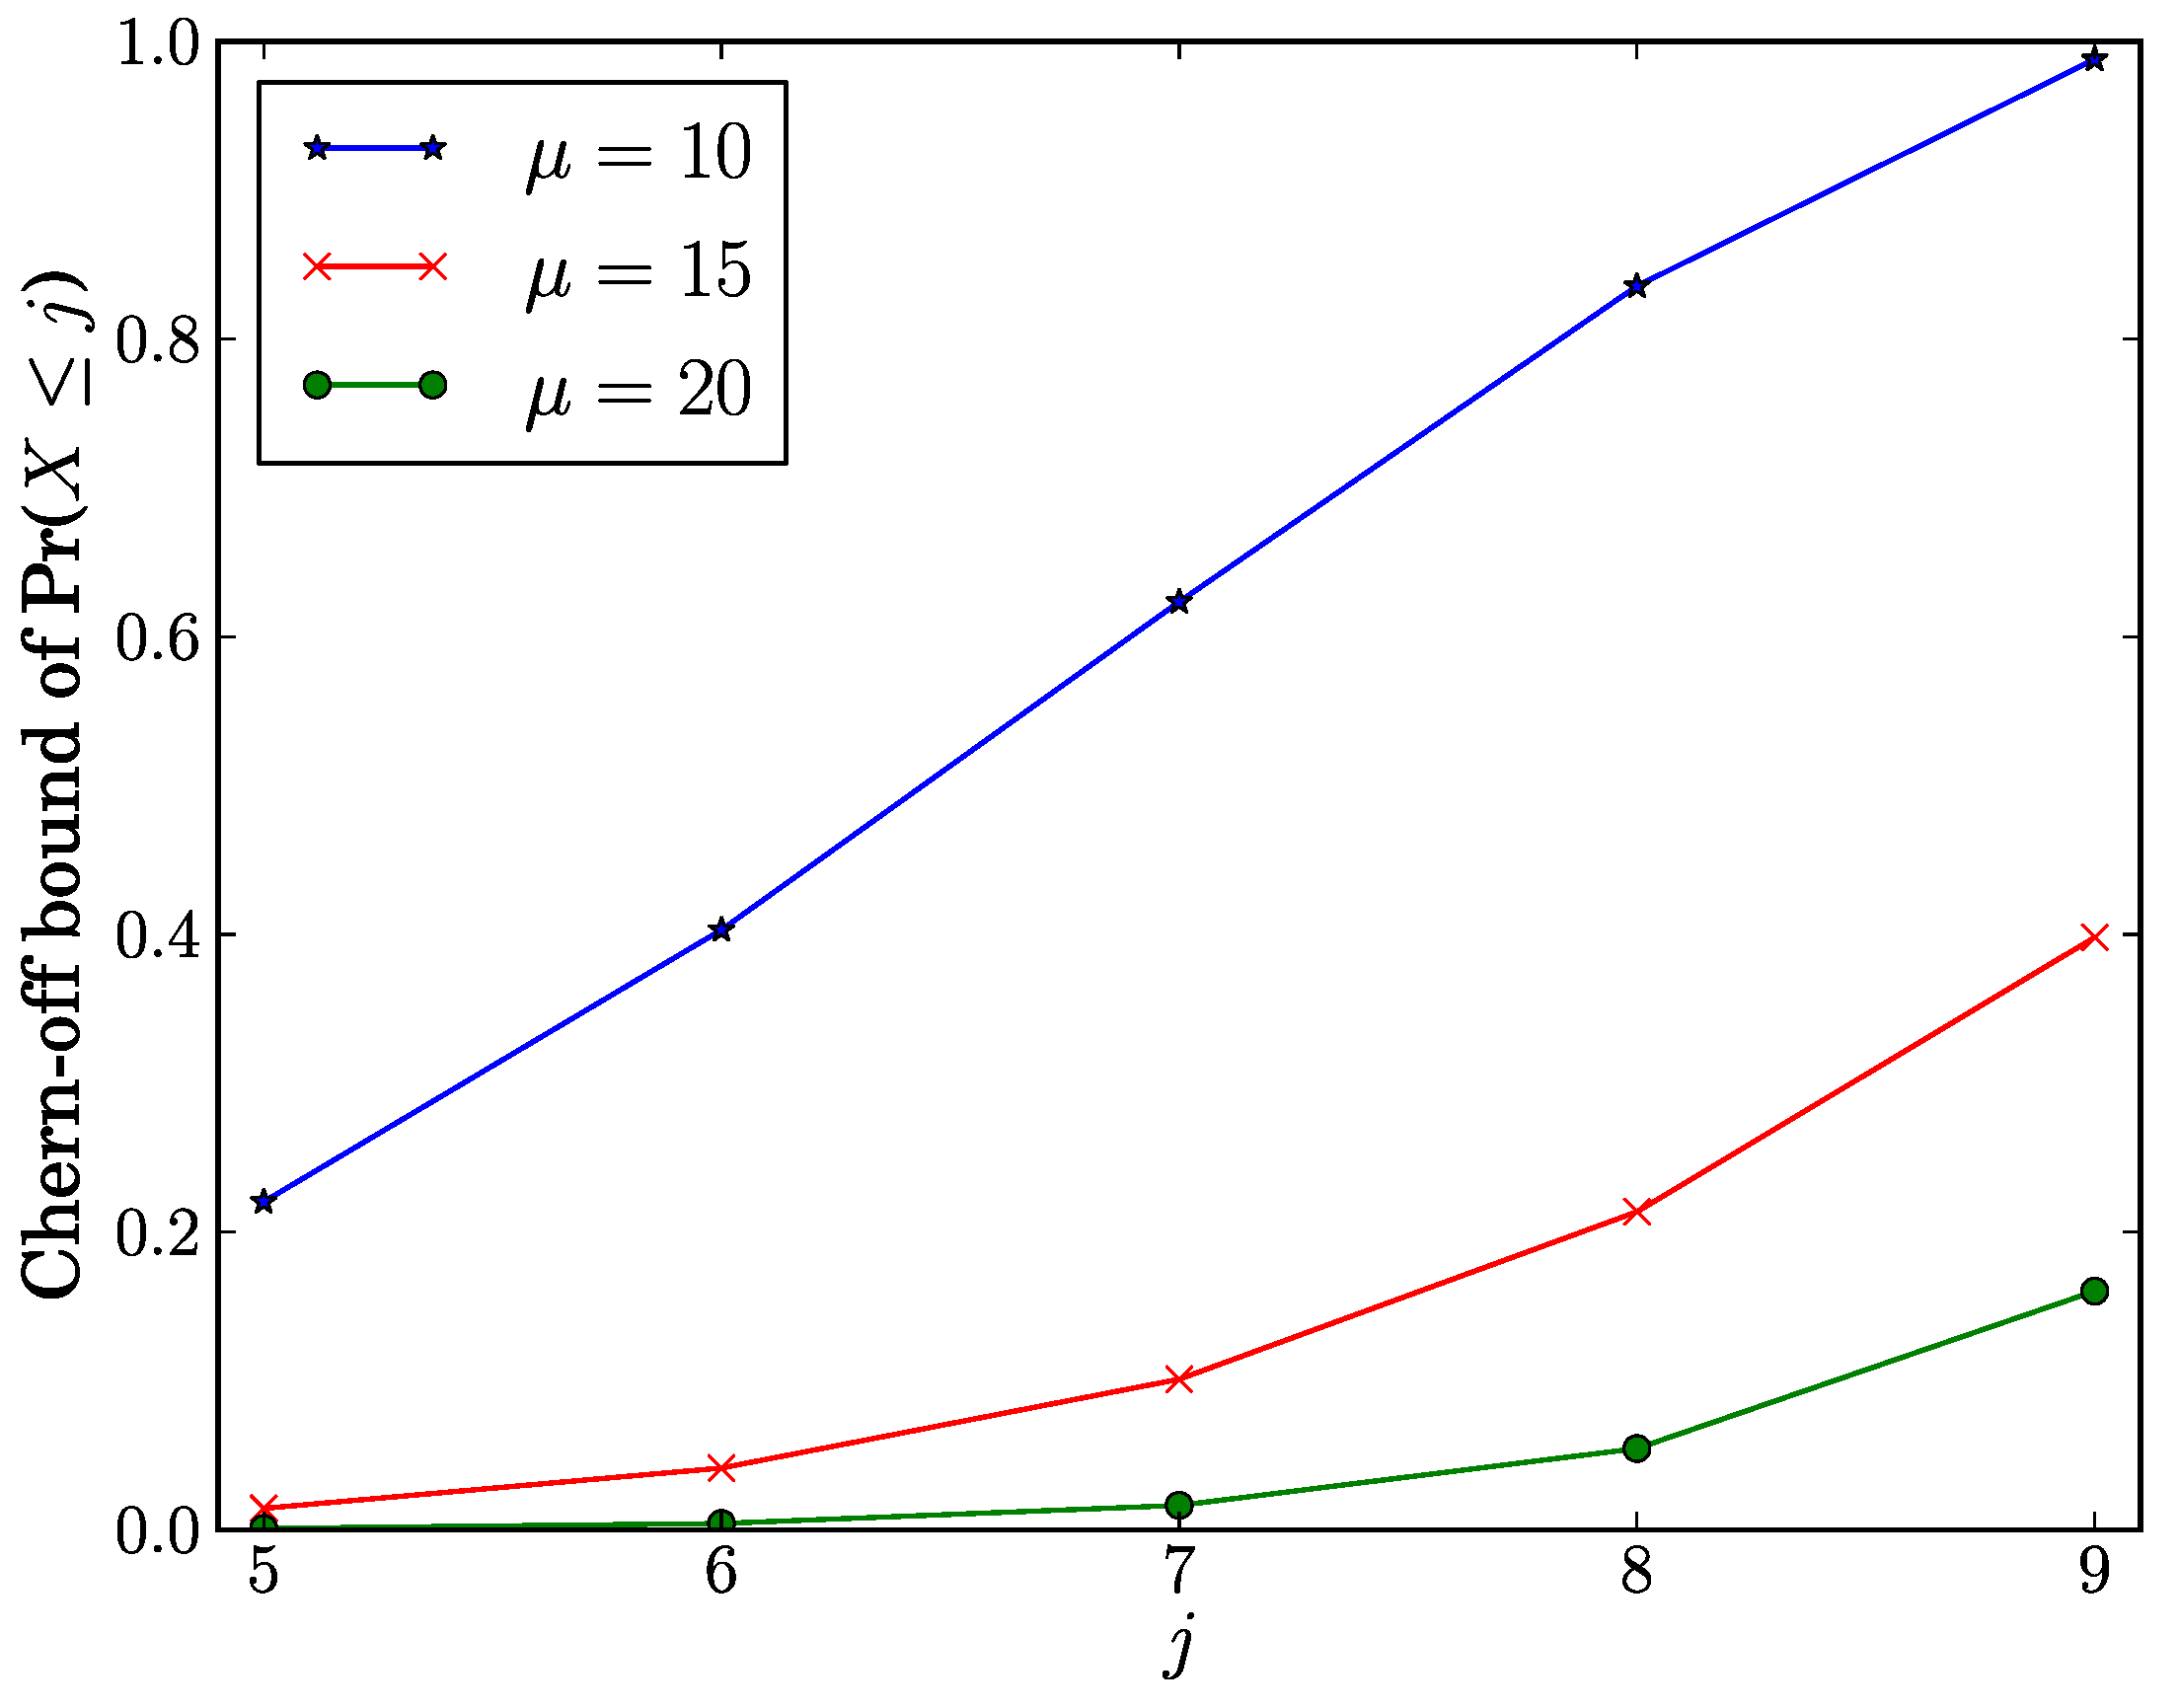
We investigate how j affects the Chernoff bound of Pr() when . As shown in Figure 2, the Chernoff bound of Pr() increases as j increases. From this observation, as j is close to τ, it rises the Chernoff bound on the probability that the number of time slots required for the entire network infection is at most j. Given a fixed value of j, the Chernoff bound of Pr() increases as μ decreases. This means that the Chernoff bound of Pr() rises as an average number of slots required for the entire network infection is close to τ.
Figure 2.
Chernoff bound of Pr() vs.j.

6. Simulation Study
In this section, we first describe the simulation setup and then present simulation results.
6.1. Simulation Configurations
We use the ns-2 network simulator to evaluate the hop-by-hop worm propagation strategy in a mobile sensor network. In our simulation, 100 mobile sensor nodes are placed within a square area of 500 m × 500 m. Furthermore, In order to configure node movement patterns, we use the Random Waypoint Mobility (RWM) model with the steady-state distribution provided by the Random Trip Mobility (RTM) model [17]. In particular, we generate a steady-state version of RWM model by using the program codes of [18].
We divide the entire time domain into 25 time slots and one time slot is 20 simulation seconds. Accordingly, all simulations are performed for 500 simulation seconds. We fix a pause time of 10 simulation seconds and a minimum moving speed of 1 m/s of each node. Each node uses IEEE 802.11 as the medium access control protocol in which the transmission range is 50 m. To investigate how node mobility affects hop-by-hop worm propagation strategy with the carryover epidemic model, we vary each node’s maximum speed () in the range of 20, 40, 80 m/s. In the discrete time version of carryover epidemic model, we configure the pairwise infection rate 0.005, 0.01.
Moreover, we assume that a susceptible node is infected by a single worm packet whose size is 46 bytes. This is reasonable because a single worm packet infection indicates the best case for the attacker and a data packet consists of 11 byte header, 28 byte data, and 7 byte meta information in Tiny OS 2.x.
6.2. Simulation Results
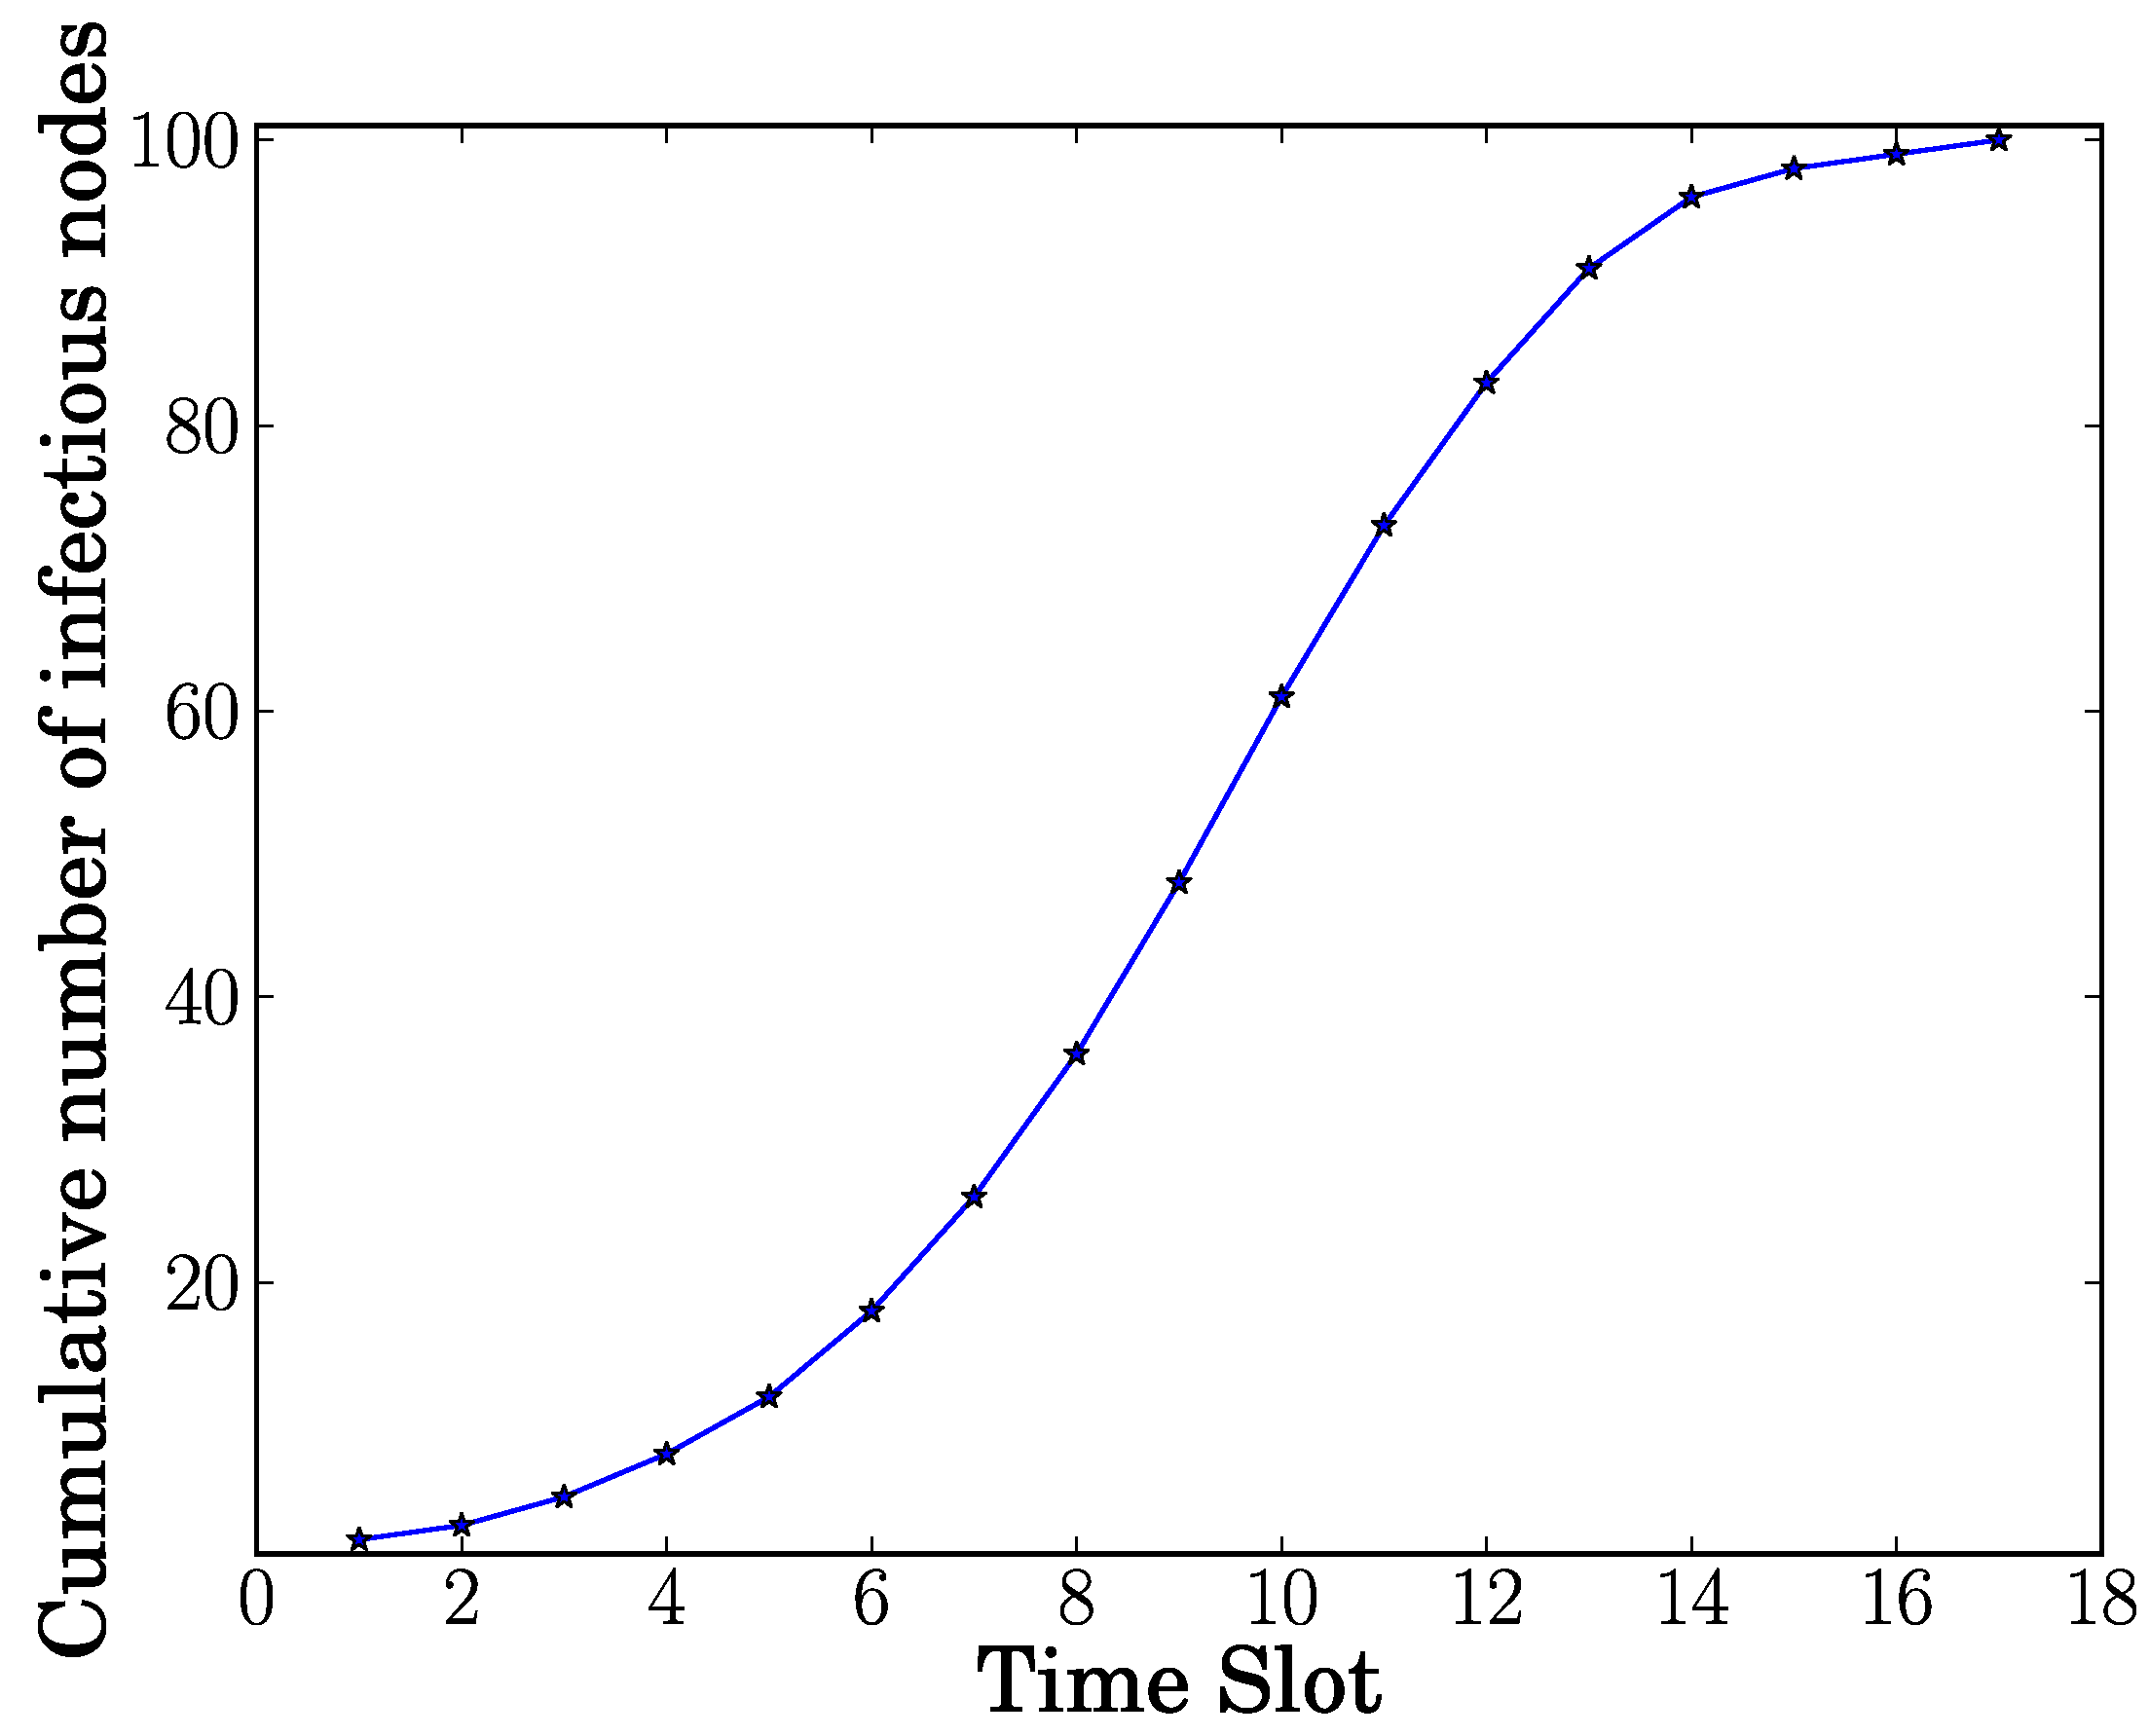
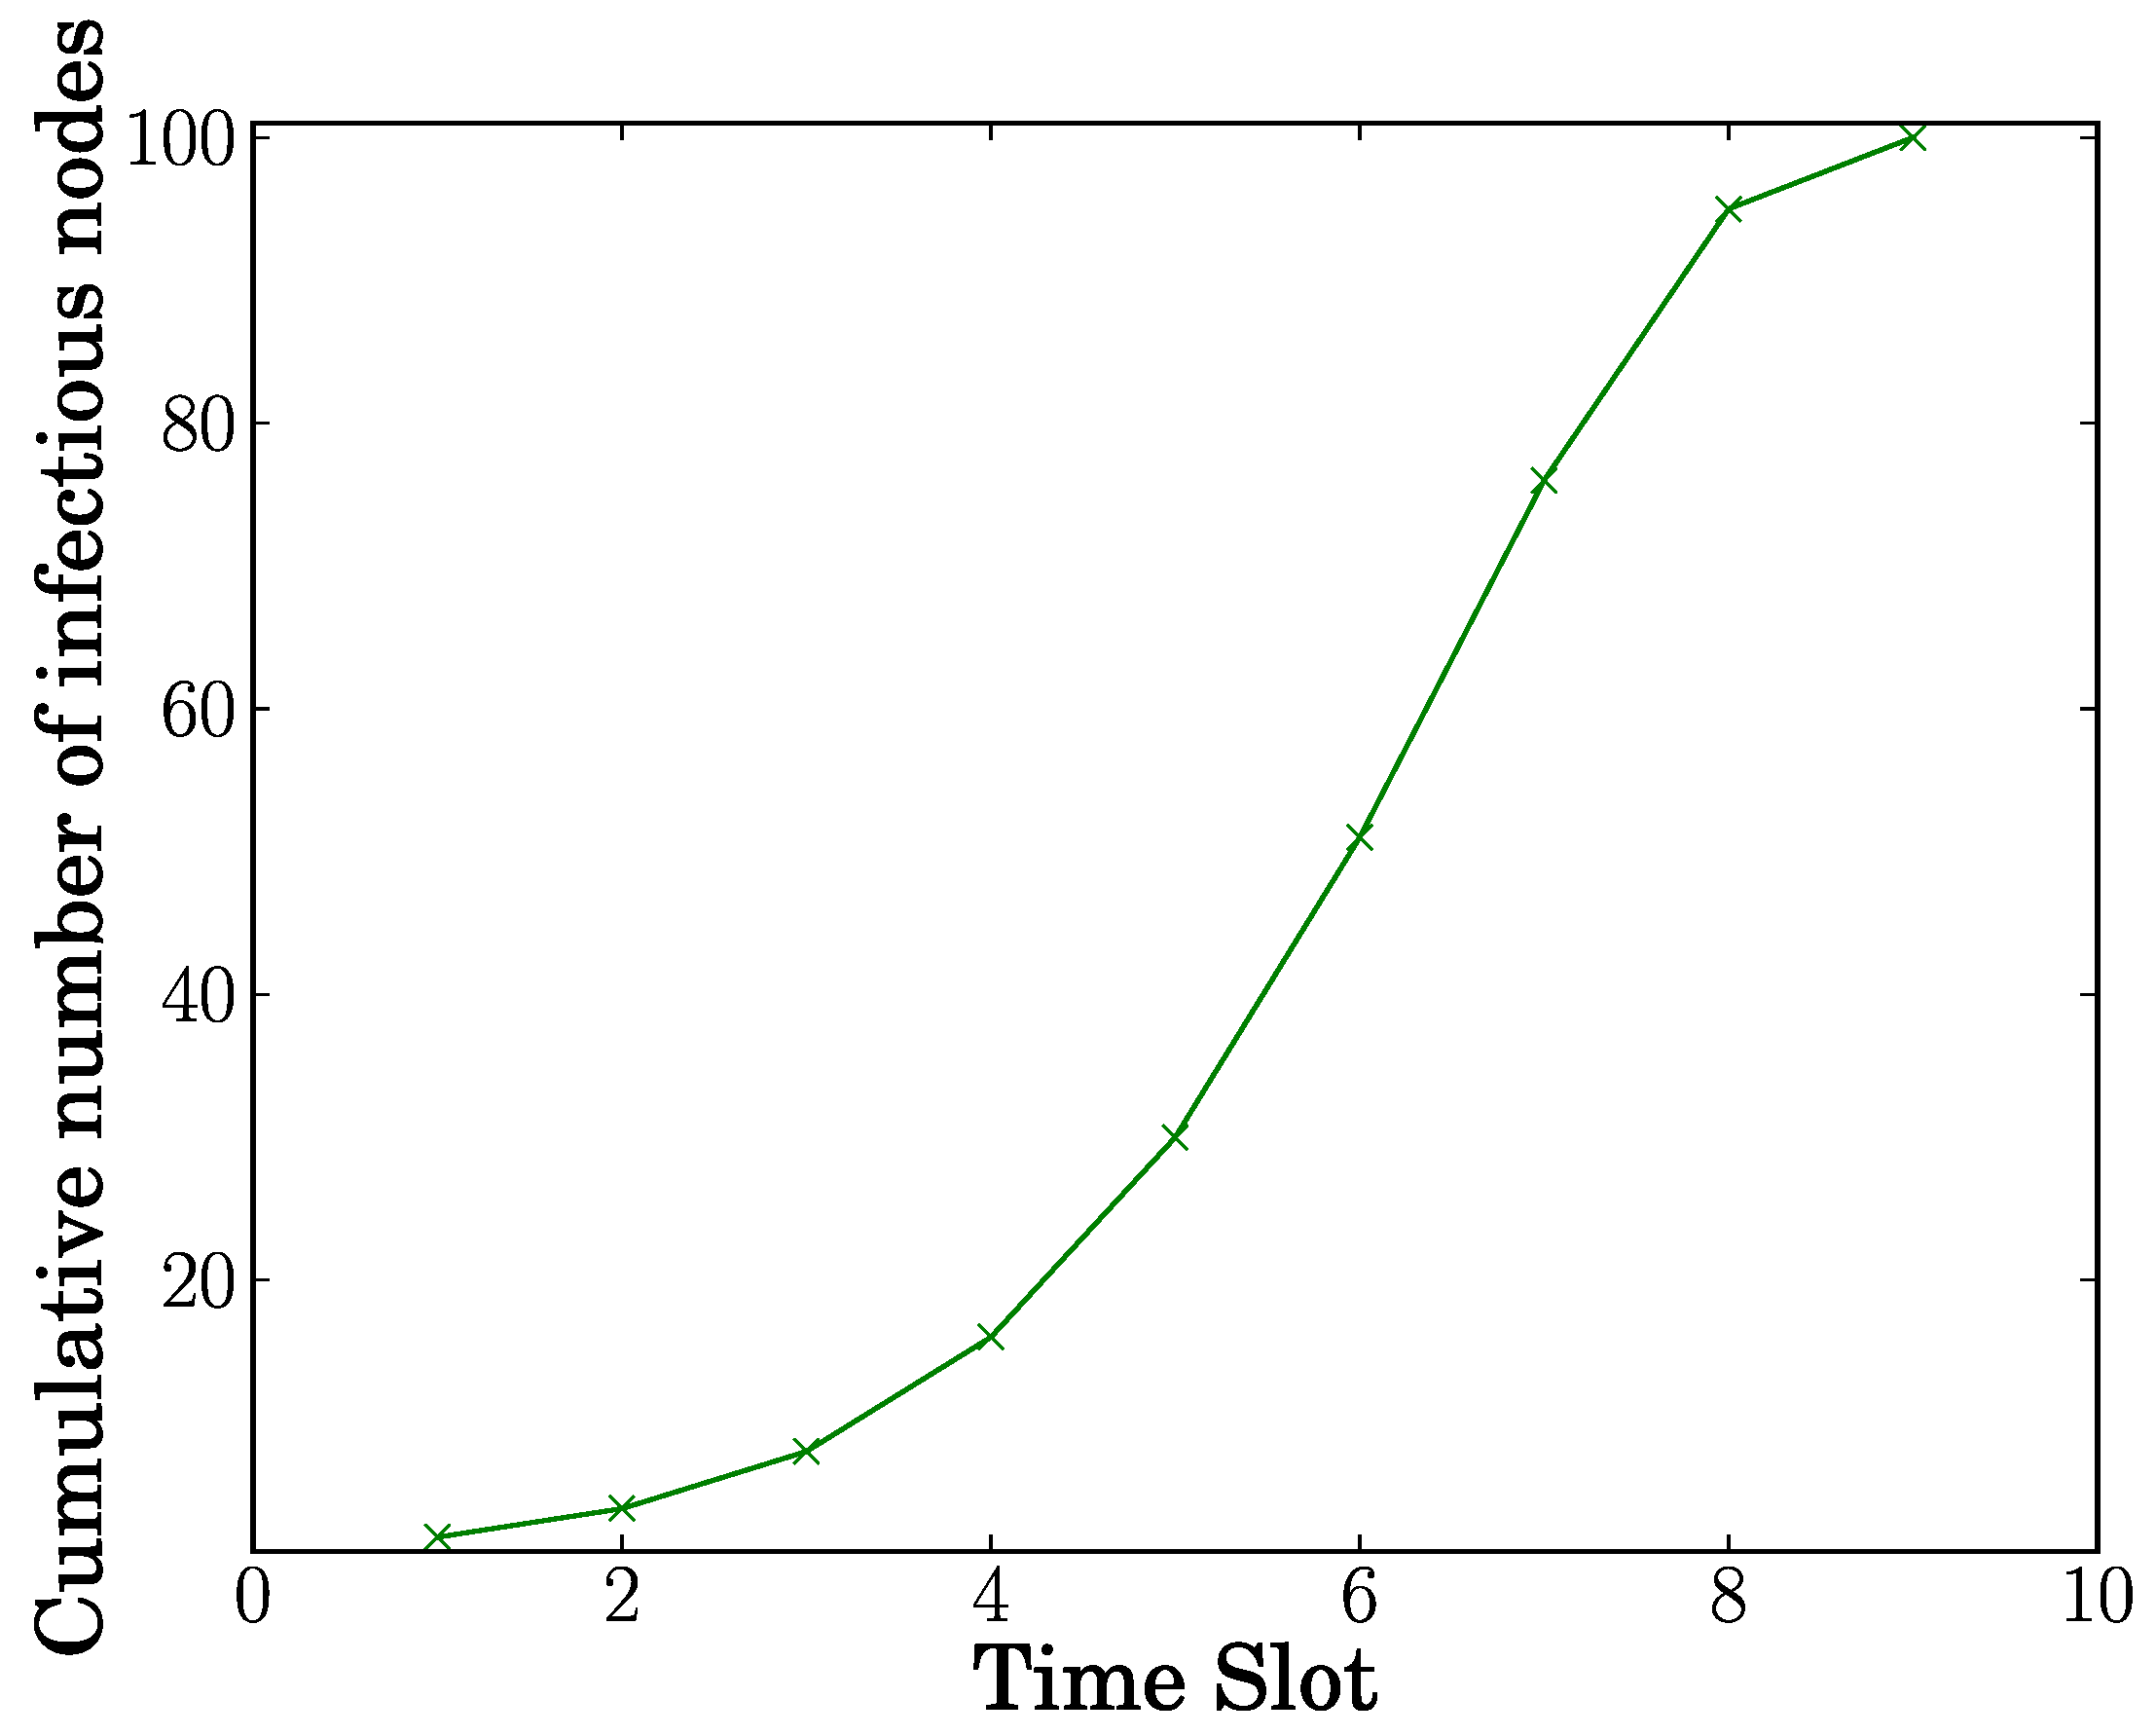
We present the average of the results of 50 executions under the aforementioned simulation configurations. When = 20 m/s, the cumulative number of infectious nodes up to the first time slot () is 1.980 in both and . Except the case of with = 20 m/s, the cumulative number of infectious nodes exactly matches with the cumulative infection quota of the discrete epidemic model under all other cases. This indicates that the infection quota carryover does rarely occur where a mobile node’s maximum speed is at least 20 m/s. We infer from this observation that node mobility makes each node have sufficient neighbors, leading to infrequent incurrence of infection quota carryover. Moreover, as shown in Figure 3 and Figure 4, the infection quota is fulfilled in the 17th and 9th time slot when and , respectively. This means that the infection quota at the higher infection rate is achieved at the earlier time.
Figure 3.
Cumulative number of infectious nodes when the pairwise infection rate θ is 0.005.

Figure 4.
Cumulative number of infectious nodes when the pairwise infection rate θ is 0.01.

7. Conclusions
In this paper, we propose hop-by-hop worm propagation strategy with carryover epidemic model in mobile sensor networks and evaluate it by using an ns-2 simulator. In simulation, we rarely observe infection quota carryover where a node’s maximum speed is no less than 20 m/s. In addition, the infection quota is quickly achieved in the ninth time slot under high infection rate of 0.01. Furthermore, we derive the Chernoff bounds on the number of time slots for the entire network infection of the proposed model.
Acknowledgments
This work was supported by a research grant from Seoul Women’s University (2014).
Conflicts of Interest
The author declares no conflict of interest.
References
- Francillon, A.; Castelluccia, C. Code Injection Attacks on Harvard-Architecture Devices. In Proceedings of the 15th ACM conference on Computer and Communications Security (CCS’08), Alexandria, VA, USA, 27–31 October 2008.
- Gu, Q.; Noorani, R. Towards self-propagating mal-packets in sensor networks. In Proceedings of the First ACM Conference on Wireless Network Security (WiSec’08), Alexandria, VA, USA, 31 March–2 April 2008.
- Daley, D.J.; Gani, J. Epidemic Modeling: An Introduction; Cambridge University Press: Cambridge, UK, 1999. [Google Scholar]
- De, P.; Liu, Y.; Das, S.K. Deployment-Aware Modeling of Node Compromise Spread in Wireless Sensor Networks Using Epidemic Theory. ACM Trans. Sens. Netw. 2009, 5. [Google Scholar] [CrossRef]
- Feng, L.; Song, L.; Zhao, Q.; Wang, H. Modeling and Stability Analysis of Worm Propagation in Wireless Sensor Network. Math. Probl. Eng. 2015, 2015. [Google Scholar] [CrossRef]
- Khayam, S.A.; Radha, H. Using signal processing techniques to model worm propagation over wireless sensor networks. IEEE Signal Process. Mag. 2006, 23, 164–169. [Google Scholar] [CrossRef]
- Zou, C.; Gong, W.; Towsley, D. Code red worm propagation modeling and analysis. In Proceedings of the 9th ACM Conference on Computer and Communications Security (CCS’02), Washington, DC, USA, 18–22 November 2002.
- Guo, W.; Zhai, L.; Guo, L.; Shi, J. Worm Propagation Control Based on Spatial Correlation in Wireless Sensor Network. In Web Technologies and Applications; Springer: Berlin/Heidelberg, Germany, 2012. [Google Scholar]
- Mickens, J.W.; Noble, B.D. Modeling Epidemic Spreading in Mobile Environments. In Proceedings of the 4th ACM Workshop on Wireless Security (WiSe’05), Cologne, Germany, 2 September 2005.
- Mickens, J.W.; Noble, B.D. Analytical models for epidemics in mobile networks. In Proceedings of the Third IEEE International Conference on Wireless and Mobile Computing, Networking and Communications (WiMOB 2007), White Plains, NY, USA, 8–10 October 2007.
- Valler, N.C.; Prakash, B.A.; Tong, H.; Faloutsos, M.; Faloutsos, C. Epidemic Spread in Mobile Ad Hoc Networks Determining the Tripping Point. In Proceedings of the 10th International IFIP TC 6 Conference on Networking (NETWORKING’11), Valencia, Spain, 9–13 May 2011.
- Karlsson, G.; Lenders, V.; May, M. Delay-Tolerant Broadcasting. IEEE Trans. Broadcast. 2007, 53. [Google Scholar] [CrossRef]
- Ott, J.; Kutscher, D.; Dwertmann, C. Integrating DTN and MANET Routing. In Proceedings of the 2006 SIGCOMM Workshop on Challenged Networks (CHANTS’06), Pisa, Italy, 11–15 September 2006.
- Chen, Z.; Wang, M.; Xu, L.; Wu, W. Worm propagation model in mobile network. In Wiley Concurrency and Computation: Practice and Experience; Wiley: New York, NY, USA, 2015. [Google Scholar]
- Yan, G.; Flores, H.D.; Cuellar, L.; Hengartner, N.; Eidenbenz, S.; Vu, V. Bluetooth Worm Propagation: Mobility Pattern Matters. In Proceedings of the 2nd ACM Symposium on Information, Computer and Communications Security (ASIACCS’07), Singapore, 20–22 March 2007.
- Ho, J. Distributed Software-Attestation Defense Against Sensor Worm Propagation. J. Sens. 2015, 2015. [Google Scholar] [CrossRef]
- Boudec, J.Y.L.; Vojnović, M. Perfect simulation and stationary of a class of moblity models. In Proceedings of the 24th Annual Joint Conference of the IEEE Computer and Communications Societies (IEEE INFOCOM 2005), Miami, FL, USA, 13–17 March 2005; pp. 2743–2754.
- PalChaudhuri, S.; Boudec, J.Y.L.; Vojnović, M. Perfect simulations for random trip mobility models. In Proceedings of the 38th Annual Simulation Symposium, San Diego, CA, USA, 4–6 April 2005.
© 2015 by the authors; licensee MDPI, Basel, Switzerland. This article is an open access article distributed under the terms and conditions of the Creative Commons Attribution license (http://creativecommons.org/licenses/by/4.0/).
Share and Cite
MDPI and ACS Style
Ho, J.-W. Hop-by-Hop Worm Propagation with Carryover Epidemic Model in Mobile Sensor Networks. Computers 2015, 4, 283-292. https://doi.org/10.3390/computers4040283
AMA Style
Ho J-W. Hop-by-Hop Worm Propagation with Carryover Epidemic Model in Mobile Sensor Networks. Computers. 2015; 4(4):283-292. https://doi.org/10.3390/computers4040283
Chicago/Turabian StyleHo, Jun-Won. 2015. "Hop-by-Hop Worm Propagation with Carryover Epidemic Model in Mobile Sensor Networks" Computers 4, no. 4: 283-292. https://doi.org/10.3390/computers4040283